Article

Effects of O2 Addition on the Discharge Parameters and Production of Reactive Species of a Transferred Atmospheric Pressure Plasma Jet

Faculty of Engineering in Guaratinguetá, São Paulo State University-UNESP, Guaratinguetá 12516-410, Brazil
*
Author to whom correspondence should be addressed.
Appl. Sci. 2021, 11(14), 6311; https://doi.org/10.3390/app11146311
Submission received: 14 June 2021 / Revised: 2 July 2021 / Accepted: 2 July 2021 / Published: 8 July 2021
(This article belongs to the Special Issue Frontiers in Atmospheric Pressure Plasma Technology)

Abstract

:
The therapeutic effects of atmospheric pressure plasma jets (APPJs) have been associated with the presence of reactive species, mainly the reactive oxygen and nitrogen ones, generated in this kind of plasmas. Due to that, many studies attempting to enhance the production of reactive species in APPJs have been performed. The employment of gas admixtures, usually mixing a noble gas with oxygen ( O 2 ) or water vapor, is one of the most common methods to achieve such goal. This work presents a study of how the addition of small amounts of O 2 affects the electrical parameters and the production of reactive species in a transferred APPJ produced at the tip of a long and flexible plastic tube. The study was carried out employing helium (He) as the working gas and applying a high voltage (HV) in the form of amplitude-modulated sine waveform (burst mode). With this configuration it was possible to verify that the O 2 addition reduces the discharge power and effective current, as a result of late ignition and shorter discharge duration. It was also found that the addition of O 2 to a certain content in the gas admixture makes the light emission from oxygen atoms increase, indicating an increment in oxygen related reactive species in the plasma jet. However, at the same time the light emitted from hydroxyl (OH) and nitric oxide (NO) exhibits the opposite behavior, i.e., decrease, indicating a reduction of such species in the APPJ. For these reasons, the addition of O 2 to the working gas seems to be useful for increasing the effectiveness of the plasma treatment only when the target modification effect is directly dependent on the content of atomic oxygen.

1. Introduction

In recent years atmospheric pressure plasma jets (APPJs) produced in open environments have received a lot of attention, not only because of their versatility and ease of use, but also due to the encouraging results achieved in the most diverse applications [1,2,3,4,5]. Special attention has been given to medical and biological applications of APPJs, whose beneficial effects have been attributed to the reactive oxygen and nitrogen species (RONS) produced by the plasma jets [6,7,8]. The actions of the RONS are not only limited to biological materials, since they also contribute to the hydrophilization and surface activation processes of many materials treated with plasma [9,10].
Many studies indicated that the addition of small amounts of oxygen ( O 2 ) to the gas employed to produce plasma, usually argon (Ar) or helium (He), can increase the amount of atomic oxygen (O) produced in the APPJ [11,12,13,14,15,16,17]. To verify this increase in the population of O most authors have measured the light emission from excited O atoms coming from the 777 nm triplet or, in some cases, from the 844 nm triplet [13]. In some works, it was found that there is an optimal O 2 percentage that maximizes the intensity of the O emission lines. There are also works in which the authors reported that some applications of the plasma jets, with both inorganic and biological materials as a target, showed better results when there was a small O 2 addition to the plasma. However, only a few works analyzed the production of other reactive species, such as OH and NO, together with the O production. In particular, Li et al [15] studied the production efficiency of RONS as a function of the O 2 content in the He- O 2 admixture, in the range from 0–2% of the total gas flow rate, and applying different voltage waveforms to generate APPJs. In that work, Li et al have found that the production efficiency of both OH and NO decreases with O 2 addition but the opposite occurs for the O 3 and NO 2 molecules. In the case of the production efficiency of O atoms, a peak value was observed for 0.5% of O 2 content. Those results were almost the same for any HV waveform applied to generate the APPJ.
Regarding the effects of additional O 2 on APPJ parameters, the main changes reported in the literature are decrease in jet length, reduction on discharge power and current, and variations in temperatures (rotational and vibrational) [18,19,20,21,22,23,24]. Some works also identified an increment in the applied voltage as a function of the O 2 content, even with the power source configured to apply a fixed voltage to the electrodes, a fact that suggests a change in the load impedance followed by an impedance matching [25,26]. Lazzaroni et al [27] performed an investigation on the stability of APPJs as a function of the O 2 content in the working gas which, based on a global model for APPJs produced with He- O 2 admixtures, has shown that there is no discharge equilibrium if the oxygen fraction exceeds 1% in a configuration that employs a power source with frequency of 13.56 MHz and a gap of 1 mm between the electrodes. The discharge dynamics in dielectric barrier discharge (DBD) plasmas with O 2 in the gas admixture was studied only using N 2 - O 2 in a work aimed to investigate the transition from diffuse to filamentary regime [28].
Most studies found in the literature evaluate the production of RONS for only one fixed flow rate for the working gas, varying solely the amount of O 2 added to it. The present paper presents results using two different flow rates for the working gas together with the variation in the percentage of O 2 added to the plasma. The analysis of the RONS production as a function of the amount of O 2 present in the gas admixture is also performed for different distances from plasma outlet (in this case the end of a long and flexible plastic tube) to the target. This work also aims to evaluate the possible changes in the electrical parameters of plasma jets, mainly the discharge power and the effective current when small amounts of O 2 are added to the working gas. In addition, the unique combination of a plasma jet produced at the end tip of a long and flexible plastic tube with a high voltage (HV) presenting a sinusoidal-burst waveform can provide insights about the mechanisms involved in the interaction between the additional O 2 and the working gas in the generation of plasma jets.

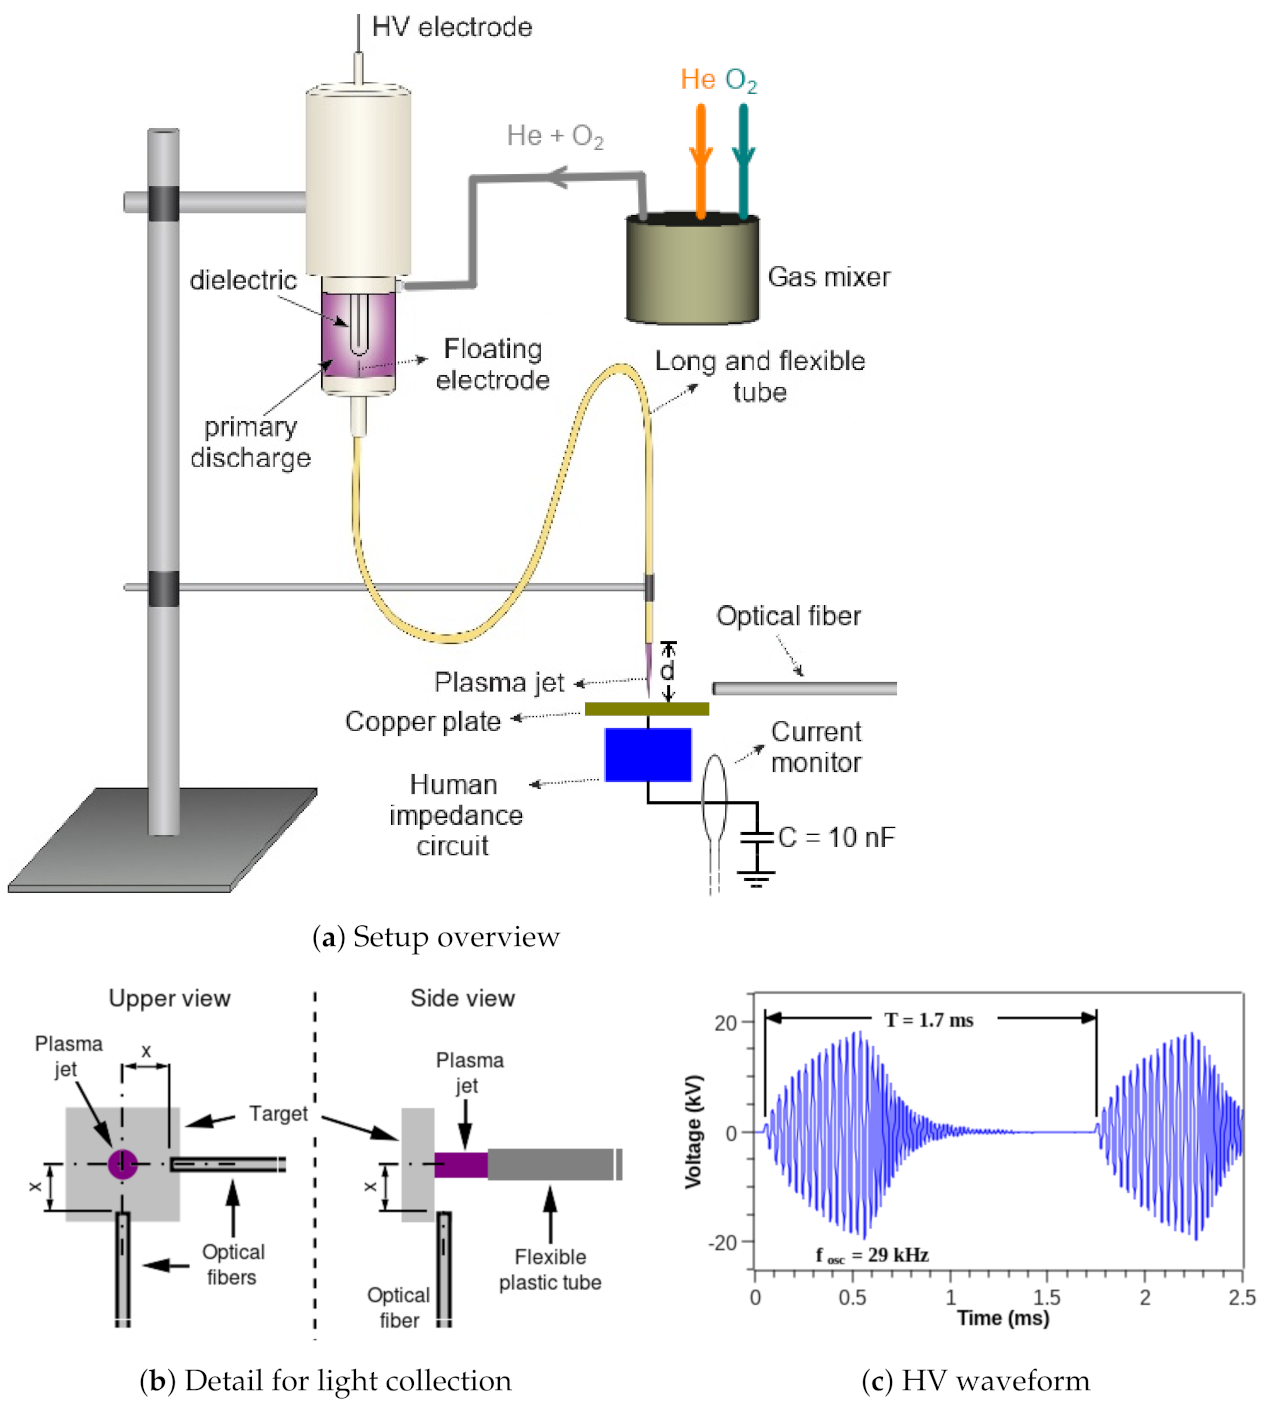
2. Materials and Methods

Figure 1a shows the experimental setup used in this work, with detailed views of the light collection scheme shown in Figure 1b. Figure 1c presents an example of the waveform applied to the high voltage (HV) electrode without plasma ignition. The plasma jet device presented in Figure 1a consists mainly of a DBD type reactor, composed by a metal pin electrode placed inside a closed-end quartz tube, which in turn is placed inside a dielectric chamber. The working gas is fed into the chamber and flushed to the ambient air through a 1-meter long and flexible plastic tube connected to the reactor output. The plastic tube material is nylon-6, with outer and inner diameters equal to 4.0 mm and 2.0 mm, respectively. A conducting wire with 0.25 mm in diameter is put inside the plastic tube (see the floating electrode in Figure 1a). This floating electrode penetrates a few millimeters inside the reactor in a way that it does not touch the quartz tube. The other wire tip ends 2 mm before the plastic tube exit. When the primary discharge inside the DBD reactor is on it polarizes the floating electrode and a small plasma jet is ignited at the end of the plastic tube. This remote plasma jet was directed towards a copper plate, placed at a distance d from the plasma outlet, which is connected to an electric circuit whose impedance follows an international standard (IEC 60601-1). It is a simplified electrical circuit model aimed to mimic the electrical properties of the human body [29]. To obtain controllable gas admixtures of He and O 2 as a working gas, both gases have their flow rates controlled by mass flow controllers and are introduced into a gas mixer prior to entering the DBD reactor.
The power source employed to produce the plasma was a commercial AC generator (Minipuls4 GBS Elektronik GmbH, Germany). We choose to apply the specific HV waveform shown in Figure 1c instead of a pure sinusoidal signal because the former produces lower ohmic heating on the experimental setup components shown in Figure 1a. That HV waveform presents a sinusoidal HV “burst” with an oscillation frequency ( f o s c ) of 29 kHz followed by a voltage off period, which repeats at a repetition period (T) of 1.7 ms.
To obtain the mean discharge power ( P d i s ), simultaneous measurements of the voltage applied on the powered electrode and the voltage across a serial capacitor (C = 10 nF) were carried out. The calculation of P d i s values takes into account all voltage oscillations in each burst that produce a charge variation in C. To measure the applied voltage a 1000:1 voltage probe (Tektronix model P6015A) was used. The signals waveforms were recorded using a 200 MHz oscilloscope (Tektronix model 2024B). Then, the P d i s value is calculated by summing the area of the q V Lissajous figures formed between the voltage ( V ( t ) ) and charge ( q ( t ) ) signals, divided by the burst period T that is [30,31,32]:
P d i s = 1 T q ( V ) d V
By applying the Green’s theorem to (1), P d i s can be calculated using:
P d i s = 1 2 T t 1 t 2 V ( t ) q ( t ) V ( t ) q ( t ) d t
where { V ( t ) , q ( t ) } = d { V ( t ) , q ( t ) } / d t . Equation (2) has the advantage that it can be used to calculate the area of the Lissajous figure without the need to plot the q V curve.
We also measured the waveform for the current that passes through the system using a current monitor from Pearson TM (model 4100). Then in each case the recorded signal was used to perform the calculation of effective discharge current ( i R M S ).
To observe the light emission from multiple species at once and evaluate the production of the OH and NO species in the plasma a broad-band optical emission spectroscopy (OES) in the wavelength range from 200 nm to 750 nm was performed using a multi-channel spectrometer from Avantes (model AvaSpec-ULS2048X64T), with spectral resolution (FWHM) equal to 0.76 nm. More precise spectroscopic measurements in the 730–840 nm range were made with a multi-channel spectrometer from Horiba (model MicroHR), with FWHM equal to 0.42 nm, which is aimed to monitor mainly the line emissions from the O I ( 5 P 5 S ) triplet at λ = 777 nm and estimate the production of atomic oxygen in the plasma jet.
For both spectrometers, the light emitted by the plasma jet was collected using optical fibers placed parallel to the surface target. The collection scheme is depicted in Figure 1b. Both optical fibers have numerical apertures (NA) of 0.22, and were placed in the same plane at 90 degrees each other. The only relevant difference between the optical fibers is in their core diameters-1000 μ m for that connected to the Avantes spectrometer and 100 μ m for the other. The distance x between the center of the plasma column and the fiber optic light input are also the same and equal to 5 mm, so, by combining the x value, NA and core diameters of the optical fibers, the lengths of the plasma jet seen by each optical fiber are approximately 2.5 mm and 1.6 mm long for the Avantes and Horiba spectrometers, respectively.
Due to the absence of absolute calibration of the spectral intensity of the spectrometers employed to measure the intensities of emissions of lines and bands of the spectra, the analysis of the production of reactive species will be more qualitative than quantitative. However, we can use the relationship between intensity of emission and density of emitting species ( I s p e c i e and n s p e c i e , respectively) to assess the number of species produced in the plasma, i.e.: I s p e c i e n s p e c i e .
Spectroscopic measurements were also used to obtain rotational and vibrational temperature values ( T r o t and T v i b , respectively) of N 2 molecules. To obtain those T r o t and T v i b values, we used spectroscopic emissions from the N 2 second positive system, C 3 Π u , ν B 3 Π g , ν (referred as N 2 ( C B ) hereafter), with Δ ν = ν ν = −1, in the wavelength range from 345 to 360 nm [33,34,35,36]. Spectra simulations were performed using the massiveOES software [37,38]. Thus, comparisons between measured and simulated spectra are performed and temperature values are determined by those that generate simulated curves that best fit to the experimental spectra. The spectral resolution provided by the Avantes spectrometer is not sufficient to resolve the rotational levels of the N 2 molecules, which is a requirement to obtain accurate values for the T r o t parameter. However, there is a direct relationship between the shape and broadening of the N 2 vibrational bands and the variation of the T r o t values, being that the higher the T r o t , the larger the broadening and the higher the intensity of the rotational lines in the vibrational bands. Both effects cause a change in the shape of the vibrational bands in that part that degrades to violet, causing it to become higher and wider, allowing the estimation of the T r o t values using low-resolution spectrometers. Thus, even not very accurate, the obtained T r o t values can be good enough to show the trend of that parameter.
It is important to notice that the spectroscopic measurements used to obtain T r o t were performed in close proximity of the target surface. Therefore, in this case, the T r o t values may be different from the T g a s ones [34].
The results from both the electrical and the spectroscopic measurements were analyzed as a function of the O 2 percentage added to the He gas for different flow rates. To assess the jet electrical parameters the O 2 percentage ranged from 0 to 5% in steps of 1%, while for the OES the O 2 content ranged from 0 to 2.5% in steps lower than or equal to 0.5%. In addition, the discharge power was evaluated as a function of both He flow rate and distance d between the plasma outlet and the target surface, without additional O 2 in the two cases. OES measurements were also performed for different d values. In this work, we take the additional O 2 percentage as the ratio between the O 2 and He flow rates ( Q O 2 / Q He · 100 % ). The O 2 present in the atmosphere is not computed since its amount is supposed to remain unchanged regardless the amount of O 2 in the gas admixture.

3. Results and Discussion

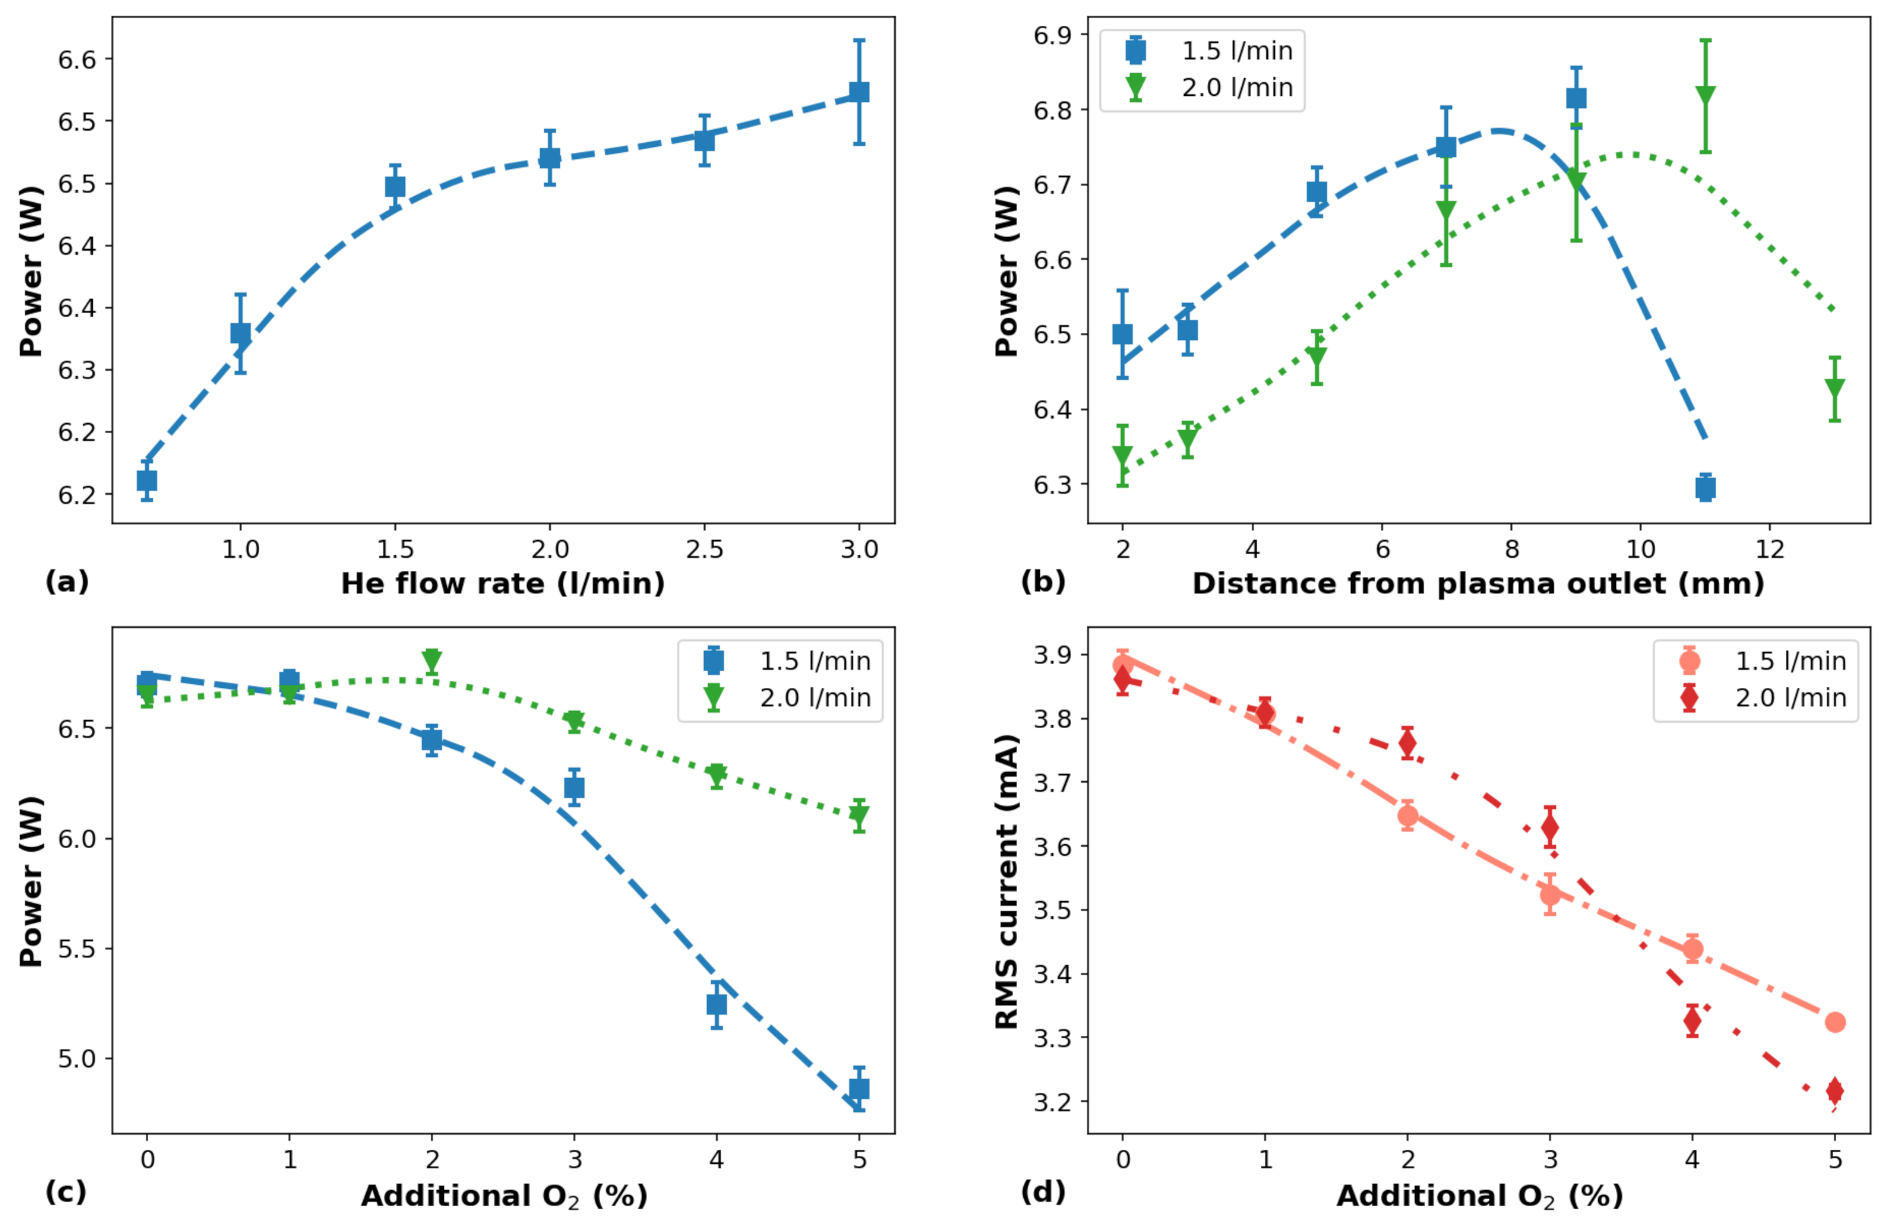
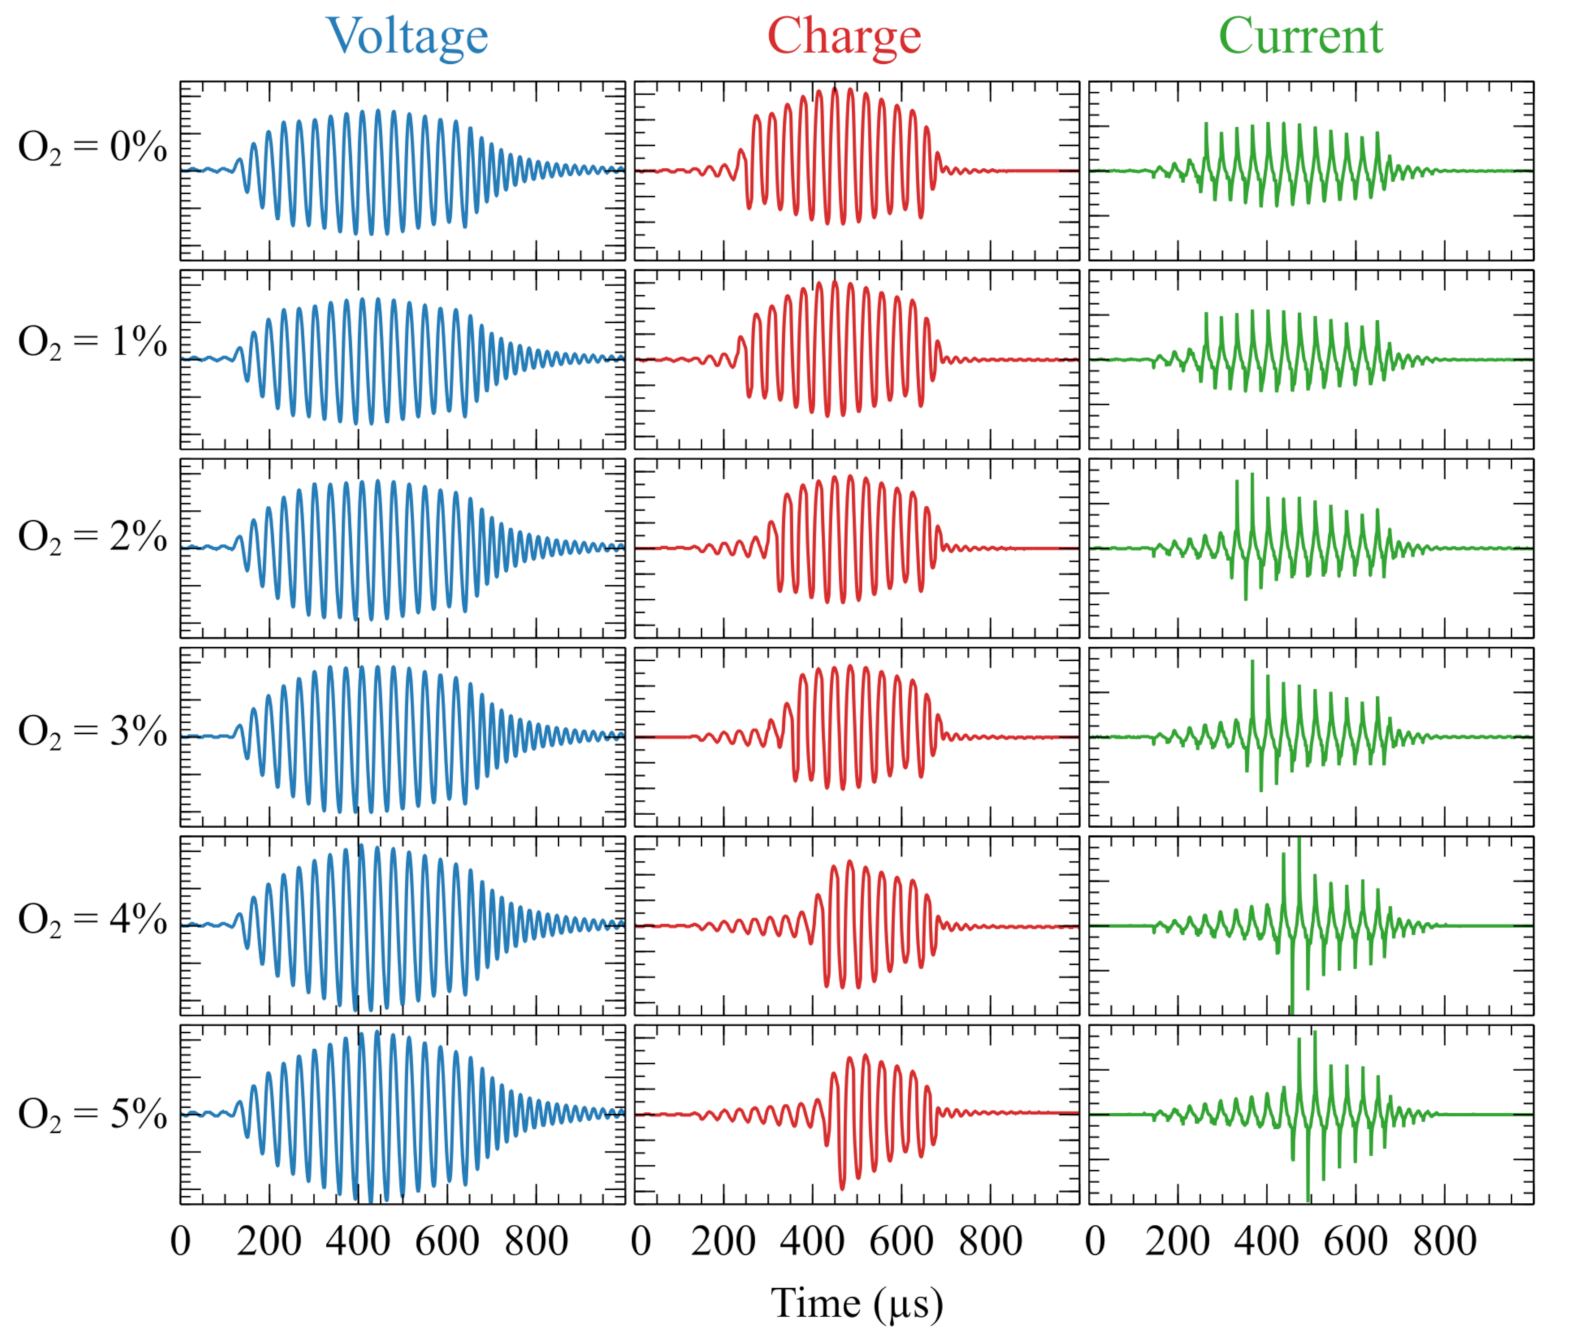
3.1. Effects on APPJ Electrical Parameters

The behavior of P d i s as a function of different parameters varied in this work are shown in Figure 2, which also depicts the behavior of i R M S as a function of the O 2 added to the plasma. In Figure 2a we can see that the P d i s values increase monotonically with the increment in He flow rate. In that case, the distance between plasma outlet and the target (d) was 7 mm. Regarding the influence of d in the P d i s values, it can be seen in Figure 2b that the higher the d the higher the P d i s until d is too large for a stable discharge to be formed. The data in Figure 2a,b were obtained using pure He as the working gas.
Concerning the influence of the additional O 2 content, the results obtained for P d i s and i R M S shown in Figure 2c,d present the first attempt to understand how these quantities evolve as a function of the O 2 percentage added to the working gas. The measurements of P d i s and i R M S for He flow rates of 1.5 and 2.0 L/min were performed changing the additional O 2 content from 0 to 5%, in steps of 1%. From the curves shown in Figure 2c it can be seen that in the range of 0–2% of additional O 2 only small variations in the P d i s values were detected. Above 2% of O 2 more pronounced decrease of mean discharge power was observed. Additionally, the values obtained for P d i s using a He flow rate of 2.0 L/min change considerably less than when the He flow rate is 1.5 L/min. On the other hand, it can be seen in Figure 2d that the i R M S values decrease monotonically as more O 2 is added to the system, which is a behavior that can be considered an advantage for in vivo applications of the plasma jet.
To understand the reasons behind the behavior of the P d i s and i R M S curves shown in Figure 2c,d, one can inspect the waveforms of the V, q and i signals that were acquired for different quantities of O 2 in the range of 0–5%. Those waveforms are presented in Figure 3, which shows an interesting time behavior of V, q and i depending on the additional concentration of O 2 present in the working gas. Notice that for better comparison of the evolution of these quantities as a function of O 2 content, all plots shown in Figure 3 are presented in the same scale (see the caption of Figure 3).
From the waveforms presented in Figure 3 one can see that for an O 2 concentration higher than 1%, at least three main effects take place as more O 2 is added to the plasma: the peak values of the applied voltage ( V p e a k ) slightly increase, the discharge ignition (indicated by sudden rises in the charge and current waveforms) occurs later and consequently the discharge duration tends to be shorter. It is very likely that the shorter duration of the discharge due to the delayed ignition is responsible for the decrease in the P d i s and i R M S values presented in Figure 2c,d. The increase in the voltage values can explain the increment in the peak current measurements, which is another effect of the addition of O 2 observed in Figure 3. All waveforms in Figure 3 were obtained with a He flow rate of 1.5 L/min. However, very similar behaviors for the V, q and i waveforms were observed when different He flow rates, as well as different distances between the plasma outlet and the target were used.
The increase in the V p e a k values with more O 2 present in the working gas, and also the reduction of P d i s and i R M S values, are trends already observed in other works studying the addition of O 2 to the plasma [25,26]. However, since most of these experiments employed sinusoidal voltage waveforms to produce plasma jets, in none of those cases it was possible to observe a delay in the ignition of the discharge, even when a pulsed power source was used. Brandenburg et al [28] observed a delay in the active current when applying a sinusoidal HV to produce a N 2 - O 2 DBD plasma in a closed environment. However, in that work the maximum O 2 concentration in the working gas was 1200 ppm (0.12%). Therefore, the results presented in Figure 3 provide more detailed information about the physical phenomena resulting from the addition of O 2 to the plasma.
Moreover, by inspecting the i waveforms measured for different O 2 concentrations, it is possible to observe the appearance of narrow peaks in the current signal when there is more O 2 in the plasma. This finding suggests that as more O 2 is added the plasma undergoes a transition from a diffuse to a filamentary regime, just as it happened in [28] using a N 2 - O 2 gas admixture.
Part of the results presented in Figure 2c,d and Figure 3, especially the reduction of the i R M S values at higher in O 2 content, can be explained by the high electronegativity of the O atoms that tend to capture electrons produced in the plasma. This in turn probably reduces the number of free electrons that are responsible for establishing the electrical current in the plasma jet. However, following an argument given in [28], another possibility is that as more O 2 is introduced into the plasma, most He atoms in metastable states ( He M ) first collide with the O 2 molecules, which reduces the population of secondary electrons that come into the plasma due to the collision of He M atoms with the surfaces of the system.
Regarding the delay in the discharge ignition for higher O 2 concentrations, a possible explanation has also a relationship with the oxygen electronegativity, since the electrons accelerated by the variation of the electric field in the very first voltage oscillations of the burst signal may have been absorbed by the exceeding O 2 molecules and O atoms, making the discharge ignition more difficult until finally there are enough energetic electrons left to start the discharge.

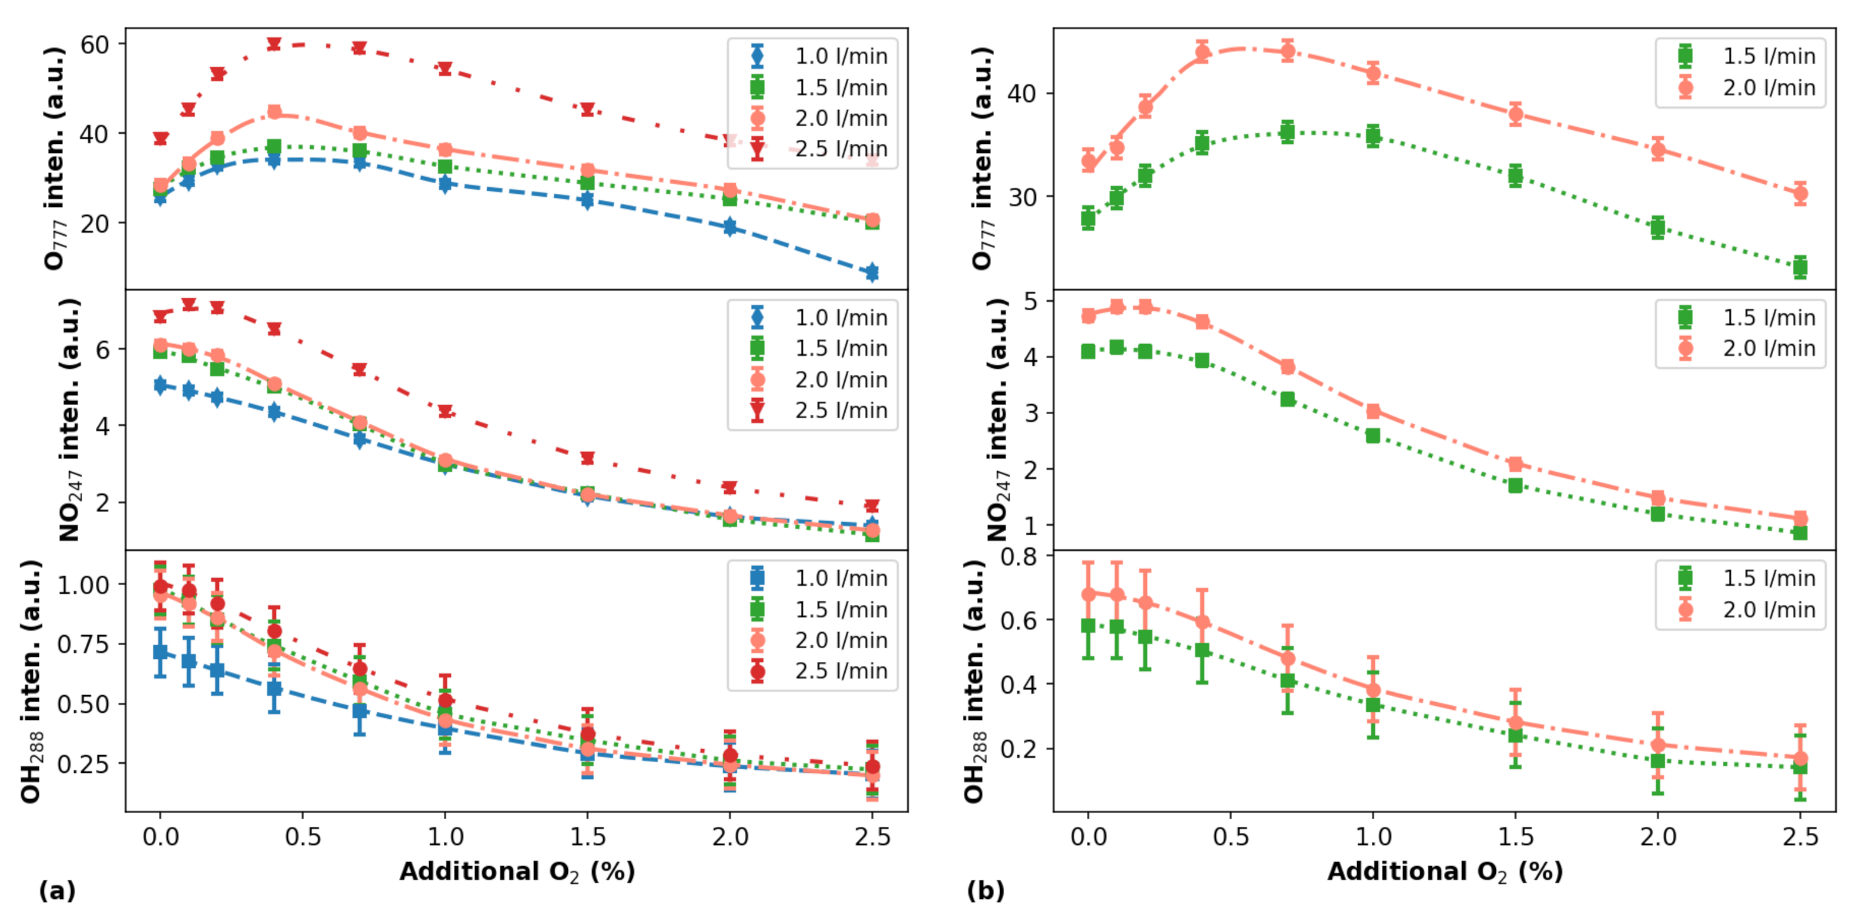
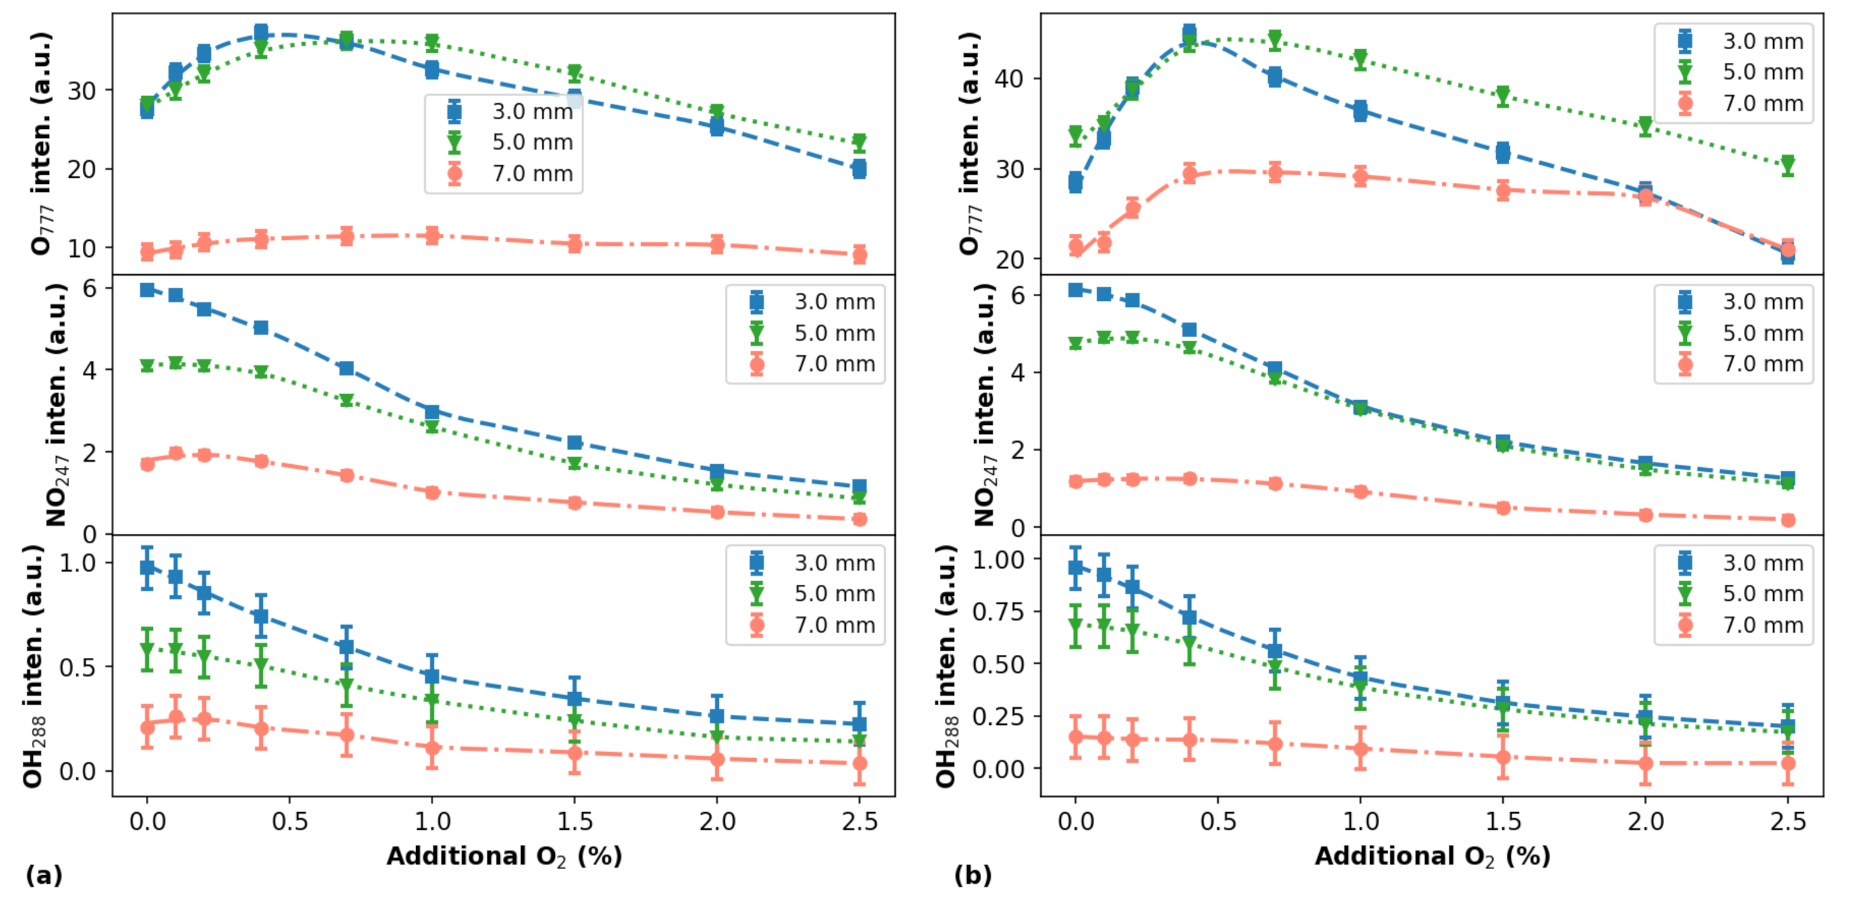
3.2. Effects on the Production of Reactive Species

Figure 4 presents an overview of the emission spectra, without additional O 2 in the gas admixture, obtained using (a) the Avantes spectrometer, for the 200–750 nm wavelength range and (b) the Horiba one, for wavelengths between 730 nm and 840 nm. The employed He flow rate was 2.0 L/min and the distance between the plasma outlet and the target was d = 3 mm. The main emitting species observed in Figure 4a are NO, from 200 nm to 270 nm, OH at 288 nm, 296 nm and 308 nm, (the last two being jeopardized by N 2 emissions), N 2 from 298 nm to 450 nm and a He line emission at 587 nm. The emitting species observed in Figure 4b are the O I triplet at 777 nm and N 2 and N 2 + in second order emissions.
To investigate how the addition of O 2 to the working gas affects the production of RONS in the plasma we performed measurements for different O 2 contents obtaining the intensity of the light emitted by the following species: NO ( A X ) emitting at 247 nm (to be referred as NO 247 hereafter), OH ( A X ) emitting at 288 nm ( OH 288 ) and O I at 777 nm ( O 777 ). Although the emission at 288 nm is not the most intense coming from the OH molecule, it was chosen because it is isolated from emissions of other species, mainly those from N 2 . Since the Avantes spectrometer, used for the measurements in the 200–750 nm wavelength range, has low resolution it would not be possible to separate emissions from different species emitting at close wavelengths.
In Section 3.1 we have found that although the discharge duration starts to decrease for more than 1% of O 2 in the working gas, the P d i s values do not change considerably for an O 2 percentage lower than 2%. Thus, since most applications require higher P d i s values and a longer discharge duration, we decided to analyze in more details the production of the NO, OH and O species only in the range from 0 to 2.5% of extra O 2 in the gas admixture. Figure 5 shows the emission intensities of the O 777 triplet and the NO 247 and OH 288 bands as a function of the additional O 2 percentage for different He flow rates measured for a distance d = 3 mm in (a), and d = 5 mm in (b).
By comparing the curves obtained for the O 777 triplet in Figure 5a, for a distance of 3 mm between the plasma outlet and the target at different He flow rates, it can be seen that neither the position of maximal emission intensity nor the profiles of the curves change significantly when He flow rate scales from 1.0 to 2.0 L/min. The intensity values of the O 777 emissions increase significantly only when the He flow rate is 2.5 L/min. Regarding the gas flow rate effect on the NO emission intensities as functions of the oxygen content, they exhibit almost the same behavior as O 777 emissions. On the other hand, the intensities of OH emissions seemingly do not change if the He flow rate is kept in the 1.5–2.5 L/min range, but at low O 2 concentration and 1.0 L/min gas flow rate the OH emission intensity decreases.
Concerning the shape of the curves shown in Figure 5a, in general both NO and OH emissions show similar trends that are different from the ones obtained for O 777 . For instance, when the oxygen content is increased only the O 777 emissions present a clear non-monotonical behavior, reaching a peak value at ∼0.6%. By contrast, the NO and OH emissions do not present such well-defined maximum, with an exception for the NO emission when the He flow rate is 2.5 L/min. In this case, when the additional O 2 in the gas is close to 0.1–0.2% a small increase in NO emission is detected.
Regarding the curves in Figure 5b obtained for a distance of 5 mm between the plasma outlet and the target, it can be seen that the measured emission intensities employing He flow rates of 1.5 L/min and 2.0 L/min change significantly for all emitting species. Significant differences in the intensity values for the O 777 emission are measured across the entire range, while the emissions differences for both NO and OH are notable only when the additional O 2 percentage is lower than 0.5% and, after that, the differences become smaller.
Comparing the NO and OH emissions in Figure 5a,b a point that is worth highlighting is that in the second case, for a higher distance between the plasma outlet and the target, the NO emissions present a maximum value in its intensity when a very small amount of O 2 is added to the plasma. This behavior was predicted by some simulations performed using the global model for APPJs and verified in some experimental works [39]. On the other hand, the behavior of OH and NO emissions presented in Figure 5a, for the lower distance between the plasma outlet and the target, agrees with some results reported in the literature [15,40].
Figure 6 shows the profiles of RONS as a function of the additional O 2 for different distances between the plasma outlet and the target.
Regarding the intensity measurements of the light emitted by RONS for different d values an important remark must be made. It is that as d increases, different portions on the plasma are detected by both spectrometers, i.e., when d = 3 mm, the Avantes and Horiba spectrometers see ∼83% and ∼53% of the plasma jet, respectively, while when d = 7 mm, the first spectrometer sees ∼36% and the second one only ∼23%.
It is interesting to notice that using the particular setup presented in this work, the peak values of the O 777 emissions obtained in all explored experimental conditions occurred for approximately 0.5–0.6% of O 2 content in the gas admixture. This finding coincides with the value where the highest efficiency in the production of O atoms was observed by Li et al. [15].

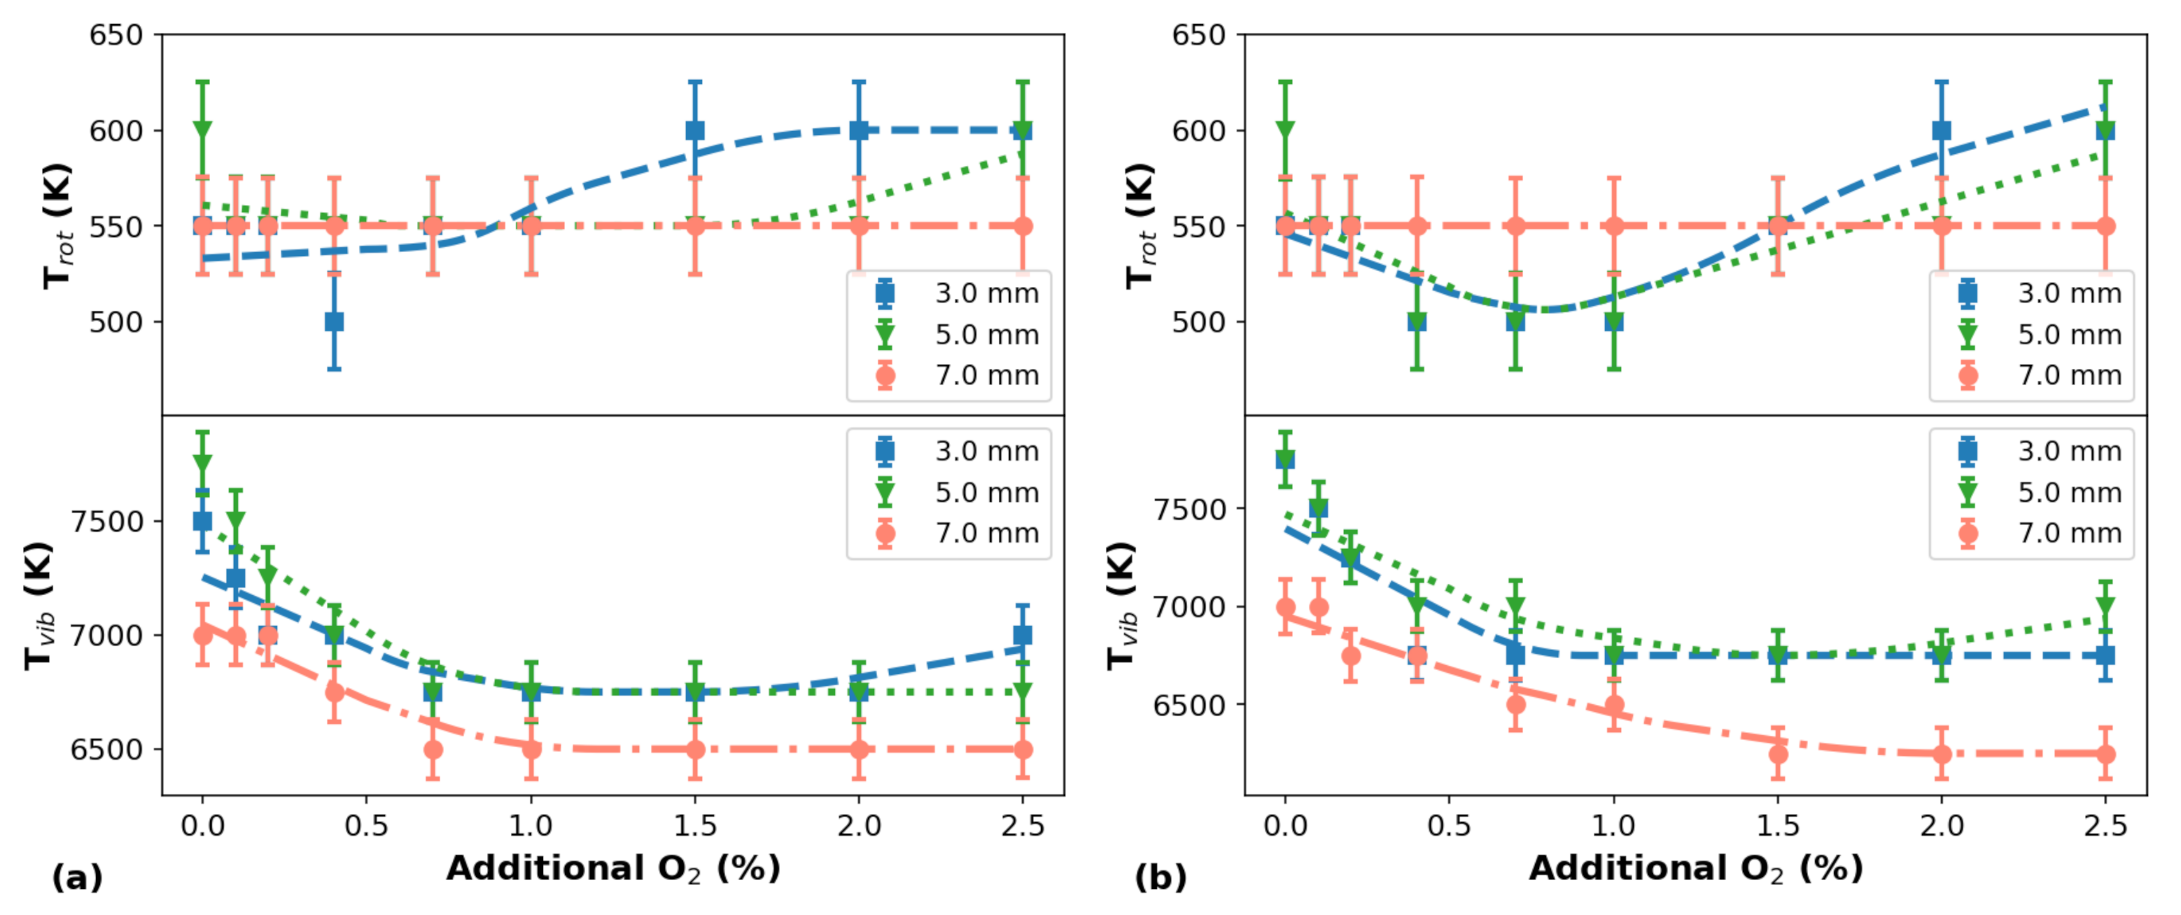
3.3. Effects on APPJ Thermal Parameters

The rotational and vibrational temperatures ( T r o t and T v i b , respectively) can be considered the main thermal parameters of APPJs, since T r o t has a close relationship with the gas temperature ( T g a s ) and in most cases it is being assumed that T r o t T g a s . In APPJs the T v i b is related to the rate of chemical reactions, i.e., higher T v i b values increase the likelihood of chemical reactions between the plasma and the target under treatment [41,42]. Of course, the electron temperature ( T e ) is a thermal parameter that also plays an important role in the plasma dynamics, and it is probably the one most affected by the additional O 2 injected into the plasma. However, the variations on the electron temperature could not be analyzed in this work because we do not have the appropriated tools to perform T e measurements. It can be seen in Figure 7 that the T r o t values are not significantly affected by the additional O 2 in the plasma for all distances between the plasma outlet and the target and for the two He flow rates used, presenting variations around 550 K in almost all measurements. On the other hand, the T v i b curves present clear downward trends as more O 2 is added to the plasma. Additionally, the T v i b tends to decrease as d increases. In addition, no significant variation in T v i b values are observed when the He flow rate was changed.
By comparing the profiles of T r o t and T v i b values measured as a function of the additional O 2 in the plasma, shown in Figure 7a,b, it can be seen that at different He flow rates the behavior of the temperatures as a function of the O 2 content do not present significant changes. Regarding the magnitude of the temperature values, those obtained for T r o t are within the expected range for APPJs produced in He with the plasma jet impinging a metallic target [43]. However, those T r o t values are higher than the room temperature (∼300 K) and are likely being overestimated due to the low-resolution spectrometer employed to perform the measurements. Additionally, one should consider that performing OES measurements of plasma portions that are close to the target’s surface, can artificially increase the T r o t values. The fact that the plasma jet is directly impinging on the metallic target results in a strong plasma-material interaction, causing the release of a lot of secondary electrons to the plasma, which influences the population of higher energy rotational levels leading to higher T r o t values. Furthermore, since the floating wire placed inside the plastic tube is a conducting material, the plasma jet may present a corona discharge component, which can also be one of the causes of the higher T r o t values obtained.
Concerning the T v i b values obtained in this work, they are much higher than those obtained for APPJs in similar conditions, being more than ten times higher than the corresponding T r o t values. A possible explanation for this observation is that these T v i b values have a close relationship with the small diameter of the plastic tube, which causes an increase in the gas pressure inside the reactor leading to an increment in T v i b [44]. At the same time, the plasma-material interaction may be influencing the T v i b values as well.
In our preliminary experiments we used an infrared thermometer to monitor the target temperature during the plasma jet application. It was found that the target temperature increased by ∼3 K after the first 15 s of plasma exposure and with another ∼7 K after two minutes of operation. This total increase of 10 K in the target temperature due to the plasma impinging did not change significantly during 10 min of operation. Therefore, the variation in the target temperature is not high enough to cause any thermal damage to the target (even if we consider thermo-sensitive materials). Furthermore, the increase in the target temperature will not affect the T r o t and T v i b measurements since the target temperature is far from the values obtained for those parameters and its variation is within the uncertainties in the T r o t and T v i b values.

4. Conclusions

In this work we have demonstrated that the addition of O 2 to the working gas for generation of APPJs affects most of the plasma parameters, the production of RONS and the discharge duration and its time of ignition. Regarding the electrical parameters, the discharge power starts to decrease significantly if more than 2% of O 2 is added to the gas admixture while the effective current is always reduced when any amount of O 2 is added. Concerning the plasma thermal parameters, we have seen that the T r o t values remains almost unchanged towards the addition of O 2 , while the T v i b ones presented downward tendency when small amounts of O 2 are added (less than 1%) followed by stable T v i b values for higher O 2 percentages. An interesting observation is that the trends exhibited by those parameters did not change if the operating conditions (mainly distance between the plasma outlet and the target and the He flow rate) are modified. On the other hand, the production of RONS presented different behaviors in their variations depending on the specie under study and on the operating conditions. As an example, the trend in the production of NO as a function of the O 2 content seems to be affected by both He flow rate and distance between the plasma outlet and the target.
The aim of most works reported in the literature as well as the current one, has been to enhance the production of RONS in the plasma by addition of O 2 to the working gas. However, using the configuration presented in this work it was verified that the O 2 fulfills this goal only considering the production of atomic oxygen, which showed significant increases in almost all studied conditions when ∼0.5–0.6% of O 2 is added to the gas admixture. One can speculate that the production of other RONS, such as O 3 or NO 2 , is probably increasing with the increment of O atoms in the plasma jet, although we have not carried out the measurements that would prove that.
Then, as a general conclusion, we can say that the addition of O 2 to the working gas used to generate APPJs certainly provides an increase in the amount of O atoms in the plasma jet. However, using the configuration described in this work, the simple act of adding O 2 to the plasma does not necessarily imply in an increment of other RONS species, such as OH and NO, which also play important roles when the interaction between plasma and materials occurs. However, we have found that there are also ways to improve the amount of RONS other than O atoms when O 2 is added to the plasma by setting appropriately and carefully select some operation parameters such as the distance between the plasma outlet and the target. Nevertheless, it is important to take into account what kind of reactive specie is required by the application in question and the target under treatment to choose the best setup for the occasion.

Author Contributions

Conceptualization, F.N., K.P. and K.K.; methodology, F.N.; formal analysis, F.N.; investigation, F.N., K.P. and K.K.; resources, K.K.; data curation, F.N.; writing—original draft preparation, F.N. and K.K.; writing—review and editing, F.N. and K.K.; supervision, K.K.; project administration, K.K. All authors have read and agreed to the published version of the manuscript.

Funding

This research was supported by CAPES (Programs DS and PrInt) and FAPESP (grants #2019/05856-7 and #2020/09481-5). Financial support was also provided by São Paulo State University–UNESP (Edital Propg 5/2021).

Data Availability Statement

Data are contained within the article. Raw data are available from the authors under reasonable request.

Acknowledgments

The authors thank to the students Ananias Barbosa and Ana Almeida for helping to acquire some of the data used in this work.

Conflicts of Interest

The authors declare no conflict of interest.

References

  1. Brandenburg, R. Dielectric barrier discharges: Progress on plasma sources and on the understanding of regimes and single filaments. Plasma Sources Sci. Technol. 2017, 26, 53001. [Google Scholar] [CrossRef]
  2. Bekeschus, S.; Favia, P.; Robert, E.; Woedtke, T.V. White paper on plasma for medicine and hygiene: Future in plasma health sciences. Plasma Process. Polym. 2019, 16, 1800033. [Google Scholar] [CrossRef] [Green Version]
  3. Busco, G.; Robert, E.; Chettouh-Hammas, N.; Pouvesle, J.M.; Grillon, C. The emerging potential of cold atmospheric plasma in skin biology. Free. Radic. Biol. Med. 2020, 161, 290–304. [Google Scholar] [CrossRef] [PubMed]
  4. Laroussi, M. Cold Plasma in Medicine and Healthcare: The New Frontier in Low Temperature Plasma Applications. Front. Phys. 2020, 8. [Google Scholar] [CrossRef]
  5. Liu, D.; Zhang, Y.; Xu, M.; Chen, H.; Lu, X.; Ostrikov, K.K. Cold atmospheric pressure plasmas in dermatology: Sources, reactive agents, and therapeutic effects. Plasma Process. Polym. 2020, e1900218. [Google Scholar] [CrossRef]
  6. Lu, X.; Naidis, G.V.; Laroussi, M.; Reuter, S.; Graves, D.B.; Ostrikov, K. Reactive species in non-equilibrium atmospheric-pressure plasmas: Generation, transport, and biological effects. Phys. Rep. 2016, 630, 1–84. [Google Scholar] [CrossRef] [Green Version]
  7. Cheng, X.; Sherman, J.; Murphy, W.; Ratovitski, E.; Canady, J.; Keidar, M. The Effect of Tuning Cold Plasma Composition on Glioblastoma Cell Viability. PLoS ONE 2014, 9, e98652, Publisher: Public Library of Science. [Google Scholar] [CrossRef] [PubMed] [Green Version]
  8. Chen, T.W.; Liu, C.T.; Chen, C.Y.; Wu, M.C.; Chien, P.C.; Cheng, Y.C.; Wu, J.S. Analysis of Hydroxyl Radical and Hydrogen Peroxide Generated in Helium-Based Atmospheric-Pressure Plasma Jet and in Different Solutions Treated by Plasma for Bioapplications. ECS J. Solid State Sci. Technol. 2020, 9, 115002. [Google Scholar] [CrossRef]
  9. Kim, D.H.; Park, C.S.; Shin, B.J.; Seo, J.H.; Tae, H.S. Uniform Area Treatment for Surface Modification by Simple Atmospheric Pressure Plasma Treatment Technique. IEEE Access 2019, 7, 103727–103737. [Google Scholar] [CrossRef]
  10. Nishime, T.M.C.; Wagner, R.; Kostov, K.G. Study of Modified Area of Polymer Samples Exposed to a He Atmospheric Pressure Plasma Jet Using Different Treatment Conditions. Polymers 2020, 12, 1028. [Google Scholar] [CrossRef]
  11. Wang, X.; Tan, Z.; Pan, J.; Chen, X. Effects of Oxygen Concentration on Pulsed Dielectric Barrier Discharge in Helium-Oxygen Mixture at Atmospheric Pressure. Plasma Sci. Technol. 2016, 18, 837–843. [Google Scholar] [CrossRef]
  12. Dai, Y.; Zhang, M.; Li, Q.; Wen, L.; Wang, H.; Chu, J. Separated Type Atmospheric Pressure Plasma Microjets Array for Maskless Microscale Etching. Micromachines 2017, 8, 173. [Google Scholar] [CrossRef] [Green Version]
  13. Fang, Z.; Wang, X.; Shao, T.; Zhang, C. Influence of Oxygen Content on Argon/Oxygen Dielectric Barrier Discharge Plasma Treatment of Polyethylene Terephthalate Film. IEEE Trans. Plasma Sci. 2017, 45, 310–317. [Google Scholar] [CrossRef]
  14. Yue, Y.; Pei, X.; Gidon, D.; Wu, F.; Wu, S.; Lu, X. Investigation of plasma dynamics and spatially varying O and OH concentrations in atmospheric pressure plasma jets impinging on glass, water and metal substrates. Plasma Sources Sci. Technol. 2018, 27, 064001. [Google Scholar] [CrossRef]
  15. Li, J.; Wu, F.; Nie, L.; Lu, X.; Ostrikov, K. The Production Efficiency of Reactive Oxygen and Nitrogen Species (RONS) of AC and Pulse-DC Plasma Jet. IEEE Trans. Plasma Sci. 2020, 48, 4204–4214. [Google Scholar] [CrossRef]
  16. Korolov, I.; Steuer, D.; Bischoff, L.; Hübner, G.; Liu, Y.; Gathen, V.S.v.d.; Böke, M.; Mussenbrock, T.; Schulze, J. Atomic oxygen generation in atmospheric pressure RF plasma jets driven by tailored voltage waveforms in mixtures of He and O2. J. Phys. D Appl. Phys. 2021, 54, 125203. [Google Scholar] [CrossRef]
  17. Liu, F.; Chu, H.; Zhuang, Y.; Fang, Z.; Zhou, R.; Cullen, P.J.; Ostrikov, K.K. Uniform and stable plasma reactivity: Effects of nanosecond pulses and oxygen addition in atmospheric-pressure dielectric barrier discharges. J. Appl. Phys. 2021, 129, 033302. [Google Scholar] [CrossRef]
  18. Huang, C.; Yu, Q.; Hsieh, F.H.; Duan, Y. Bacterial Deactivation Using a Low Temperature Argon Atmospheric Plasma Brush with Oxygen Addition. Plasma Process. Polym. 2007, 4, 77–87. [Google Scholar] [CrossRef]
  19. Fang, Z.; Zhou, Y.; Yao, Z. The Influences of Water and Oxygen Contents on Length of Atmospheric Pressure Plasma Jets in Ar/H2O and Ar/O2 Mixtures. IEEE Trans. Plasma Sci. 2014, 42, 2618–2619. [Google Scholar] [CrossRef]
  20. Sarani, A.; Nicula, C.; Gonzales, X.F.; Thiyagarajan, M. Characterization of Kilohertz-Ignited Nonthermal He and He/O2 Plasma Pencil for Biomedical Applications. IEEE Trans. Plasma Sci. 2014, 42, 3148–3160. [Google Scholar] [CrossRef]
  21. Niu, J.; Liu, D.; Ji, L.; Xia, Y.; Bi, Z.; Song, Y.; Ma, Y.; Huang, Z.; Wang, W.; Yang, W. Propagation of Brush-Shaped He/O2 Plasma Plumes in Ambient Air. IEEE Trans. Plasma Sci. 2015, 43, 1993–1998. [Google Scholar] [CrossRef]
  22. Fatima, S.S.; Rehman, N.U.; Younus, M.; Ahmad, I. Optical characterization of atmospheric-pressure plasma needle. Contrib. Plasma Phys. 2017, 57, 387–394. [Google Scholar] [CrossRef]
  23. Barkhordari, A.; Ganjovi, A.; Mirzaei, I.; Falahat, A. Study of the physical discharge properties of a Ar/O2 DC plasma jet. Indian J. Phys. 2018, 92, 1177–1186. [Google Scholar] [CrossRef]
  24. Wu, S.; Wu, F.; Liu, X.; Mao, W.; Zhang, C. A Bipolar DC-Driven Touchable Helium Plasma Jet Operated in Self-Pulsed Mode. IEEE Trans. Plasma Sci. 2018, 46, 4091–4098. [Google Scholar] [CrossRef]
  25. Wang, S.; Wan, J. Oxygen Effects on a He/O2 Plasma Jet at Atmospheric Pressure. IEEE Trans. Plasma Sci. 2009, 37, 551–554. [Google Scholar] [CrossRef]
  26. Pang, H.; Chen, Q.; Li, B.; Fei, F.; Yang, S. The Role of Oxygen in a Large Area of RF-Powered Atmospheric Pressure Dielectric Barrier Glow Discharge Plasma in Sterilization. IEEE Trans. Plasma Sci. 2011, 39, 1689–1694. [Google Scholar] [CrossRef]
  27. Lazzaroni, C.; Chabert, P. A comparison between micro hollow cathode discharges and atmospheric pressure plasma jets in Ar/O2gas mixtures. Plasma Sources Sci. Technol. 2016, 25, 65015. [Google Scholar] [CrossRef]
  28. Brandenburg, R.; Maiorov, V.A.; Golubovskii, Y.B.; Wagner, H.E.; Behnke, J.; Behnke, J.F. Diffuse barrier discharges in nitrogen with small admixtures of oxygen: Discharge mechanism and transition to the filamentary regime. J. Phys. D Appl. Phys. 2005, 38, 2187–2197. [Google Scholar] [CrossRef] [Green Version]
  29. Stancampiano, A.; Chung, T.; Dozias, S.; Pouvesle, J.; Mir, L.M.; Robert, E. Mimicking of Human Body Electrical Characteristic for Easier Translation of Plasma Biomedical Studies to Clinical Applications. IEEE Trans. Radiat. Plasma Med. Sci. 2020, 4, 335–342. [Google Scholar] [CrossRef]
  30. Hołub, M. On the measurement of plasma power in atmospheric pressure DBD plasma reactors. Int. J. Appl. Electromagn. Mech. 2012, 39, 81–87. [Google Scholar] [CrossRef]
  31. Ashpis, D.E.; Laun, M.C.; Griebeler, E.L. Progress Toward Accurate Measurement of Dielectric Barrier Discharge Plasma Actuator Power. AIAA J. 2017, 55, 2254–2268. [Google Scholar] [CrossRef] [PubMed]
  32. Pipa, A.V.; Brandenburg, R. The Equivalent Circuit Approach for the Electrical Diagnostics of Dielectric Barrier Discharges: The Classical Theory and Recent Developments. Atoms 2019, 7, 14. [Google Scholar] [CrossRef] [Green Version]
  33. Moon, S.Y.; Choe, W. A comparative study of rotational temperatures using diatomic OH, O2 and N2+ molecular spectra emitted from atmospheric plasmas. Spectrochim. Acta Part B At. Spectrosc. 2003, 58, 249–257. [Google Scholar] [CrossRef]
  34. Bruggeman, P.J.; Sadeghi, N.; Schram, D.C.; Linss, V. Gas temperature determination from rotational lines in non-equilibrium plasmas: A review. Plasma Sources Sci. Technol. 2014, 23, 023001. [Google Scholar] [CrossRef] [Green Version]
  35. Zhang, Q.Y.; Shi, D.Q.; Xu, W.; Miao, C.Y.; Ma, C.Y.; Ren, C.S.; Zhang, C.; Yi, Z. Determination of vibrational and rotational temperatures in highly constricted nitrogen plasmas by fitting the second positive system of N2 molecules. AIP Adv. 2015, 5, 057158. [Google Scholar] [CrossRef] [Green Version]
  36. Ono, R. Optical diagnostics of reactive species in atmospheric-pressure nonthermal plasma. J. Phys. D Appl. Phys. 2016, 49, 083001. [Google Scholar] [CrossRef]
  37. Voráč, J.; Synek, P.; Potočňáková, L.; Hnilica, J.; Kudrle, V. Batch processing of overlapping molecular spectra as a tool for spatio-temporal diagnostics of power modulated microwave plasma jet. Plasma Sources Sci. Technol. 2017, 26, 025010. [Google Scholar] [CrossRef]
  38. Voráč, J.; Synek, P.; Procházka, V.; Hoder, T. State-by-state emission spectra fitting for non-equilibrium plasmas: OH spectra of surface barrier discharge at argon/water interface. J. Phys. D Appl. Phys. 2017, 50, 294002. [Google Scholar] [CrossRef]
  39. Verreycken, T.; Bruggeman, P.J. OH Dynamics in a Nanosecond Pulsed Plasma Filament in Atmospheric Pressure He–H2O upon the Addition of O2. Plasma Chem Plasma Process 2014, 34, 605–619. [Google Scholar] [CrossRef]
  40. Deng, G.; Jin, Q.; Yin, S.; Zheng, C.; Liu, Z.; Yan, K. Experimental study on bacteria disinfection using a pulsed cold plasma jet with helium/oxygen mixed gas. Plasma Sci. Technol. 2018, 20, 115503. [Google Scholar] [CrossRef] [Green Version]
  41. Lambert, J.D. Vibration–vibration energy transfer in gaseous collisions. Q. Rev. Chem. Soc. 1967, 21, 67–78. [Google Scholar] [CrossRef]
  42. Smith, R.R.; Killelea, D.R.; DelSesto, D.F.; Utz, A.L. Preference for Vibrational over Translational Energy in a Gas-Surface Reaction. Science 2004, 304, 992–995. [Google Scholar] [CrossRef]
  43. Wang, R.; Xu, H.; Zhao, Y.; Zhu, W.; Ostrikov, K.K.; Shao, T. Effect of dielectric and conductive targets on plasma jet behaviour and thin film properties. J. Phys. D Appl. Phys. 2018, 52, 074002. [Google Scholar] [CrossRef]
  44. Nascimento, F.d.; Moshkalev, S.; Machida, M. The role of vibrational temperature variations in a pulsed dielectric barrier discharge plasma device. Contrib. Plasma Phys. 2020, 60, e202000046. [Google Scholar] [CrossRef]
Figure 1. (a) Schematic of the experimental setup. (b) Details of the arrangement for the optical fibers. (c) Example of a typical HV waveform applied to the pin electrode without producing plasma.
Applsci 11 06311 g001
Figure 2. Curves of P d i s as a function of the He flow rate (a) and distance between plasma outlet and target (b), and curves of P d i s (c) and i R M S (d) as a function of the O 2 percentage added to the working gas. d = 7 mm in (a,c,d). O 2 content is zero in (a,b).
Applsci 11 06311 g002
Figure 3. Waveforms of applied voltage, capacitor charge and current for various concentrations of additional O 2 . The He flow rate was 1.5 L/min and the distance d was 7 mm. Vertical scales are constant for each parameter: Voltage: ±12 kV; Charge: ±70 nC; Current: ±40 mA.
Applsci 11 06311 g003
Figure 4. Overview of the emission spectrum of the plasma jet obtained using (a) the Avantes spectrometer and (b) the Horiba one with 2.0 L/min of He flow rate without additional O 2 . The distance between the plasma outlet and the target was d = 3 mm. The asterisks in the notations in (b) indicate second order emissions from N 2 and N 2 + .
Applsci 11 06311 g004
Figure 5. Intensities of selected lines/bands from O, NO, and OH radicals as a function of the additional O 2 percentage for different He flow rates (indicated in the curve legends). The data were acquired for distances d = 3 mm in (a) and d = 5 mm in (b). Symbols represent experimental data and lines are trend curves.
Applsci 11 06311 g005
Figure 6. Emission intensities of selected lines/bands from O, NO, and OH radicals as a function of the additional O 2 percentage for different d values (indicated in the curve legends). The data were measured for He flow rates of 1.5 L/min in (a) and 2.0 L/min in (b). Symbols represent experimental data and lines are trend curves.
Applsci 11 06311 g006
Figure 7. Variation of T r o t and T v i b values as a function of the additional O 2 percentage for different d values. The temperatures were measured for He flow rates of 1.5 L/min in (a) and 2.0 L/min in (b). Symbols represent experimental data and lines are trend curves.
Applsci 11 06311 g007
Publisher’s Note: MDPI stays neutral with regard to jurisdictional claims in published maps and institutional affiliations.

