
Engineering Properties of Colorful Mortar with Inorganic Color Paste

Abstract
:1. Introduction
2. Research Materials and Methods
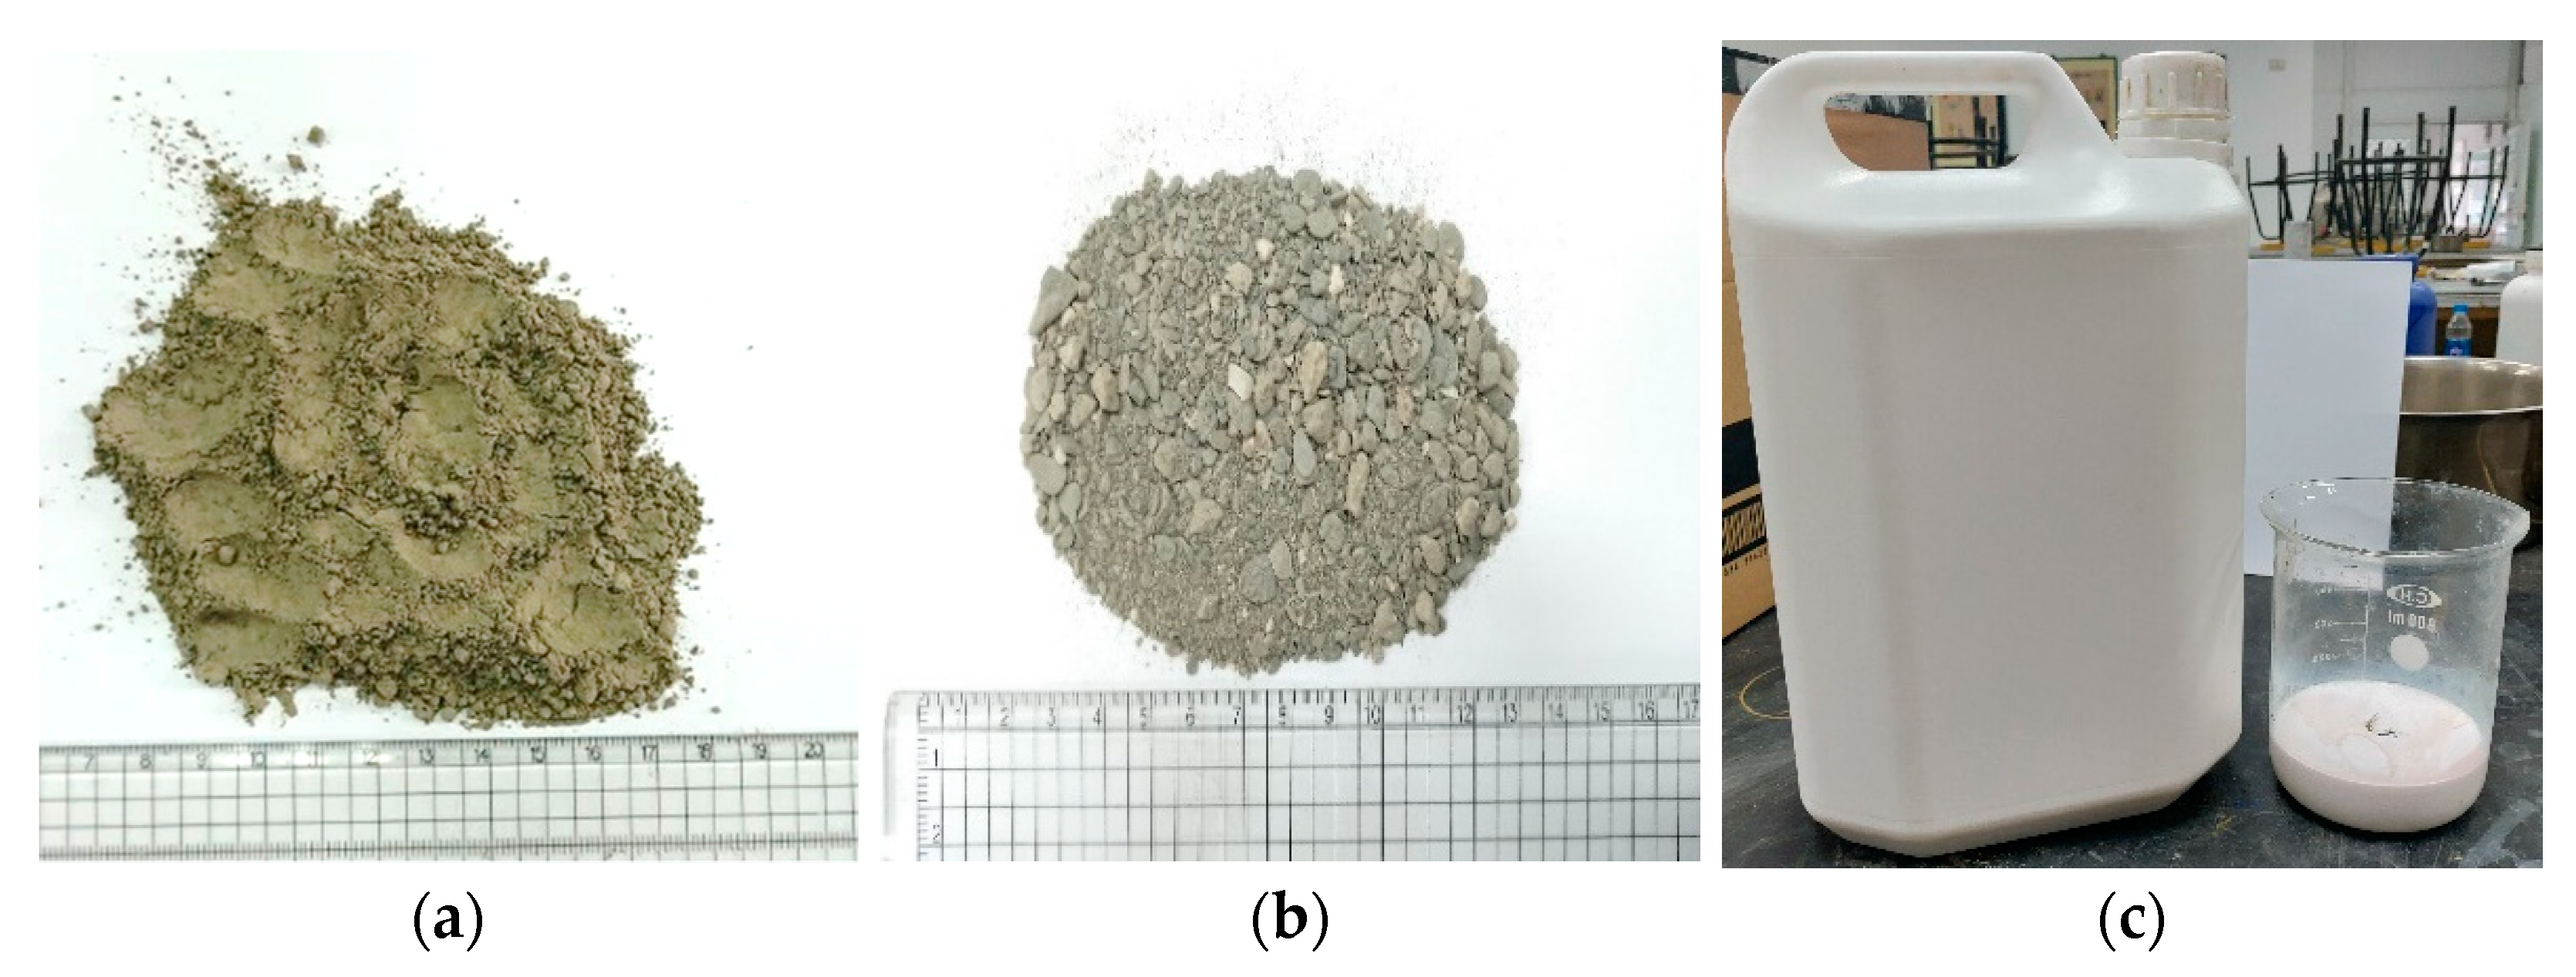
2.1. Research Materials
- (1)
- (2)
- Mixing water: meeting the ASTM C1602 [11] mixing water standard specification.
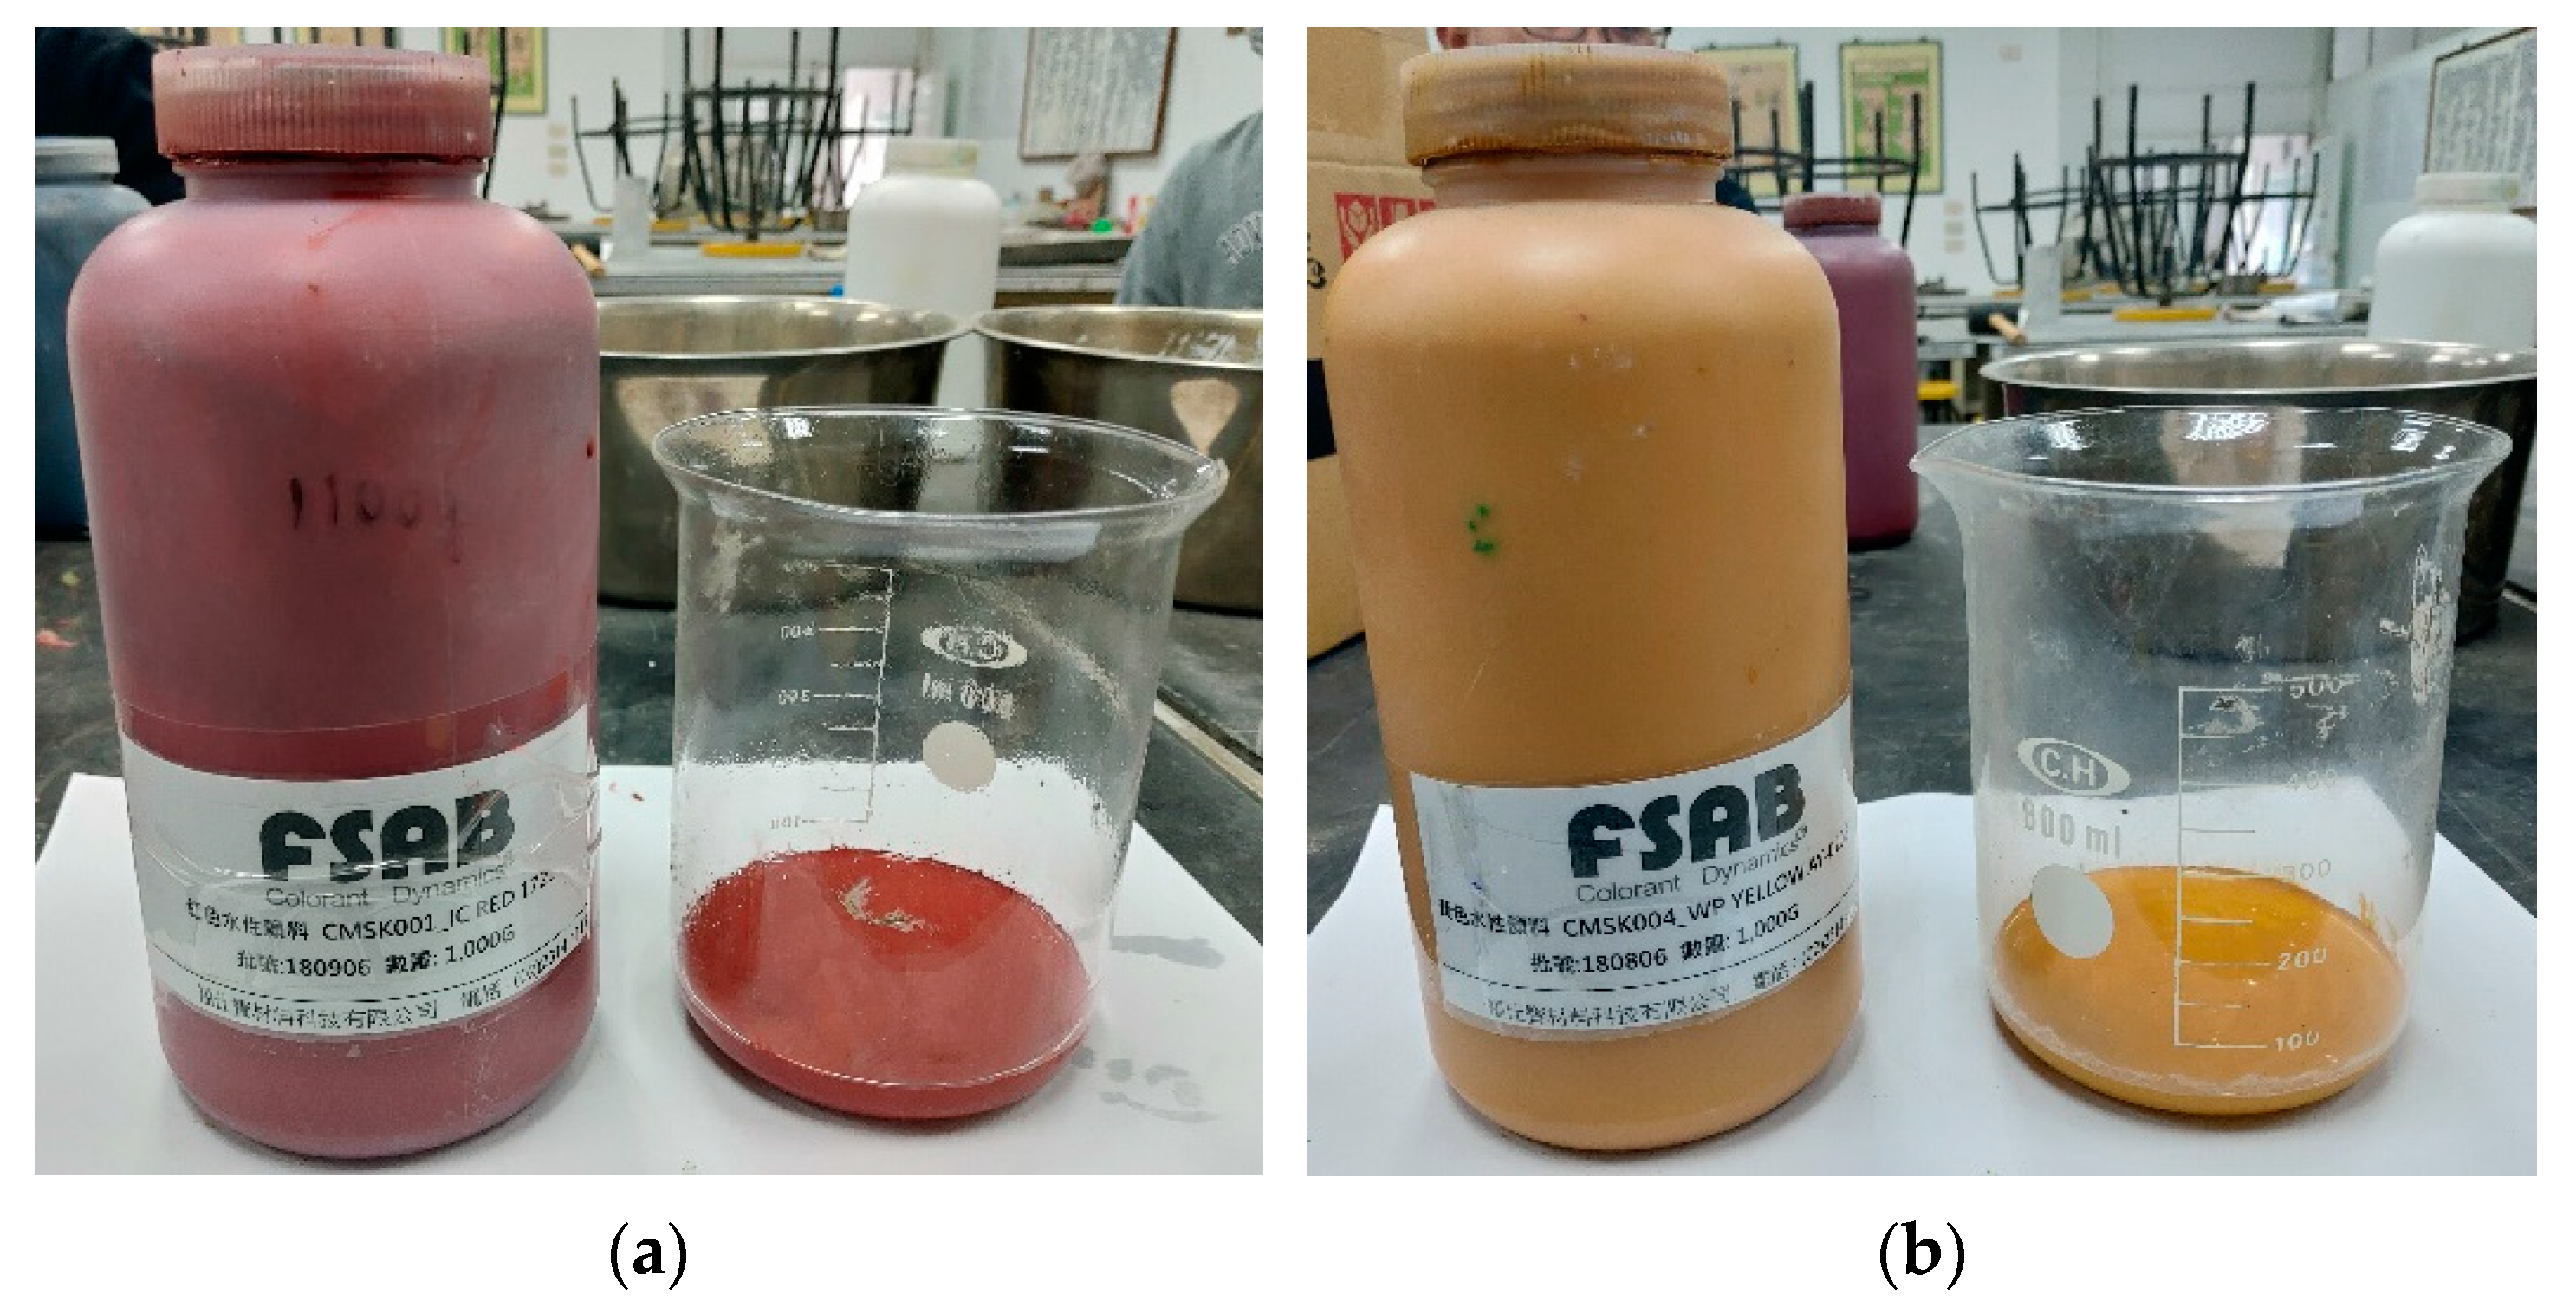
- (3)
- (4)
- (5)
2.2. Test Items and Methods
- (1)
- Slump: tested referring to ASTM C143 [13]. A minislump cone is used to perform three tests, and the average is taken to judge the slump of the mortar.
- (2)
- Slump flow: tested according to ASTM C230 [14], aiming to determine the standard flow value of mortar. The test must be measured four times after 25 drops, and the average of the four measurements is the slump flow value of the sample.
- (3)
- Compressive strength: 342 pieces of 5 cm × 5 cm × 5 cm test cube poured according to ASTM C109 [15].
- (4)
- Flexural strength: 342 pieces of 4 cm × 4 cm × 16 cm cuboid specimen poured according to ASTM C348 [16], so as to analyze the flexural resistance of different mortars.
- (5)
- Tensile strength: 342 pieces of splayed specimen poured according to ASTM C190 [17].
- (6)
- Ultrasonic pulse velocity: measured by using two probes to contact the specimen surface according to ASTM C597 [18]. The transmitter sound pulse is transferred into the specimen, and the pulse transmission time is measured to calculate the pulse velocity of ultrasound in the specimen.
- (7)
- Surface resistivity: measured according to ASTM C876 [19]. It can be regarded as an indirect index of the internal porosity and connectivity of mortar. The higher the resistivity is, the less surface current flows through the specimen, representing higher compactness and better durability of the specimen.
- (8)
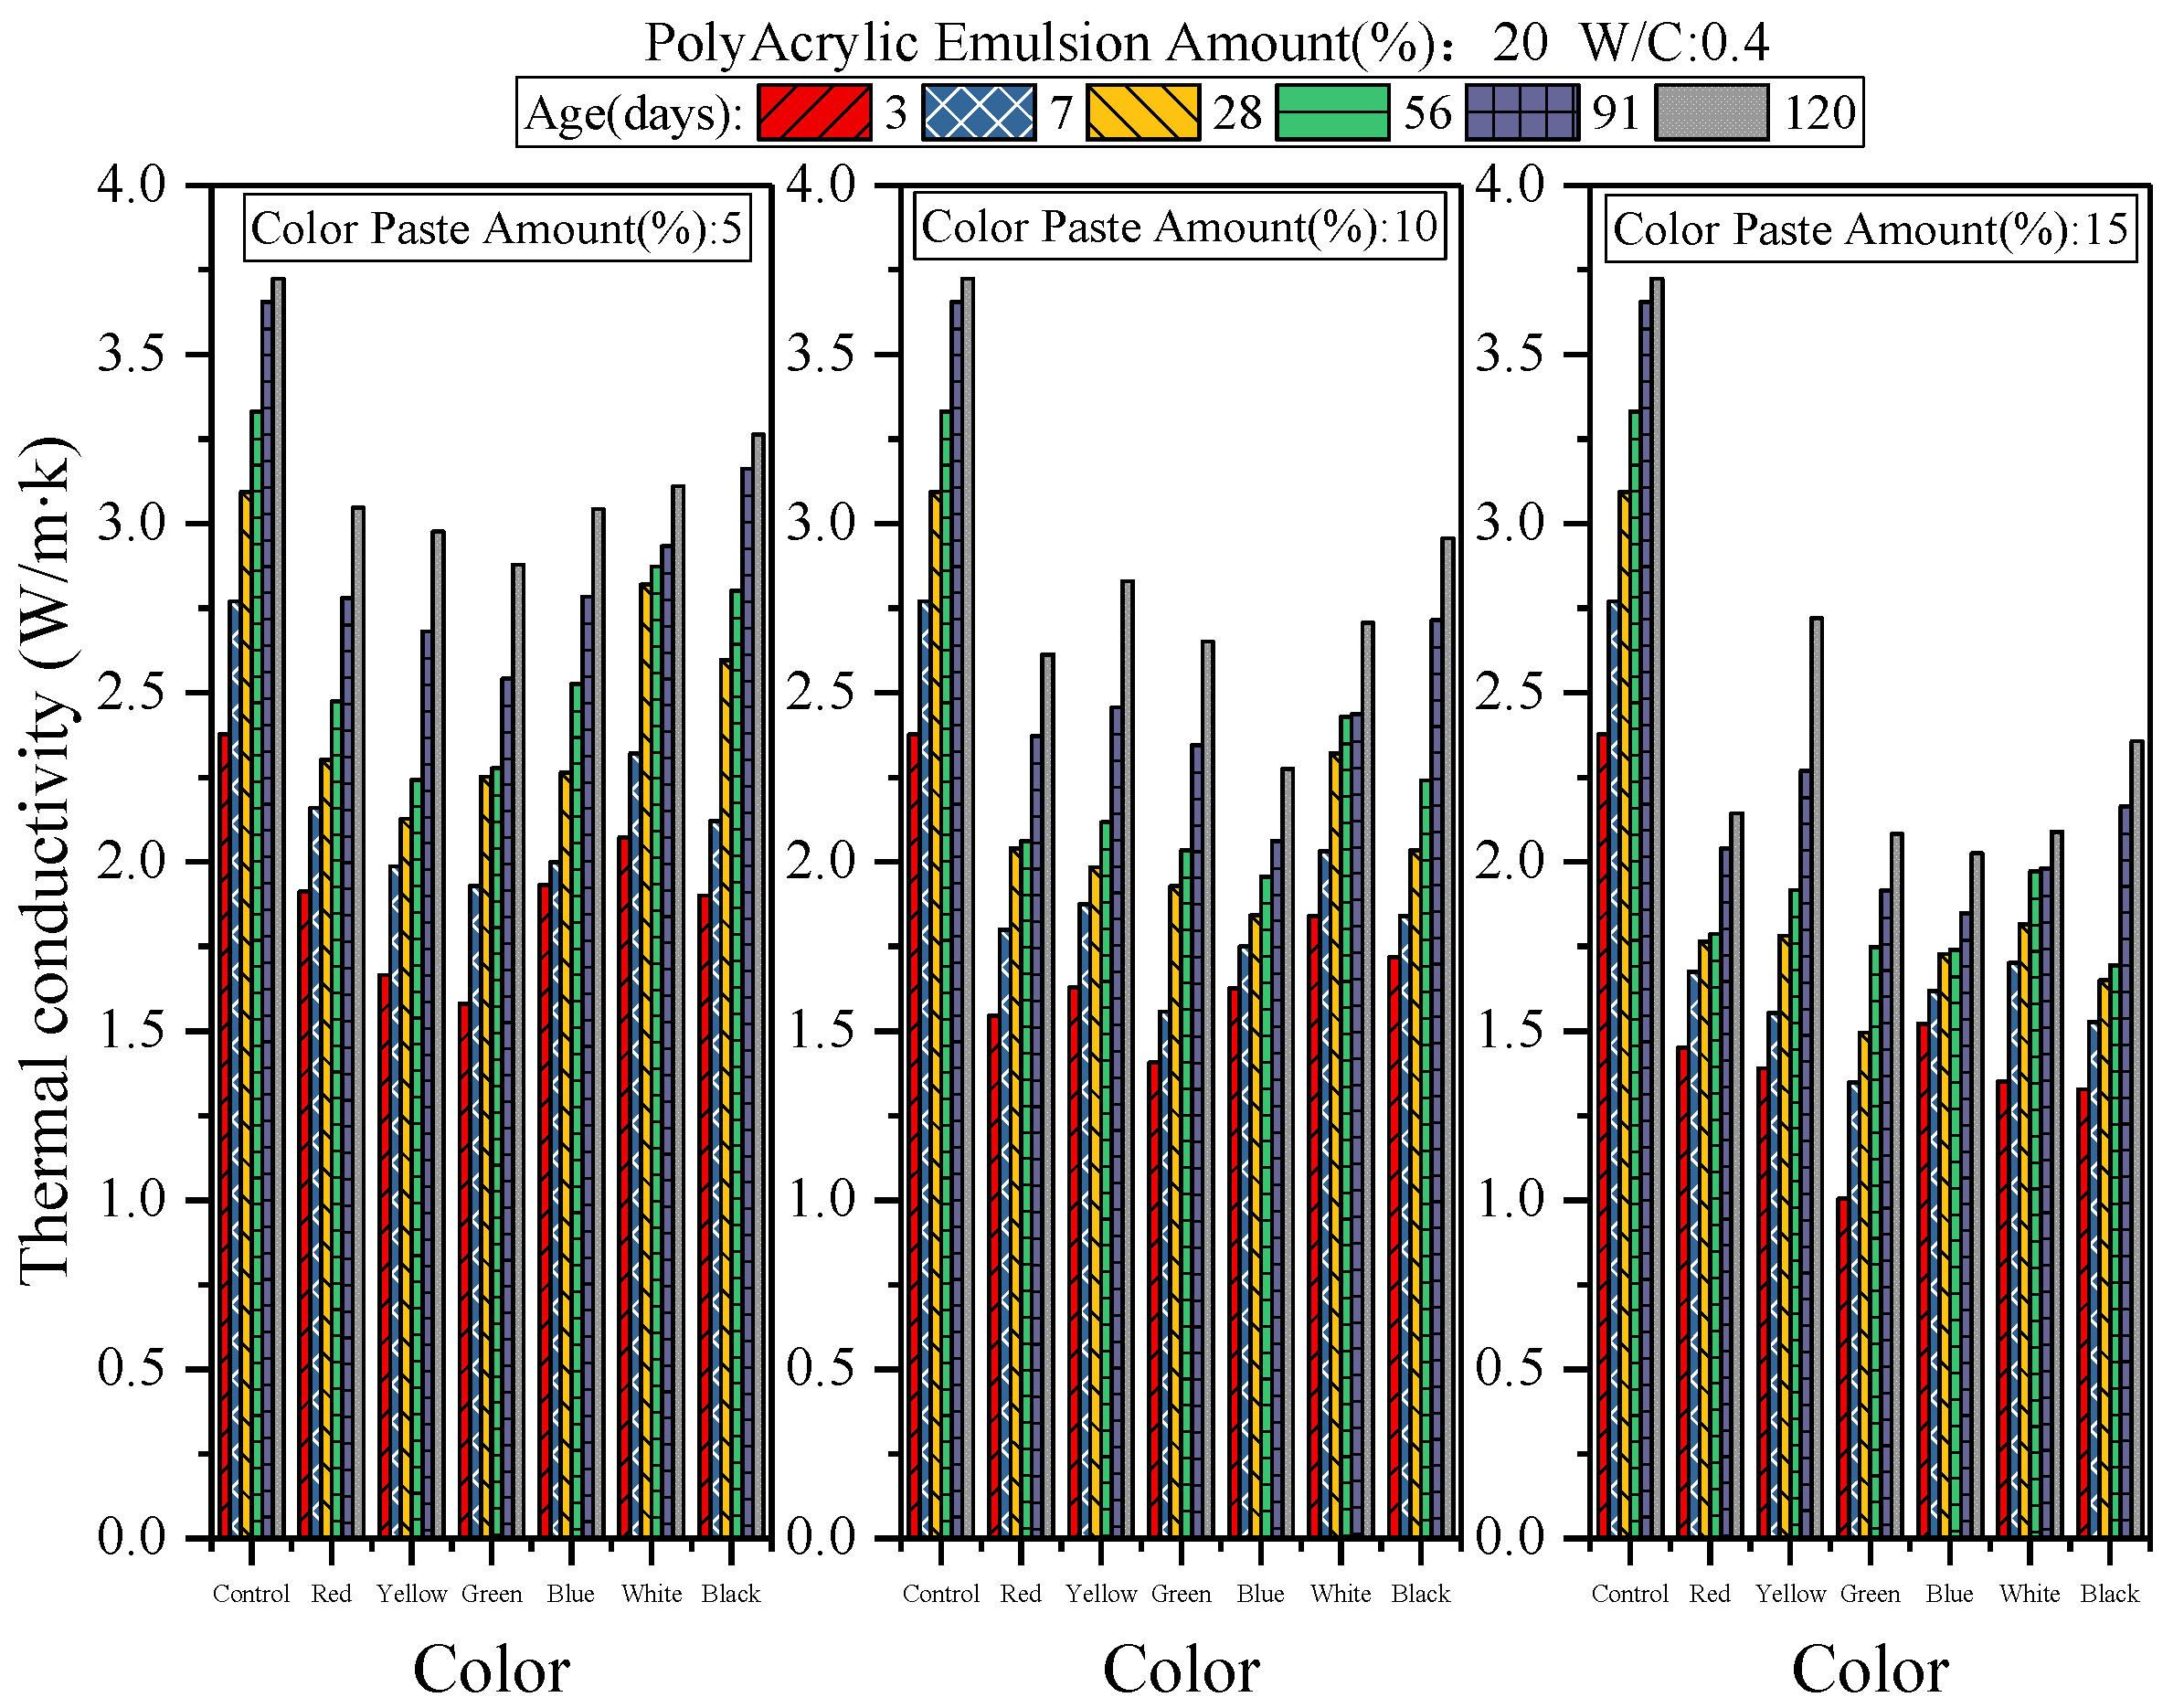
- Thermal conductivity: calculated from the correlation between specimen temperature difference and time variation according to ASTM E1225 [20]. Higher conductivity coefficient represents lower porosity of the specimen and better compactness, but a weaker thermal insulation effect.
- (9)
- Length changes at different ages: measured according to ASTM C157 [21] to judge the volume stability of mortar.
2.3. Test Variables and Mix Proportions
- (1)
- Water-cement ratio: 0.4
- (2)
- Polyacrylic emulsion content: 20%
- (3)
- Inorganic color paste content: 5, 10 and 15%
- (4)
- Age: 3, 7, 28, 56, 91 and 120 days
- (5)
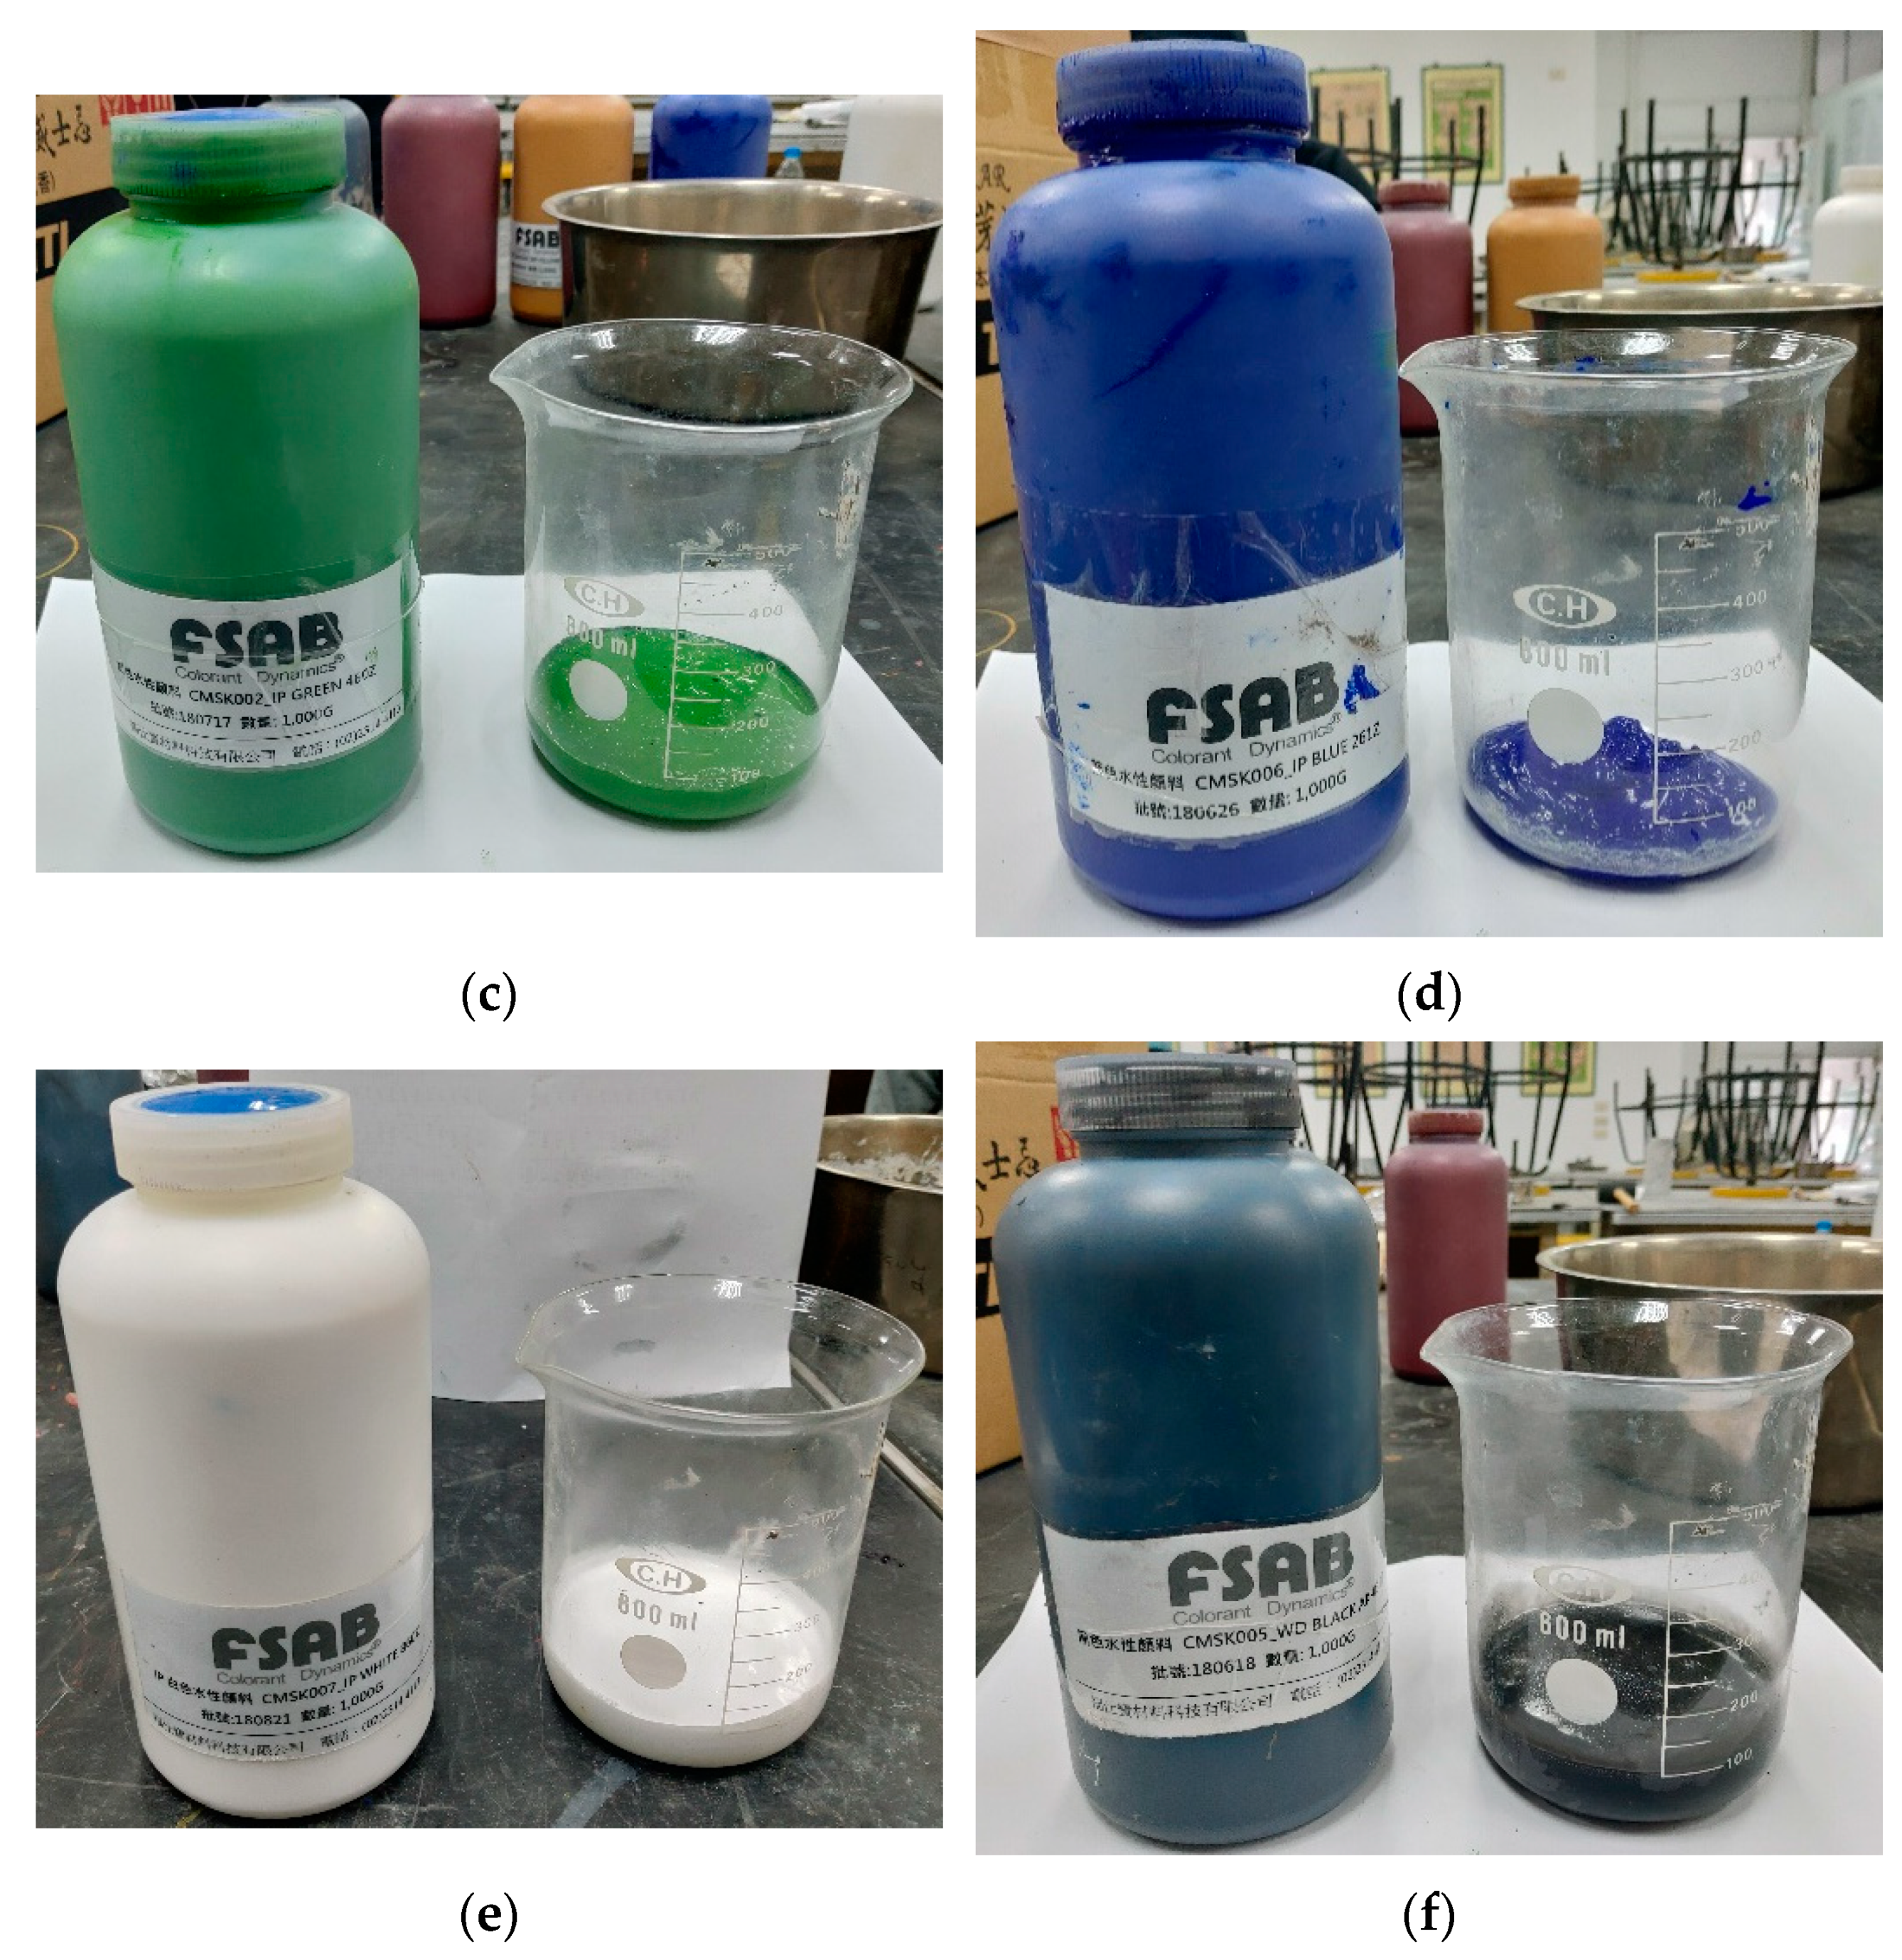
- Color variables: control group, red, yellow, green, blue, white, and black
3. Results and Discussion
- (1)
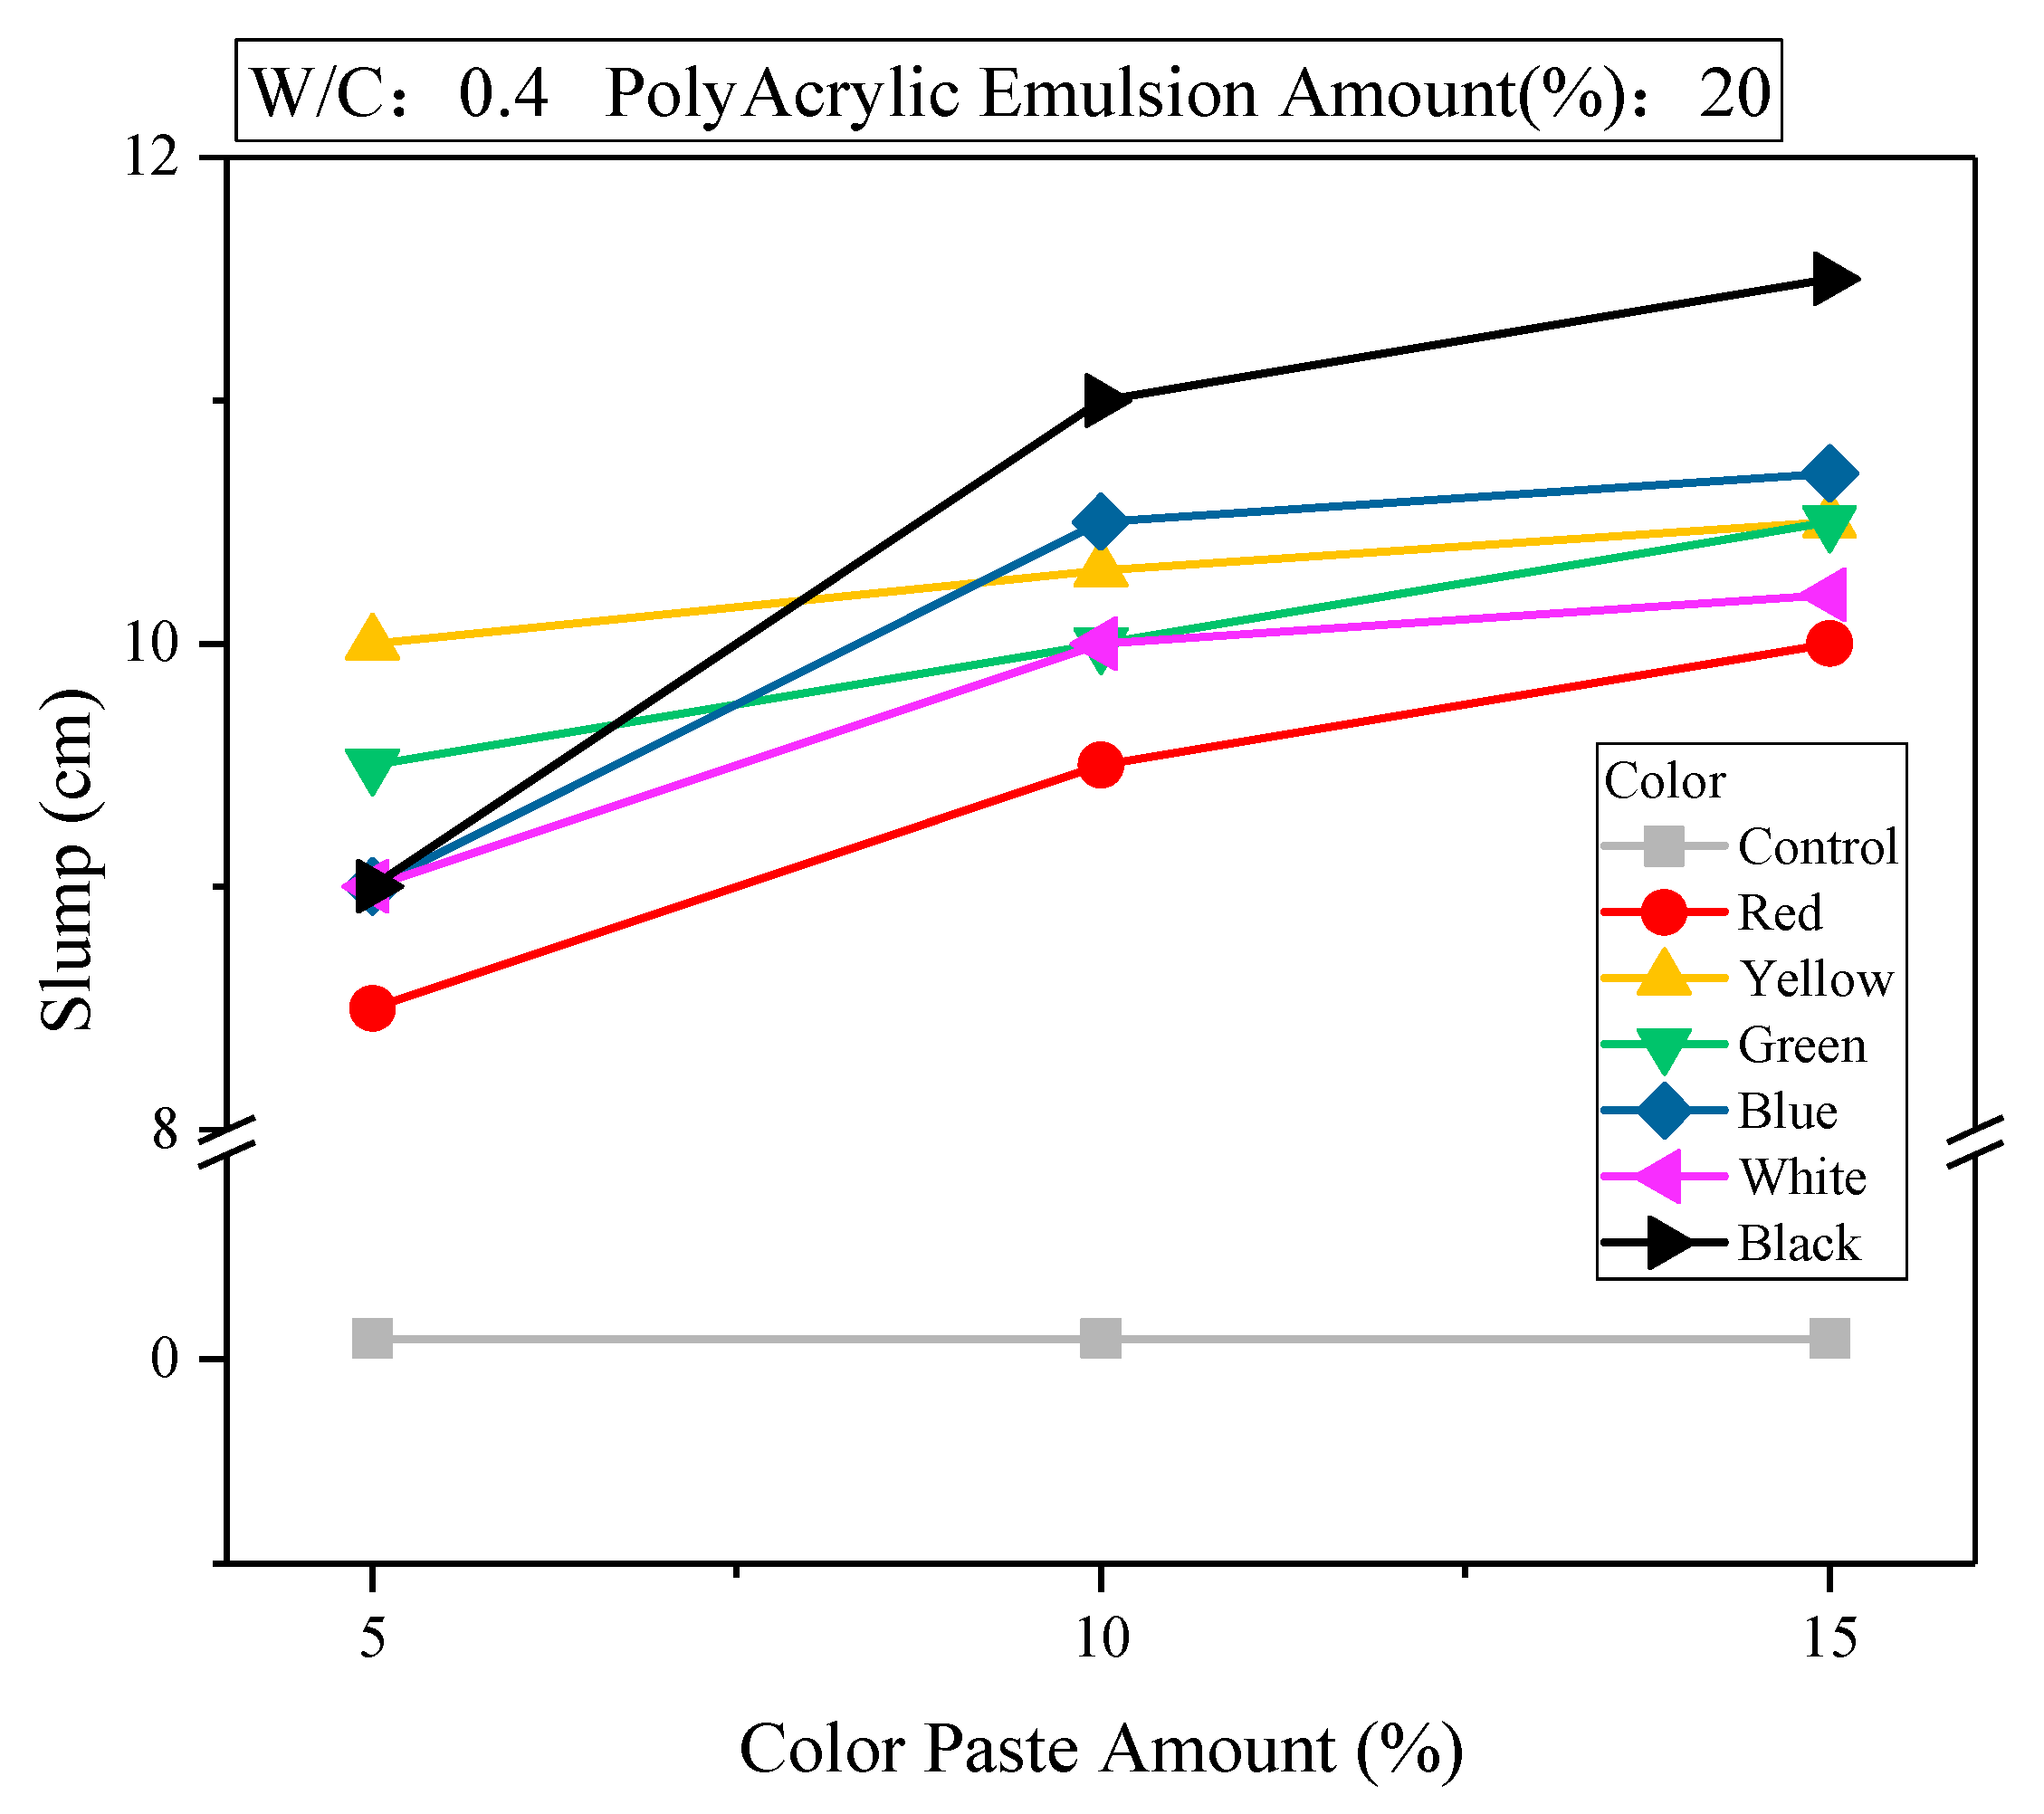
- Slump
- (2)
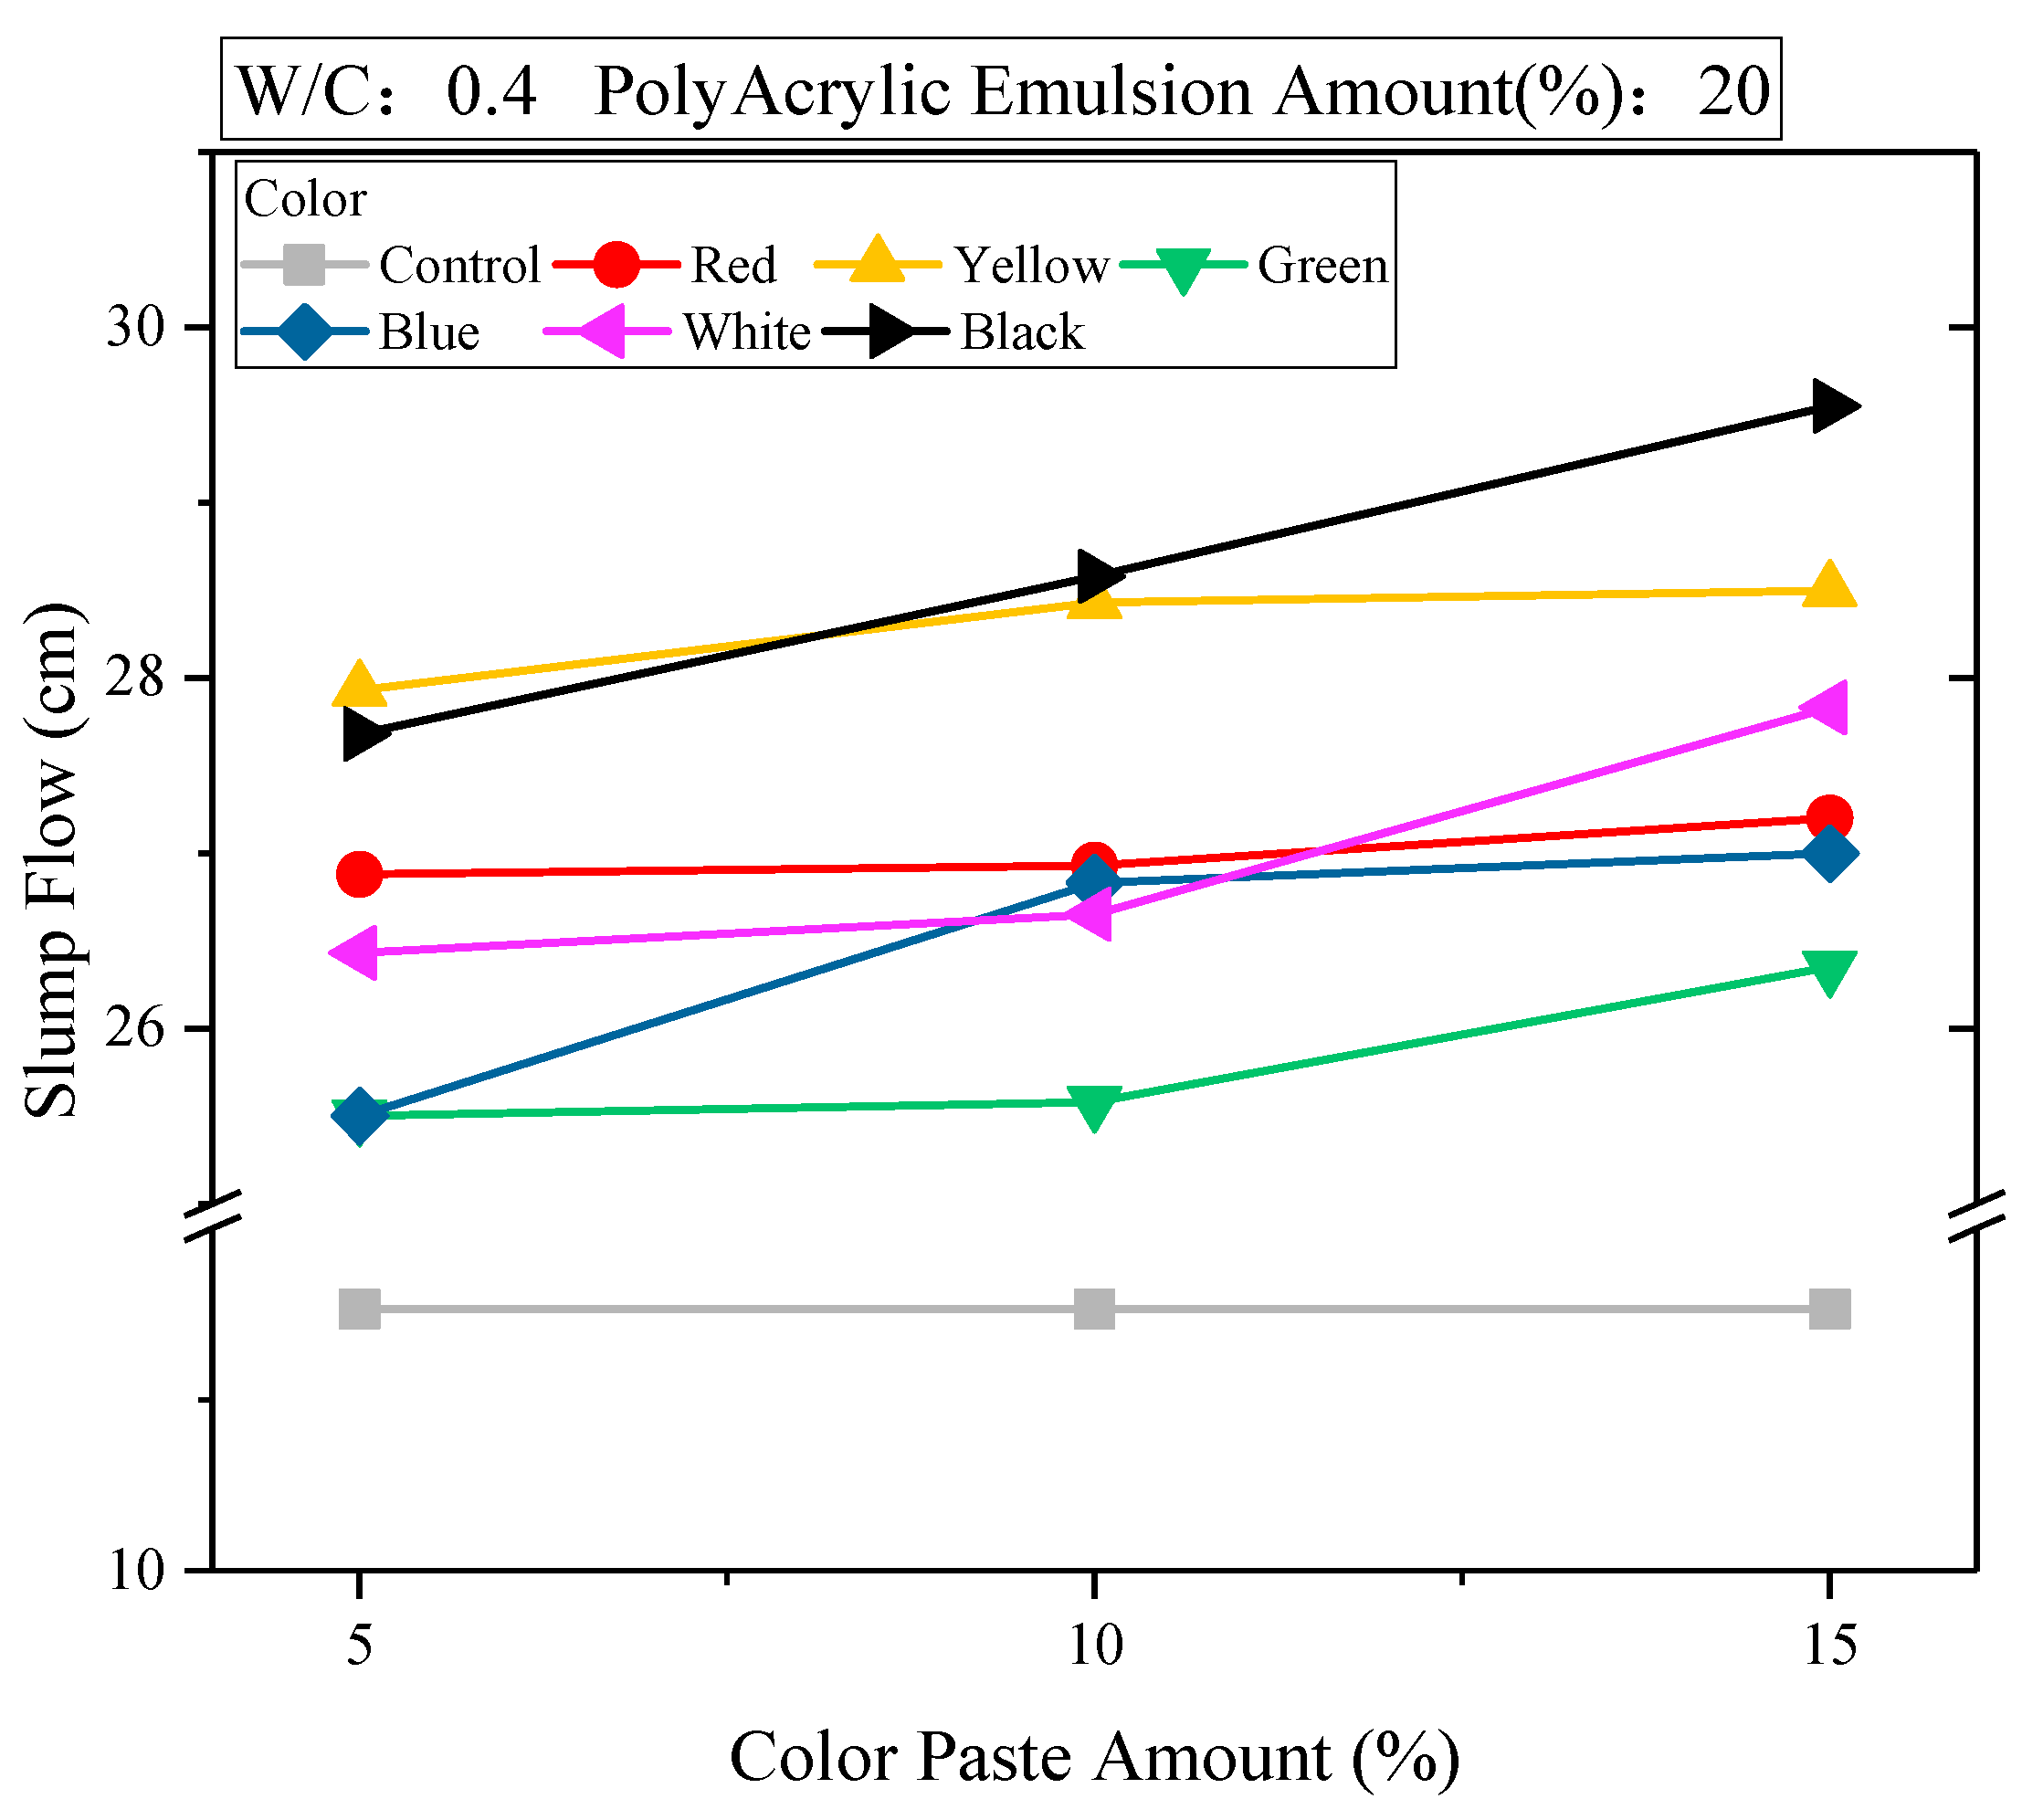
- Slump flow
- (3)
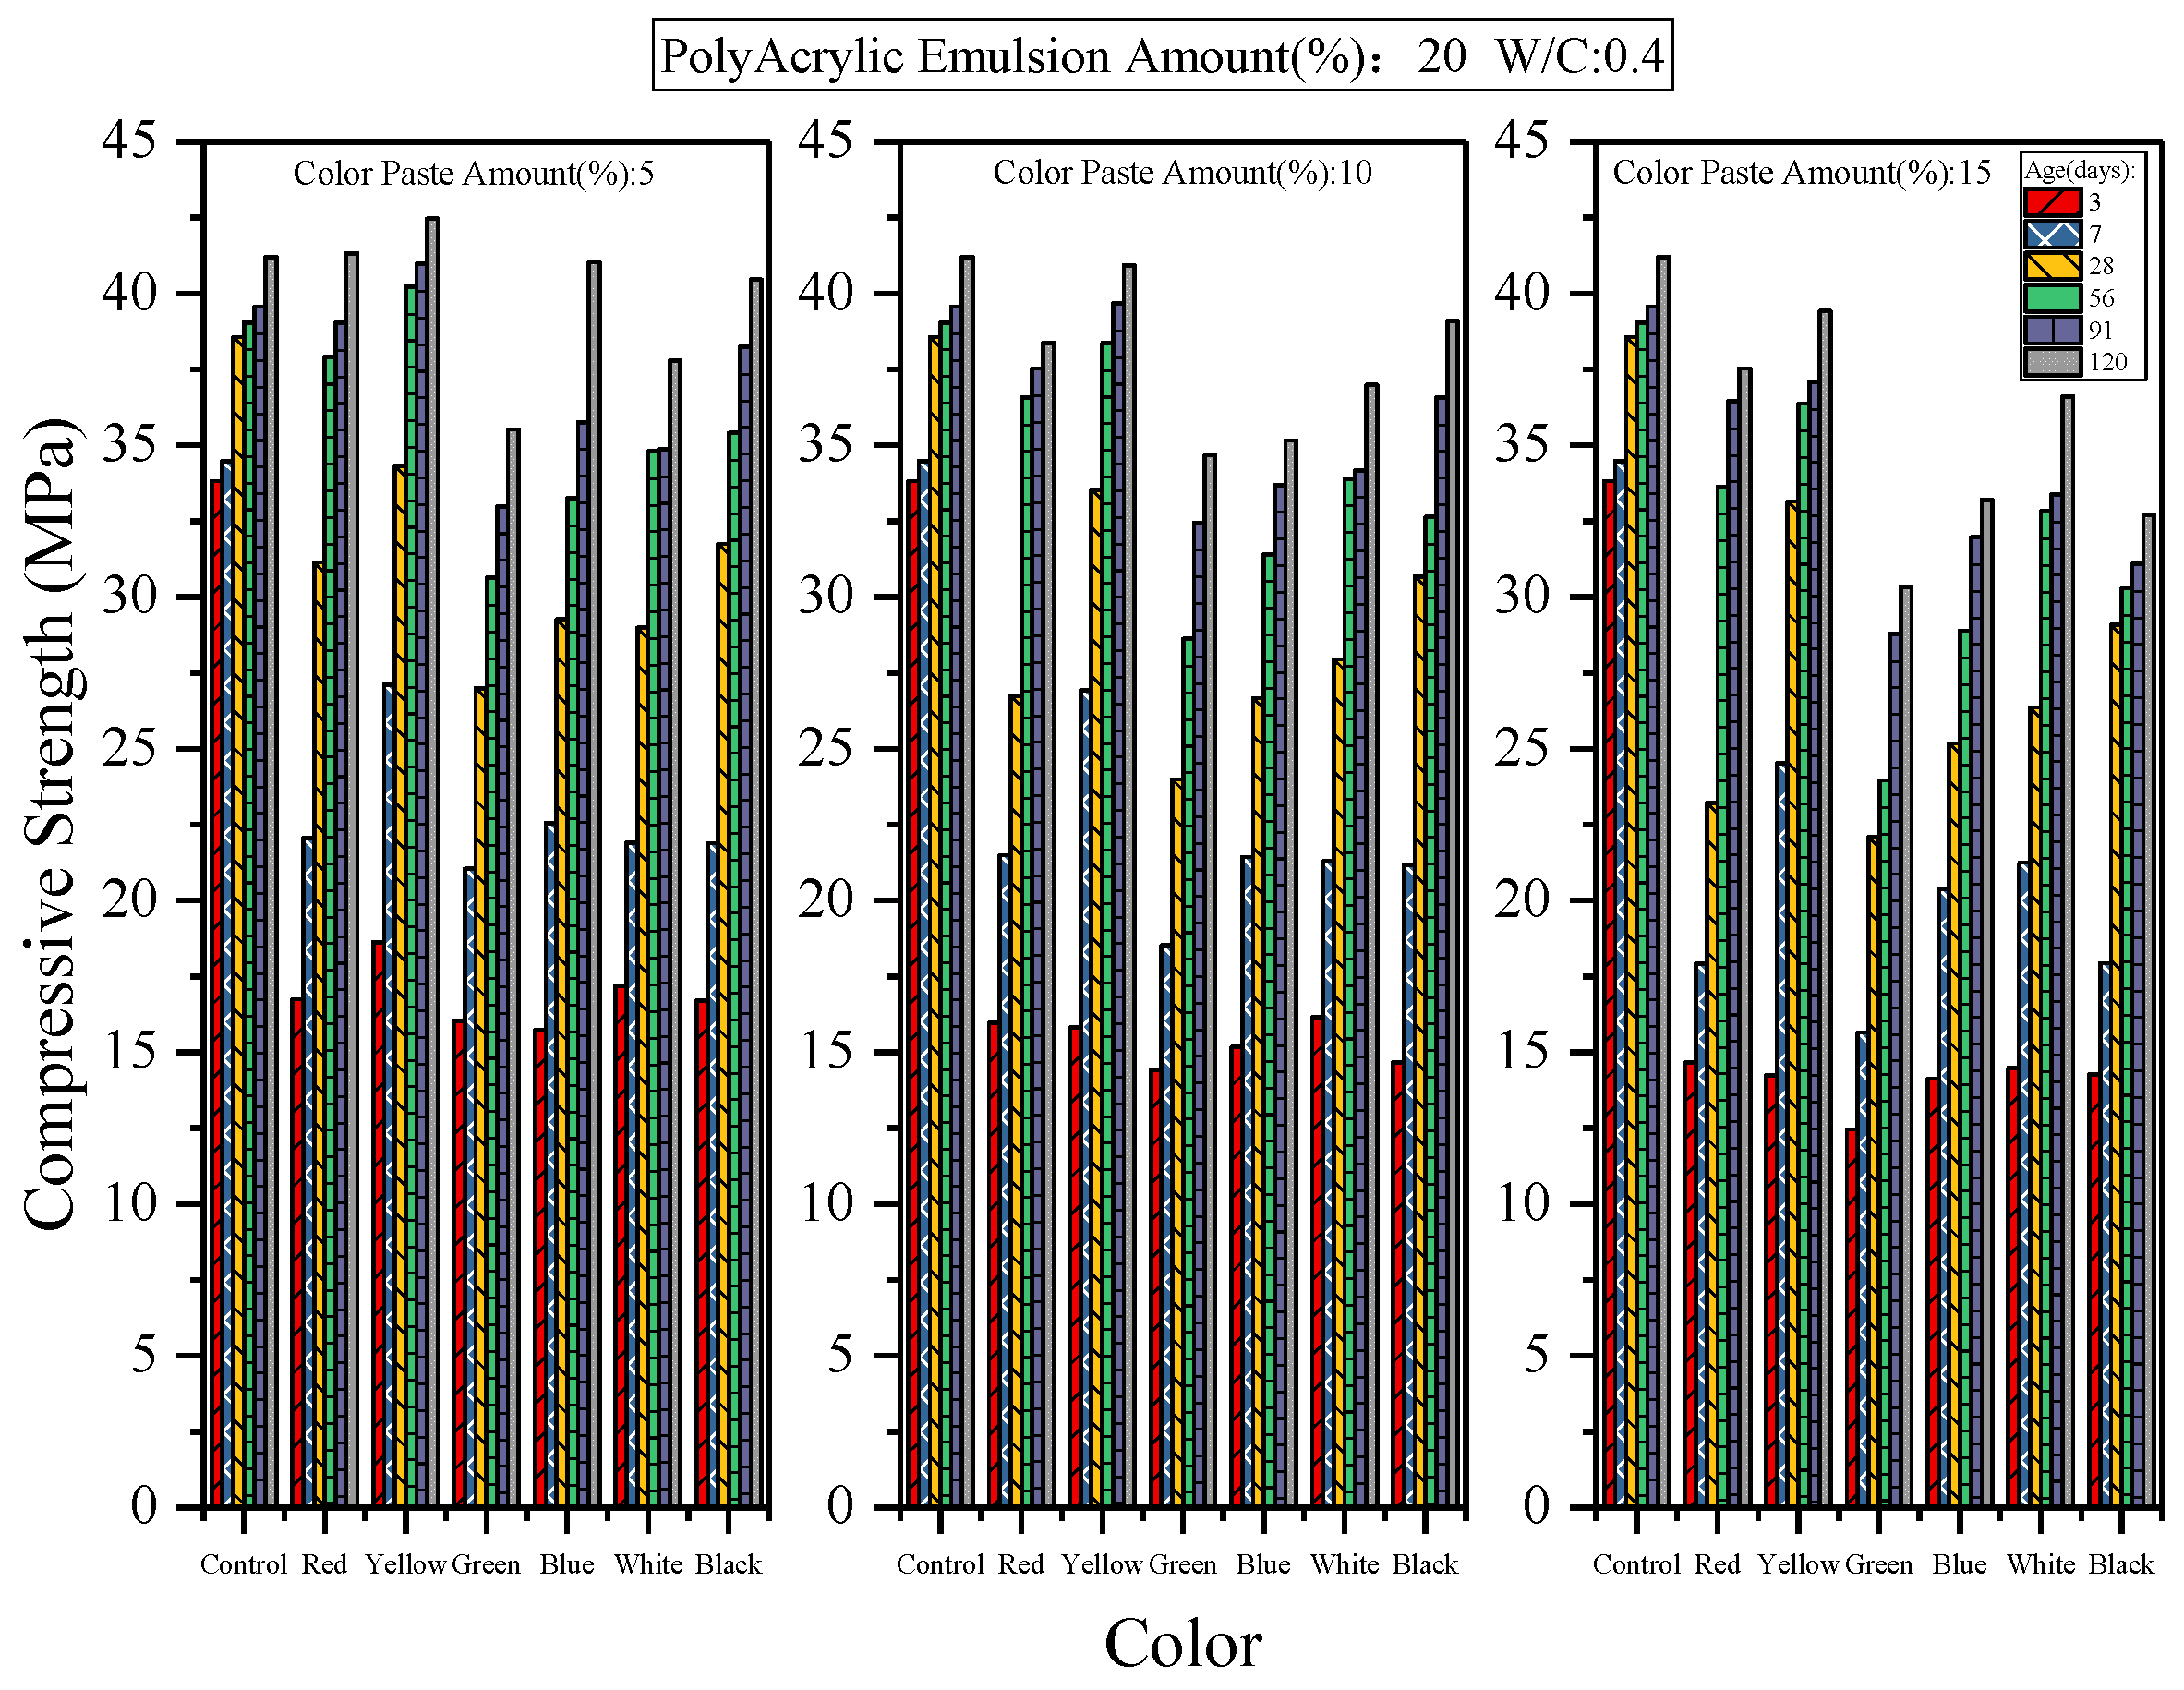
- Compressive strength
- (4)
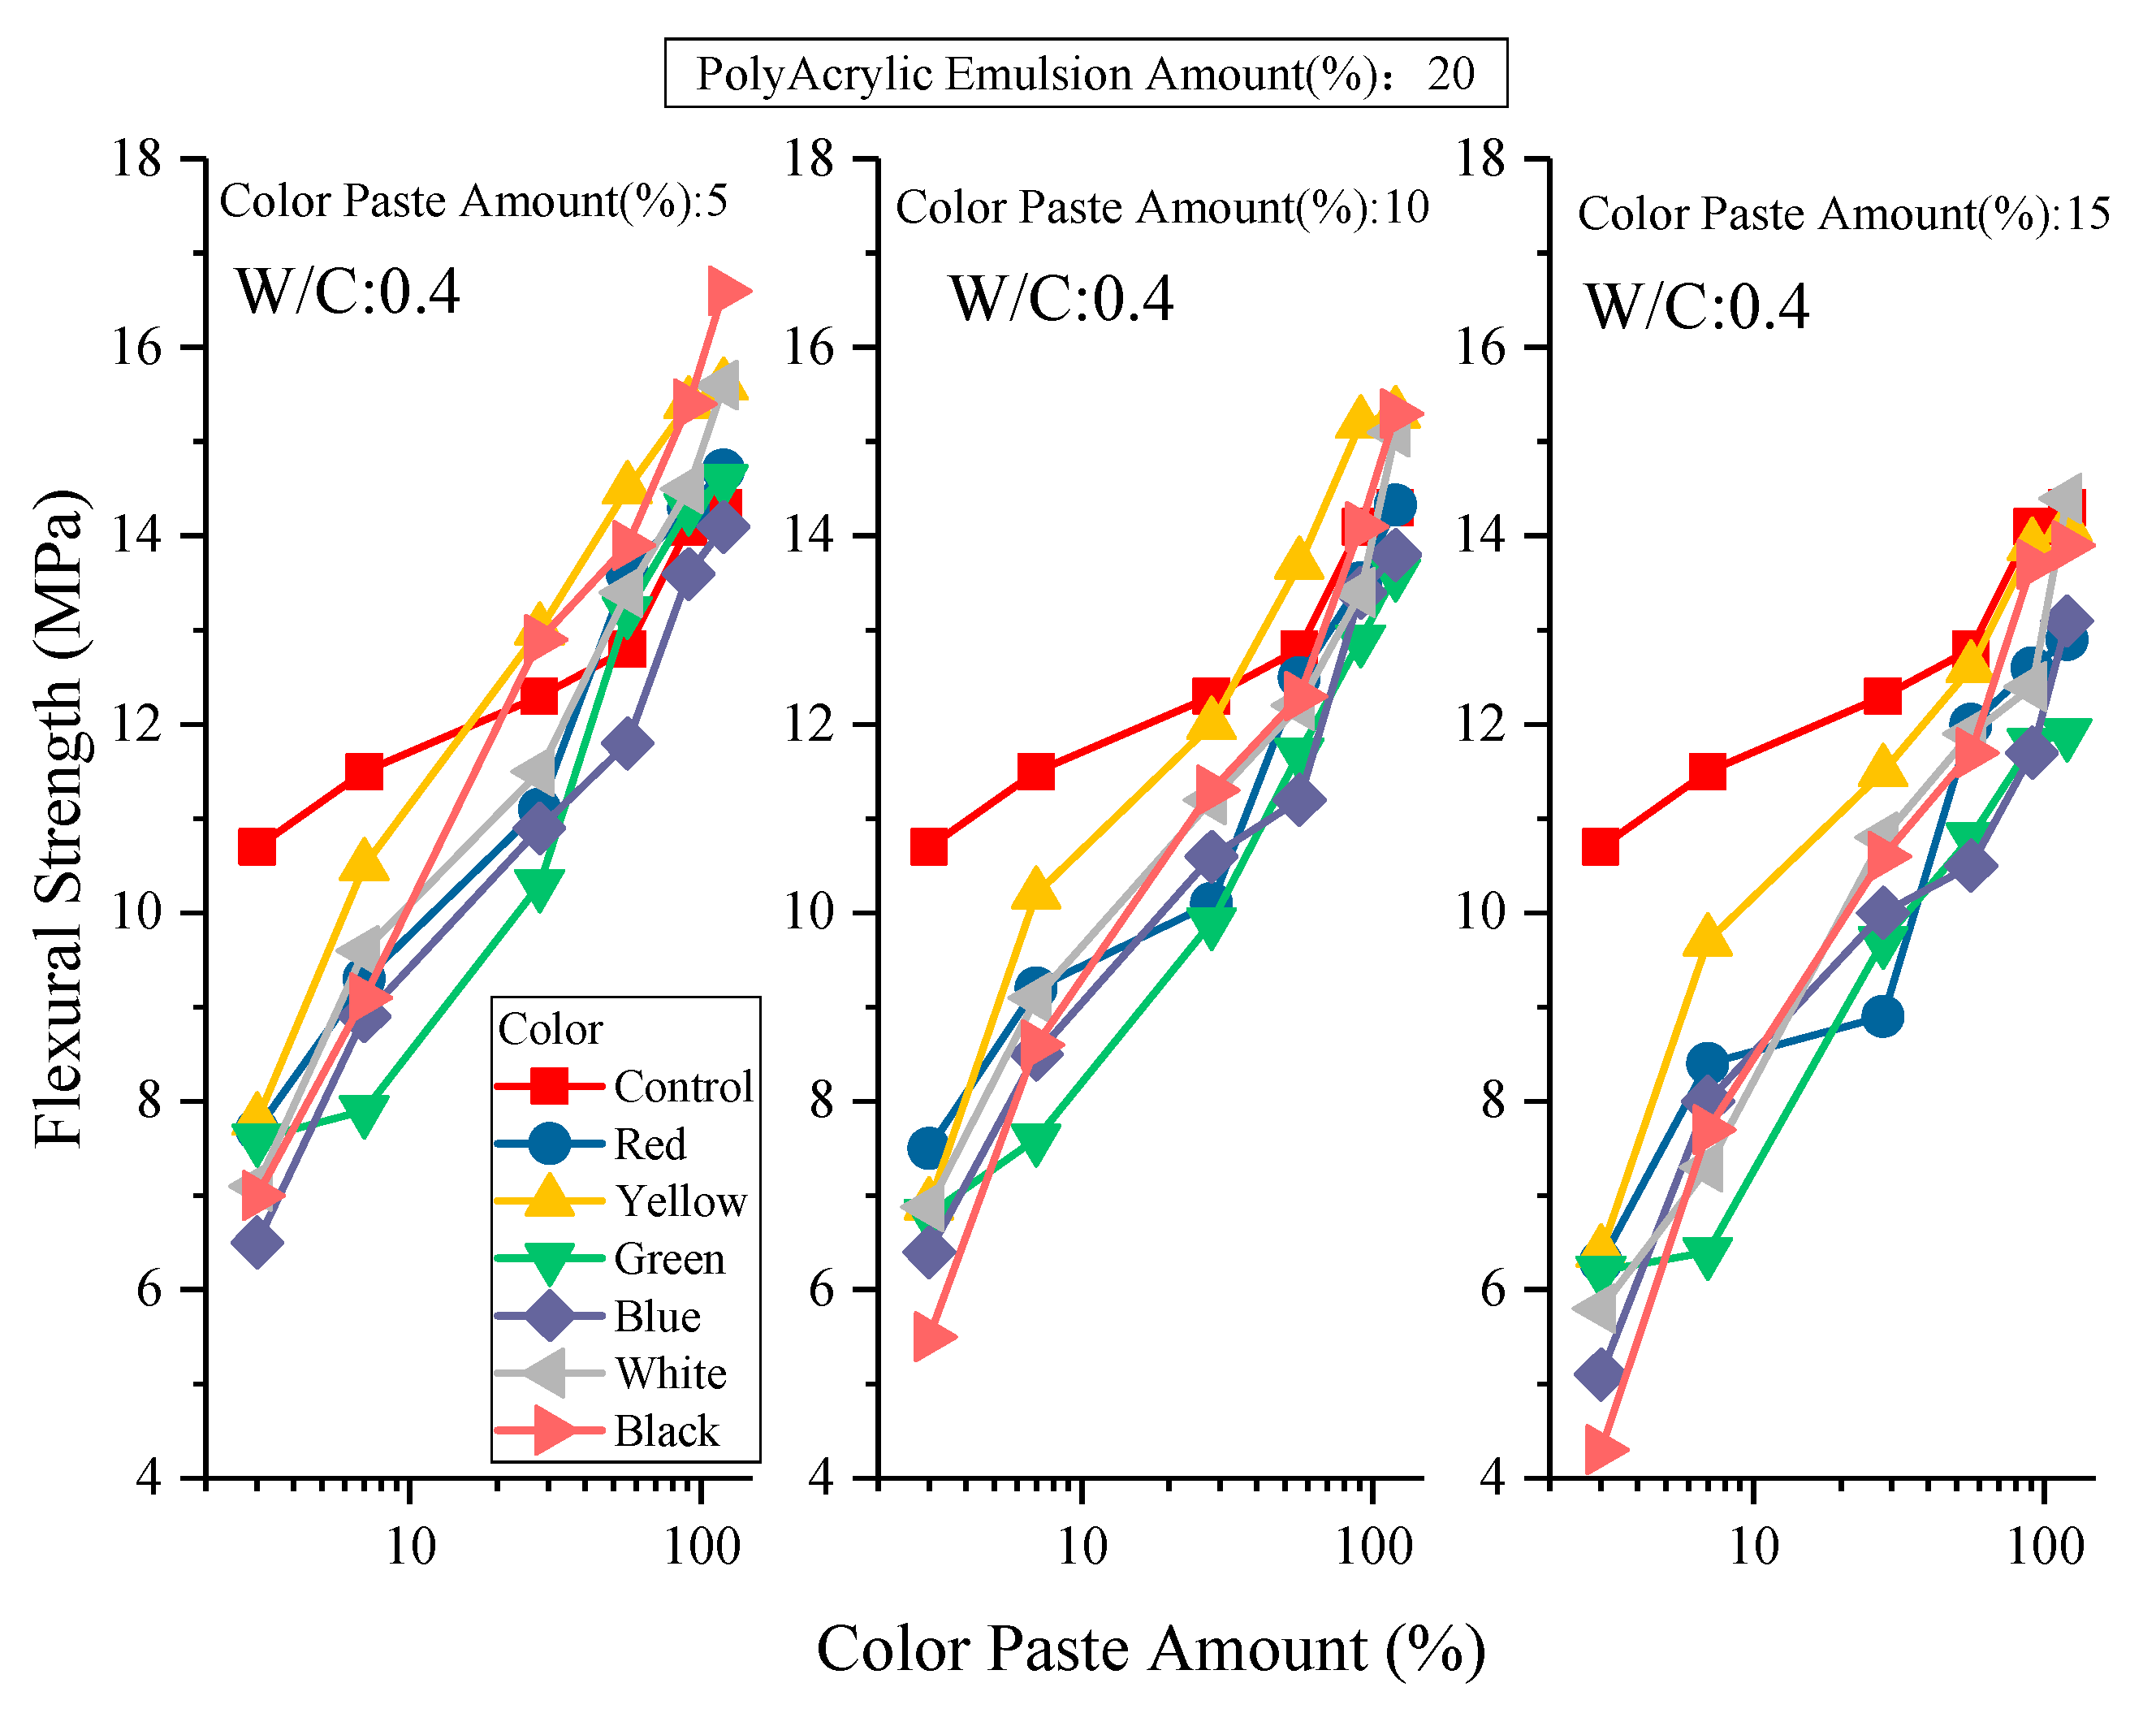
- Flexural strength
- (5)
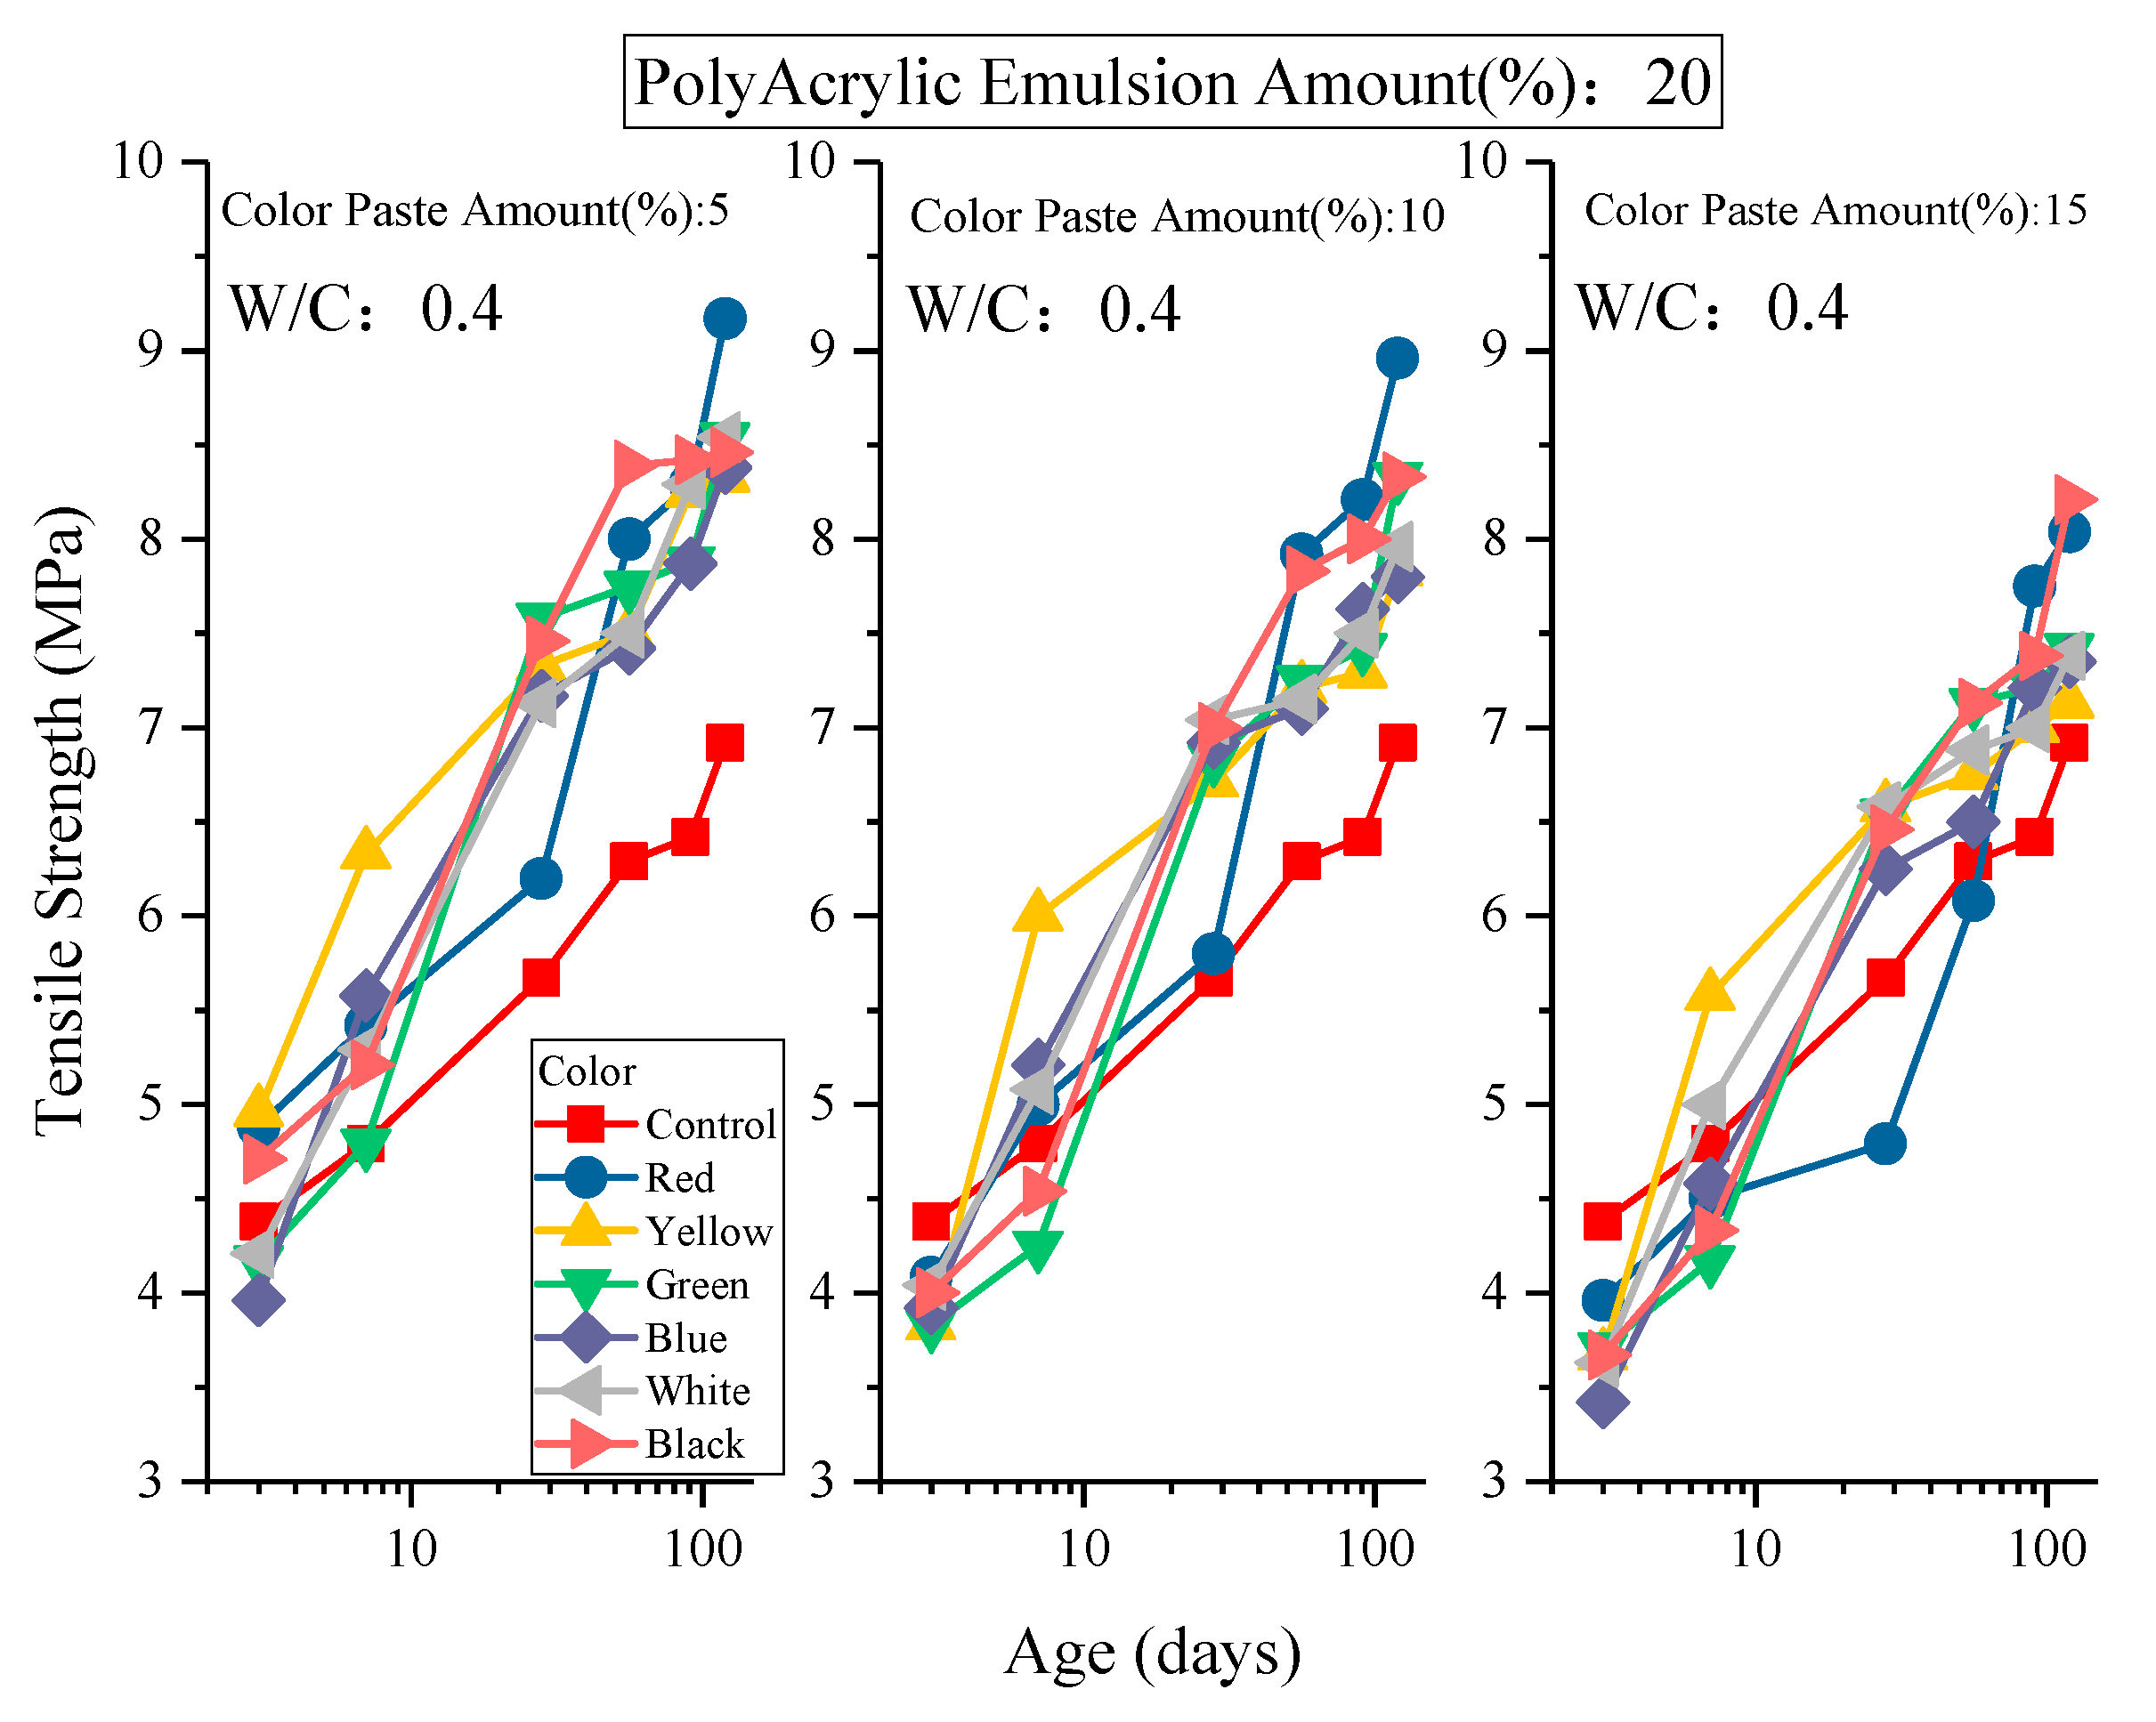
- Tensile strength
- (6)
- Ultrasonic pulse velocity
- (7)
- Surface resistivity
- (8)
- Thermal conductivity
4. Conclusions
- The slump and slump flow increase with the content of inorganic color paste. The black inorganic color paste has the best fresh properties, the yellow inorganic color paste takes second place, and the other colors have insignificant differences.
- The compressive strength decreases as the content of inorganic color paste increases, meaning a high content of inorganic color paste has negative influence on hardened properties. The addition of polyacrylic emulsion can reduce the specimen compactness, and the hardened properties degrade accordingly. The yellow inorganic color paste is the most effective on compressive strength; the compressive strength exceeds the control group when the content is 5%. The green inorganic color paste is the least effective on compressive strength.
- The flexural strength and tensile strength decrease as the content of inorganic color paste increases. The polyacrylic emulsion can improve the flexural strength and tensile strength of mortar. The strengths increase at later ages, and even exceed the control group.
- The ultrasonic pulse velocity increases with age. The ultrasonic pulse velocity of colorful mortar with inorganic color paste is lower than the control group. Because the polyacrylic emulsion reduces the specimen compactness, the ultrasonic pulse velocity is lower than 4400 m/s. The content 5% of yellow inorganic color paste has the highest ultrasonic pulse velocity (4321.33 m/s), the content 15% of green inorganic color paste has the lowest ultrasonic pulse velocity (3750.33 m/s).
- The resistivity decreases as the content of inorganic color paste increases. The trend of resistivity is different from the ultrasonic pulse velocity at late age. As the specimen shall be wet in quadrupole-type resistance measurement, the curing environment of this experiment is atmosphere, the specimen is too dry, and the measured resistivity is too high.
- The thermal conductivity and length change decrease as the content of inorganic color paste increases. The addition of polyacrylic emulsion results in pores in the specimen, so that the thermal conductivity decreases. Various colors have insignificant differences in length change. There is no significant difference between the length change and the control group.
- The addition of inorganic color paste will slightly reduce the hardening properties of the colored cement mortar, but the addition of 5% inorganic color paste can effectively improve the properties of the fresh mix. In this study, adding 20% PolyAcrylic Emulsion can improve the engineering properties (flexural strength, tensile strength) and durability of the colored cement mortar, and achieve the advantages of workability, durability and aesthetics.
Author Contributions
Funding
Conflicts of Interest
References
- Hu, J.-J. Study on the Engineering Properties of Colored Cement Mortar. Master’s Thesis, National Pingtung University of Science and Technology, Neipu, Taiwan, 2011. [Google Scholar]
- Jiang, Z.-R. Key Success Factor for the Renovation on the outer Wall of Old buildings applying the Double Wall Rehabilitation Technique. Master’s Thesis, China University of Science and Technology, Taipei, Taiwan, 2017. [Google Scholar]
- Jiang, Z.-Y. A Study on the Discussion on the Shortage of Construction Workers from the Perspective of Engineering Personnel. Master’s Thesis, National Kaohsiung University of Science and Technology, Kaohsiung City, Taiwan, 2020. [Google Scholar]
- Feng, L.; Peng, Z.; Fei, Y. Discussion on application of color cement in military camouflage. New Chem. Mater. 2004, 9, 42–43. [Google Scholar]
- Dow, C.; Glasser, F. Calcium carbonate efflorescence on Portland cement and building materials. Cem. Concr. Res. 2003, 33, 147–154. [Google Scholar] [CrossRef]
- Pel, L.L.; Huinink, H.H.; Kopinga, K.K.; Van Hees, R.R.; Adan, O.O. Efflorescence pathway diagram: Understanding salt weathering. Constr. Build. Mater. 2004, 18, 309–313. [Google Scholar] [CrossRef]
- Pel, L.L.; Huinink, H.H.; Kopinga, K.K. Salt transport and crystallization in porous building materials. Magn. Reson. Imaging 2003, 21, 317–320. [Google Scholar] [CrossRef]
- Jhang, F.-D. Application of Pigments in Colored Concrete; China Concrete and Cement Products: Suzhou, China, 2009; pp. 50–53. [Google Scholar]
- Liu, K.-T. Applicability of Epoxy Resin and Acrylic Resin Pastes for Repairing Cracks. Master’s Thesis, National Taiwan Ocean University, Keelung, Taiwan, 2011. [Google Scholar]
- ASTM C150, Standard Specification for Portland Cement; ASTM: Philadelphia, PA, USA, 2009.
- ASTM C1602, Standard Specification for Mixing Water Used in the Production of Hydraulic Cement Concrete; ASTM: Philadelphia, PA, USA, 2018.
- ASTM C33, Standard Specification for Concrete Aggregates; ASTM: Philadelphia, PA, USA, 2018.
- ASTM C143, Standard Test Method for Slump of Hydraulic-Cement Concrete; ASTM: Philadelphia, PA, USA, 2020.
- ASTM C230, Standard Specification for Flow Table for Use in Tests of Hydraulic Cement; ASTM: Philadelphia, PA, USA, 2008.
- ASTM C109, Standard Test Method for Compressive Strength of Hydraulic Cement Mortars (Using 2-in. or [50-mm] Cube Specimens); ASTM: Philadelphia, PA, USA, 2020.
- ASTM C348, Standard Test Method for Flexural Strength of Hydraulic-Cement Mortars; ASTM: Philadelphia, PA, USA, 2013.
- ASTM C190, Method of Test for Tensile Strength of Hydraulic Cement Mortars; ASTM: Philadelphia, PA, USA, 1985.
- ASTM C597, Standard Test Method for Pulse Velocity Through Concrete; ASTM: Philadelphia, PA, USA, 2009.
- ASTM C876, Standard Test Method for Corrosion Potentials of Uncoated Reinforcing Steel in Concrete; ASTM: Philadelphia, PA, USA, 2015.
- ASTM E1225, Standard Test Method for Thermal Conductivity of Solids Using the Guarded-Comparative-Longitudinal Heat Flow Technique; ASTM: Philadelphia, PA, USA, 2020.
- ASTM C157, Standard Test Method for Length Change of Hardened Hydraulic-Cement Mortar and Concrete; ASTM: Philadelphia, PA, USA, 2017.
- Chen, P.-J. The Impact of Acrylic Resin, Lightweight Coarse Aggregate Substitution Rate and Cementitious Material Composition on the Compressive Strength and Quality of Concrete. Master’s Thesis, Kao Yuan University, Kaohsiung, Taiwan, 2015. [Google Scholar]
- Huang, J.-L. Theory and Practice of High Performance Concrete; Chan’s Arch-Publishing Co., Ltd.: Taipei City, Taiwan, 2006. [Google Scholar]
- Wang, H.-Y.; Wang, W.-C.; Wang, J.C.; Chen, Y.-W. Evaluation of the engineering properties and durability of mortar produced using ground granulated blast-furnace slag and stainless steel reduced slag. Constr. Build. Mater. 2021, 280, 122498. [Google Scholar] [CrossRef]


| Physical Properties | Chemical Contents (%) | ||
|---|---|---|---|
| Solid content | 50 ± 1% | PolyAcrylic Emulsion | 50 ± 1 |
| Viscosity | Under 500 cPs | Water | 50 ± 1 |
| pH | 9.0–10.0 | - | - |
| Color | Red | Yellow | Green | Blue | White | Black | |
|---|---|---|---|---|---|---|---|
| Physical Properties | |||||||
| Grind-meter value (max, μm) | 15 | 15 | 20 | 20 | 10 | 10 | |
| Viscosity (KU) | 86 | 79 | 84 | 75 | 83 | 86 | |
| Non-volatile (%) | 75.4 | 54.5 | 58.5 | 58.9 | 72.3 | 64.6 | |
| Specific Gravity | 2.08 | 1.67 | 1.74 | 1.45 | 2.07 | 1.93 | |
| pH | 7.92 | 7.9 | 8.2 | 7.02 | 7.32 | 7.7 | |
| Tinting shade (ΔE) | −0.14 | 0.25 | 0.34 | 0.31 | 0.03 | 0.43 | |
| Tinting Strength (%) | 99.4 | 99.35 | 98.7 | 102.16 | 99.86 | 99.39 | |
| AM (%) | PolyAcrylic Emulsion (kg/m3) | AM (%) | Color Paste (kg/m3) | Cement (kg/m3) | Sand (kg/m3) | Water (kg/m3) |
|---|---|---|---|---|---|---|
| 0 * | 0 * | 0 * | 0 * | 624.26 | 1534.88 | 187.28 |
| 20 | 124.85 | 5 | 93.64 | |||
| 10 | 124.85 | |||||
| 15 | 156.07 |
| Color | AM (%) | Age (Days) Unit: MPa | ||||||
|---|---|---|---|---|---|---|---|---|
| PolyAcrylic Emulsion | Color Paste | 3 | 7 | 28 | 56 | 91 | 120 | |
| Control | 0 | 0 | 33.81 | 34.48 | 38.57 | 39.04 | 39.57 | 41.2 |
| Red | 20 | 5 | 16.74 | 22.06 | 31.14 | 37.91 | 39.03 | 41.32 |
| 10 | 15.97 | 21.5 | 26.75 | 36.57 | 37.53 | 38.36 | ||
| 15 | 14.66 | 17.92 | 23.21 | 33.62 | 36.45 | 37.52 | ||
| Yellow | 20 | 5 | 18.63 | 27.12 | 34.31 | 40.22 | 40.98 | 42.47 |
| 10 | 15.81 | 26.93 | 33.54 | 38.36 | 39.67 | 40.92 | ||
| 15 | 14.24 | 24.52 | 33.15 | 36.37 | 37.09 | 39.42 | ||
| Green | 20 | 5 | 16.04 | 21.05 | 26.99 | 30.63 | 32.98 | 35.52 |
| 10 | 14.41 | 18.52 | 23.99 | 28.62 | 32.45 | 34.67 | ||
| 15 | 12.45 | 15.65 | 22.09 | 23.96 | 28.78 | 30.32 | ||
| Blue | 20 | 5 | 15.74 | 22.55 | 29.26 | 33.25 | 35.76 | 41.03 |
| 10 | 15.17 | 21.44 | 26.67 | 31.41 | 33.69 | 35.16 | ||
| 15 | 14.13 | 20.39 | 25.17 | 28.89 | 31.97 | 33.2 | ||
| White | 20 | 5 | 17.2 | 21.91 | 28.99 | 34.8 | 34.87 | 37.79 |
| 10 | 16.16 | 21.29 | 27.94 | 33.9 | 34.18 | 36.99 | ||
| 15 | 14.48 | 21.24 | 26.36 | 32.82 | 33.37 | 36.61 | ||
| Black | 20 | 5 | 16.71 | 21.89 | 31.74 | 35.41 | 38.24 | 40.46 |
| 10 | 14.68 | 21.18 | 30.68 | 32.63 | 36.57 | 39.09 | ||
| 15 | 14.27 | 17.93 | 29.08 | 30.29 | 31.09 | 32.7 | ||
| Color | AM (%) | Age (Days) Unit:m/s | ||||||
|---|---|---|---|---|---|---|---|---|
| PolyAcrylic Emulsion | Color Paste | 3 | 7 | 28 | 56 | 91 | 120 | |
| Control | 0 | 0 | 4037 | 4307 | 4414 | 4465 | 4468 | 4479 |
| Red | 20 | 5 | 3660 | 4004 | 4046 | 4067 | 4147 | 4286 |
| 10 | 3635 | 3979 | 4004 | 4024 | 4088 | 4227 | ||
| 15 | 3633 | 3917 | 3949 | 4004 | 4023 | 4167 | ||
| Yellow | 20 | 5 | 3799 | 4035 | 4147 | 4172 | 4266 | 4321 |
| 10 | 3754 | 3979 | 4010 | 4100 | 4167 | 4313 | ||
| 15 | 3615 | 3901 | 3941 | 3949 | 3979 | 4195 | ||
| Green | 20 | 5 | 3660 | 3827 | 3920 | 3949 | 3992 | 4144 |
| 10 | 3571 | 3717 | 3827 | 3846 | 3930 | 4056 | ||
| 15 | 3377 | 3484 | 3489 | 3495 | 3573 | 3750 | ||
| Blue | 20 | 5 | 3615 | 3812 | 3827 | 3917 | 4000 | 4085 |
| 10 | 3574 | 3763 | 3770 | 3850 | 3949 | 4033 | ||
| 15 | 3571 | 3660 | 3700 | 3800 | 3850 | 3901 | ||
| White | 20 | 5 | 3531 | 3878 | 4000 | 4035 | 4041 | 4133 |
| 10 | 3533 | 3671 | 3919 | 3937 | 3941 | 4111 | ||
| 15 | 3473 | 3533 | 3617 | 3660 | 3752 | 3799 | ||
| Black | 20 | 5 | 3660 | 3866 | 3917 | 3917 | 3930 | 4004 |
| 10 | 3614 | 3752 | 3827 | 3878 | 3905 | 3917 | ||
| 15 | 3530 | 3689 | 3803 | 3850 | 3867 | 3917 | ||
Publisher’s Note: MDPI stays neutral with regard to jurisdictional claims in published maps and institutional affiliations. |
© 2021 by the authors. Licensee MDPI, Basel, Switzerland. This article is an open access article distributed under the terms and conditions of the Creative Commons Attribution (CC BY) license (https://creativecommons.org/licenses/by/4.0/).
Share and Cite
Huang, J.-M.; Yang, W.-D.; Wang, H.-Y.; Kao, T.-C. Engineering Properties of Colorful Mortar with Inorganic Color Paste. Appl. Sci. 2021, 11, 6297. https://doi.org/10.3390/app11146297
Huang J-M, Yang W-D, Wang H-Y, Kao T-C. Engineering Properties of Colorful Mortar with Inorganic Color Paste. Applied Sciences. 2021; 11(14):6297. https://doi.org/10.3390/app11146297
Chicago/Turabian StyleHuang, Jhih-Ming, Wein-Duo Yang, Her-Yung Wang, and Tien-Chun Kao. 2021. "Engineering Properties of Colorful Mortar with Inorganic Color Paste" Applied Sciences 11, no. 14: 6297. https://doi.org/10.3390/app11146297
APA StyleHuang, J.-M., Yang, W.-D., Wang, H.-Y., & Kao, T.-C. (2021). Engineering Properties of Colorful Mortar with Inorganic Color Paste. Applied Sciences, 11(14), 6297. https://doi.org/10.3390/app11146297