1. Introduction
With the increasing number of scientific publications [
1], scientific researchers (including university students with little research experience) are often faced with an enormous number of studies in their domains of interest. It can be very time-consuming and tedious to read these papers. To alleviate this burden, it is important to find ways whereby papers can be surveyed more efficiently. In this paper, we focus on a summary which briefly describes an overview of scientific research.
One straightforward approach is to read only the “abstract” sections (which are manually written by authors) of papers. While abstracts are intended to attract readers [
2], Elkiss et al. mentioned that abstracts can also be used as summaries of scientific publications [
3]. In general, the abstracts of foreground published papers have been evaluated during the peer-review process by third party researchers, so their quality is guaranteed. However, several researchers claimed that abstracts used do not necessarily meet readers’ requirements because they are written from the perspective of authors [
3,
4]. Hence, instead of author-written abstracts, it is important to stand in the place of the reader who may not have substantive domain-relevant knowledge and construct brief descriptions that help users gain an overview of research papers. In this paper, we consider two types of summaries: abstracts written by authors and text that briefly describes an entire paper’s overview. There are two ways to generate summaries from an original paper.
Several research groups in Japan have attempted to manually construct summaries of academic articles to share knowledge concerning computer science research in, for example, the field of Human–Computer Interaction (HCI) [
5] and Computer Vision (CV) [
6]. As the manual summaries are written from the perspective of readers, it is possible to help other readers understand the research without having to read the target papers. In addition, these manual summaries are written in Japanese, so they are advantageous for these non-native English speakers. However, writing summaries manually is still difficult and tedious since the first readers (who write summaries) must understand the target research papers to a significant extent. In addition, these summaries have not been reviewed by others (i.e., professional reviewers) and the quality of summaries (e.g., adequacy of information) is not guaranteed.
To alleviate the issue of manual summary writing, automatic generation of research summaries (written in readers’ mother tongues) from the original papers has been demanded. In the field of Natural Language Processing (NLP), automatic summarization [
7] and machine translation [
8] are active research topics. Although these techniques can generate research summaries without any manual effort, the majority of work on text summarization has focused on news articles, which are markedly different from scientific publications in terms of text length or document structure [
4,
9,
10]. Moreover, research on manual evaluation of automatic summarization also utilizes news articles as material [
11]. Investigating users’ preference and request is beneficial since summaries are intended to convey information to humans, but the majority of automatic summarization research relies on automatic evaluation metrics [
12]. To establish a framework to automatically generate summaries of scientific papers, we need to elicit readers’ opinions about research article summaries as a first step.
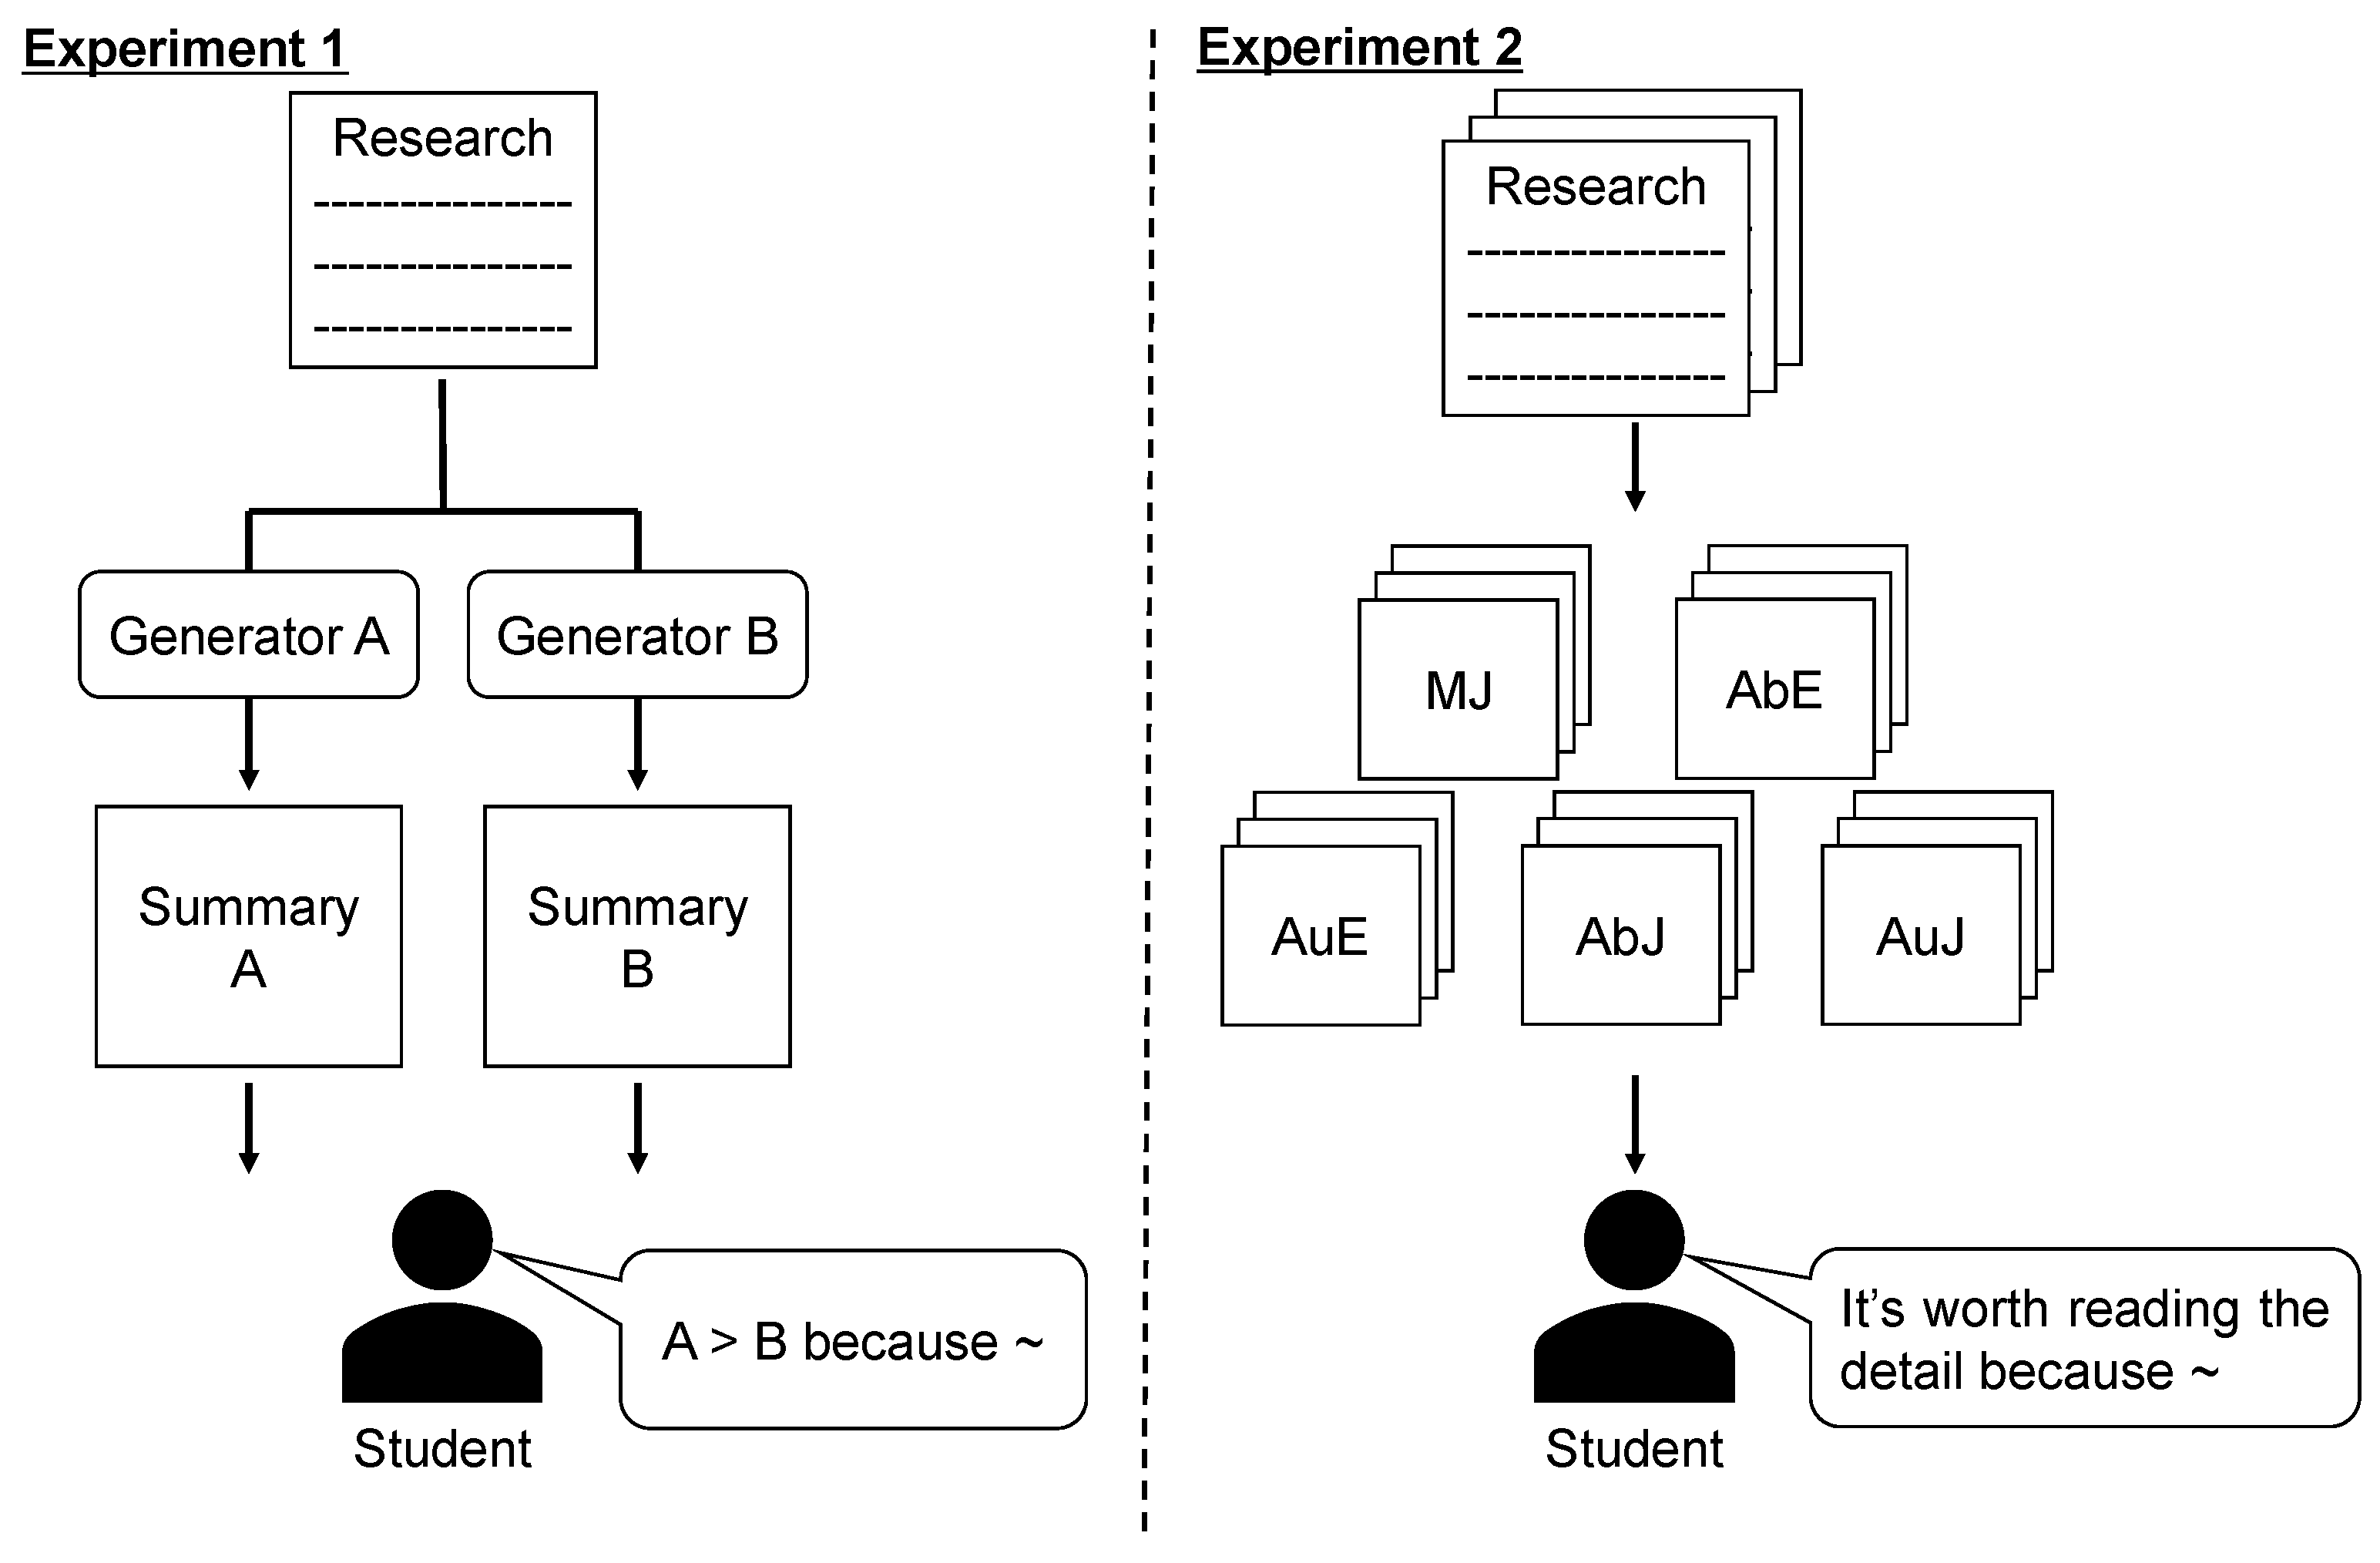
In this work, we conduct a case study wherein Japanese university students read summaries written manually (including abstract by authors or summary by readers) and generated automatically (using NLP techniques) to investigate what characteristics readers require in terms of summaries of scientific papers. Specifically, we performed two experiments (
Figure 1): (1) comparing two summaries generated with different methods to investigate the characteristics in summaries that readers regard as important, and (2) reading a large number of summaries to investigate what characteristics readers use to determine whether to read original papers after reading the summaries. In experiment 1, we investigate what factors of summaries are important through comparison. Though several factors, including content and grammatical correctness, are assumed, we clarify what is important to users. In experiment 2, we assume the practical scenario that users read summaries to find relevant papers. The purpose here is to investigate which kind of information is helpful to judge whether users are interested in papers. Our sample is framed in terms of university students because these subjects are unlikely to have substantive prior research experience and expert knowledge in their field and therefore need to survey a lot of scientific literature.
2. Related Work
In the NLP field, an automatic generation of text summaries is an active topic [
7] and several researchers have focused on scientific publications [
4,
9,
10,
13,
14,
15,
16]. The majority of research on text summarization has focused on news articles [
4,
9,
10]. However, summarizing scientific publications raises unique issues compared to summarizing news articles. For example, scientific papers tend to be longer than news articles (often much longer) and scientific articles follow normalized discourse structures including background, experimental settings, and results [
17]. Accordingly, research on scientific publication summarization relies on particular characteristics, for example, section-based [
9], structure-based [
4,
10,
14], and citation-based methods [
4,
10,
13].
Lloret et al. [
18] point out that text summarization results should be evaluated manually based on readability and the appropriateness of the information they contain. In [
11], systems to generate summaries are evaluated by human readers using four criteria: relevance, consistency, fluency, and coherence. The authors of [
11] also compared human responses with automatic evaluation metrics used in text summarization research [
12]. Huang et al. [
19] defined eight errors including missing key points or unnecessary repetition and asked users to manually select errors in computer generated summaries to investigate the limitations of prevailing automatic summarization methods. In these studies, the CNN/DM dataset [
20], which consists of news articles, is used for manual evaluation of summaries. Compared with news articles, an important characteristic in scientific publication is that target readers are limited to researchers with prior knowledge, as well as text-length and article structure. In this work, inspired by these studies, we conducted a user study of reading summaries of scientific papers.
In general, university students working on Bachelor’s or Master’s theses do not have enough experience of research activities, so we think that summaries are needed to help students understand the main point of research papers. Ozuru et al. [
21] investigated the effect of prior knowledge and reading skill on scientific text comprehension. Their results indicate that comprehension is positively correlated with prior knowledge. Shepherd and Van De Sande [
22] observed that reading strategies of faculty members in mathematics are different from those of undergraduate students. In addition, August et al. [
23] studied science communications and revealed that specialized terminology is often used, which creates access barriers for beginners. Hence, we focus on university students as subjects, and investigate the characteristics in summaries that they regard as important.
Scientific research papers are generally written in English, but it is preferred that readers can read in their mother tongues. This is because non-native English speakers tend to get lower scores on science examinations conducted in English, compared with native English speakers [
24]. Previously, Tobin and McRobbie [
25] investigated science education for Chinese students in an English-speaking school, specifically an Australian high school. They found that those students prefer to have conversations in Chinese and take notes in Chinese. In this paper, if we conduct a user study with non-native English speakers (Japanese), we need to investigate the influence of language differences. We consider two major directions to obtain information using subjects’ mother tongues: manual translation and automatic translation. In terms of the latter, machine translation systems have been well studied and freely accessible online systems like Google translate [
26] are available. Regarding manual translation, Japanese research groups have attempted to manually construct Japanese summaries in some research fields [
5,
6]. However, manual translations are time-consuming. Therefore, we utilized both automatic translation and existing manual summaries constructed by Japanese research groups to investigate differences between the two approaches.
3. Problem Formulation
We conducted user studies on reading summaries of scientific publication. The main purpose is to investigate the strengths and weaknesses of manual and automatic summaries, and readers’ expectations concerning scientific paper summarization. In addition, we assume that translating summaries into readers’ mother tongues influences their understanding. Then, we also investigated the effect of scientific article summaries written in English and readers’ mother tongues (in this paper, Japanese).
3.1. Subjects
The studies were conducted with undergraduate and graduate students working on their own research. This is because many students do not have prior research experience, but they have to investigate prior research to grasp trends and unresolved problems in their own field. Lack of research experience results in difficulty of reading a scientific paper, for example, students face unfamiliar terminology. In addition, motivations of research activities are different among students (e.g., pursuing research activities by enrolling in a Ph.D. course, or graduating from their university only), and there are different levels of abilities for understanding overviews of scientific papers according to each individual or university course, for example, language skill and basic knowledge. To sum up, we think that undergraduate and graduate students are good subjects for our user studies because they have specific problems of research activities (e.g., prior knowledge) and subjects’ variance are also expected.
We invited native Japanese students (including 1st and 2nd year Master’s students and 4th year Bachelor’s students) who are working in the CV field or related areas (e.g., Computer Graphics) as listed in
Table 1. Note that some of them participated in either experiment 1 or 2 due to their schedule. We considered students from three universities in Japan to ensure diversity. A Univ. and B Univ. are private universities, and C Univ. is a national university. Based on these universities’ official information, admission to A Univ. is more competitive than B Univ. and the difficulty of admission to C Univ. is between those of A Univ. and B Univ., and students in A Univ. are more likely to pursue doctoral studies. In the case of A Univ. and B Univ. subjects, their laboratories both consist of more than 20 students, while laboratory at C Univ. consists of less than 10 students.
Reading a text written in English is one of the barriers for non-native students including Japanese. To understand the differences in reading comprehension of non-native students with different English skill, we classified the subjects based on their English skill (low, middle, and high). We referred to the score of TOEIC Listening & Reading Test (
https://www.iibc-global.org/english/toeic/test/lr.html last accessed on 9 June 2021) (minimum and maximum scores are 10 and 990, respectively) because TOEIC is a well-known English test in Japan, and most Japanese universities often require taking a TOEIC examination many times to students. According to the average score of Japanese (
https://www.iibc-global.org/library/default/english/toeic/official_data/pdf/Worldwide2019_SW_english.pdf last accessed on 9 June 2021), we consider that subjects whose score is lower than 500 are low-level and subjects whose score is between 500 and 700 are medium-level. Here, we denote subjects with the initial characters of university, grade, English skill, and subject number. For example, the subject 01, who is a student of A Univ. in a Bachelor course and has High English skill, is denoted as ABH01. Regarding the grade of Master’s students, 1st and 2nd year’s are expressed as m and M, respectively. The subject ABH01 had lived in the U.S. for 10 years and her/his score in TOEIC is much higher than the others. Moreover, only ABH01 mentioned after the experiments that s/he had no difficulty in English during the experiments. To distinguish this participant from the others, we regard ABH01 as high-level. There are few students with living experience in foreign countries and having special interests in CV field, and, therefore, we can obtain relevant data from those subjects who have no difficulty with both the English and Japanese languages.
3.2. Reading Material
As reading material, we randomly selected 70 papers (20 and 50 for the short-term experiment and the long-term experiment, respectively) which were accepted to the IEEE/CVF Conference on Computer Vision and Pattern Recognition (CVPR) 2018. This conference is one of the most successful conferences in the field of computer vision (CV) (
https://cvpr2018.thecvf.com/ last accessed on 9 June 2021).
Over 3300 papers were submitted to CVPR 2018 and 979 of them were accepted (i.e., the acceptance rate is about 29.7%), indicating the difficulty of getting accepted to CVPR.
Next, we prepared five-different summaries (see
Table 2): (1) Manual Japanese (MJ): Japanese summaries written as part of a Japanese research project [
6]. To manually construct all of the accepted paper summaries in the CV field, this project took around three months for each CV conference. Note that this project has no requirement for summary length as long as it is no longer than a single page. For our experiments, we chose summaries written by three professional Japanese researchers who received a Ph.D. degree in either the CV field or a related domain within the past five years. The average number of Japanese characters per summary is
. (2) AbE (Abstract English): We use English abstracts written in the original papers by the authors. The average number of words per summary is
. (3) AuE (Automatic English): English summaries generated by an automatic text summarization method. To achieve the assistance of reading comprehension, it is necessary to select an appropriate summarization method without dependency on any additional data, which is applicable to any scientific research paper. We employed an unsupervised algorithm, called TextRank [
27], to compute sentence importance based on sentence connectivity and generate summaries that consist of important sentences only. TextRank is still a strong baseline which shows competitive performance to a recent summarization method [
19]. Note that we exclude the “abstract” and the ”reference” sections in the original papers and use only the paper bodies as inputs. To compute importance, we use variations of the similarity function [
28] implemented in the gensim library (
https://radimrehurek.com/gensim/ last accessed on 9 June 2021).
In addition, we empirically set the maximum number of words in each summary to 250 words. This is because Cohan and Goharian [
10] reported that each summary contains
words on average in a benchmark for scientific publication summarization TAC 2014 (
http://tac.nist.gov/2014/BiomedSumm/ last accessed on 9 June 2021). (4) AbJ (Abstract Japanese): We translate AbE into Japanese. We employ Google translate (
https://translate.google.com last accessed on 9 June 2021), which is a well-known and freely available machine translation system. (5) AuJ (Automatic Japanese): Japanese summaries translated from AuE (English) into Japanese. As with the AbJ preparation, we also use Google translate.
3.3. Experimental Setting
As an experiment setting, we made two experimental plans in the case of Japanese students summary reading. In experiment 1, we asked the subjects to compare the above types of summaries. Several factors can contribute to a user’s evaluation on summaries like content and grammatical correctness. We assume that the subjects compare summaries based on better or worse aspects of summaries. We then asked the subjects to provide the reason for their judgement, which could be considered as the description of strength or weakness of summaries. From the comments provided by the subjects, we investigated the evaluation factors and the characteristics of each summary.
In experiment 2, we asked the subjects to read 50 summaries (10 of each type) and to answer whether they would like to read the original papers after reading their summaries only within four weeks. Summaries of scientific publications can be used to find relevant research without reading the entire text of an article. We consider the task in experiment 2 as finding papers’ interest from a collection of (randomly selected) 50 papers. We investigated important characteristics to determine which papers to read under the practical scenario of finding relevant papers. Compared with experiment 1, here, the conditions are meant to emulate a real use case for summaries, for example, wherein the subjects need to conduct a task afterward (e.g., writing code).
5. Experiment 2: Reading Thorough
As previously stated, summaries of scientific papers are useful for readers to decide whether to read the original paper. For example, Semantic Scholar (
https://www.semanticscholar.org/ last accessed on 9 June 2021), an academic search engine, shows single-sentence paper summaries generated by an automatic summarization method [
32] to help users judge which papers are relevant. Besides this, a Japanese HCI research group [
5] created a web-based system which enables manual recording interesting papers by clicking a button after reading summaries, named “read this paper later”. Although such systems are suitable for sharing interesting summaries and papers, they do not consider how to determine whether a paper is interesting. Hence, we performed the second experiment to investigate what characteristics in summaries readers may use to decide whether to read the original paper after reading summaries.
5.1. Experimental Setting
5.1.1. Subjects
We invited the same 14 students who formed the sample in experiment 1, plus one who did not participate in experiment 1 (15 students, in total). All subjects are Japanese students working in the CV field or related domains. Please see
Table 1 for the subjects’ details.
5.1.2. Experimental Methodology
We randomly selected 50 papers accepted to CVPR 2018 and divided them into five groups (10 papers each). We then applied one of the methods (
Table 2) to each group and 50 summaries were generated in total.
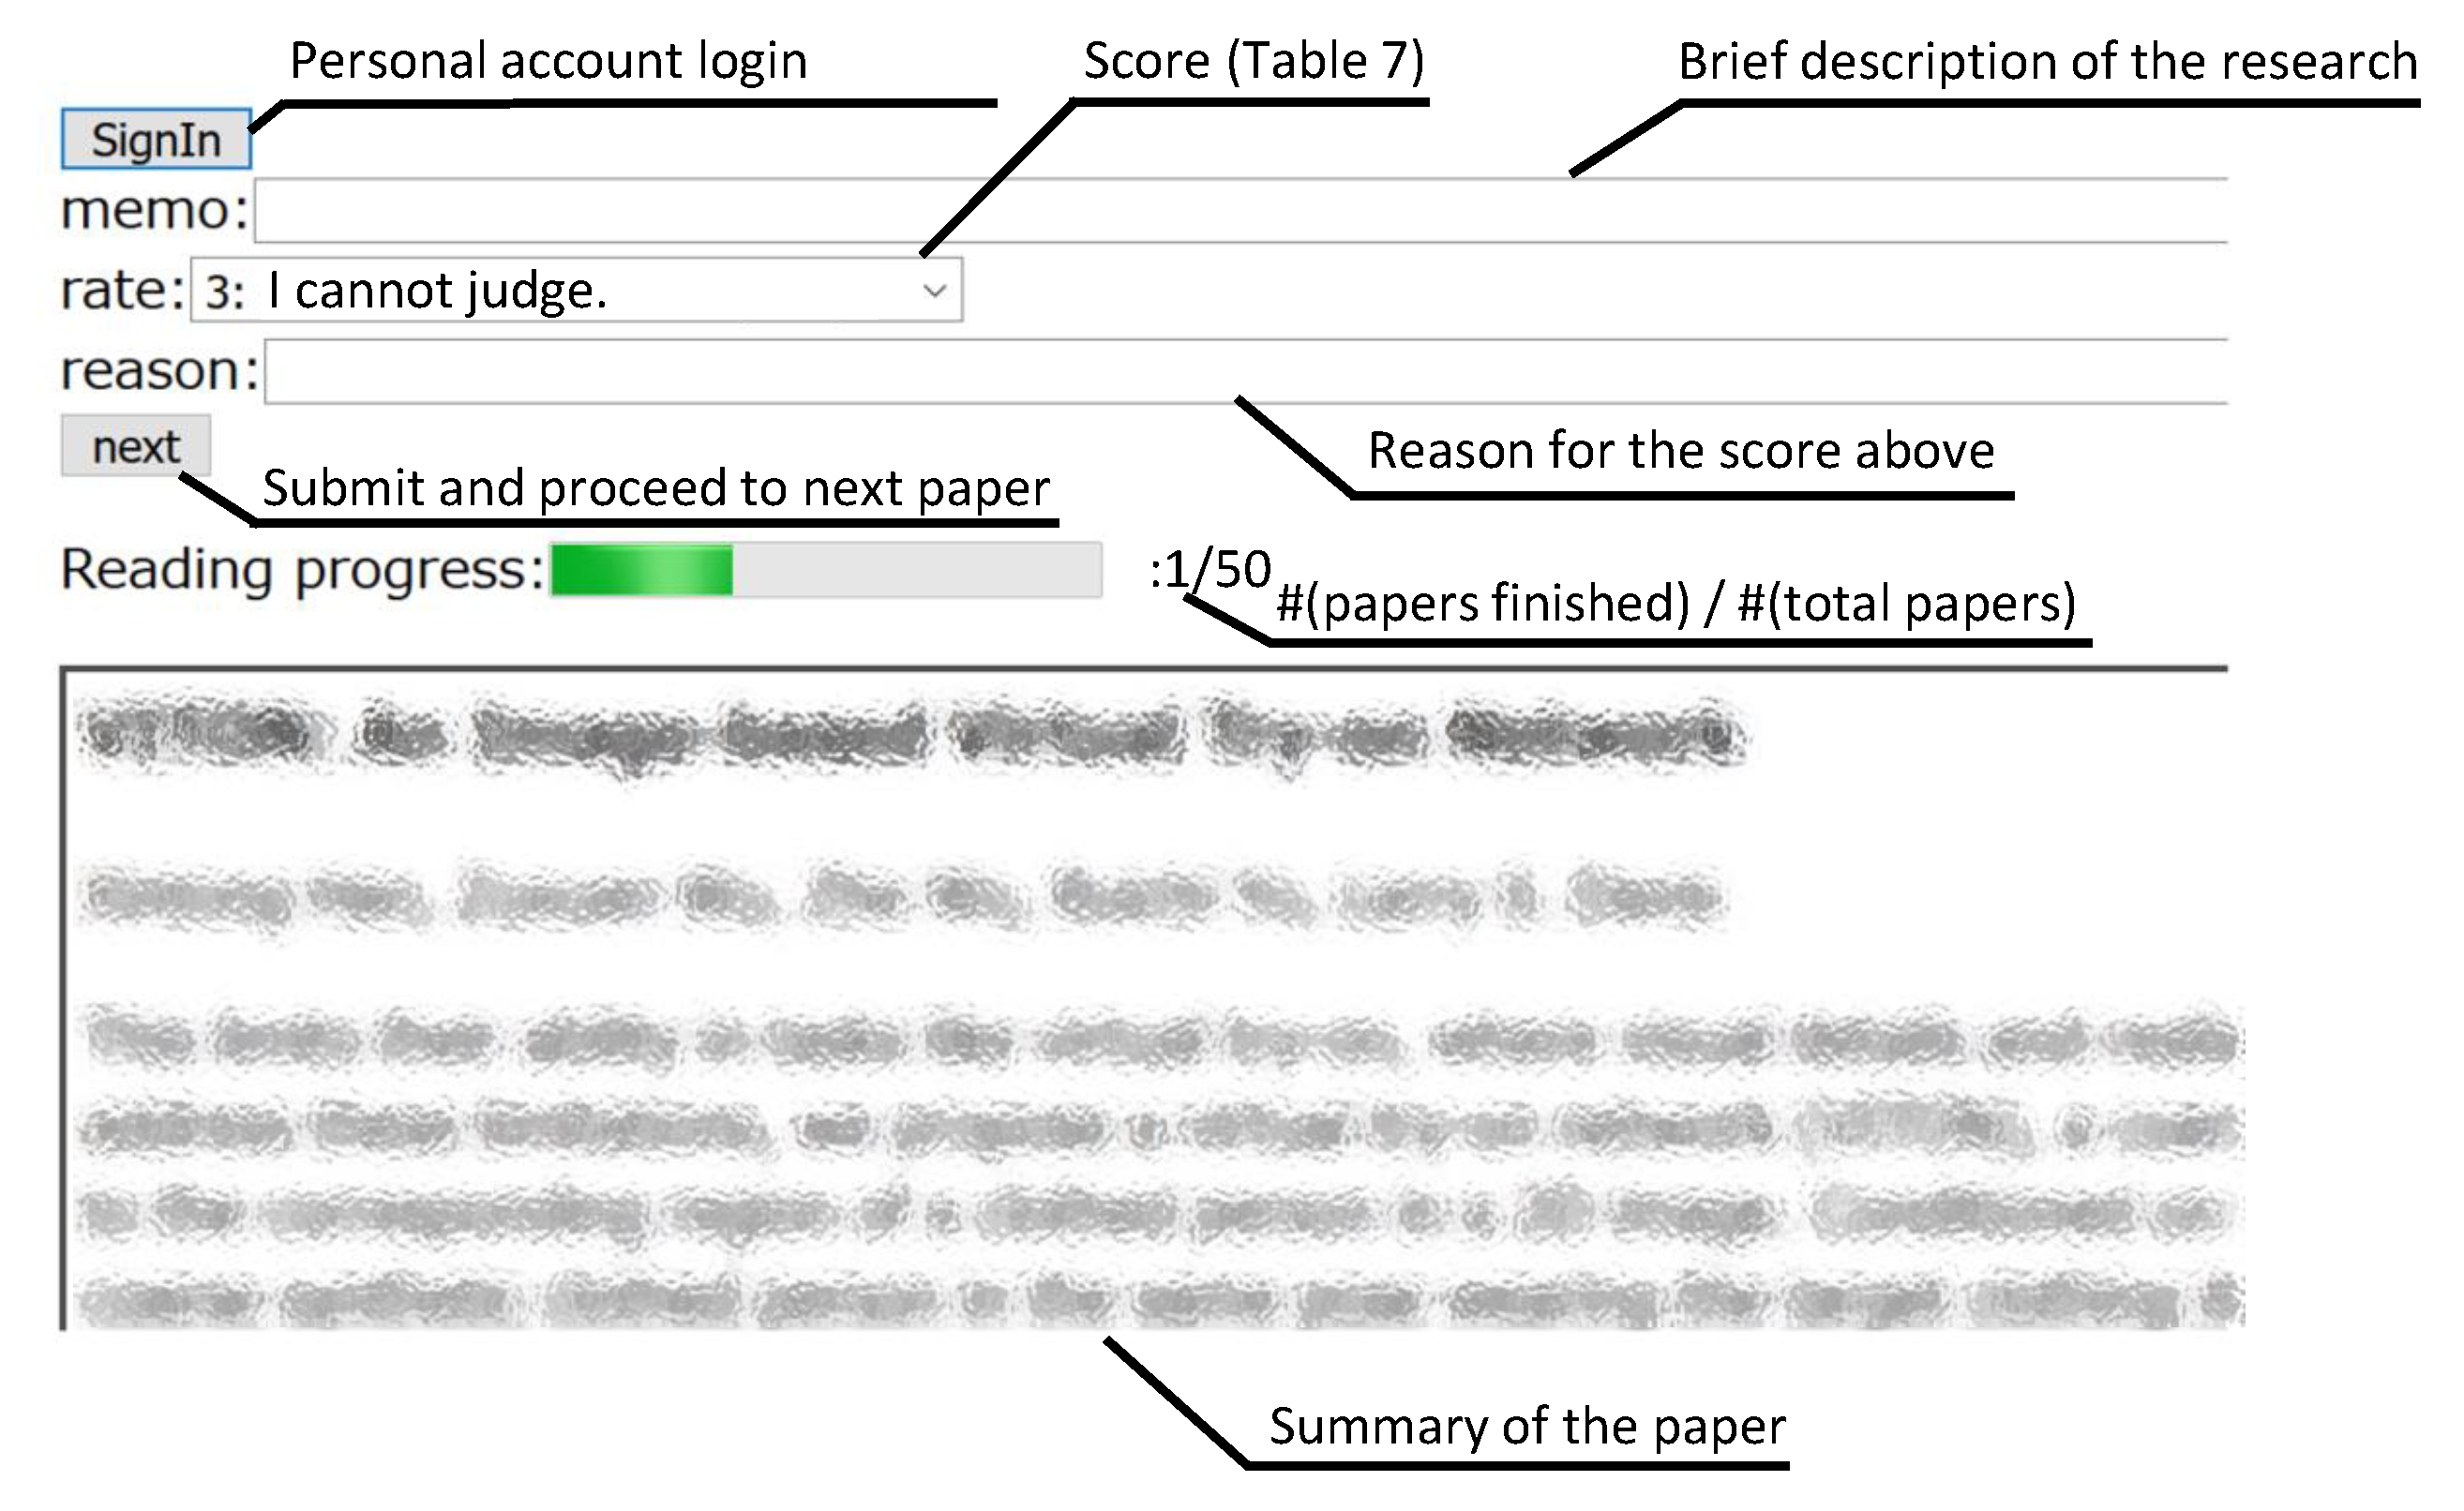
We developed a web-based system (see
Figure 3) to manage unread summaries. We constructed two functions: (1) a user-account management function to gauge subjects’ progress (for instructors), and (2) a display function to visualize the number of papers which each subject read (for subjects). Subjects created an account to manage their individual progress.
For each paper, subjects were asked to read a summary displayed on our web system and to answer whether they would like to read the original paper. We asked the subjects to answer the following three questions regarding the summary that they read on the system: “brief description of the research they could understand from the summary,” “score of whether they would like to read the original paper to understand the papers’ detail after reading the summary (using five-point Likert scale in
Table 7),” and “what is of interest to subjects.” The instructions and subjects’ answers are in Japanese. We then clarified what factor of summaries is useful to find relevant papers from the answers. Subjects were asked to finish the steps above for all 50 summaries within four weeks. Note that the system randomly shuffled the reading order of 50 summaries according to the subject accounts.
In this experiment, we assume the real scenario that the subjects have several tasks like coding and they read summaries in between other tasks. We then instructed that the subjects could read the summaries at their own pace (e.g., reading all summaries at once or a few per day) as long as they could give their answers within four weeks. We sent an e-mail each week to remind subjects of the deadline. In the case that subjects could not finish reading all 50 summaries, we collected only the answers which were submitted. After experiment 2, we also asked the subjects to give their opinions about the summaries that they had read.
5.2. Experimental Results
5.2.1. Score
Within the experimental period (four weeks), 11 out of 15 subjects finished answering all of the prepared summaries. The remaining four subjects finished answering 30, 19, 15, and 11 summaries, respectively. The scores are summarized in
Table 8.
We ran a Mann–Whitney’s U test (two-tailed hypothesis) to evaluate the difference in the responses with our 5-point Likert scale (
Table 8). The U-values indicate that the following pairs are significant at
: (MJ, AbE), (MJ,AuE), (MJ, AbJ), (MJ, AuJ), (AbE, AuE), (AbE, AbJ), and (AbE, AuJ). Moreover, we computed the Pearson’s correlation coefficient between the scores in experiment 1 (see
Table 5) and experiment 2 (see
Table 8, respectively), and the coefficient was
. Therefore, the scores representing whether to read (i.e., the result in experiment 2) was highly correlated with the score for the pairwise comparison in experiment 1.
5.2.2. Comments from Subjects
Subjects’ comments in experiment 2 can be divided into two categories, as shown in
Table 9. The first type is about “interest.” A lot of subjects mentioned that they scored based on their interests; for example, the topic was close to their research topic, and they would like to know more detailed experimental results. The second category is based on “quality or comprehensiveness.” While some subjects mentioned that they could not understand the summary due to its quality, others mentioned that their interest was stimulated because the summary was high quality. In the case that the comment mentioned both “interest” and ”quality or comprehensiveness,” we counted both. Note that three responses were not considered as one of these two types, in which subjects mentioned that they had already read the paper before.
We discuss the comments about “interest” in more detail. The answers about “interest” can be classified according to the components of scientific papers (e.g., topic, method, and experiment), as shown in
Table 10. We consider that comments mentioning multiple components are counted for each component, and 14 answers were of this type. In the case of the topic component, the subjects scored whether they had an interest in the research topic or relevance with their own research topic. In the case of the methods’ component, the subjects mentioned that they would like to know the algorithm or technique. Additionally, some mentioned that they would like to know the detailed experimental results. Here, we consider comments that did not mention any concrete component as “other”.
5.2.3. Subsequent Question
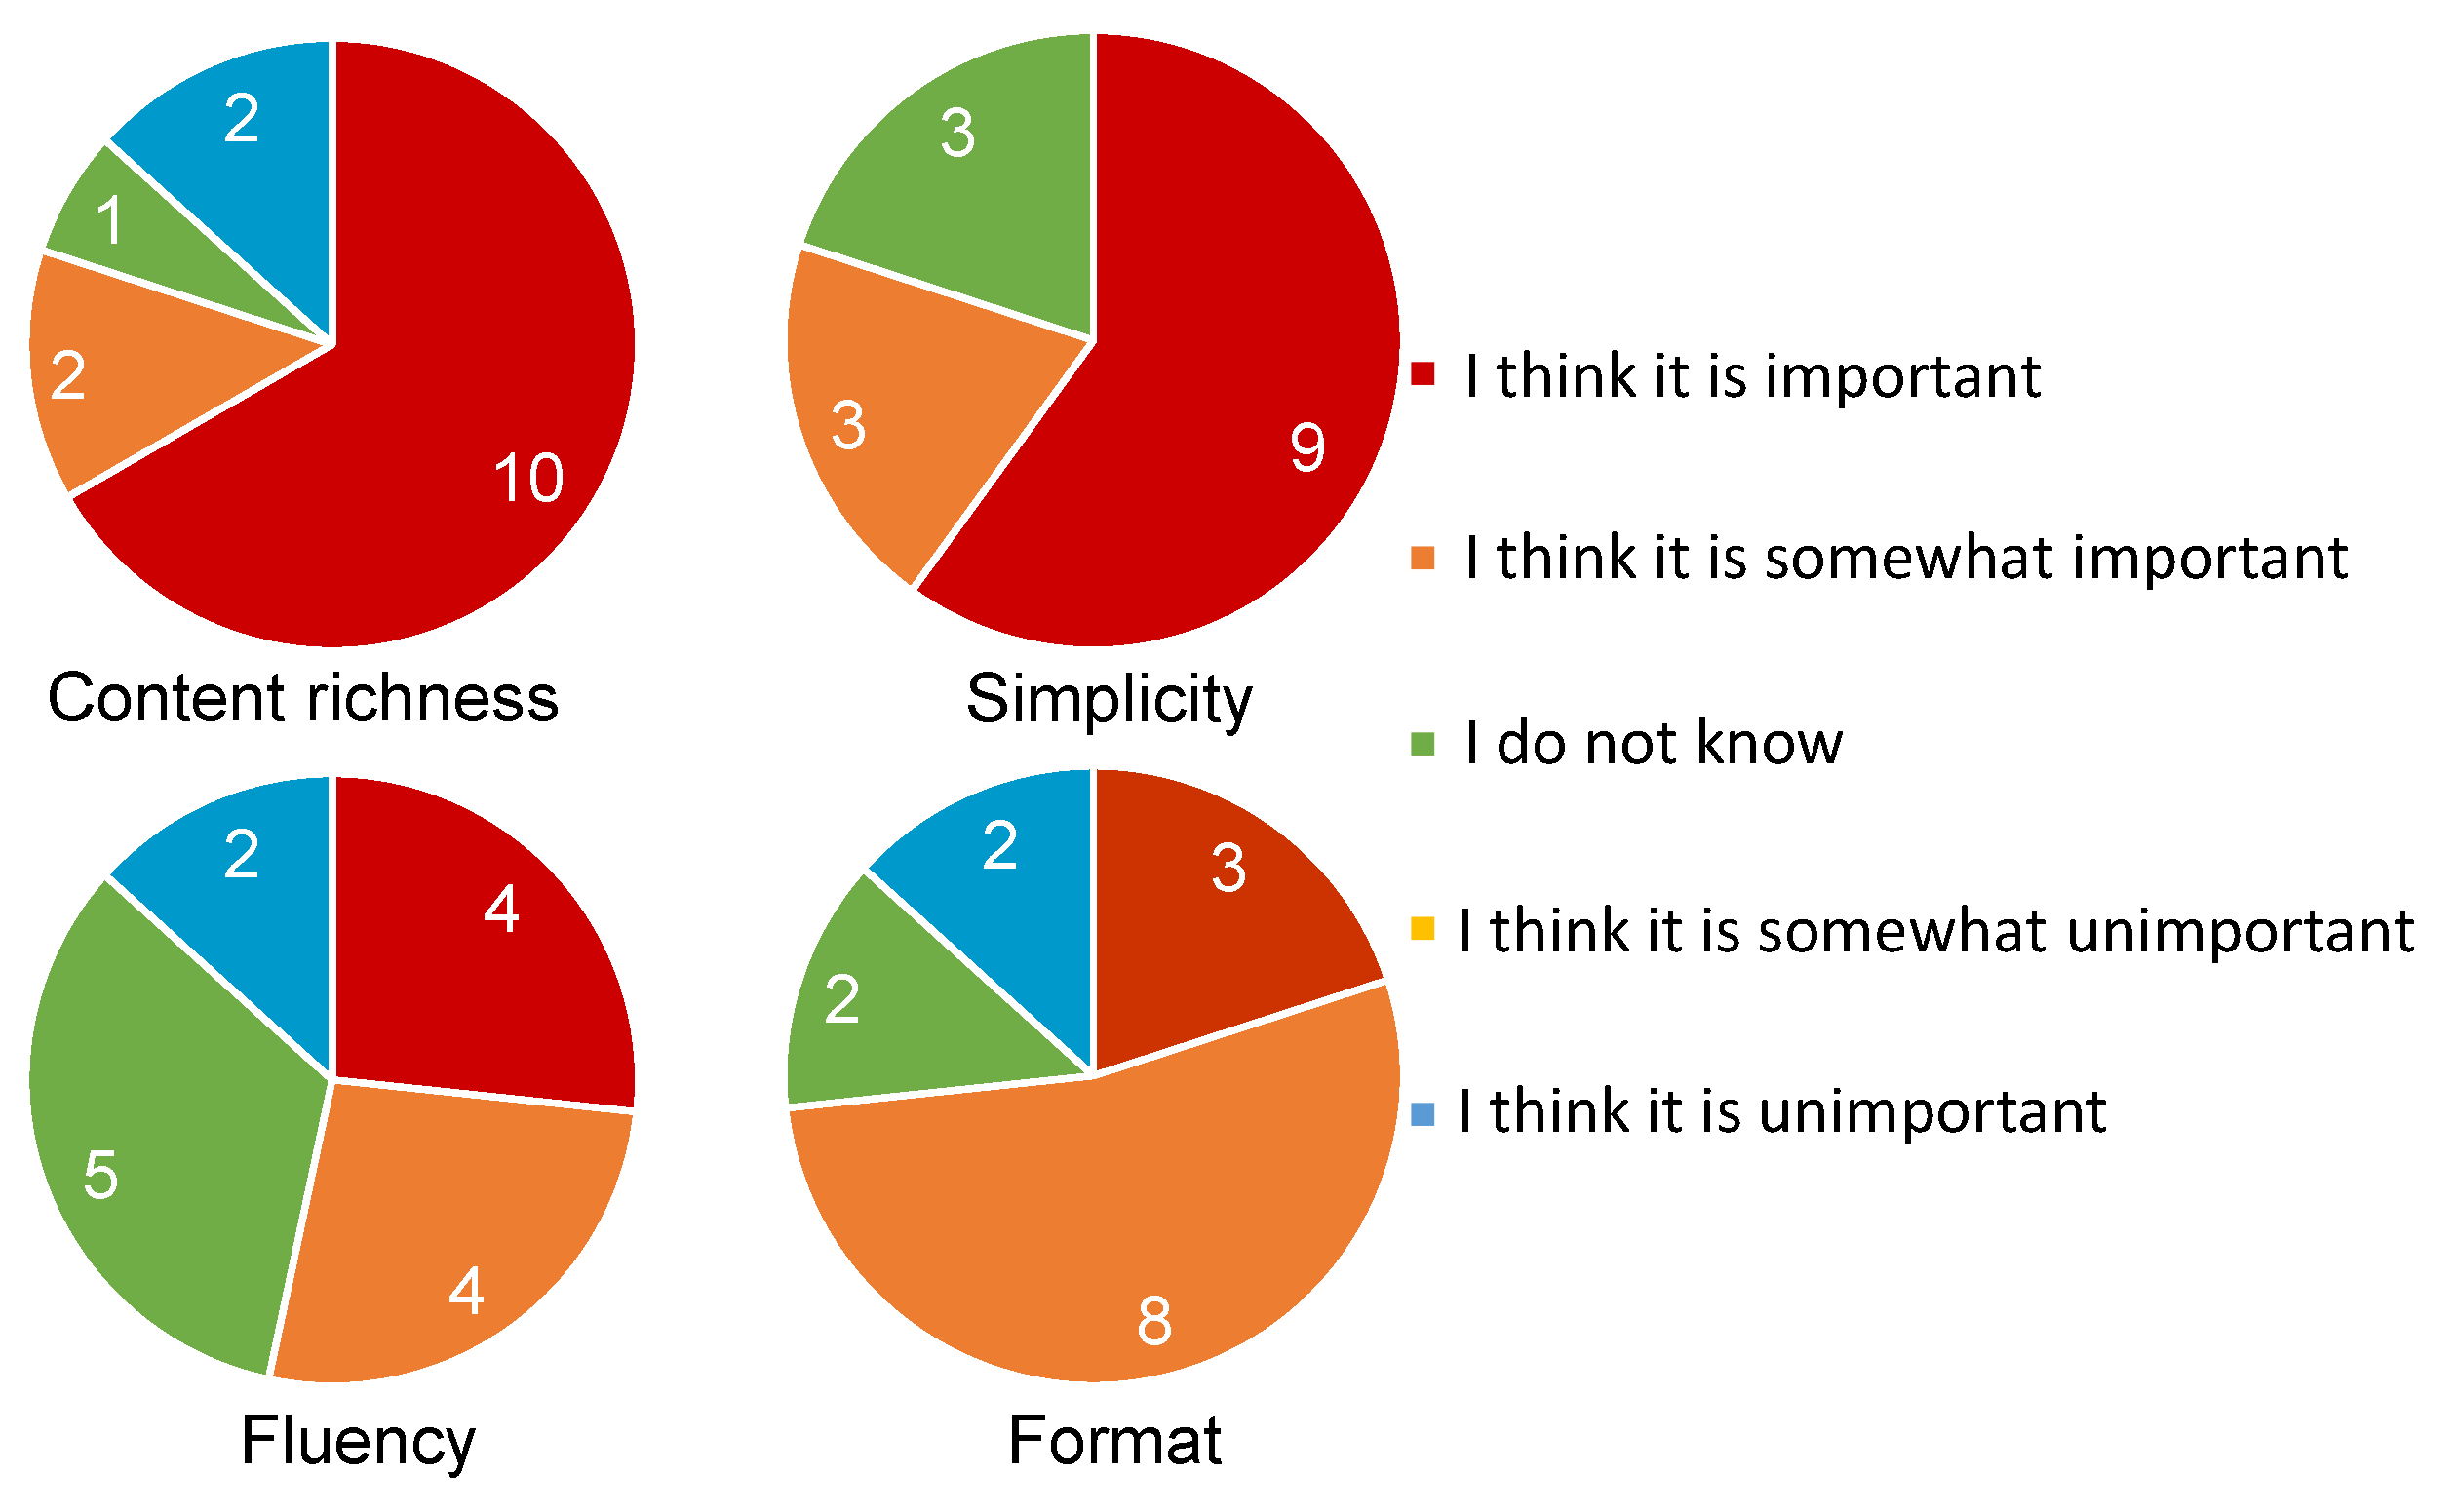
After experiment 2, we also asked the subjects to answer whether the four characteristics in experiment 1 (see
Table 6) are important or not. The responses from the subjects are summarized in
Figure 4.
For the question about the importance of content richness, about 80% of the subjects answered either “I think it is important” or “I think it is somewhat important.” On the other hand, two subjects answered “I do not know” or “I think it is somewhat unimportant”. Their reasons were that “the detailed experimental results are not necessary” (by AmM05), and “content richness is not necessary and I would rather know a little bit each about a larger number of papers” (by CMM17).
In the case of simplicity, around 80% of subjects agreed that simplicity is important. The reasons include “a longer summary is difficult to understand” (by CmM16) and “I would like to quickly read an easily understandable summary” (by CmM15). On the other hand, three subjects answered “I do not know” because “I cannot understand the summary with insufficient information even if it is simple” (by ABH01, BmL12, and BML13). From the answers for content richness and simplicity, it is considered that these aspects need to be well balanced.
In case of fluency, 53.4% of subjects placed importance on fluency, which is lower than the percentages for the importance of content richness and simplicity. To investigate the importance of fluency further, we also asked subjects to answer “how often did you prefer Japanese summaries, even if the text was grammatically incorrect, compared to English ones (0%: English is always better, 100%: Japanese is always better)” to investigate the effect of the mother tongue (see
Table 11). All subjects with low-level English skills answered more than “50%,” and one subject with medium-level English skill answered “80%.” ABH01, who had lived in the U.S. for 10 years, answered “0%.” The reasons are including “appropriateness is more important than whether the summary is written in the mother tongue or not” (answer: 20%, by ABM03), “I usually read scientific papers in English” (answer: 10%, by CMM17) and “I can read text in the mother tongue quickly” (answer: 70%, by CmM16).
For the importance of format, 73.3% of subjects answered “I think it is important” or “I think it is somewhat important.“ Examples of reasons are “incorrect formatting bothers me every time” (by ABM04) and “I cannot understand the text because of inappropriate formatting” (by CMM18). On the other hand, those who answered “I think it is somewhat unimportant” pointed out that “I can correct the text in my mind” (by ABM03) or “even if the format is incorrect, it does not make hard to read” (by BmM09). While some did not care about incorrect format, most did.
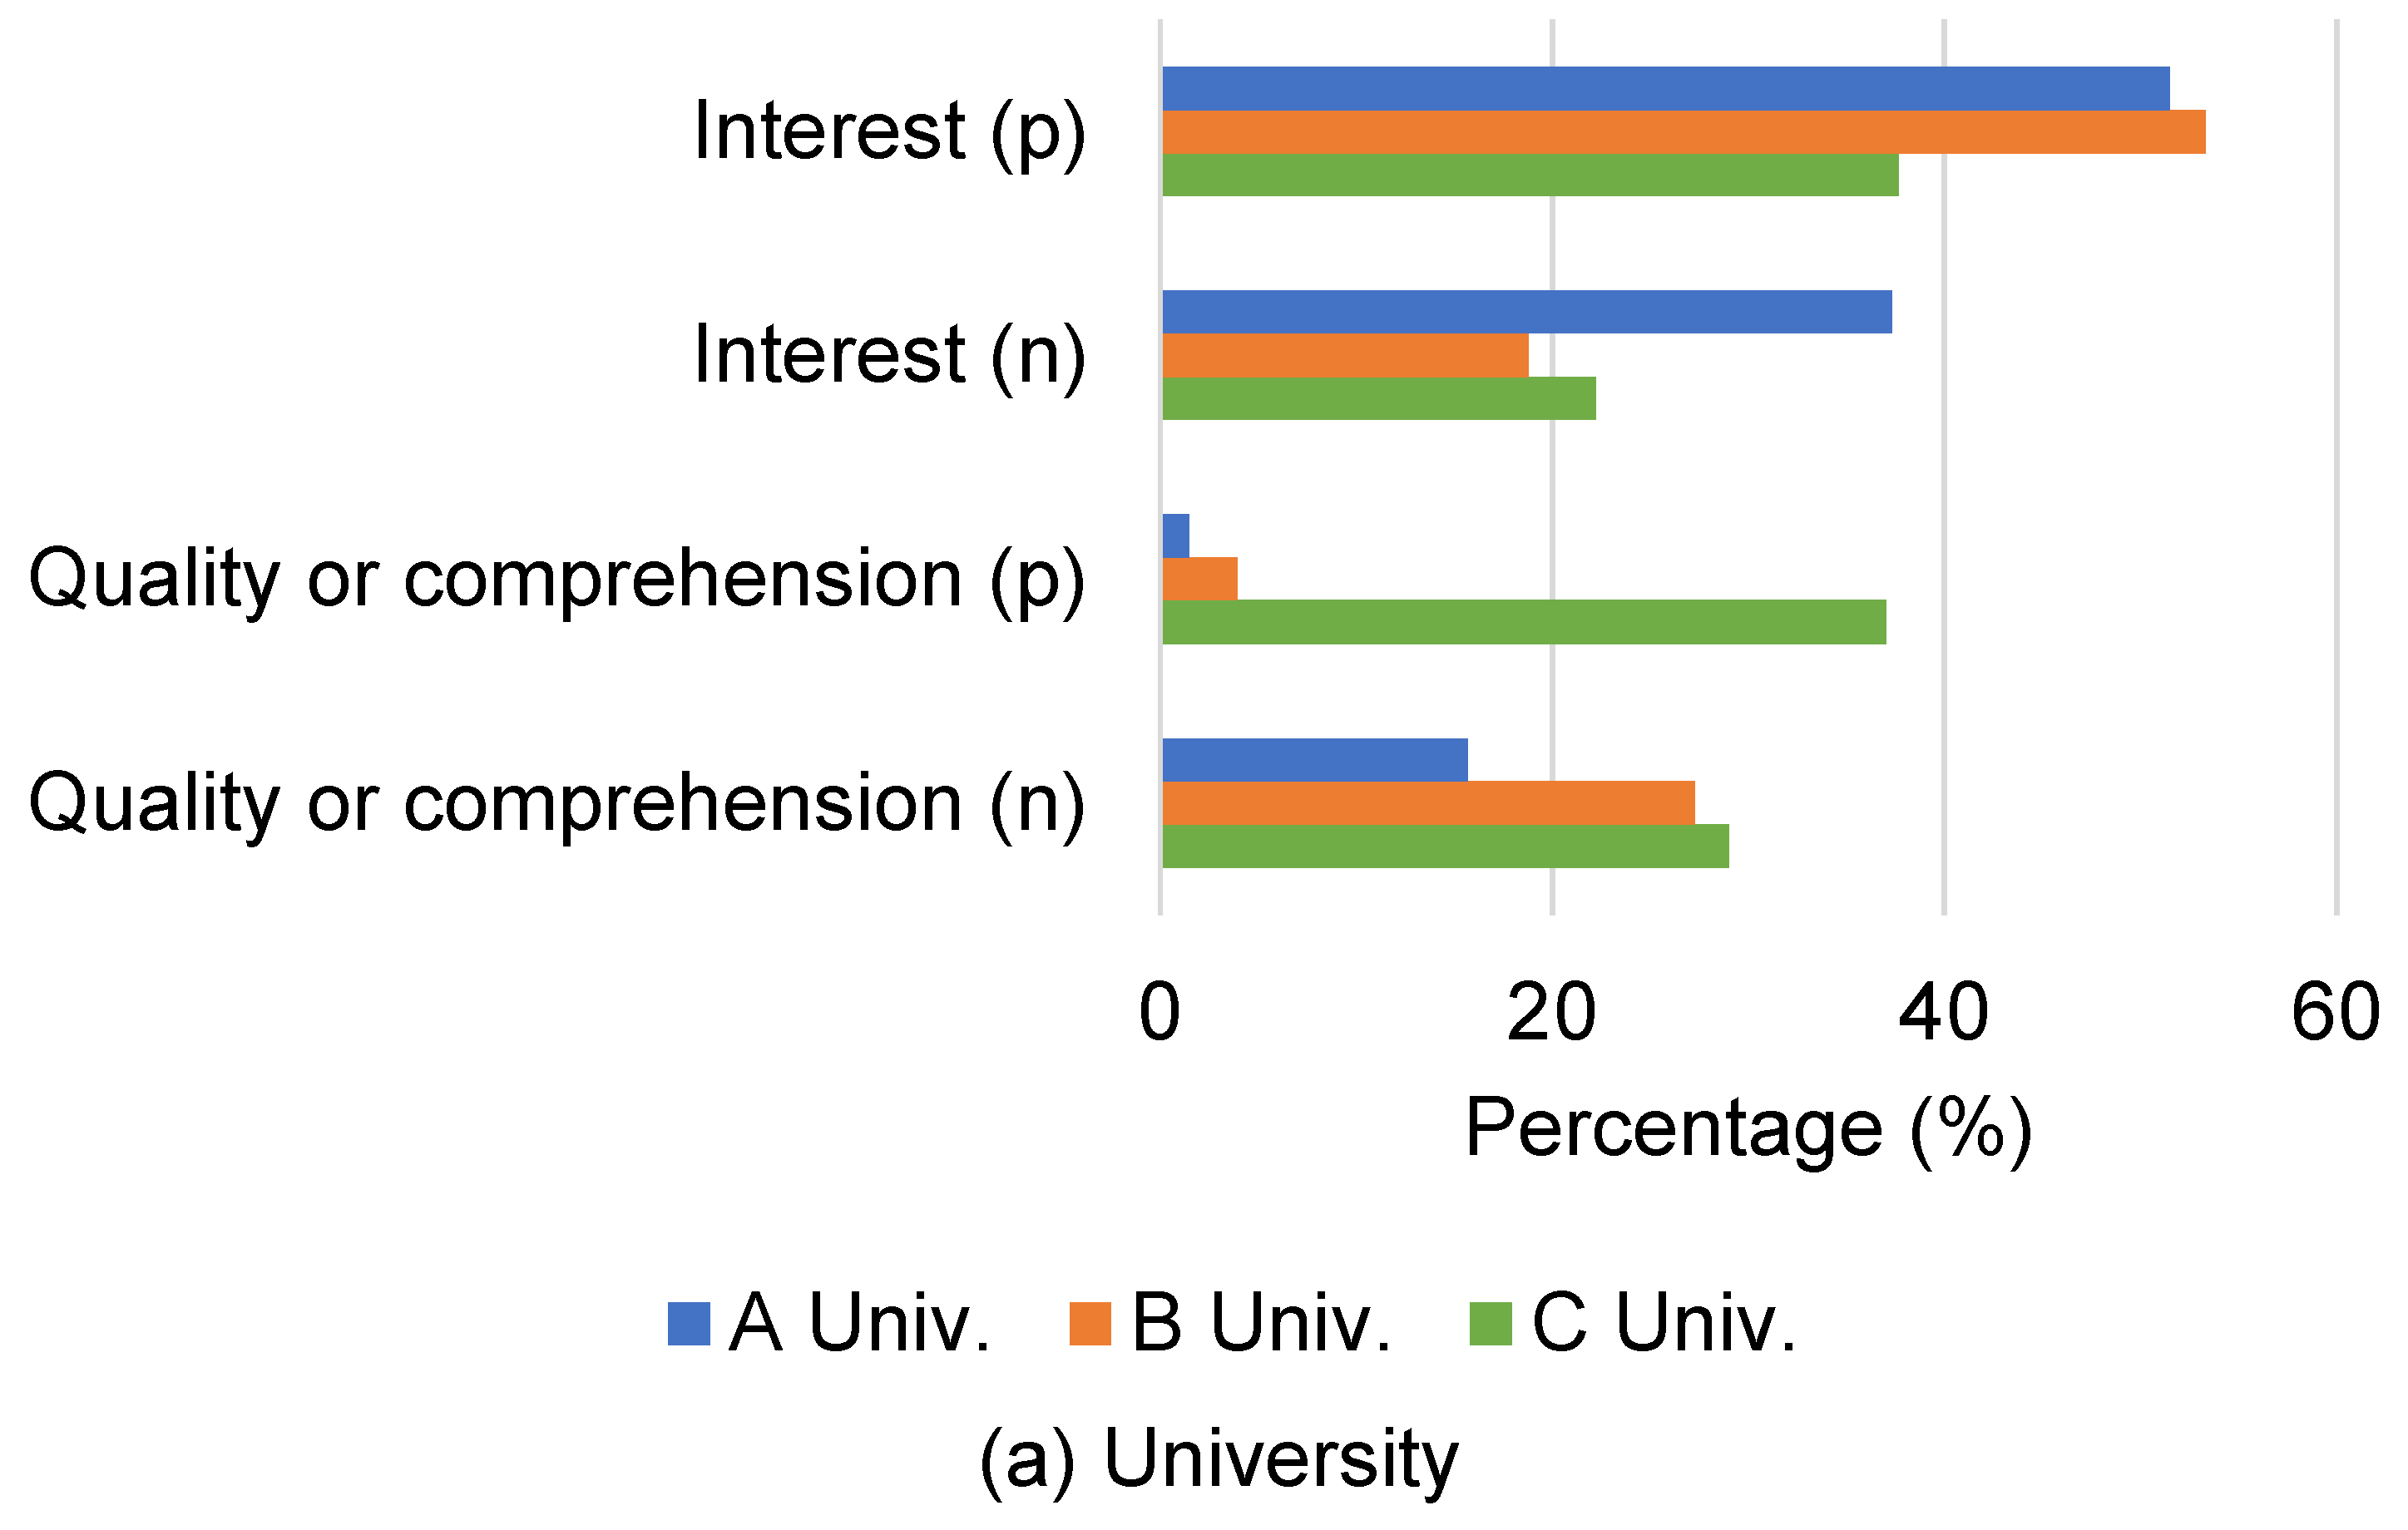
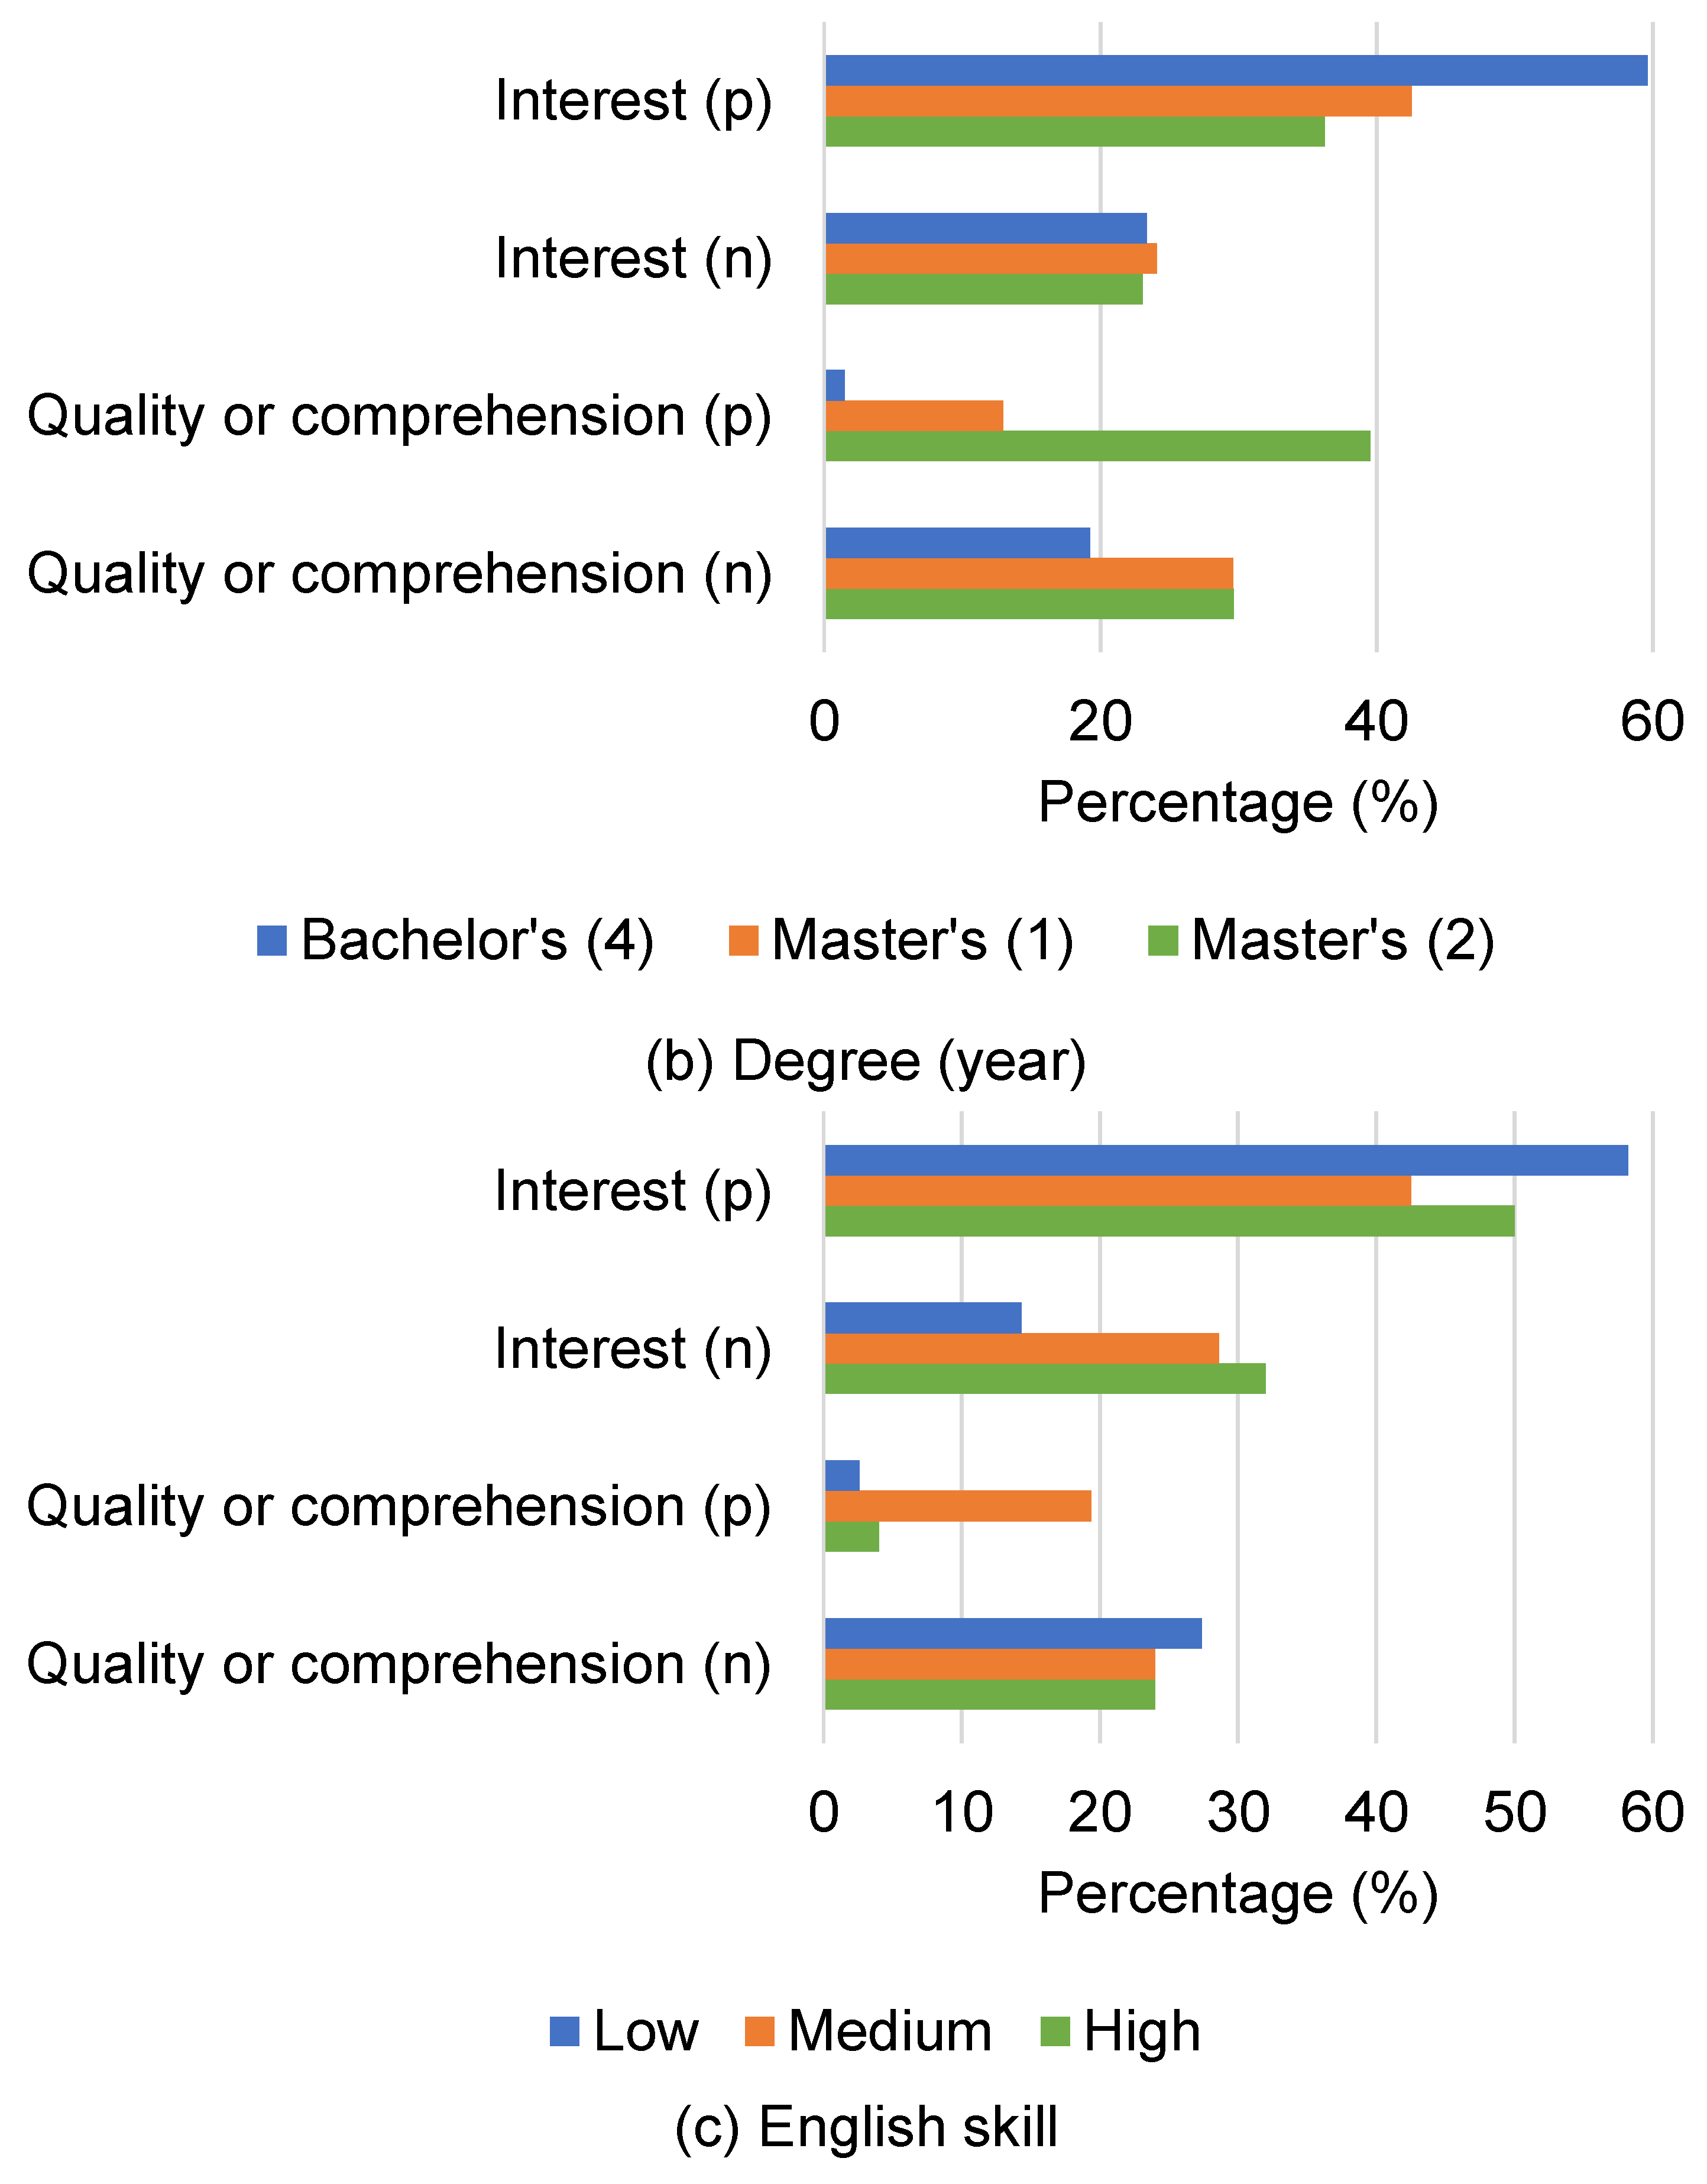
5.2.4. Attribute of Subjects
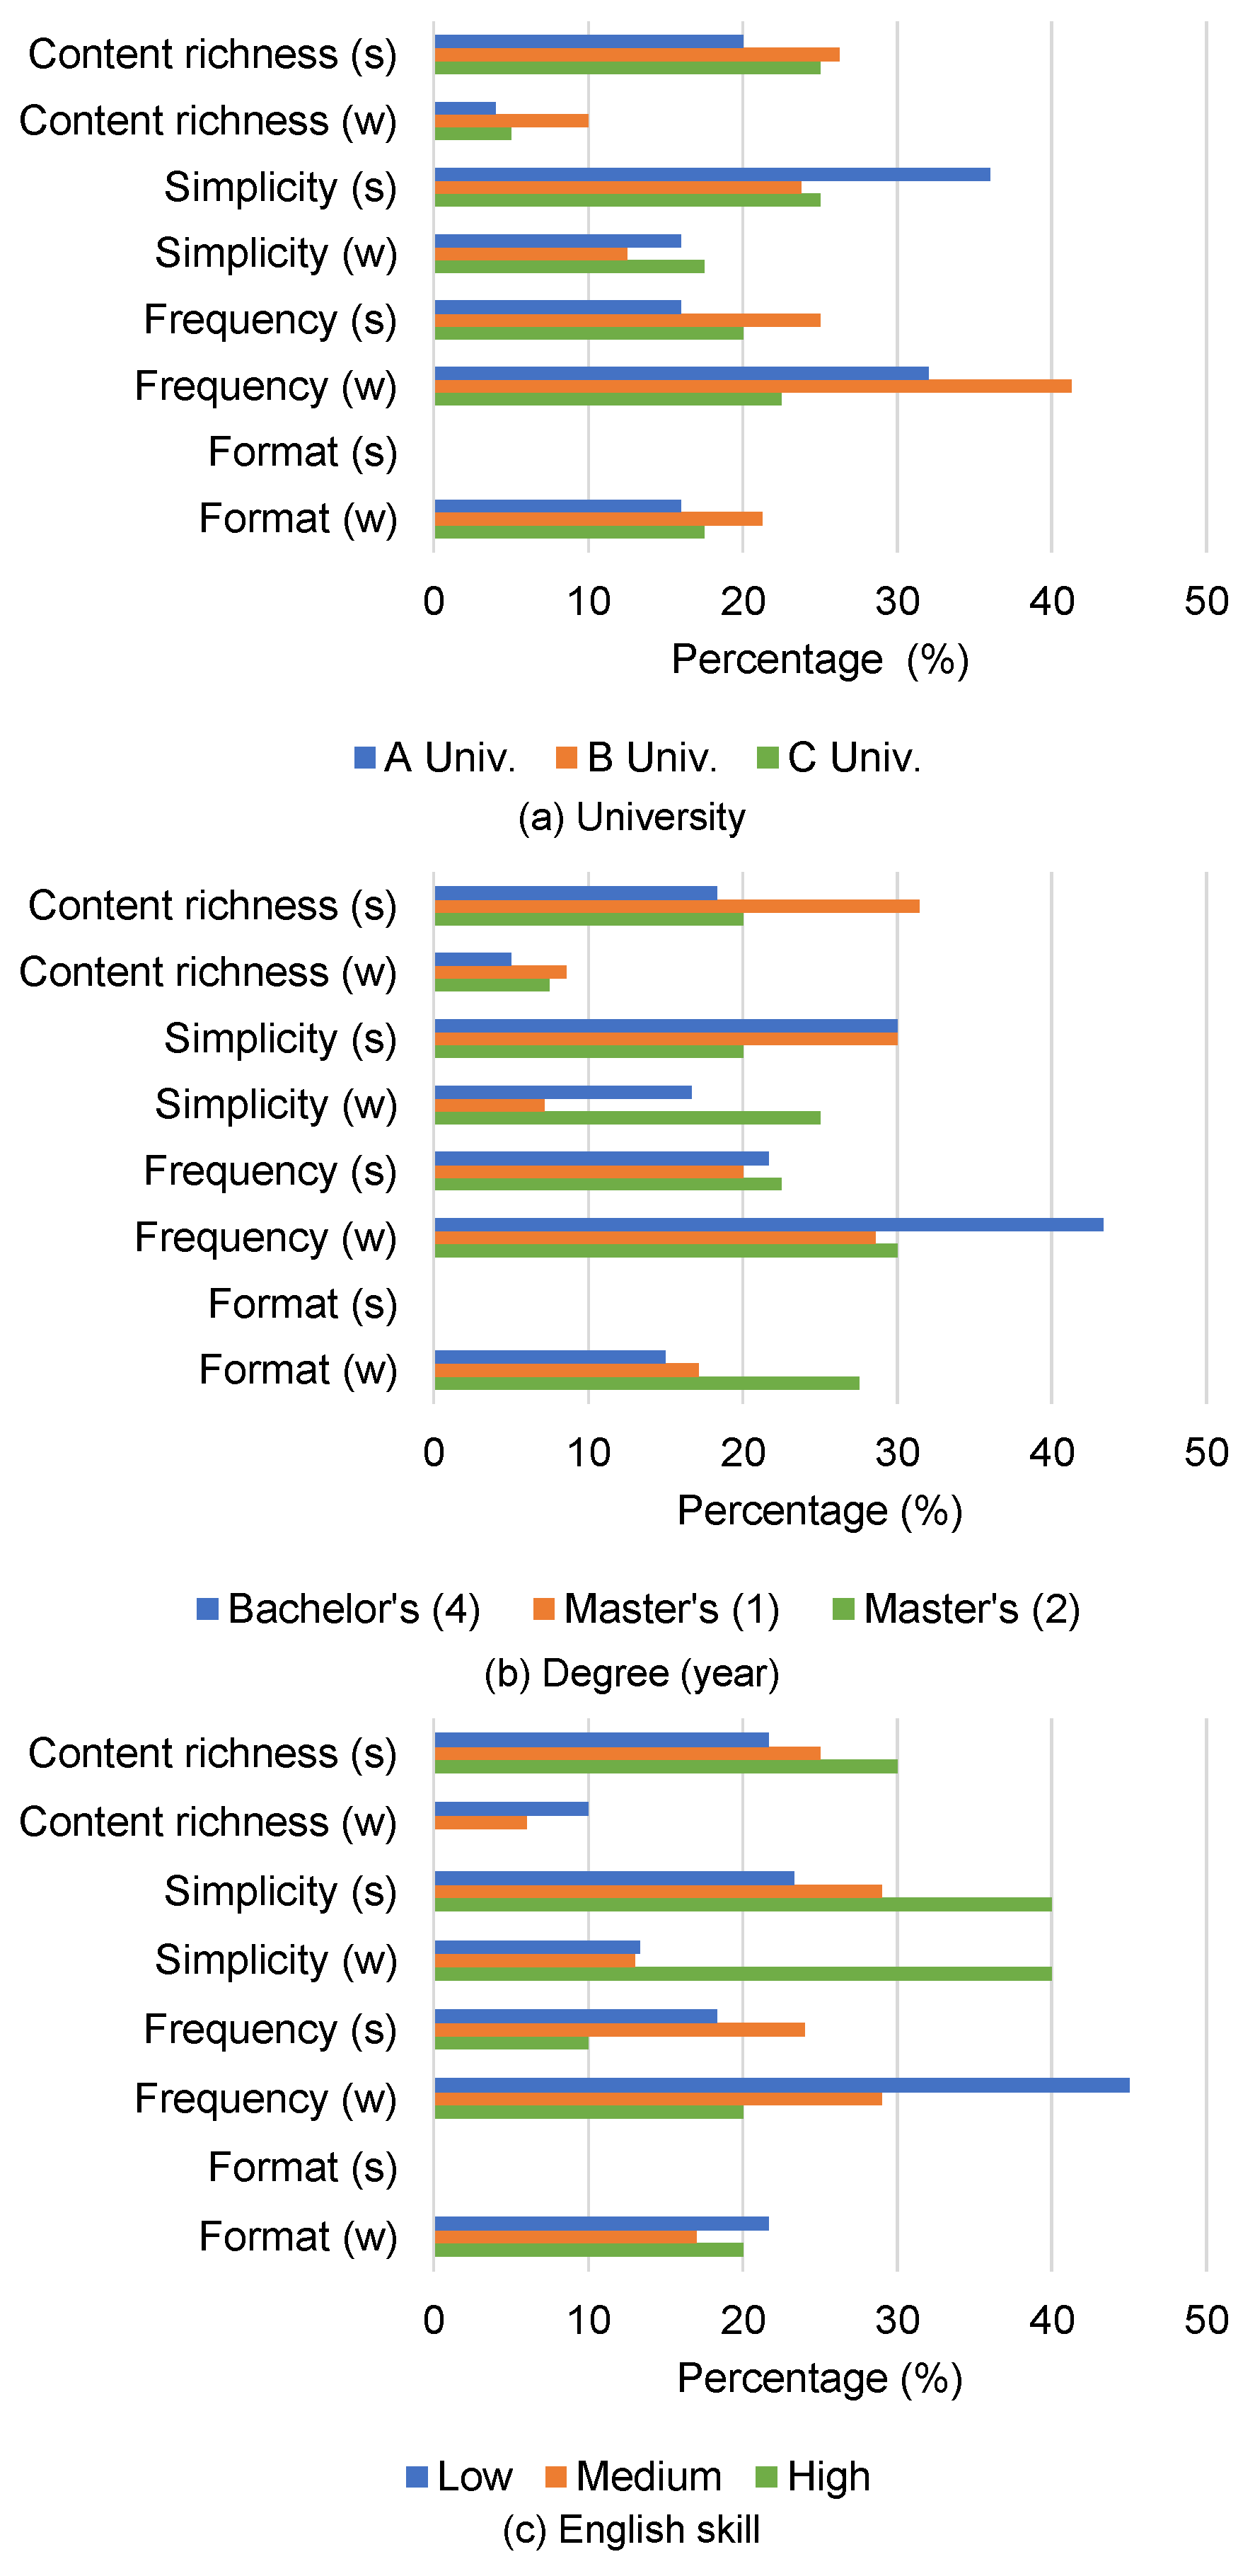
As with experiment 1 (see
Section 4), we also analyzed the results per attribute (e.g., grade of university and English skill). Per attribute score of each summary and distributions of reason are shown in
Table 8 and
Figure 5, respectively.
The results indicate that upper-grade students tended to show less positive interest. On the other hand, upper-grade students tended to mention more positive aspects of quality or comprehension. One possible reason is that undergraduate students have less prior knowledge and training, which results in focusing on finding relevant research, while seniors are more familiar with the background of their field and focus more on the quality of comprehension of the summaries.
Regarding the university, the subjects at C Univ. mentioned more positive aspects of quality or comprehensiveness. On the other hand, they also tended to give answers indicating less positive interest.
6. Discussion
In this section, based on the two experiments (see
Section 4 and
Section 5), we further discuss (1) students’ evaluations and requests regarding summaries of scientific publications, and (2) characteristics of manual and automatic generated summaries in English and Japanese. We also describe some concerns of this study for future directions.
6.1. Evaluation Metric and Request
In experiment 1, subjects evaluated summaries based on content richness, simplicity, fluency, and format. Fluency and format, which can be regarded as general aspects of summarization, are relevant in terms of readability as pointed out by Lloret et al. [
18]. On the other hand, we find specific aspects of scientific papers in content richness and simplicity summarized as follows:
Subjects (university students) tend to evaluate qualities of summaries based on the existence of components of scientific papers such as research purpose, methods, and experimental results. To understand overviews of papers, we observe that they did not use all components.
Subjects tended to prefer simple summaries, but additional information is also required such as an explanation of terminology.
6.1.1. Paper Components and Content Richness
Concerning content richness, as shown in
Table 6, the subjects commented on whether there are important components of scientific papers (e.g., topic and method) in the summaries. For example, some subjects’ answers are about papers’ components, like, for example, “the problem of prior work and the purpose of research are easy to understand” (by AmM05) and “the purpose and the proposed method are not clear” (by CmM16). In general, scientific publications have a common structure consisting of multiple sections, including a background, experimental setup, and results [
17], so most readers (students) will briefly evaluate and confirm whether these structures appear in the summary of a paper. However, such components in summaries have not been studied in previous text summarization research because the focus therein has tended to be on “news” articles, which do not have any common structure. In addition, to evaluate the appropriateness of the information in a summary, Nenkova and Passonneau [
33] proposed a pyramid method to place importance on the information mentioned in more reference summaries, but this method does not consider any structural components such as those in scientific papers.
In experiment 2, the subjects recorded whether they would like to read the original papers after reading their summaries. We observed that subjects mainly made this judgment based on either “interest” or “quality and comprehension.” In the answers about “interest,” 62.6% and 17.4% were about research topic and method, respectively, so it appears that subjects tend to regard these components as most important. Note that 3% of the answers mentioned multiple components of research articles. This indicates that subjects paid attention to a limited number of components. Cohan and Goharian [
4,
10] proposed summarization methods to equally select some sentences from each component (e.g., methods and results) based on the structure of scientific publication. While these systems balance the amount of each component, it can be said that they do not consider the importance of each component.
Moreover, the Master’s students tend to have less positive attitudes in terms of interest. One possible reason is that upper-grade students have already obtained specific knowledge about their research fields, which could result in more attention being paid to the quality or comprehension of summaries. Thus, the importance of each component depends on readers’ attributes (e.g., background of research topic). From the above, we can infer that considering readers’ preferences for components are important to improve the qualities of scientific research paper summarizations.
6.1.2. Simplicity and Terminology
Regarding simplicity, subjects mentioned that “a simple summary is preferred” and also that “the summary is too simple to understand,” as shown in
Table 6. About 80% of subjects gave answers indicating that they preferred simple summaries, for example, “this summary is too long to read” (by BBL07) and “this summary gives an overview simply and is easy to understand” (by ABM04). In addition, in answering the related question in experiment 2, about 80% of subjects also expressed a preference for simple summaries.
Simplifying document sequences is an active research topic in the NLP field, and two types of simplification methods have been studied: lexical and syntactic [
34]. One characteristic of scientific research papers is the existence of terminology. Authors assume that readers have prior knowledge of the field, so they often leave out explanations of terminology. As a result, university students without prior knowledge, especially Bachelor’s and Master’s students, must deal with unfamiliar vocabulary. Indeed, some subjects mentioned, for example, “I could not understand both summaries. I am not familiar with the terminology so I could not understand it” (by ABH01) and “supplementing the terminology is helpful” (by BmL12). These comments are consistent with research on science communication [
23], where specialized terminology has been shown to create access barriers for new users. For this reason, although redundant sentences are not desired, a lexical simplification or explanations of the terminology are required.
6.1.3. Automatic Evaluation Metric
Manual evaluation of summaries is very labor-intensive. Thus, automatic evaluation metrics have been well used in automatic summarization research. Here, we discuss the effectiveness of automatic evaluation metrics in scientific paper summarization.
ROUGE [
12] is a well-known evaluation metric, which measures similarity between generated and reference summaries. We applied ROUGE to the summaries in our experiment with the following settings (see
Table 12): (1) AuE with AbE as reference, (2) AbJ and AuJ with MJ as reference, and (3) AuJ with AbJ as reference. As a result, AuJ obtains higher ROUGE score with AbJ as reference than MJ. However, in the comparison between MJ and AbJ (see experiment 1), about 40% of subjects answered “AbJ is better,” which was not a significant difference. ROUGE measures the similarity of a generated summary to a reference summary, so the metric does not indicate whether the quality of a generated summary is high,” but “the generated summary is similar to the reference.” Therefore, until we can guarantee the quality of reference summaries, we cannot use ROUGE. In addition, content richness and simplicity are difficult to evaluate from the similarity with reference summaries. This discussion is consistent with the experimental results in Kryscinski et al. [
11], where it was reported that manual evaluations such as appropriateness or fluency are not correlated with ROUGE scores.
6.2. Characteristics of Manual and Automatic Summarization
We evaluated five types of summaries generated by manual or automatic summarization methods (in addition to a machine translation system). We found the following characteristics of each type summary from the experimental results:
Manual Japanese was easy to read compared with automatic summarization because of the terminology explanation as well as fluency. However, there were some negative opinions as well, such as “it is too simple” and “there is insufficient information on summaries.”
Automatic summarization methods obtained negative feedback, for example, “there is too much unnecessary information.” On the other hand, subjects also answered “there is important information (in automatically generated summary) that is not included in another one (manual summary)” when they compared automatically and manually generated summaries. There is the possibility of reducing or removing the perceptual biases of the authors.
Machine translation systems may make grammatical errors and word errors due to the existence of specialized terminology that is not used in other domains (e.g., news articles), but some subjects preferred summaries written in Japanese, even if grammatically incorrect, over English ones.
6.2.1. Manual Summarization
We prepared (a) English abstracts in the original papers (AbE) and (b) manual Japanese summaries written by researchers with a Ph.D. (MJ). In experiment 1 (see
Table 5), AbE obtained the highest score of
and MJ obtained the second highest score
, indicating that manual summarization is highly evaluated. Note that the MJ score was not far behind, since there is not any significant difference with AbE.
However, in the case of AbE, some subjects answered “(MJ is better than AbE because MJ) describes meaningful information about the test accuracy with all datasets in the papers’ experiments” (by AmM05) and “(AuE is better than AbE because AuE) describes what is done in this research, while the other one (AbE) does not” (by BmM10). According to these comments, we can see that AbE does not always include important information for readers. This point is consistent with the claim by several researchers that abstract does not always reflect readers’ requirements [
3,
4].
On the other hand, MJ summaries depend on the Japanese researchers’ subjective judgment, but it is also possible to include important information (which is not written in the AbE summary) for increased ease of understanding by considering the readers’ perspective. We also observed comments about document simplification in MJ, for example “(MJ) seems to be re-written by humans who have read the original paper carefully, so I feel (MJ) is easy to understand” (by BmM10) and “(MJ) is good because it describes the meaning of the terminology” (by BmL12). However, some subjects also mentioned low fluency like “the Japanese is incorrect in (MJ) and there is typographical error” (by ABM04). There was also a comment that MJ is too simple to understand: “(MJ) is not bad but too simple” (by CMM17). One of the possible reasons for the above negative comments is that MJ is not checked by third-party readers, while the abstract (AbE) is evaluated during peer review. In addition, MJ is written by researchers who have obtained a Ph.D., but the subjects in our experiments are undergraduate and Master’s students. Therefore, the gap in prior knowledge might be a reason for the aforementioned comments that MJ summaries are “too simple.”
In comparison between MJ and AbE in the experiment 1, eight subjects answered “(MJ) is better” and nine answered “(AbE) is better,” which indicates that opinions are divided in half. Among those who answered “(MJ) is better,” five subjects mentioned the reason is that MJ is written in Japanese. Four subjects, including one who mentioned that Japanese is preferred, pointed out terms of simplicity or content richness. According to these comments, we can see that AbE is not necessarily better in simplicity and content richness.
Whereas we have observed several characteristics of manual summarization through the experiments, it is not easy to draw any definite conclusions regarding the evaluation of manual summarization. This inconclusiveness indicates that more data are necessary while writing a summary of scientific papers is time-consuming. Additionally, the difficulty of concluding is also a sign that evaluation criteria could be more explicit as summaries are evaluated in a subjective manner in this study.
6.2.2. Automatic Summarization
Automatic summarization methods were used to prepare AuE and AuJ. In experiment 1, these summaries obtained lower scores and significant differences in the (AbE,AuJ) and (AbE,AuE) pairs were found, as shown in
Table 5. One of the reasons why these summaries obtained lower scores is the existence of information that was deemed useless. Subjects gave comments such as “I cannot understand what (AuE) describes at all. There are too many unnecessary information” (by BML14). In addition, some subjects gave answers concerning consistency, for example, “(AuE) begins with ’our contributions mainly lie in three aspects,’ but only one of the aspects is mentioned” (by AmM05). According to these results, it is thought that one limitation of existing summarization methods (in this paper, we used TextRank [
27]) as the lack of consistency as pointed out in [
35].
On the other hand, we can see that AuE tackles one problem of abstracts, namely that information required by readers is not necessarily included [
4]. For example, some subjects answered that AuE is better than AbE or AbJ. Comments given included “(AuE is better than AbE because AuE) describes what is done in this research paper, while the other one (AbE) does not” (by BmM10) and “(AuE) first clarifies a final goal with the phrase ’the main objective of this paper.’ In addition, using the phrase ’towards this goal,’ it is easy to understand the actual results“ (by BML13). From these comments, it is considered that, by using automatic summarization methods, it may be possible to reduce issues regarding the original abstracts (AbE) being biased due to the author’s point of view, which is one of the advantages of these methods.
In addition, the automatic summarization method used in our experiments extracts important sentences from a target paper without any modification, so serious grammatical errors and word errors should not occur with these methods. This assumption is also supported by answers from one subject with high-level English skills (ABH01), who commented, “I think that grammatical errors and word errors were found only in Japanese summaries.“
6.2.3. Machine Translation System
We translated AbE and AuE into Japanese using Google translate as AbJ and AuJ, respectively. The results of experiment 1 show that translated summaries (AbJ and AuJ) obtained lower scores than the original ones (AbE and AuE), as shown in
Table 5. However, there were no any significant differences for the (AbE, AbJ) and (AuE, AuJ) pairs.
Negative feedback for machine translation is mostly about grammatical errors and word errors due to terminology translation and consistency. For example, some subjects mentioned that “semantic segmentation is difficult to translate in Japanese” (by BML13) and “(AuJ) is difficult too read, even if the summary is written in Japanese” (by BmM10). One possible reason is that the translation of specific words such as “proposed method” and “prior work” are wrong because the Google translate system is not intended for research articles.
On the other hand, 35% of the subjects answered that they preferred translated summaries (AbJ and AuJ) in experiment 1. In addition, in subsequent questions of experiment 2, about 60% of subjects answered “I think that 50% of the Japanese summaries, even if they contain grammatical errors, are better.“ Therefore, although there are grammatical errors and word errors in the machine translated results, some subjects may feel that there is an advantage in reading summaries in their mother tongue (Japanese).
6.3. Limitation Concerns for Future Directions
Here, we discuss some concerns of this study that can be tackled in future work. This study utilized automatic text summarization and machine translation techniques to generate a Japanese summary from a scientific paper written in English. The evaluation by the subjects could be affected by the qualities of the two methods, but it does not remain easy to distinguish these factors. For future work, it will be important to handle two factors separately. One possible solution is to prepare manually written summaries in English as well as in Japanese. Preparing manually written summaries in English and Japanese enables a comparison of manually generated summaries in Japanese written by a native Japanese speaker and translated from English into Japanese. It is also possible to compare manually and automatically generated summaries in English, which was not considered in this study.
Furthermore, in our experiments, we did not separate the benefit of translation into Japanese and linguistic error caused by machine translation. To investigate the advantage of translation into Japanese, evaluating summaries translated into Japanese without any linguistic errors caused by the translation is necessary. For further study, it will be interesting to ask a professional translator to translate summaries into Japanese.
Another concern is that we used CV papers only. Papers in other disciplinary areas might have different characteristics. Therefore, using papers in different fields such as humanity or social science will be an important research topic.
Finally, evaluations in both experiments 1 and 2 are highly subjective. In experiment 1, we asked the subjects to judge which summary was better or not. Each subject could evaluate summaries with their criteria, which is highly subjective. However, we can identify what characteristics the subjects think are necessary for a good summary. One future direction will be interviewing each subject so that we can deeply understand their evaluation criteria. In experiment 2, the subjects were asked to judge whether they would like to read the original paper. However, each subject has their preference on the topic, which could affect the answers. We designed this experiment to realize the users’ behavior under the practical scenario of finding relevant papers by reading summaries. A detailed analysis of an individual case is meaningful, including the relationship between subjects’ preferences and scores in experiment 2. Additionally, though we shuffled the order of summaries for each subject, there is no guarantee that reading different orders by the same subject does not affect the result. Comparison among subjects who read different orders but have similar preferences will be also important to consider the bias.
7. Conclusions
We conducted two user tests on a sample of Japanese university students’ to gauge their opinions and preferences concerning scientific paper summarization. In experiment 1, we asked subjects to compare several summaries generated by manual and automatic methods and found unique characteristics of scientific publications which readers regard as important (e.g., structures of research articles and specialized terminology). In addition, whereas automatic machine translation tools such as the Google translate are prone to grammatical and word errors, some subjects, especially low-level and medium-level students, provided positive feedback that translations into their mother tongue (in this paper, Japanese) is better. In experiment 2, we provided subjects with several summaries, and asked them whether they would like to read the original papers after reading the summaries. The experimental results showed that specific components of scientific publications (i.e., the topic and methods) are pivotal for determining subjects’ judgments and decisions.
In future work, we will build a summarization system that considers the user’s preference. This direction enables efficiently exploring important information in scientific papers for judging which papers to read. We also plan to simplify the paper’s terminologies [
36] that could create confusion in understanding and improve machine translation systems. This could have important advantages for students without prior knowledge of scientific research and/or languages other than their mother tongue. We believe that the results presented in this paper offer a step toward the acceleration of research in the field of scientific paper summarizations.


 ,
, 


