Article

Impacts on Indoor Thermal Comfort and Heating Energy Use in Hellenic Dwellings from Occupant Behavioral Reactions

by
Elena G. Dascalaki
* and
Constantinos A. Balaras
Group Energy Conservation, Institute for Environmental Research and Sustainable Development, National Observatory of Athens, GR-15236 Athens, Greece
*
Author to whom correspondence should be addressed.
Appl. Sci. 2021, 11(14), 6254; https://doi.org/10.3390/app11146254
Submission received: 26 May 2021 / Revised: 30 June 2021 / Accepted: 1 July 2021 / Published: 6 July 2021
(This article belongs to the Special Issue Thermal Comfort and Indoor Air Quality in the 2021 Built Environment)

Abstract

:
In an effort to reduce the operational cost of their dwellings, occupants may even have to sacrifice their indoor thermal comfort conditions. Following the economic recession in Greece over recent years, homeowners have been forced to adapt their practices by shortening heating hours, lowering the indoor thermostat settings, isolating spaces that are not heated or even turning off their central heating system and using alternative local heating systems. This paper presents the results from over 100 occupant surveys using questionnaires and walk-through energy audits in Hellenic households that documented how occupants operated the heating systems in their dwellings and the resulting indoor thermal comfort conditions and actual energy use. The results indicate that the perceived winter thermal comfort conditions were satisfactory in only half of the dwellings, since the actual operating space heating periods averaged only 5 h (compared with the assumed 18 h in standard conditions), while less than half heated their entire dwellings and only a fifth maintained an indoor setpoint temperature of 20 °C, corresponding to standard comfort conditions. Mainstream energy conservation measures include system maintenance, switching to more efficient systems, reducing heat losses and installing controls. This information is then used to derive empirical adaptation factors for bridging the gap between the calculated and actual energy use, making more realistic estimates of the expected energy savings following building renovations, setting prudent targets for energy efficiency and developing effective plans toward a decarbonized building stock.

1. Introduction

Primary energy consumption in the European Union (EU) of the 27 member states (EU-27) has reduced by 1.1% since 1990, the first year for which official data are available [1], reaching 1351.9 million tonnes of oil equivalent (Mtoe) in 2019 (Figure 1). During the same period, the final energy consumption in the EU-27 increased by 3.2%. In recent years, the highest final energy consumption was recorded in 2006 (990.1 Mtoe). The annual fluctuations are mostly attributed to the prevailing weather conditions (e.g., a sharp increase in heating demand during the cold winter in 2010 or the decrease during the mild winters in 2013 and 2014). Other major influencing factors that drive some of the dropping trends are attributed to the reduced economic activity during the periods of the financial and economic crises (e.g., 2008–2009, 2011–2014) and in part to the improvements in energy efficiency due to new policies.
Over the years, the building sector has been dominating the overall final energy balance, increasing from 36.9% in 1990 to 40.1% in 2019. In particular, the residential sector prevails in the existing building stock, representing over 26% of the EU-27 final energy use in 2019 [1]. For this reason, energy efficiency has been and remains the first priority of EU policies moving toward the next challenge of a decarbonized EU building stock and economy by 2050.
To support these policies, various European directives are paving the way. For example, the Energy Performance of Buildings Directive (EPBD) [2] that was first introduced in 2002 and is already under its third revision. According to the EPBD, all new constructions are nearly zero energy buildings (nZEB) as of 2021, with an emphasis shifting to the renovation wave of existing buildings, life cycle assessment, embodied energy and smart readiness among other factors. The Energy Efficiency Directive (EED) [3], which was first introduced in 2012, established a set of binding measures to help the EU reach its 20% energy efficiency target by 2020, preparing aspects such as national energy efficiency action plans and minimum energy efficiency standards and labeling. The amended EED in 2018 defined an energy efficiency target for 2030 of at least 32.5% to be achieved collectively for all countries. The savings are set relative to the 2007 modeling projections for 2030. In absolute terms, this translates into a primary energy consumption of no more than 1128 Mtoe for the EU-27 and a final energy consumption of no more than 846 Mtoe in 2030 (Figure 1). Considering the unprecedented events of 2020 in relation to the COVID-19 pandemic and the overall slowdown of European economic activities, it will most likely be possible to finally meet both the primary and final energy targets for 2020. However, given the current trends, it will be very challenging to meet the 2030 targets. The dotted lines in Figure 1 represent a linear trajectory between the year with the highest energy consumption (2006) and the 2030 targets. Under the EED, the EU member states will have to achieve new annual energy savings of 0.8% of the final energy consumption for the period of 2021–2030, except for Cyprus and Malta, which will have to comply with 0.24% annual savings. Details for each EU member state are outlined in the 10-year national energy and climate plans (NECPs).
In order to properly prioritize the energy efficiency measures, one needs to consider the grim reality of the European building stock. About 75% of the buildings are energy inefficient, and less than 1% of the buildings are renovated every year, while new buildings in compliance with the EPBD mandates represent less than 8% of the building stock [4]. Residential buildings use 246 Mtoe or over 26% of the EU-27 total final energy consumption [1]. Looking at the breakdown of the annual energy used in the residential sector, the main energy end use is space heating, which represents ~63% of the total (Figure 2a).
The estimated total operational energy use intensity (EUI) averaged 169.5 kWh/m2 [7] and has decreased over the past two decades by ~15.5% (Table 1). The data are scaled to the European average climate in order to alleviate the influence of a cold or mild winter on increasing or reducing the heating energy consumption compared with a normal winter. The climatic corrections on the indicators are derived by correcting the space heating component of the final energy consumption using heating degree days (HDD) to correspond to normal winter conditions [8]. For example, the values in Europe range from 700 to 800 HDD in Cyprus and Malta and up to 4000–5000 HDD in the Nordic and Baltic countries, averaging ~2800 HDD for the normal EU-27 climate. The EUIs for space heating have decreased by 26.5% (Table 1) from 148.4 kWh/m2 in 2000 down to 109.0 kWh/m2 in 2018 as a result of building and equipment energy efficiency improvements and different living standards, among other factors. Considering the divergence of climate conditions across Europe, it is more relevant to use normalized indicators to compare data from different countries that have different space heating demands.
Since 2000, energy efficiency progress has been significant in the residential sector according to the ODEX index [8], which aggregates unit consumption changes. The ODEX for the residential sector is calculated as a weighted average of unit consumption trends at the level of the different end uses for households. Since 2000, the European residential sector achieved the largest energy gains among all the different sectors [9], averaging 1.5% per year to reach a technical energy efficiency index of 72.5% in 2018 (Table 1).
On the other hand, the share of the population at risk of poverty or social exclusion is 21.9%, resulting in 7.4% of the inhabitants being unable to keep their homes adequately warm [10]. In this direction, the installation of thermal insulation on the opaque building elements is among the popular energy conservation measures (ECMs) to reduce heating energy demand [11].
As buildings move into the era of electrification, efforts will focus on further reducing the primary energy use by moving toward improving the energy mix with more renewables for green electricity generation. This will further lower the primary energy factor (PEF), which currently averages ~2.3 in the EU-27 and is calculated by dividing the primary energy demand of electricity generation by the electricity delivered to final uses, including transmission and distribution losses. In the building sector, having placed the foundations of nZEBs for new buildings, the next big challenge is renovating the existing building stock. The priority is serving the well-being of occupants and improving the indoor environmental quality (IEQ) during building renovations while improving the energy performance of existing buildings. Minimizing the loads for heating, cooling, ventilation, lighting and appliances, using energy efficient equipment to serve the low demands and coupling with systems that exploit renewables will make it possible to move toward the ambitious decarbonization goals.
Normative calculations are used to estimate energy savings and the abatement of carbon emissions that shape European policies and integrated national energy and climate plans. However, it has been well documented that there is a significant gap between the calculations and actual energy use in dwellings, with similar trends in various European countries like the United Kingdom, France, the Netherlands and Germany [12]. These differences may be the result of different occupant behaviors, actual equipment performance or thermophysical envelope properties, among other factors. As a result, these differences influence the analysis of available information from energy performance certificates (EPCs) and the estimation of the expected energy savings that motivate different action plans, and they help assess the cost-effectiveness of different policies.
Similar results have also been observed in Greece [13]. Normative calculations, according to European standard EN 13790 and national specifications for assessing and labeling the energy performance of buildings, are performed using predefined conditions [14]. For example, the regulations prescribe specific operating periods for the heating systems in the calculations, consider that the entire dwelling is heated and set the indoor temperature at a constant temperature. These are logical assumptions, and a model can be calibrated for converging to the actual building performance. This is important prerequisite information for performing accurate energy assessment of new buildings or estimating energy savings as a result of implementing ECMs and for performing realistic technoeconomic studies. However, it can be cumbersome to assess large renovation programs and policies for a large pool of buildings or practically impossible for large portfolios or regional or national building stocks.
Accordingly, the interpretation of dropping trends of energy use in the residential sector or a very low EUI for a dwelling is not by default a positive or a desirable characteristic unless the IEQ issues are properly addressed. This is one of the major concerns when looking at actual energy use data and, from that alone, trying to derive an assessment about a building’s performance. Furthermore, calculations or even detailed building simulations may also predict energy consumptions that exhibit significant deviations from the actual energy consumption as a result of, for example, diverging default values from the actual operating conditions, the prevailing indoor conditions and the role of the occupants in the operation of the installations [13,15,16,17].
More realistic estimates of the actual energy use can be made by gaining a better understanding of how some determinant calculation assumptions may deviate in practice. For example, occupants interact with their indoor environment and control the operation of the building’s technical installations in ways that do not comply with standard or other prescribed conditions. Furthermore, the inelasticity of heating needs combined with increasing energy prices, an economic crisis or fuel poverty may significantly impact heating demand and result in adverse indoor conditions [18]. Insights on how occupants actually use the heating systems in their dwellings can support a more realistic assessment of energy consumption for space heating, which is the biggest end use in residential buildings. Apparently, there are also implications on indoor thermal comfort conditions that occupant surveys can shed light on for the interpretation of indoor conditions.

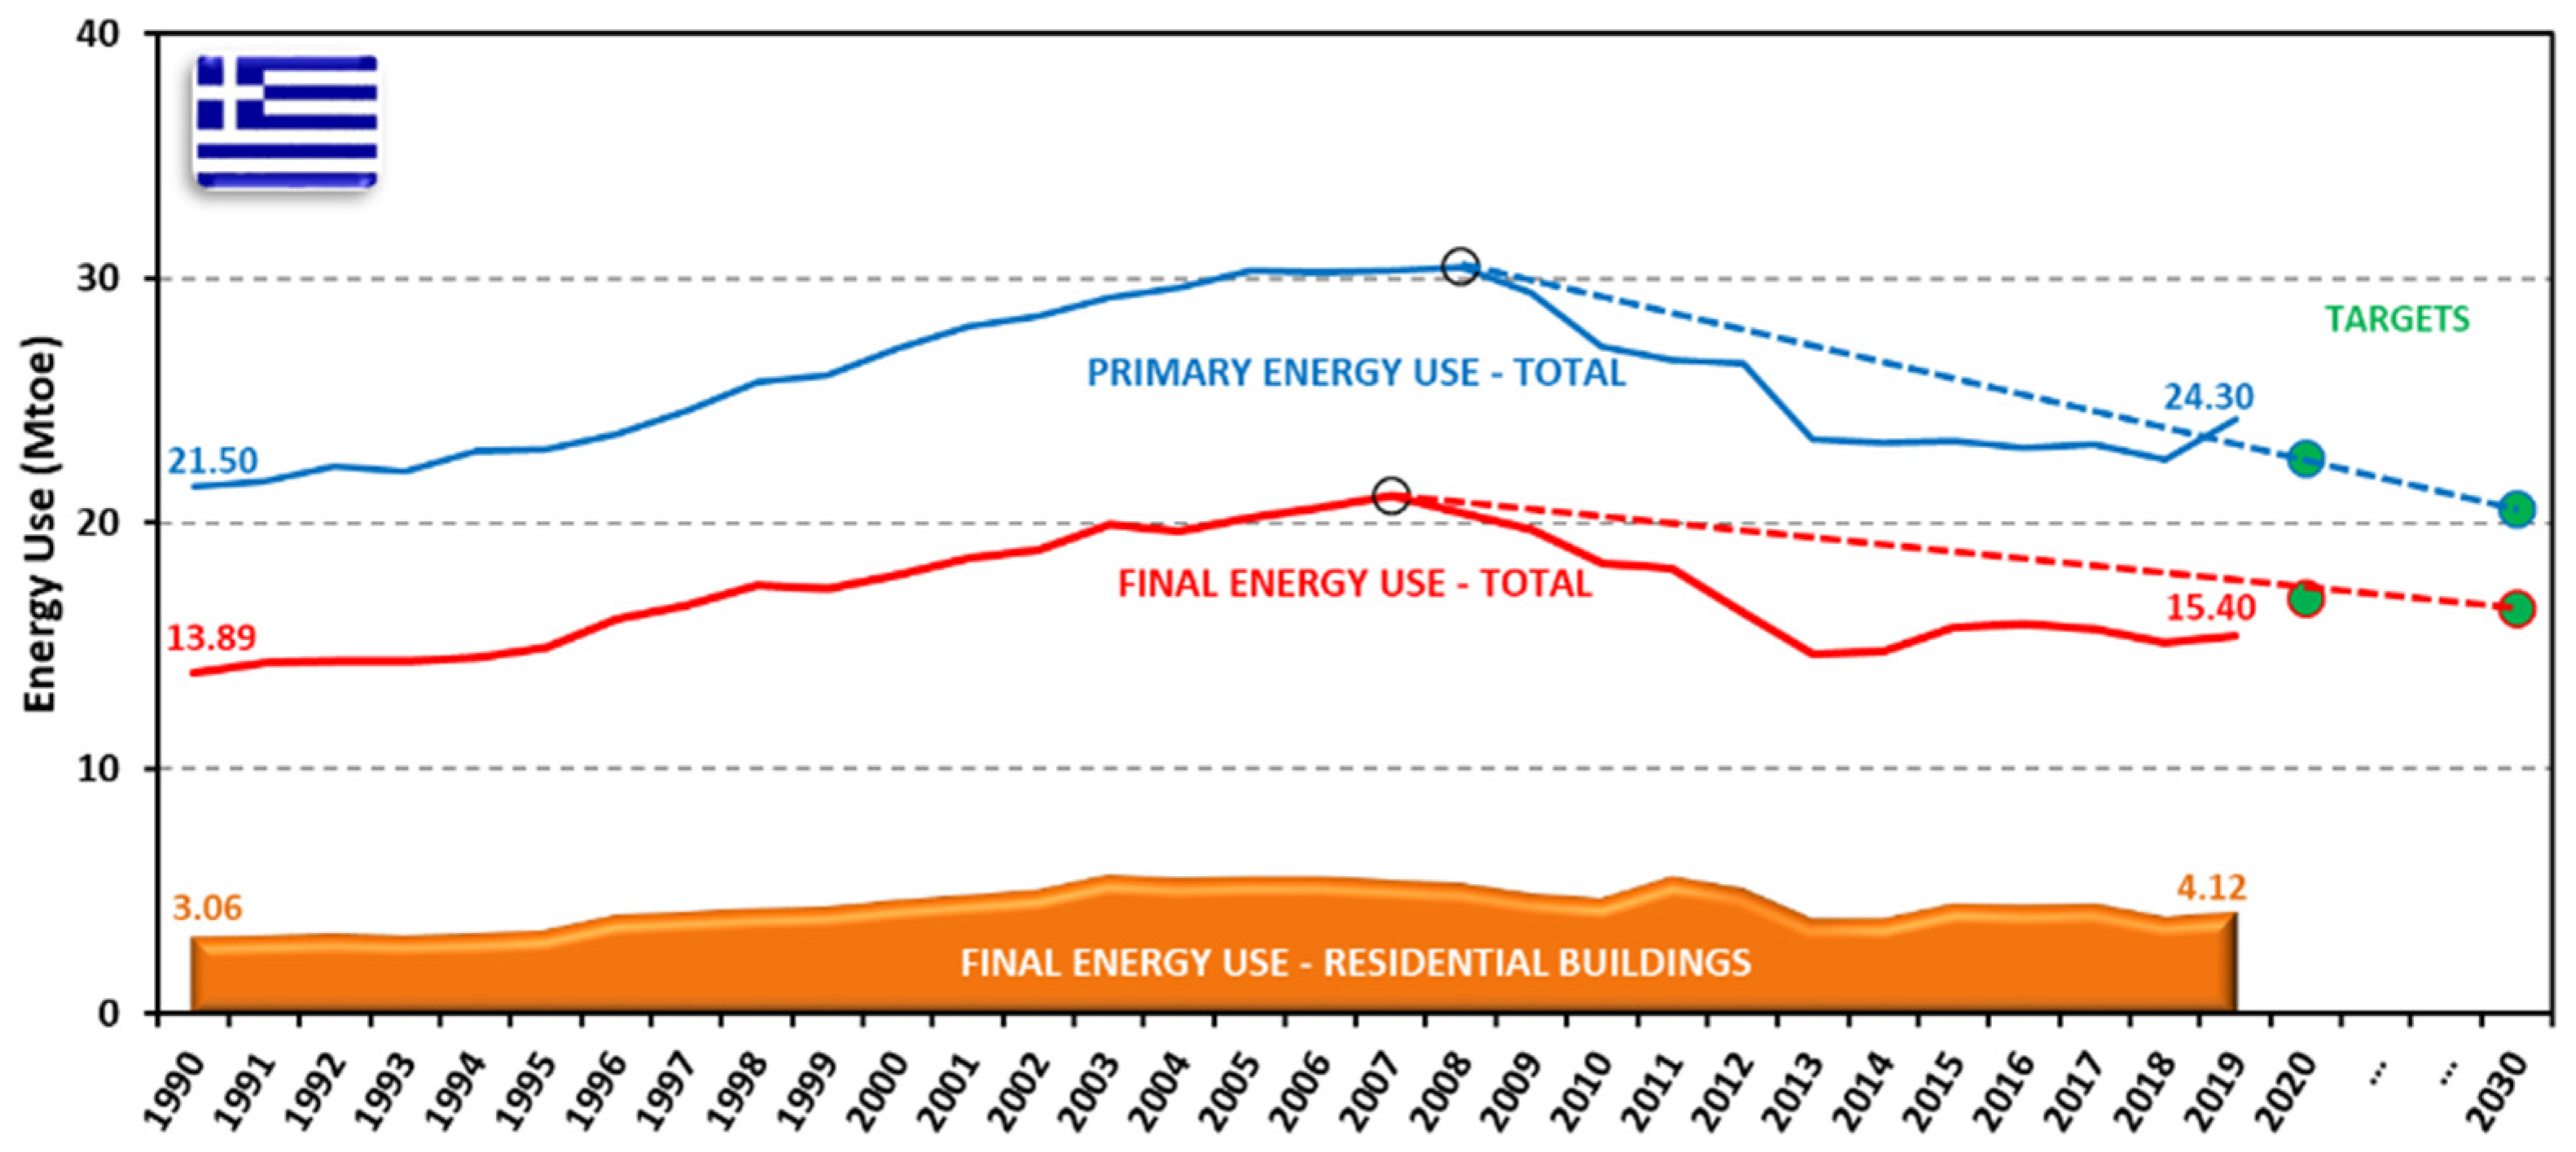
1.1. Hellenic Residential Buildings

In Greece, primary energy use has increased by 12.7% since 1990, reaching 24.3 Mtoe in 2019, while final energy use increased by 10.9% during the same period, reaching 15.4 Mtoe in 2019 (Figure 3). Following the peaks of primary energy use in 2008 at 30.5 Mtoe and for final energy use in 2007 at 21.1 Mtoe, there was a noticeable drop as a result of the economic recession during this past decade. According to the latest NECP, the updated national targets for 2030 of 20.6 Mtoe for primary energy consumption and 16.5 Mtoe for final energy consumption appear to be modest and have low ambition, respectively [19]. Energy efficiency in buildings is expected to continue driving most of the national policies and measures to meet the national efficiency targets. For 2021–2030, the plan is to renovate over 600,000 homes, which represents ~15% of the existing stock [19]. The ongoing energy renovation financing program (Saving at home) has been very well received and is popular with homeowners. However, considering that the work may not all consist of major energy renovations, it may not be sufficient to facilitate the decarbonization of the building stock by 2050.
Hellenic residential buildings use 4.1 Mtoe, or about 27% of the total final energy consumption in Greece (Figure 3). Based on the national building census [20], one can estimate that the number of exclusive use residential buildings has exceeded 2 million and represents ~80% of the building stock, with ~6.5 million dwellings and a gross floor area of ~485·106 m2. Only ~1% of the building stock complies with the new EPBD energy performance regulation. The main energy end use is space heating, representing 64% of the annual energy used in the residential sector (Figure 2b). This is attributed to peoples’ low thermal tolerance to relatively low temperatures and adverse weather conditions in several parts of the country, exceeding 2500 HDD in the north. The total EUI averages 133.3 kWh/m2 and 87.8 kWh/m2 for space heating under normal climate conditions (Table 1). Energy efficiency in the residential sector has registered significant improvements since 2000, reaching 71.3% in 2018. The impact of the economic recession and, in part, the implementation of energy efficiency measures are the main drivers for the decrease in the ODEX indicator [9].
Among the various staggering statistics resulting from the unprecedented financial crisis over the past decade and the escalating energy costs in Greece, something that stands out is that the share of the population at risk of poverty or social exclusion has climbed to 31.8%, while 22.7% of the inhabitants are unable to keep their home adequately warm [10]. As a result, there have been a multitude of serious implications, including the struggle of building occupants to handle operational energy costs by, for example, simply reducing the space heating operating hours, seeking alternative and cheaper energy heating sources or limiting the heated spaces of their dwelling. Apparently, these actions will negatively impact the IEQ and may even force occupants to sacrifice their thermal comfort conditions.
Along these lines, this work utilizes data collected from short energy audits and occupant questionnaires that reflect practical trends for the use of heating in Hellenic dwellings and other behavioral aspects. The objective is not to replicate a detailed study similar to national surveys, which are demanding in terms of time and costly to implement. Instead, the intent is to have a simple to implement, easy to reproduce and periodically updated method in order to collect relevant data. For that reason, the overall approach does not aim to collect detailed data. The work focuses on space heating, which represents the largest energy end use in residential buildings. The aim is to collect specific data that will enhance our knowledge in order to adapt normative energy calculations for national building stocks. Accordingly, the collected data will complement large-scale calculations of large and diverse building portfolios with field data on the type of heating systems that are used at home, the actual operating hours and indoor setpoint temperatures and the coverage of heated spaces in dwellings. As a result, the collected data are not expected to be used for an elaborate indoor environmental assessment, which is best served by more detailed occupant questionnaires for measuring comfort, health and energy habits [21] or replacing well-established and targeted protocols [15].

1.2. Occupant Behavior
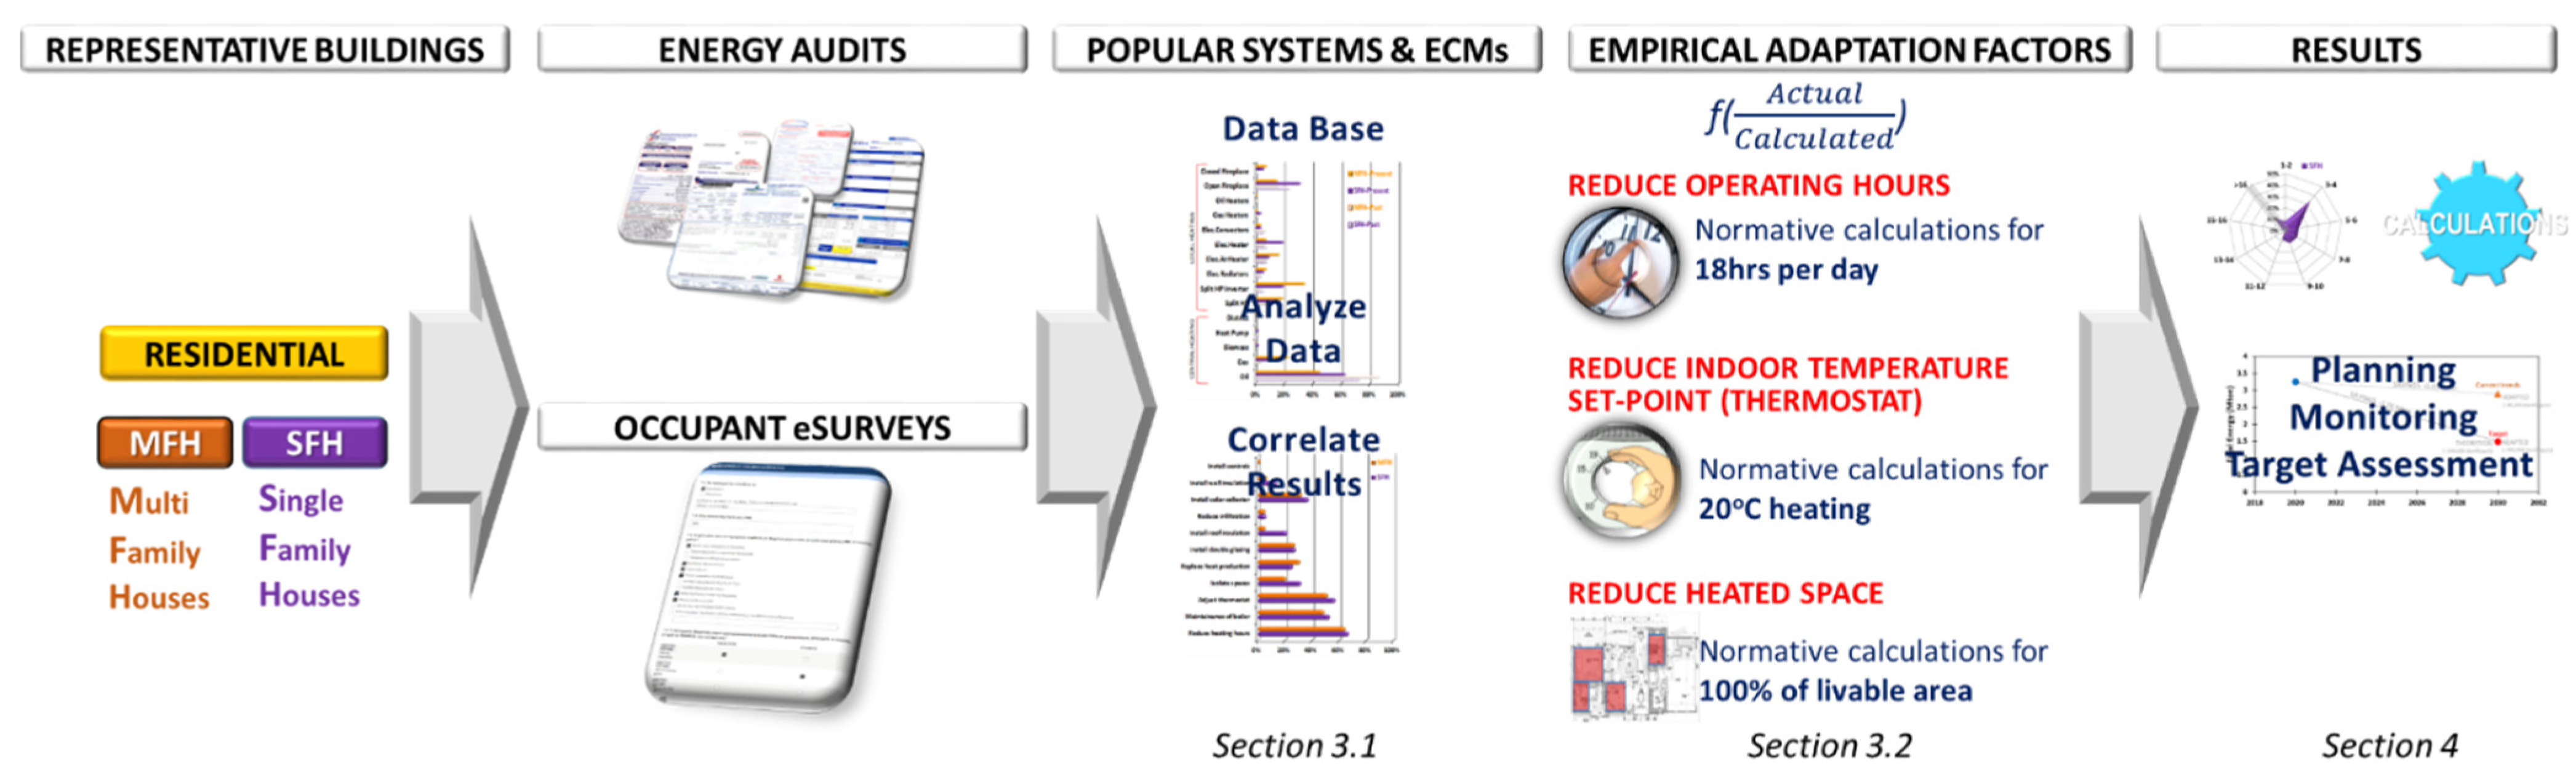
Buildings, like vehicles, are driven by their occupants. Several international studies have documented that energy use in buildings is closely linked to occupant presence, movement and interaction with building energy devices and systems [22,23,24]. The assumed occupant behaviors, setpoints and indoor conditions as well as other simplified assumptions in building energy calculations will result in significant deviations between the estimated and actual energy use. As a result, these deviations make it even more challenging for policy makers to realistically assess the impacts of incentive policies and make accurate projections of future energy use in the building sector.
A previously published detailed literature review underlined the need for more empirical data in order to improve predictions by calibrating models [25]. More recent studies have also reviewed evidence from the literature in an effort to quantify the role of the occupants’ behavior in the actual energy performance of a building [26]. The deviations ranged from −38% to +96%, although there were deviations among the various studies that followed different approaches in the range and quality of data, the normalization procedures and other factors that may have led to different conclusions.
Occupant behavior results in higher or lower energy consumption by interacting with the building’s heating, cooling and lighting systems which, in turn, results in different indoor conditions. This gap has been quantified by several studies. On a building scale, the approach to bridging the gap is to calibrate detailed simulations by creating realistic digital twins [27] to accurately assess building energy performance, accurate indoor conditions and energy use by following the available calibration methodologies [28]. For large building portfolios and building stock modeling, this is a cumbersome approach and a need more practical and general approaches.
Among the different approaches, the performance gap has been quantified using data from energy performance certificates [29]. On one hand, EPC intrinsic errors, including procedural differences, experience among energy experts performing the energy audits and assumptions for missing data are some of the reasons behind a variation of ±20% in the assessment of a building’s energy consumption [30]. On the other hand, the overarching observation from comparing the actual and calculated energy consumption from EPCs is that low performance buildings use significantly less energy than what was calculated (usually referred to as the prebound effect), while buildings with high performance use somewhat more energy than expected (usually referred to as the rebound effect). For example, in Greece, dwellings may use less energy than calculated by about −46% in houses and −43% in multi-family apartments [13]. In Switzerland, the prebound effect was quantified at −23% [31]. When comparing French and German low-performance dwellings, on average, the calculated energy use of French houses was lower (i.e., under-consuming) compared with German ones, leading to prebound effects of −7.4% compared with −13.9%, respectively [32]. The discrepancy increased to −31.5% for French houses, compared with −10.5% for German houses, for better energy performance buildings. A high prebound effect and low income is usually related to fuel poverty. Low-performance and inefficient buildings are usually occupied by people with low incomes, suffering from fuel poverty [33] and facing financial difficulties that prohibit them from paying for the energy that is necessary to maintain a proper IEQ or for an energy renovation of their dwelling.
Similar deviations were also observed in Irish houses, with actual energy savings of −22% for low-performance dwellings and even reaching up to −70% for high (very good) performance dwellings [34]. In the Netherlands, low-performance dwellings have much lower energy use, while the ones with high performance have a low energy use higher than calculated [35]. The patterns on the effectiveness and actual energy savings before and after thermal renovations in Dutch dwellings are also related to the habits of the building occupants, which remain the same, using more or less energy than calculated [36].
The more recently published literature on the interactions between occupant behavior and building energy efficiency were reviewed in [15]. Progressively more studies focused on the technical, constructional, financial and socioeconomic effects and occupant interaction effect on energy use. This way, it is possible to gain a better understanding of occupants’ behavior, which is an important parameter for reducing energy use in the built environment.
Occupant interactions, among other influencing factors, can significantly impact building energy efficiency related to the heating, ventilation and air conditioning system, the lighting system and the hot water supply, among other elements [37]. In addition, other occupants’ information, such as setpoints, income levels, homeownership and gender, have been identified to potentially influence the energy use in buildings, and some studies have investigated the related energy impacts.
Beyond the traditional methods of interviews and surveys for assessing occupant behavior, which is a critical factor in building energy performance [38], monitoring different aspects of human occupancy will generate vast amounts of data that need to be analyzed to extract the relevant information using stochastic or deterministic models. Given the advancement of sensors and communication technologies, various energy feedback approaches are also gaining attention for communicating back to the occupants the status of their building’s energy use, possible actions to improve the energy performance or even the indoor conditions.
A survey study of behavioral patterns on the basis of occupant behavior and energy user profiles in Dutch homes revealed how the ages of the occupants and their financial income related to space heating [39]. The results showed that low energy use is commonly recorded in low-income homes. Similar studies in Dutch households have also documented that people with different environmental concerns preferred different ECMs, while low-income homes are also less willing (able) to apply (afford) energy conservation measures in their homes.
The influence of occupants on space heating and their energy use practices in Danish households were investigated using a questionnaire and administrative data [40]. The results indicate that adjusting indoor thermostats and the amount or type of clothing that occupants wear indoors influence thermal comfort sensations and the perceived indoor temperature also correlates with the building characteristics. Accordingly, occupants dress warmer in order to combat a lower indoor temperature in old low-performance (inefficient) houses. On the other hand, occupants in new high-performance (energy-efficient) houses tend to maintain a higher indoor temperature. Similar thermal adaptations and other behavioral changes, combined with an increase in space heated rooms in the house, were documented in renovated Belgian nearly and net-zero energy households, confirming rebound effects of about 20–30% [41].
Considering the building occupant preferences among the various influencing factors, it is possible to more accurately calculate the actual energy use in building stocks and large building portfolios or make more realistic assessments of the effectiveness of energy conservation measures in the residential sector. Some important issues and questions that need to be addressed in order to make more realistic assessments of actual energy use in the residential sector or the effectiveness of energy conservation measures include the following: How do occupants use their heating systems at home? What systems do they use? When do they use them? How comfortable do they feel in their home? The answers provided from national surveys were most valuable, but they were complex, time-consuming, costly and limited to census or large-scale surveys that occur every decade [6]. Along these lines, efforts to easily collect occupant responses to these important questions, following flexible and easy to implement and periodically repeat electronic campaigns, can provide insight and valuable information for adapting normative calculations and the results of building stock models.
This way, it will be possible to capture various other externalities and influencing factors that can also have an impact on how building occupants behave and use the various building systems. For example, escalating energy prices force people to limit the use of space heating in order to reduce their heating bills, even if that will result in thermal discomfort. This is a common reaction in an adverse economic environment and societies suffering from fuel poverty, when the principles of the concept known as price elasticity of demand do not fully apply [42]. Under unfavorable financial circumstances and economic instability, it is not realistic to expect that people will spend money to replace their space conditioning system with more efficient units, install thermal insulation or replace windows to reduce heat loads. For this reason, European and national policies focus on providing them with financial support to cover the renovation costs in order to improve the well-being of the building occupants. However, from an energy point of view, the renovated dwellings do not reach the anticipated energy savings due to the gap between the initially high calculated energy demand and low actual energy use.
In an effort to enhance our knowledge base, walk-through energy surveys have been ongoing over the past few years in order to collect representative data, supported by occupant questionnaires for capturing common behavioral trends in Hellenic dwellings, with simple and easy-to-replicate procedures. This limited campaign does not claim to have the robustness of a national survey, but it is simple and flexible to carry out collecting information that can be used to quantify the general trends in targeted regions and districts.
Accordingly, this work aims to provide new insight on the deviations of calculated and actual energy use in dwellings and derive empirical factors to bridge the gap resulting from actual occupant behaviors from field surveys. The focus is on space heating, which is the most important end use in the residential sector. The database has been enriched with recently collected field data. The following sections first present a short overview of the methods for collecting relevant information and the available data, followed by the analysis of the results and finally the conclusions and future work.

2. Methods

This work is part of an ongoing effort to perform electronic surveys in order to populate a database on common occupant behaviors related to their indoor home environments [13]. The electronic data collection method followed an easy to implement and repeat process with a low time–cost burden. It was based on an online electronic survey with 10 questions (Figure A1), which was circulated and completed by one occupant in each dwelling located around the country. This way, it was possible to generate a database that could be easily enriched over time and capture trends and occupant responses on popular energy conservation measures, typical trends for operating conditions and other variables. The information on the occupant behavior could then be used to derive empirical adaptation factors for bridging the gap between the calculated and actual energy use by making more realistic estimates for building stock modeling. Figure 4 illustrates the overall process of the method, and the main steps are elaborated next.
The selection of the sample was not targeted in any prescriptive manner, since participation in the occupant surveys was open and voluntary. The effort prioritized data analysis from dwellings with available actual energy use data (e.g., utilities and other energy use records). The relevant data were solicited from energy auditors who were active in energy audits, participants in postgraduate educational seminars and relevant courses that included practical projects and other professional networks. The electronic occupant questionnaire was completed once for every household.
The focus of the work reported here was on how occupants actually operated the heating systems in single-family houses (SFHs) and multi-family houses (MFHs). The surveys (Figure A1) collected information about the energy conservation measures that were implemented or other energy-related actions that may have been adopted by the occupants for reducing the operational energy of their dwellings. Additional information included the occupant’s common practices in terms of regulating the operation of their dwellings’ heating systems (in terms of time and temperature setpoints), the usable heated spaces and an overall assessment of their home indoor thermal comfort conditions.
The empirical adaptation factors were calculated as the ratio of the actual to the corresponding normative value used in the calculations (i.e., f(Actual/Calculated)). Specifically, the work considered the most relevant parameters that impact space heating, which remains the most significant energy end use in dwellings, including the following:
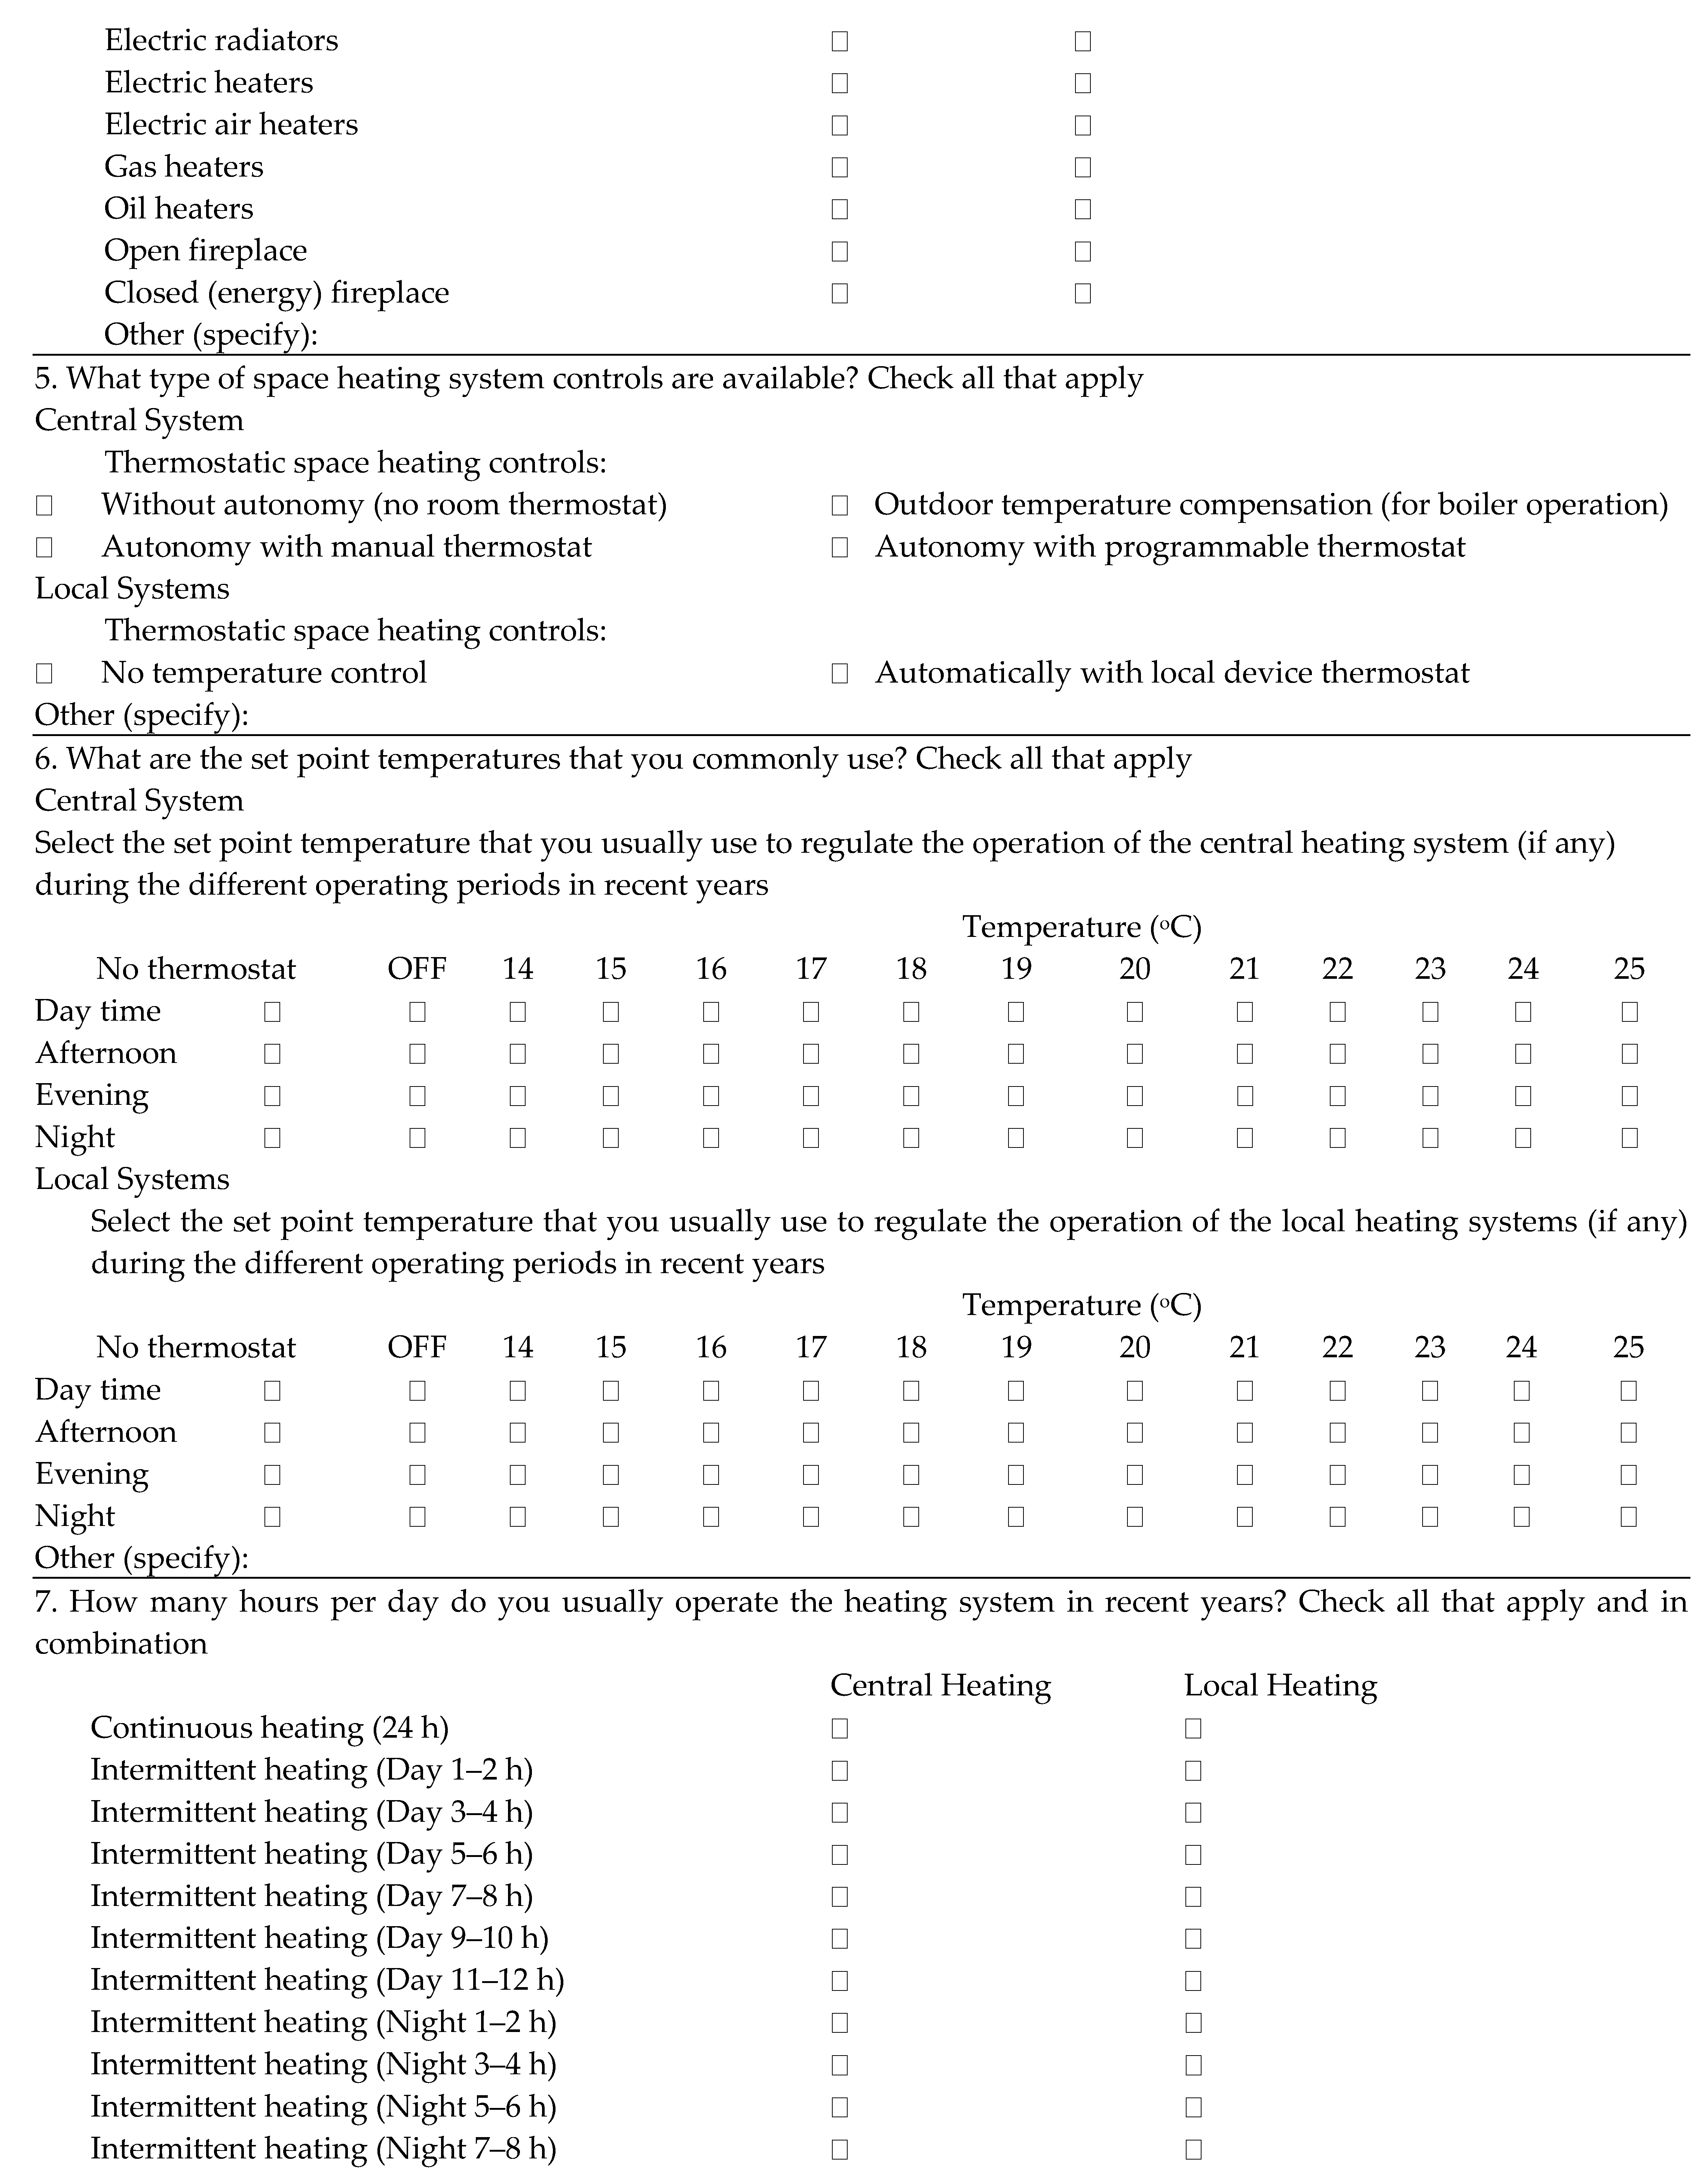
  • Operating hours, depending on how long the occupants operated the central or local heating systems in their dwellings, while the normative calculations typically considered almost continuous operation outside of sleeping hours (i.e., more than 16 h);
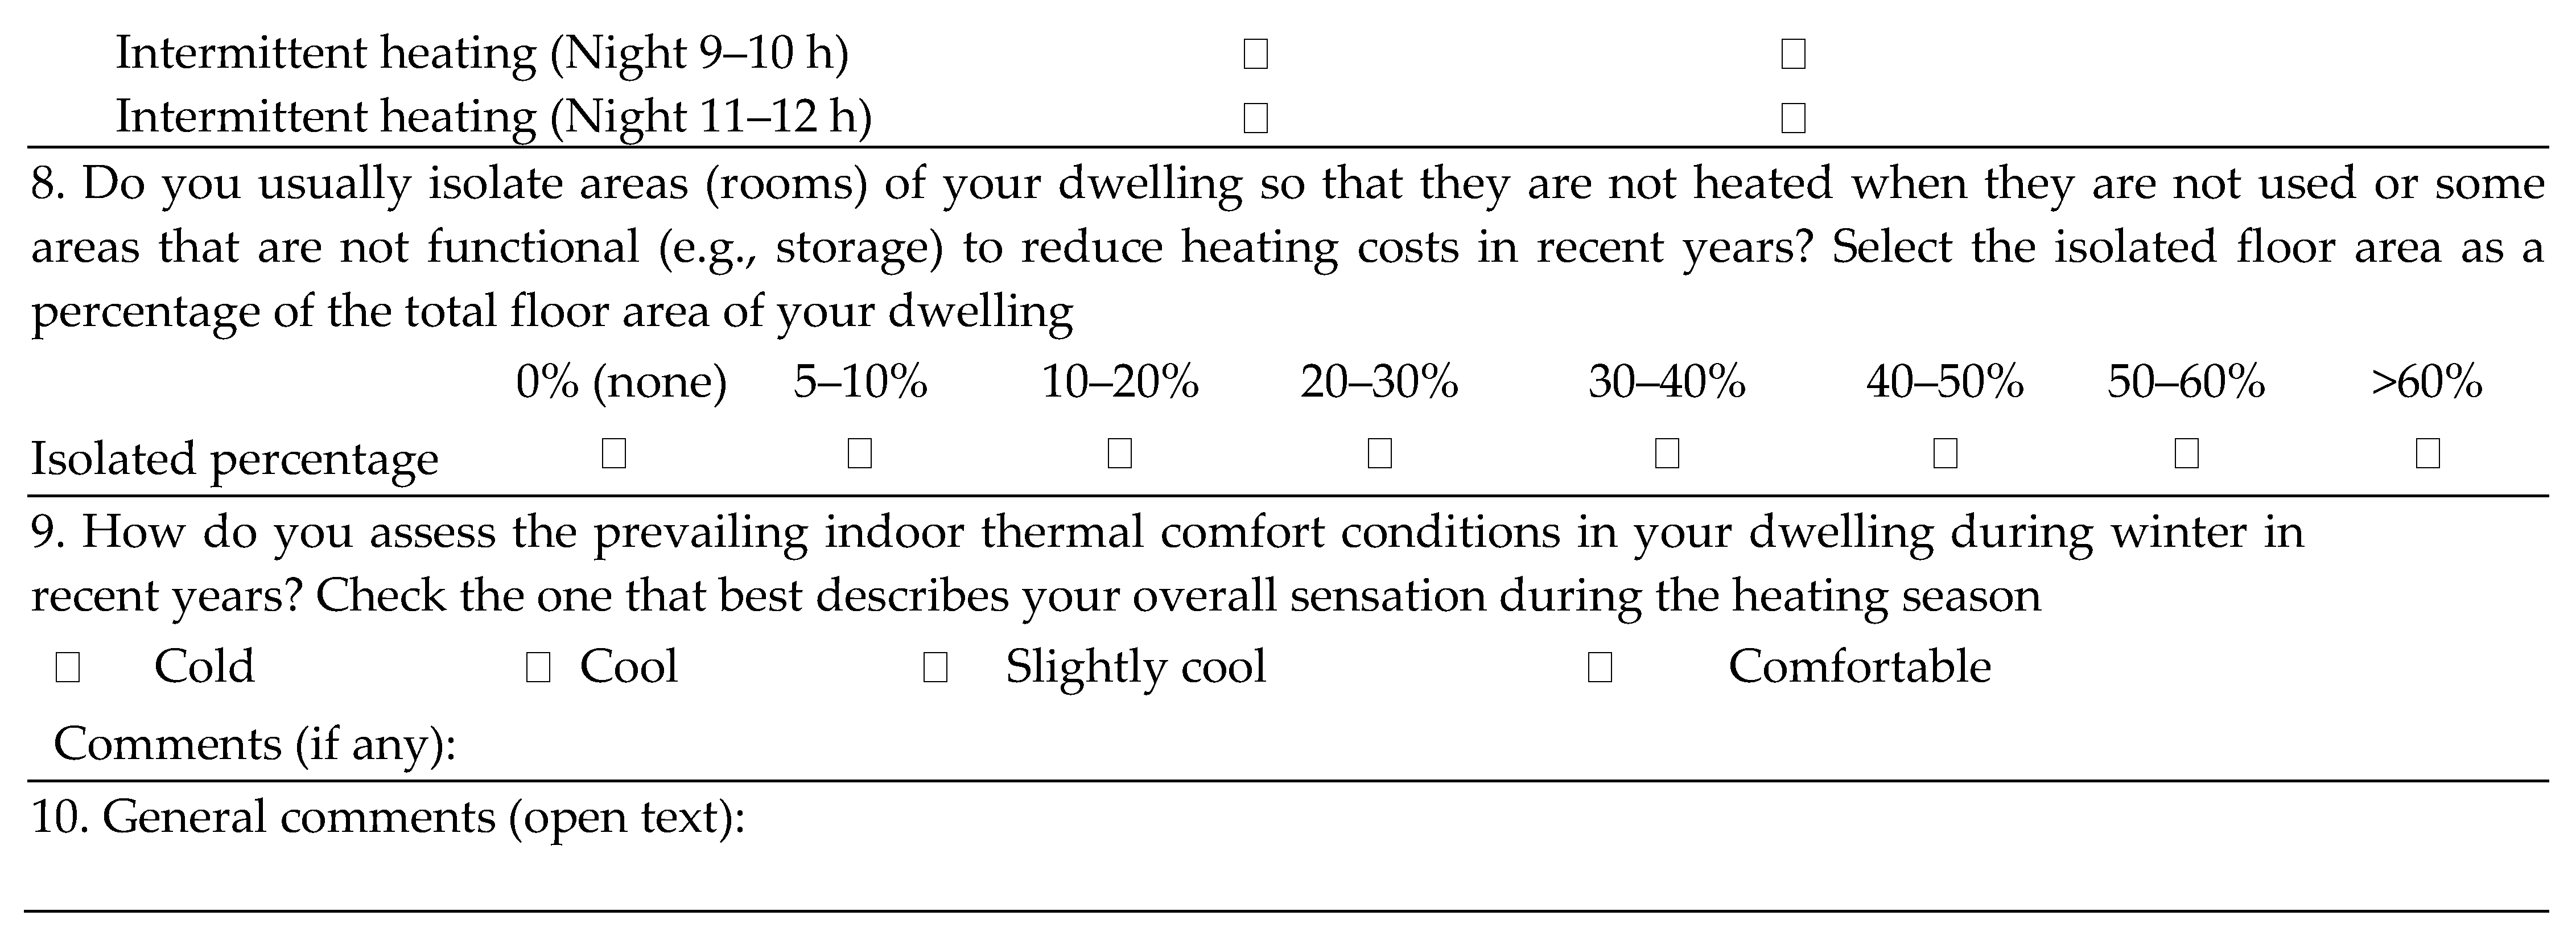
  • Heated floor area, depending on the spaces (rooms) that the occupants made use of and heated, while the normative calculations typically considered the entire livable floor area of a dwelling to be covered by the space heating system (i.e., no isolated spaces (rooms));
  • Indoor temperature setpoint, depending on the day and night temperature that occupants adjusted the space thermostat of a central heating system to or the control of a local unit, while the normative calculations typically considered a constant temperature of 20 °C;
  • Thermal comfort, depending on the prevailing indoor conditions and other personal perceptions. This was an overall assessment of the seasonal indoor thermal conditions as perceived by the occupants (e.g., comfortable, cool or cold).
For example, considering the heated floor area of a dwelling, occupants may isolate 20% of their livable space that is not typically heated. Compared with the normative calculations that considered the total useable floor area of a dwelling as being heated, the adaptation factor would be 0.8 or 80%.
Depending on the available data, these factors should have been ideally developed and used for different building types, such as SFHs and MFHs. They may have been analyzed even further along the lines of the TABULA building typologies at different locations (climate zones) and construction periods to address the complexities of national building stocks [43].
The complementary data presented in this article were collected during walk-through energy audits of the selected residential buildings. The walk-through energy survey and analysis were similar to ASHRAE level 2 audits [44], collecting information on the building’s construction, technical installations, utility bills, operation and maintenance. Simple calculations were performed to assess the current building performance and a preliminary technoeconomic assessment of the ECMs.

3. Results

In total, the data from 51 SFH and 78 MFH field surveys and questionnaires were analyzed, and the results are summarized in the following sections. The vast majority of the participants were homeowners, and only ~2% were renting. This is biased, considering that the average home ownership in Greece is ~75% [20]. For the purposes of this work, this deviation may have impacted the responses and the results in relation to some renovation actions that have high cost implications. Some simple and low-cost energy conservation measures may be implemented by a tenant. However, other more demanding energy efficiency upgrades that relate to the building envelope or its central technical installations are usually the owner’s responsibility and need the consensus of all the other property owners in the MFH.

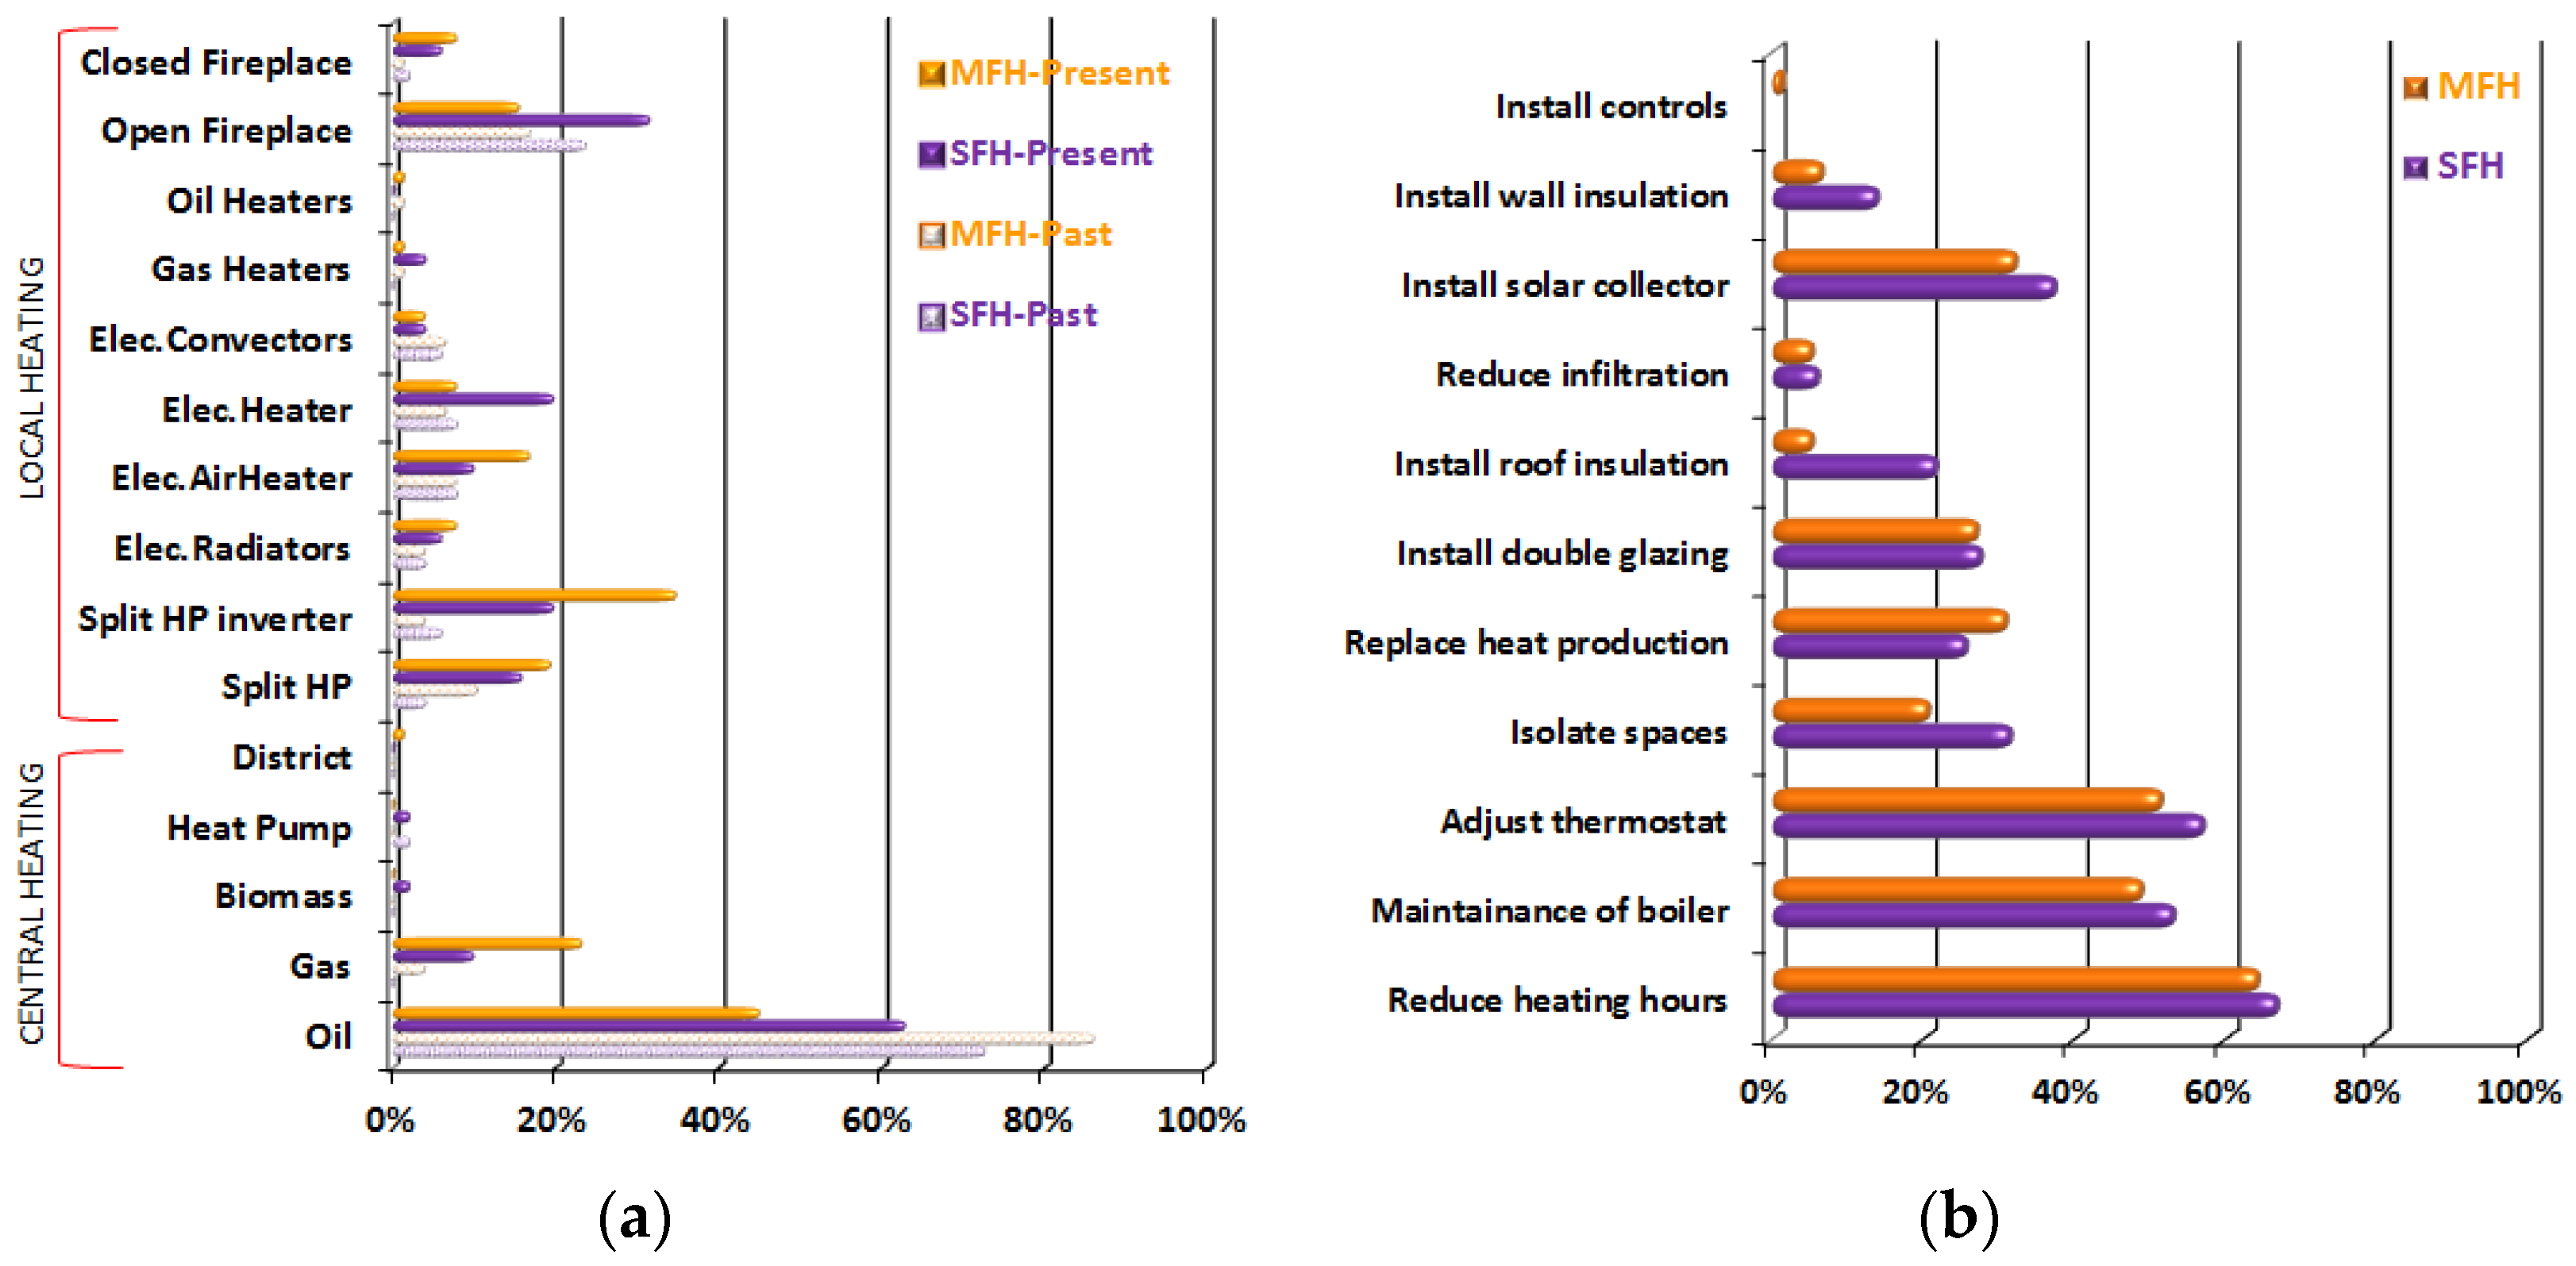
3.1. Walk-through Energy Audits

According to the data collected during this work (Figure 5a), heating oil remained the most common energy carrier used in central heating systems (i.e., 62.7% in SFHs and 44.9% in MFHs). This is in agreement with the results from the national survey [6], according to which heating oil is the most commonly used fuel (64%) for the main space heating systems in dwellings, while natural gas is still growing from 9%. As a result of the 2012 tax increase on the price of heating oil, several central heating systems in MFHs have been switched off as a result of the inability of some apartment occupants to cover utilities. Another notable trend in space heating of dwellings is switching from central heating toward a combination of different local heating systems such as the use of local split heat pumps for space heating, which were mainly used for cooling in the past. This is becoming a popular trend (e.g., 15.7–19.6% in SFHs and 19.2–34.6% in MFHs for older technology local split heat pumps and new units with inverters, respectively). What makes them attractive for users is that they are easy to install and use for local (room) conditioning and resolve issues with independent heating in MFHs that may have limited operating hours, or even in buildings that may have turned off the central heating system, which is elaborated upon more later. The use of open fireplaces, despite their low efficiency, has been gaining popularity (e.g., 31.4% in SFHs and 15.4% in MFHs) due to the relatively low cost of firewood but at a high price of increased environmental impacts in urban and suburban areas [45].
Among the audited buildings, 31.4% of the SFHs and 39.7% of the MFHs switched off their central heating systems. Popular energy conservation measures and actions for lowering operational energy costs are summarized in Figure 5b. In both SFHs and MFHs, using the heating system for fewer hours during the day was the most common action of the occupants for reducing utility bills (66.7% in SFHs and 64.1% in MFHs). Some adjusted the space thermostats, if available (56.9% in SFHs and 51.3% in MFHs), and isolated spaces of their dwellings to use less heat (31.4% in SFHs and 20.5% in MFHs). Double glazing was the most popular envelope intervention (27.5% in SFHs and 26.9% in MFHs), since it is easy to implement and also improves safety and acoustical comfort. Replacing the heat production system (25.5% in SFHs and 30.8% in MFHs) was mainly driven by also switching from heating oil to natural gas. For domestic hot water (DHW) production, the success story of installing solar thermal collectors has been growing over the years and is a very popular ECM, considered by 37.3% of SFHs and 32.1% of MFHs. For this information, the installed total solar thermal collector surface in Greece has reached 4.9 million m2 [1] or 9% of the total installed European generating capacity.
The actual primary energy consumption for space heating of the audited dwellings, when available, are illustrated in Figure 6. The EUIs were normalized for normal climate conditions by correcting the final energy consumption for space heating. Accordingly, the EUI was multiplied by the ratio of a standard value for the heating degree days (i.e., 947 HDD) to the local HDD at each building location for the corresponding time period. The final energy was then converted to primary energy for the different energy carriers using a PEF of 2.9 for electricity, 1.1 for oil and 1.05 for natural gas, which were specified in the national regulations. The data were organized for different typologies based on the year of building construction and how it related to the baseline of 1980, which was the year that the first national thermal insulation regulation was introduced in Greece. For the SFHs, the average EUI (median in parenthesis) was 91.6 (78.1) kWh/m2 for pre-1980 buildings and 108.4 (108.3) kWh/m2 for post-1980 buildings. For the MFHs, the pre-1980 EUI was 76.7 (77.5) kWh/m2, and it was 70.0 (67.1) kWh/m2 for post-1980 buildings.

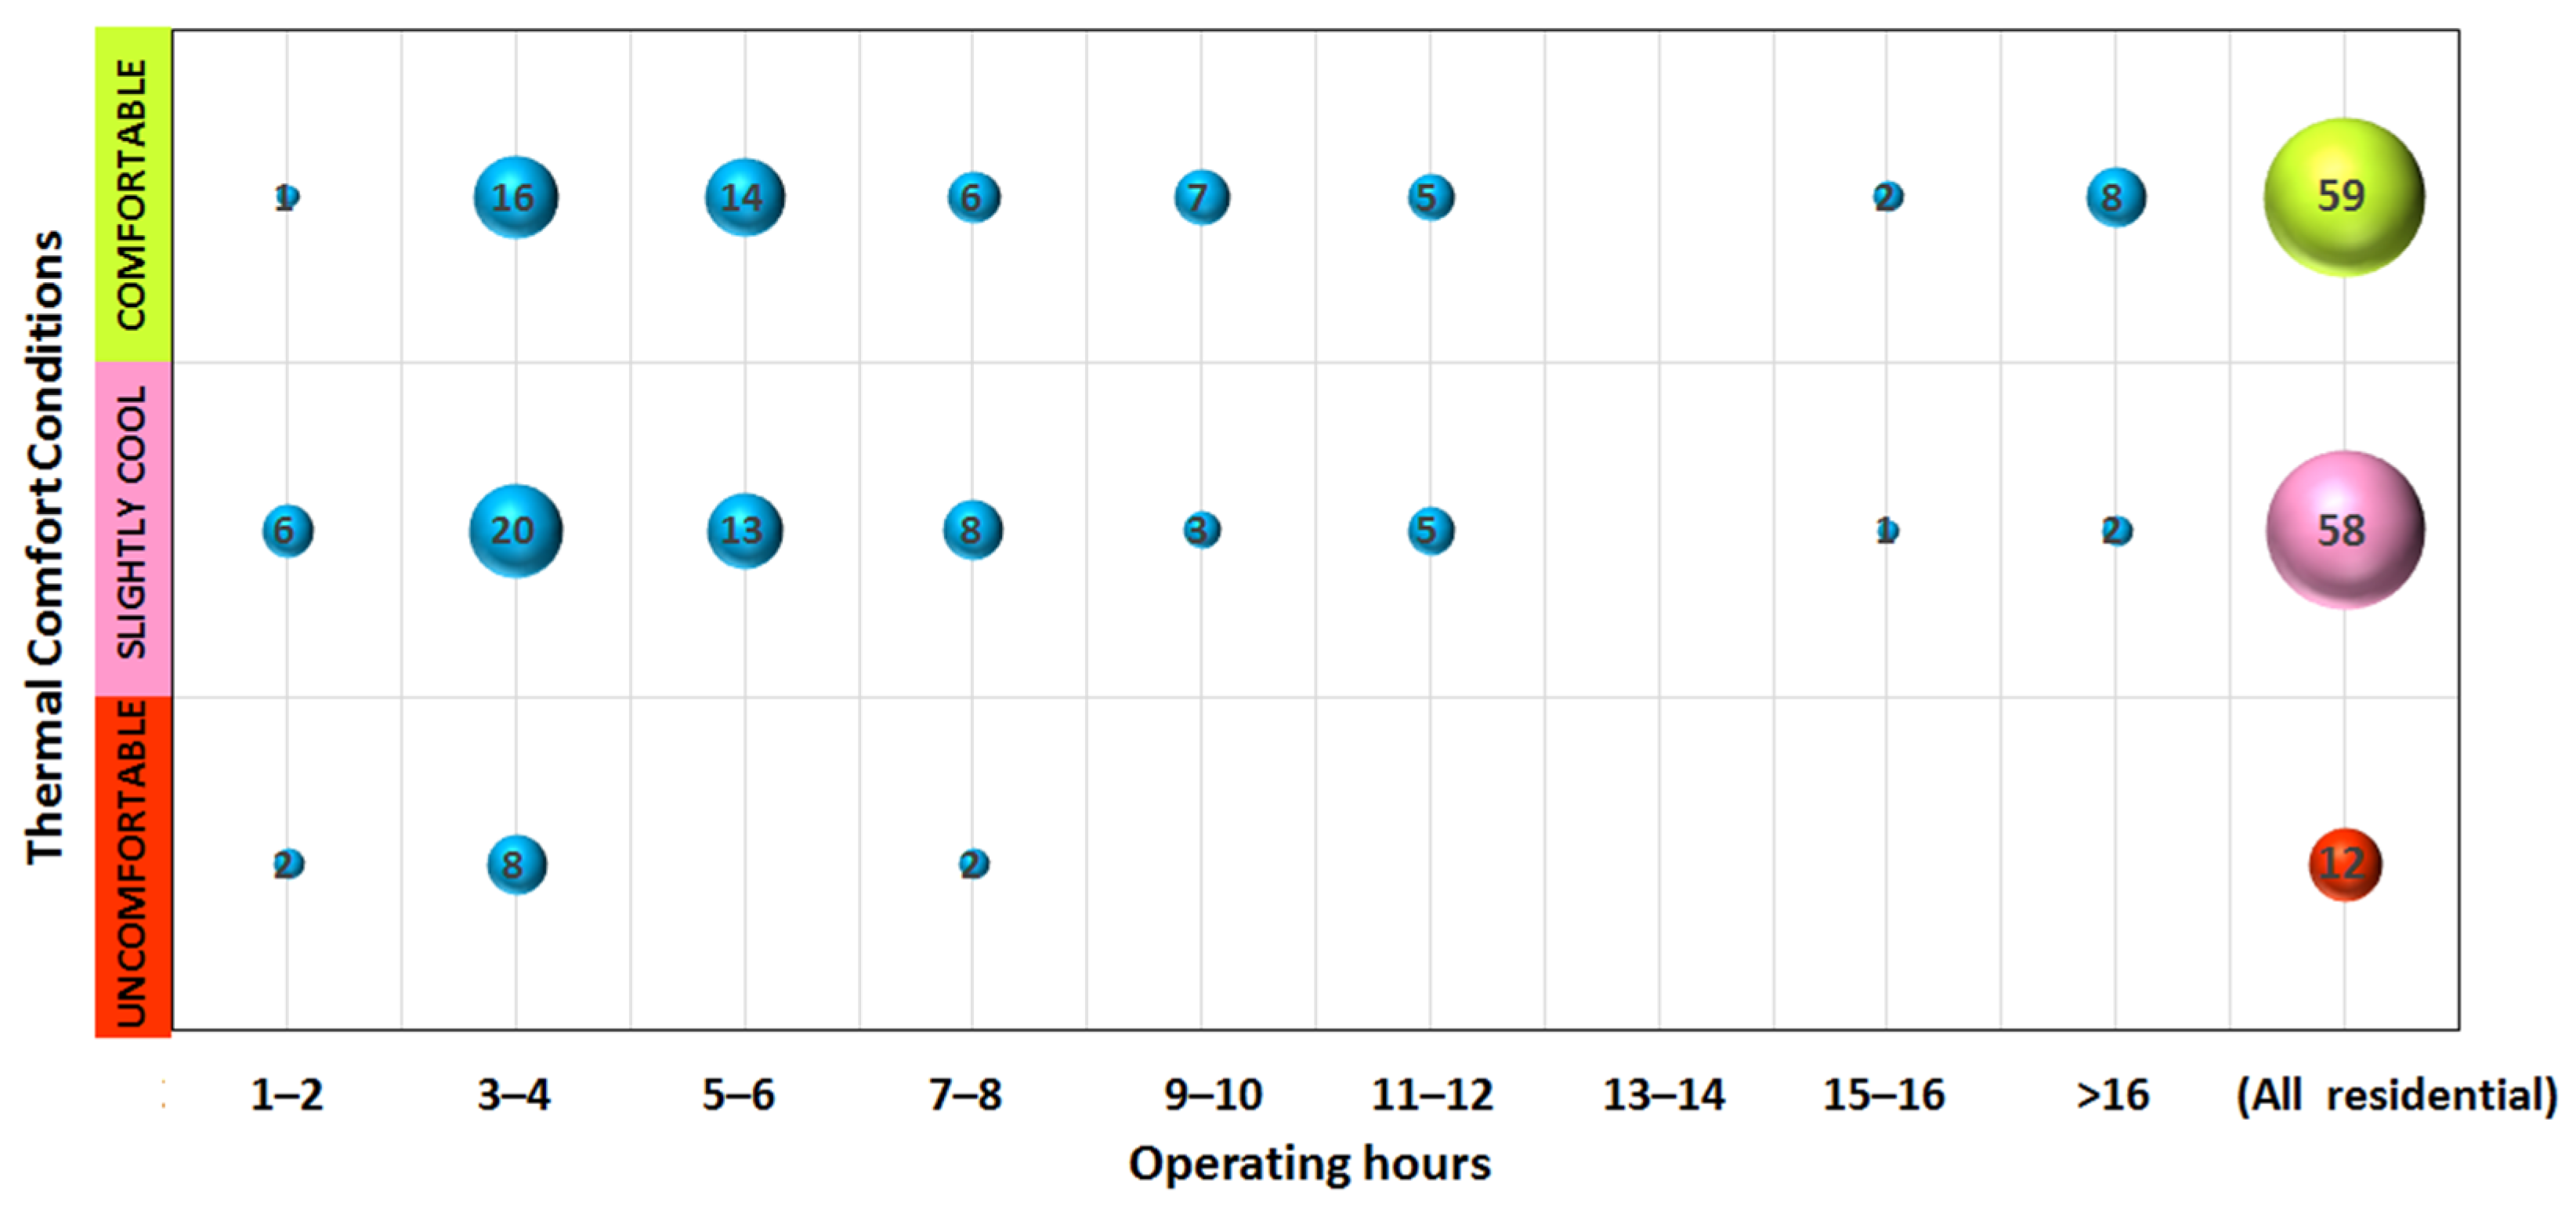
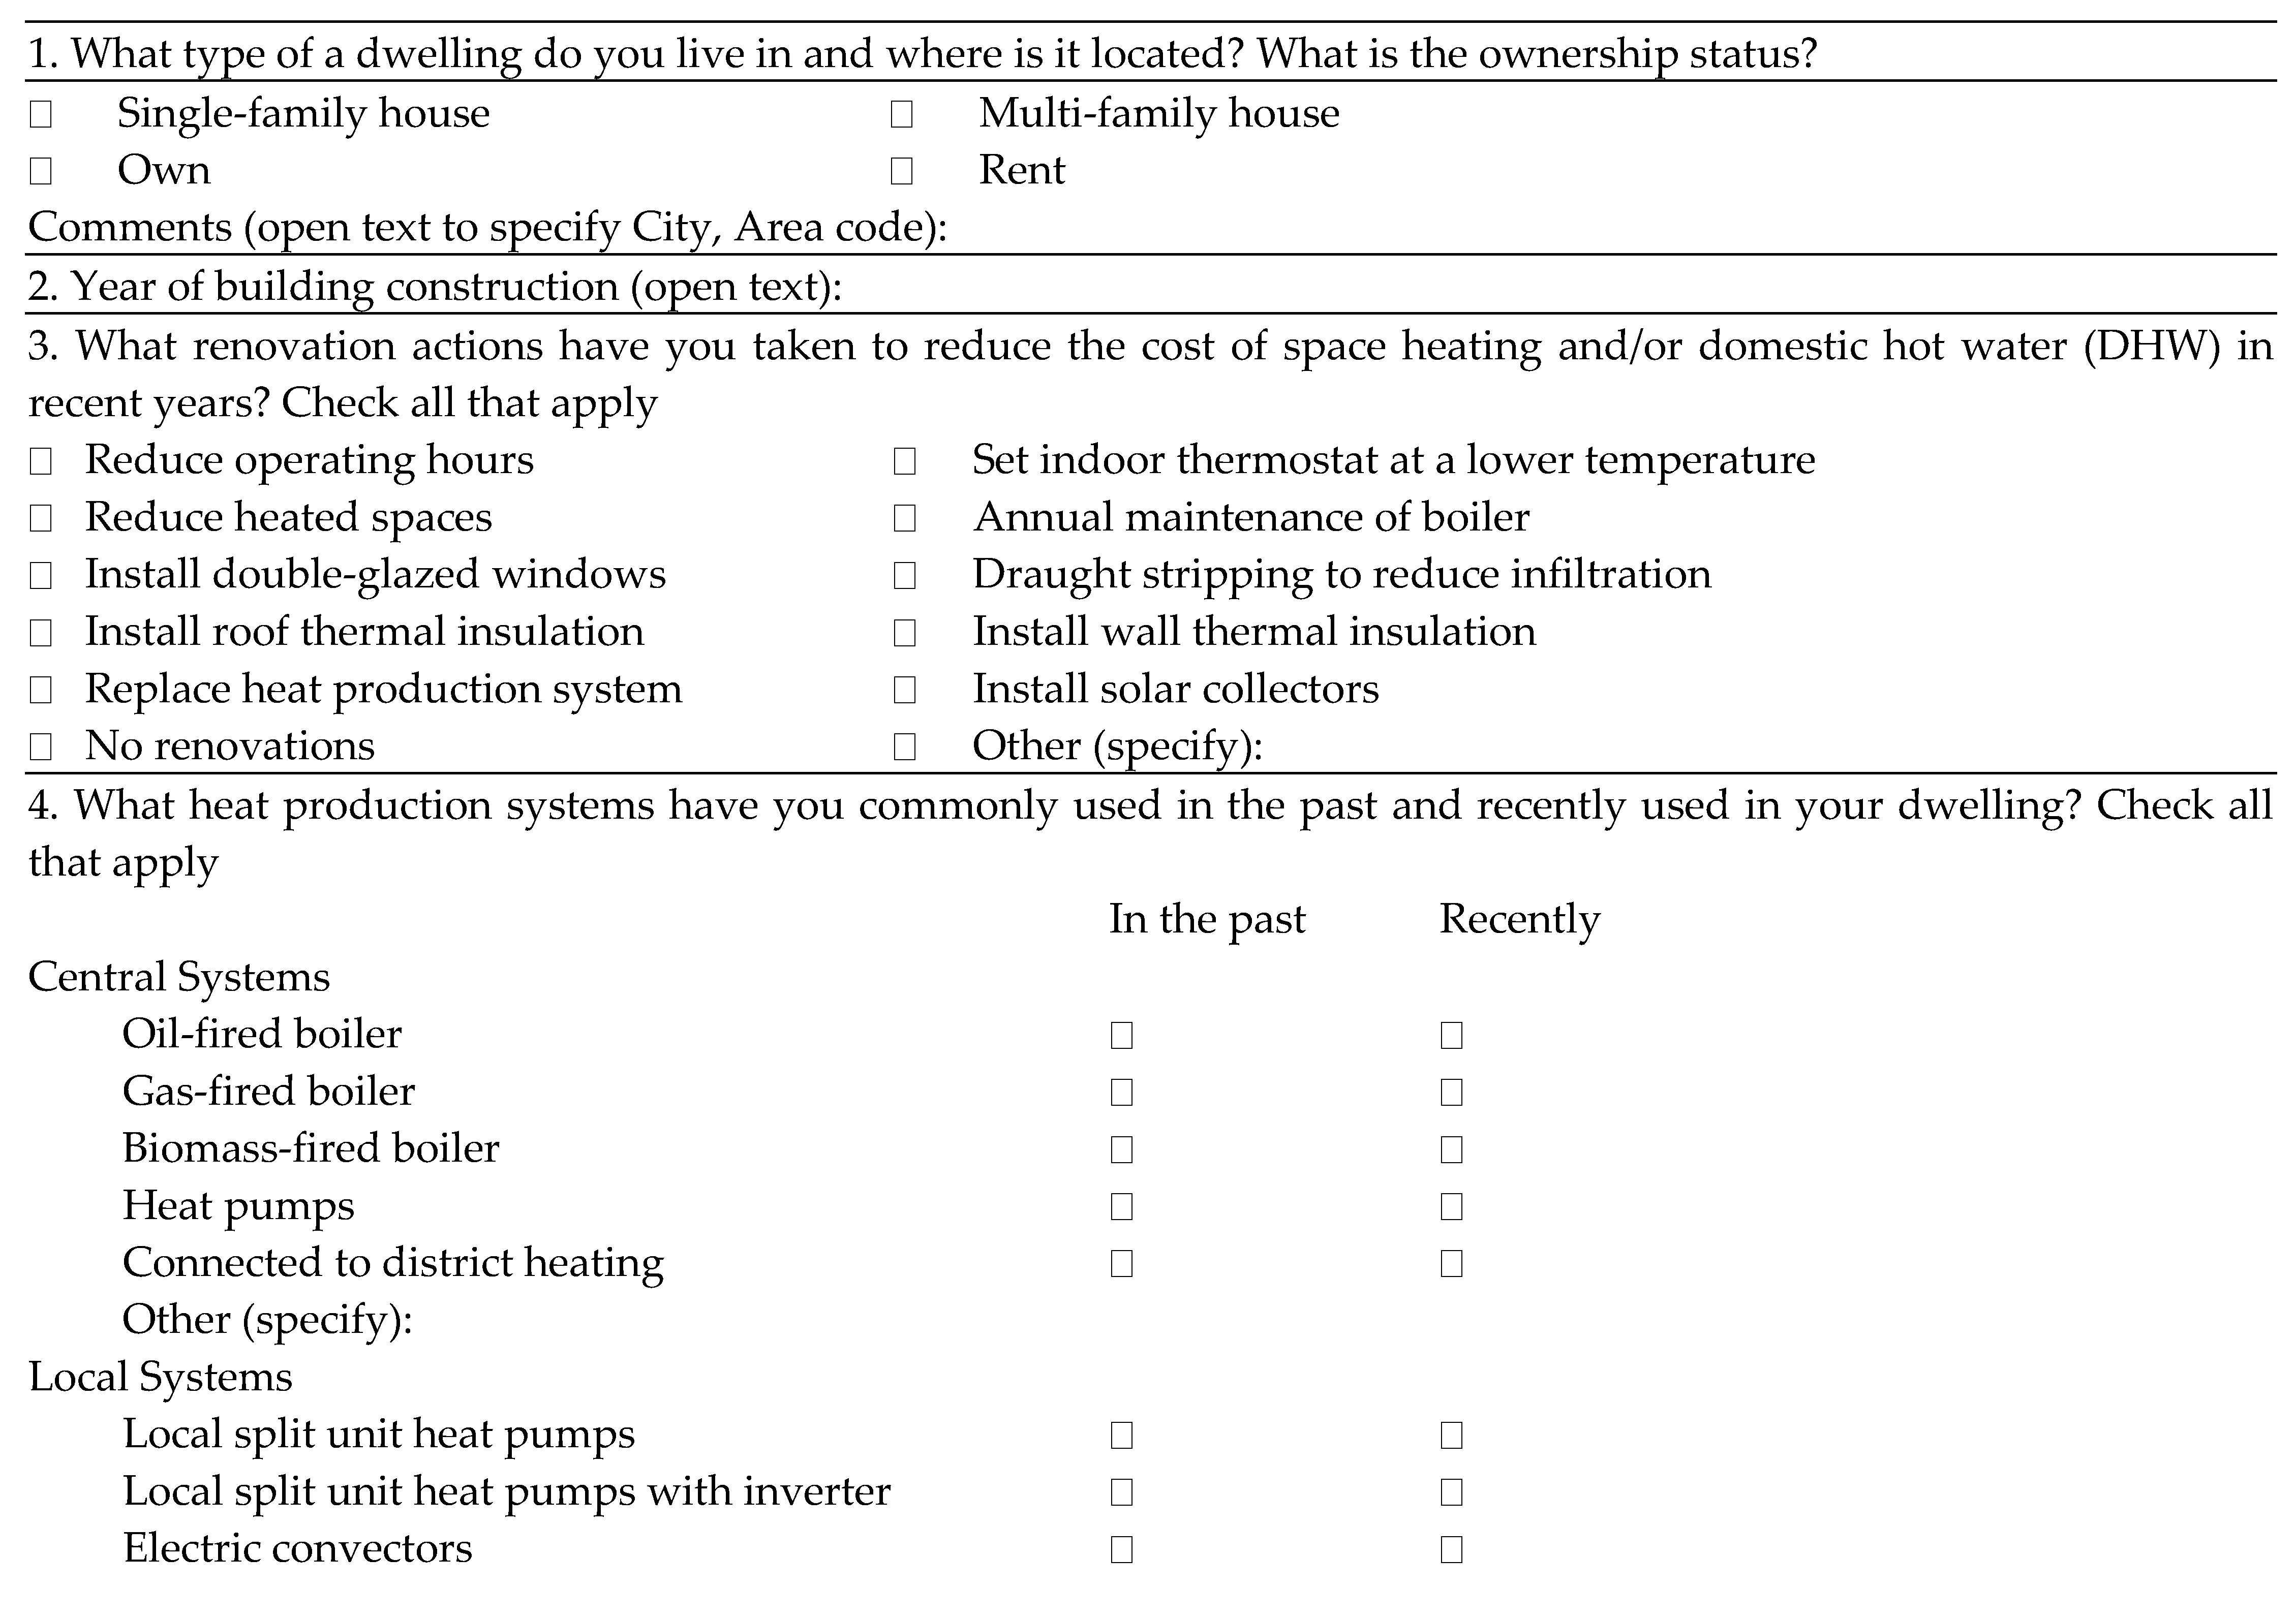
3.2. Occupant Surveys

The actual operating conditions in residential buildings are usually not consistent with the prescribed calculations in compliance with the regulations. For example, in Greece, the calculations according to the national EPBD regulations are performed for almost continuous occupancy and use of space heating (i.e., 18 h per day), with an indoor setpoint temperature at 20 °C for the whole floor area of the dwelling. On the other hand, a national survey [6] documented that the majority of the dwellings used heating for less than 8 h per day (i.e., 71% of SFHs and 82% of MFHs), while only 11% of SFHs and 8% of MFHs operated heating continuously. A staggering 31% of the dwellings were forced to switch off their central heating. Furthermore, only a very small percentage heated their entire dwelling (7% of SFHs and 17% of MFHs).
The results from the survey managed to capture similar information. Over time, the campaign [13] managed to collect responses from several hundred participants, providing results that, overall, were in general agreement with the corresponding information from the national survey. This gives some confidence that the collected data from the questionnaire provided representative results.
The data presented in this work refers to 129 dwellings (of which 39.5% were SFHs and 60.5% were MFHs) that were also audited. The representative results are summarized in Figure 7. The adaptation factors were calculated as weighted averages of f(Actual/Calculated), and they are summarized in Table 2 for the different building typologies (i.e., single- and multi-family houses) and for both SFHs and MFHs that were recognized as “all residential” buildings. Depending on the parameter, the actual operating conditions were compared with the assumed values of the normative calculations. Specific examples are provided in the following discussion.
Operating Hours. Most of the dwellings used their space heating systems for only 3–4 h (Figure 7a). The main reason driving this usage was the need to reduce the operational costs. Continuous heating was used in less than 14% of the SFHs and 4% of the MFHs, while those that used the systems for more than 16 h resembled the assumed period for the normative calculations. The vast majority (i.e., 65% of SFHs and 81% of MFHs) used their space heating systems for less than 8 h per day. About 31% of the SFHs and 40% of the MFHs were forced to switch off their central heating and use local heating systems. The weighted average for the operating hours was 7.6 h in SFHs, only 3.1 h in MFHs and 7.1 h when considering all residential buildings. The corresponding adaptation factors in Table 2 were then calculated as the ratio of the actual values for each building type to the assumed one for the normative calculations (i.e., 18 h in this case).
Isolated Areas. Heating the entire dwelling was practiced in less than half of the houses (i.e., 47% of SFHs and 45% of MFHs (Figure 7b)). Isolating some rooms (e.g., about 10–20% of the floor areas) or turning off the heat emission systems (e.g., radiators) in spaces when they were not used was a popular and practical (re)action of occupants for reducing the energy demand and operational cost. The weighted averages for the isolated areas were very similar for all building types, resulting in similar values for the adaptation factors in Table 2, which were calculated as the ratio of the actual to the assumed values for the normative calculations (i.e., heating the entire house’s floor area).
Indoor Setpoint. Setting the average daytime indoor temperature for thermal comfort conditions at the commonly assumed value of 20 °C was limited to 25% in SFHs and 18% in MFHs (Figure 7c). Lowering the indoor temperature in dwellings equipped with an indoor thermostat for central heating or a local heating system is usually a compromise of thermal (dis)comfort for lowering the operational heating costs. The weighted average temperature was 18.0 °C during the daytime and 17.3 °C during the nighttime in SFHs, and it was 17.1 °C and 16.2 °C in MFHs. Considering all residential buildings, the corresponding values were 17.5 °C during the daytime and 16.6 °C during the nighttime. The corresponding adaptation factors in Table 2 were then calculated as the ratio of the actual values for each building type to the assumed value for the normative calculations (i.e., 20 °C in this case).
Thermal Comfort. The implications of the previous actions were reflected in the perceived indoor thermal comfort conditions reported by the occupants. Although the occupant survey was most likely completed by a single individual, the responses may reflect the opinions of more than one household member. This may be of relevance for the assessment of the indoor thermal comfort conditions, since this is a subjective sensation. Thermal comfort depends on several parameters (e.g., gender and age). However, this information, along with other socioeconomic data for the occupants, were not recorded during this campaign. According to the collected responses, only about half of the occupants felt comfortable in their dwellings (55% in SFHs and 40% in MFHs). For all residential buildings, 45.7% of the occupants reported comfortable conditions in their dwellings (Figure 8). The most uncomfortable conditions were reported for the lower bins of the operating hours, averaging up to only 4 h per day. The continuous operation of the heating system resulted in mostly comfortable indoor thermal conditions. However, the variations of the perceived conditions at lower operating hour bins indicated that there were other influencing factors that affected thermal comfort. For example, operation of the heating system for a few hours per day may be sufficient in a well-insulated building with low heat loss, but it may not be satisfactory in an older building with high thermal loads.

4. Discussion

The available information could be used to calculate the correction factors that reflected the deviations from the assumed normative conditions, which were related to three key parameters: space heating, namely during the operating hours, the floor heated areas and the indoor setpoint temperature. The adaptation factors should be used for the different building typologies. The values presented in Table 2 reflect current trends that are coupled with the reduced energy use for space heating. They constitute a conservative result since they capture recent occupant efforts to reduce the heating operating costs of their dwellings. Accordingly, to account for the occupant interactions, the theoretical EUI, estimated following the normative calculation procedures [14], should be multiplied with an adaptation factor of 0.329 for SFHs and 0.127 for MFHs.
To illustrate this, consider that the theoretical final EUI for space heating and DHW averaged 318.9 kWh/m2 in SFHs and 196.2 kWh/m2 in MFHs, according to the national normative calculations for issuing EPCs [46]. A combined deep renovation scenario could help reach the highest energy savings of 87.2% for SFHs and 91.6% for MFHs [47], which resembles nZEB performance. Accordingly, the anticipated theoretical space heating savings will be 278.1 kWh/m2 and 179.7 kWh/m2, respectively. Considering that the average size of Hellenic dwellings is 88.6 m2 [48], the resulting savings would be 24,640 kWh (2.12 toe) per dwelling in SFHs and 15,921 kWh (1.37 toe) per dwelling in MFHs. This translates to average energy savings of 1.75 toe per dwelling.
According to the national energy efficiency action plan, the final energy use allocated to space heating and DHW in the residential sector was set to 3.25 Mtoe for 2020, and the target for 2030 was set to 1.49 Mtoe [49]. This implies that during this decade, the total energy savings should reach 1.76 Mtoe. On this basis, the cumulative potential savings could result from the deep renovations of ~1 million dwellings or ~100,000 dwellings per year (Figure 9). Considering that the ongoing national financing program on energy savings and autonomy in the residential sector is targeting up to 80,000 dwellings this year, one may claim that it is manageable to hit this target, provided that the eligible dwellings decide to implement deep renovations.
However, taking into account the occupant interaction and the more conservative energy use may reveal a different reality that would be more challenging to handle and eventually lead to a trajectory that will miss the national target. Using the adaptation factors of 0.329 for SFHs and 0.127 for MFHs, the theoretical savings become 91.5 kWh/m2 and 22.8 kWh/m2, respectively. This limits the anticipated energy savings to 8107 kWh (0.70 toe) per dwelling in SFHs and 2020 kWh (0.17 toe) per dwelling in MFHs, or with average energy savings of 0.44 toe per dwelling. In order to meet the same total energy savings of 1.76 Mtoe by 2030, this would translate to the need for deep renovations of ~4 million dwellings or ~400,000 dwellings per year (Figure 9). Sustaining this annual renovation campaign that corresponds to ~6% of Hellenic dwellings is an even greater challenge. On the other hand, by continuing with the current trends and a constant number of 80,000 deep renovations of dwellings on an annual basis, the adapted cumulative energy savings would only reach 0.35 Mtoe. This would practically miss the 2030 target altogether, as is illustrated in Figure 9. This example highlights the implications and difficulties that can be encountered if planning and decision-making are solely based on theoretical calculations.
Future and ongoing work will enhance the field data and knowledge base with more refined analysis. Like similar campaigns, the challenge is to enhance participation and increase the number of diverse responses. Provided there is sufficient data, it would be better to analyze the data and derive similar empirical adaptation factors for different age bands of buildings that relate to different typical constructions (e.g., use of thermal envelope insulation and glazing) and locations that relate to the outdoor climate conditions (i.e., the climate zones).
Periodically recurring similar short campaigns can facilitate capturing recent trends that relate to the use of space heating, which continues to represent the most significant energy end use in Hellenic residential buildings. A similar approach can also be extended and applied to other end uses such as addressing the impact of actual occupant behavior on the normative assumptions for space cooling, DHW, artificial lighting and appliances.
The updated and other similarly derived factors could then be used to adapt the normative calculations and update building stock model predictions [49]. Furthermore, there is interest in making a more prudent assessment of the effectiveness of ECMs and realistically quantifying the anticipated energy savings. This is a necessary step of strategic importance for all European members states to make more pragmatic assessments and plans in their NECPs in order to reach the medium- and long-term targets according to EU policies. Assessing progress and setting European and national targets should not be based on theoretical information resulting from normative calculations of the building stock, but rather on more realistic estimates.

5. Conclusions

Energy consumption for heating represents the main energy use in Hellenic households. For this reason, national energy conservation efforts and general policies have been focusing on building renovation campaigns to first improve living conditions and then help meet the national energy efficiency targets. However, it has been well documented that there are deviations between the calculated and actual energy use in buildings. Among various factors, occupant behavior explains part of these differences and can influence a building’s energy performance. In an effort to bridge this gap, ongoing field work has been collecting data in order to capture recent trends about occupant behaviors in relation to the use of heating installations and provide some insight about energy saving.
This paper summarized the results from over 100 walk-through energy audits and occupant surveys in single- and multi-family houses. The findings confirmed that Hellenic households struggled to maintain comfortable indoor thermal comfort conditions, which is an issue given the low resiliency to low temperatures. The available data also revealed significant differences from the assumptions and typical values used in the calculations according to the national regulation for the energy performance of buildings. The vision is to continue these efforts and populate a database that will reflect the Hellenic residential building typologies for deriving similar empirical adaptation factors, adjusting the calculated heating EUIs for different archetypes in order to make more realistic estimates of actual energy use and renovations in building stock modeling.
This method can be easily implemented and adapted to other countries in order to periodically collect relevant data that documents occupant behaviors and trends of using heating—and possibly other systems—for adapting their national calculation methodologies. Coupling this information with building stock modeling can provide more realistic estimates of actual energy use and savings from ECMs that are necessary for planning and assessing European and national energy efficiency policies.

Author Contributions

Conceptualization, C.A.B. and E.G.D.; methodology, E.G.D. and C.A.B.; formal analysis, E.G.D. and C.A.B.; investigation, C.A.B. and E.G.D.; writing—original draft, E.G.D.; writing—review and editing, C.A.B.; visualization, E.G.D. All authors have read and agreed to the published version of the manuscript.

Funding

This research received no external funding.

Institutional Review Board Statement

Ethical review and approval were waived for this study because no personal, confidential or other sensitive information was requested for publication, related to an identified or identifiable natural person.

Informed Consent Statement

The respondents have consented to participate in the survey by completing the questionnaire.

Data Availability Statement

The data presented in this paper are available on request from the corresponding author.

Acknowledgments

The authors thank all the participants in the walk-through energy surveys and questionnaires for their collaboration in the collection of valuable information during this ongoing research. The authors are also thankful for the reviewers’ constructive comments to improve the quality of the manuscript.

Conflicts of Interest

The authors declare no conflict of interest.

Appendix A

Figure A1. The occupant electronic survey translated from Greek in the original eSurvey questionnaire used in this work.
Applsci 11 06254 g0a1aApplsci 11 06254 g0a1bApplsci 11 06254 g0a1c

References

  1. Energy Datasheets: EU Countries, Energy Statistics, European Commission, DG Energy, Unit A4. Available online: https://ec.europa.eu/eurostat/web/energy/data/energy-balances (accessed on 17 May 2021).
  2. Directive (EU) 2018/844 of the European Parliament and of the Council of 30 May 2018 amending Directive 2010/31/EU on the energy performance of buildings and Directive 2012/27/EU on energy efficiency. Off. J. Eur. Union 2018, 156, 75–91.
  3. Directive (EU) 2018/2002 of the European Parliament and of the Council of 11 December 2018 amending Directive 2012/27/EU on energy efficiency. Off. J. Eur. Union 2018, 328, 210–230.
  4. Energy Efficiency in Buildings, European Commission—Department: Energy. 2020. Available online: https://ec.europa.eu/info/news/focus-energy-efficiency-buildings-2020-feb-17_en (accessed on 17 May 2021).
  5. ODYSEE-MURE Data Tools, Enerdata Intelligence & Consulting. Available online: http://www.odyssee-mure.eu/data-tools (accessed on 17 May 2021).
  6. ELSTAT, Survey on Energy Consumption in Households 2011–2012; Hellenic Statistical Authority: Athens, Greece, 2013.
  7. ODYSEE-MURE Key Indicators, Enerdata Intelligence & Consulting. Available online: https://www.indicators.odyssee-mure.eu/online-indicators.html (accessed on 15 June 2021).
  8. ODYSSEE-MURE, Definition of Data and Energy Efficiency Indicators in ODYSSEE Data Base, Enerdata Intelligence & Consulting. Available online: https://www.odyssee-mure.eu/private/definition-indicators.pdf (accessed on 15 June 2021).
  9. ODYSSEE-MURE, Energy Efficiency Trends and Policies, Enerdata Intelligence & Consulting. Available online: https://www.odyssee-mure.eu/publications/efficiency-trends-policies-profiles/ (accessed on 15 June 2021).
  10. EU Buildings Database, European Commission. Available online: https://ec.europa.eu/energy/eu-buildings-database_en (accessed on 12 April 2021).
  11. Las-Heras-Casas, J.; López-Ochoa, L.M.; López-González, L.M.; Olasolo-Alonso, P. Energy Renovation of Residential Buildings in Hot and Temperate Mediterranean Zones Using Optimized Thermal Envelope Insulation Thicknesses: The Case of Spain. Appl. Sci. 2021, 11, 370. [Google Scholar] [CrossRef]
  12. Laurent, M.-H.; Allibe, B.; Galvin, R.; Oreszczyn, T.; Tigchelaar, C.; Allibe, B. Back to reality: How domestic energy efficiency policies in four European countries can be improved by using empirical data instead of normative calculation. In ECEEE 2013 Summer Study Proceedings, Summer Study on Energy Efficiency: Rethink, Renew, Restart; European Council for an Energy Efficient Economy: Hyères, France, 2013. [Google Scholar]
  13. Balaras, C.A.; Dascalaki, E.G.; Droutsa, K.G.; Kontoyiannidis, S. Empirical Assessment of Calculated and Actual Heating Energy Use in Hellenic Residential Buildings. Appl. Energy 2016, 164, 115–132. [Google Scholar] [CrossRef]
  14. Dascalaki, E.G.; Balaras, C.A.; Gaglia, A.G.; Droutsa, K.G.; Kontoyiannidis, S. Energy Performance of Buildings—EPBD in Greece. Energy Policy 2012, 45, 469–477. [Google Scholar] [CrossRef]
  15. Harputlugil, T.; de Wilde, P. The interaction between humans and buildings for energy efficiency: A critical review. Energy Res. Soc. Sci. 2021, 71, 101828. [Google Scholar] [CrossRef]
  16. Jradi, M. Dynamic Energy Modelling as an Alternative Approach for Reducing Performance Gaps in Retrofitted Schools in Denmark. Appl. Sci. 2020, 10, 7862. [Google Scholar] [CrossRef]
  17. Yan, D.; O’Brien, W.; Hong, T.; Feng, X.; Gunay, H.B.; Tahmasebi, F.; Mahdavi, A. Occupant behavior modeling for building performance simulation: Current state and future challenges. Energy Build. 2015, 107, 264–278. [Google Scholar] [CrossRef] [Green Version]
  18. Broin, E.Ó.; Nässén, J.; Johnsson, F. The influence of price and non-price effects on demand for heating in the EU residential sector. Energy 2015, 81, 146–158. [Google Scholar] [CrossRef] [Green Version]
  19. SWD (2020) 907 Final, Assessment of the Final National Energy and Climate Plan of Greece, Commission Staff Working Document; European Commission: Brussels, Belgium, 2020.
  20. ELSTAT, Buildings Census 2011; Hellenic Statistical Authority: Athens, Greece, 2015.
  21. Ortiz, M.A.; Bluyssen, P.M. Proof-of-concept of a questionnaire to understand occupants’ comfort and energy behaviours: First results on home occupant archetypes. Build. Environ. 2018, 134, 47–58. [Google Scholar] [CrossRef]
  22. Hu, S.; Yan, D.; Azar, E.; Guo, F. A systematic review of occupant behavior in building energy policy. Build Environ. 2020, 175, 106807. [Google Scholar] [CrossRef]
  23. Zhao, T.; Zhang, C.; Ujeed, T.; Ma, L. Online Methodology for Separating the Power Consumption of Lighting Sockets and Air-Conditioning in Public Buildings Based on an Outdoor Temperature Partition Model and Historical Energy Consumption Data. Appl. Sci. 2021, 11, 1031. [Google Scholar] [CrossRef]
  24. Verichev, K.; Zamorano, M.; Salazar-Concha, C.; Carpio, M. Analysis of Climate-Oriented Researches in Building. Appl. Sci. 2021, 11, 3251. [Google Scholar] [CrossRef]
  25. Zhang, Y.; Bai, X.; Mills, F.P.; Pezzey, J.C.V. Rethinking the role of occupant behavior in building energy performance: A review. Energy Build. 2018, 172, 279–294. [Google Scholar] [CrossRef]
  26. Mahdavi, A.; Berger, C.; Amin, H.; Ampatzi, E.; Andersen, R.K.; Azar, E.; Barthelmes, V.M.; Favero, M.; Hahn, J.; Khovalyg, D.; et al. The Role of Occupants in Buildings’ Energy Performance Gap: Myth or Reality? Sustainability 2021, 13, 3146. [Google Scholar] [CrossRef]
  27. Gonzalez, V.G.; Ruiz, G.R.; Bandera, C.F. Empirical and Comparative Validation for a Building Energy Model Calibration Methodology. Sensors 2020, 20, 5003. [Google Scholar] [CrossRef]
  28. Fabrizio, E.; Monetti, V. Methodologies and Advancements in the Calibration of Building Energy Models. Energies 2015, 8, 2548–2574. [Google Scholar] [CrossRef] [Green Version]
  29. Pasichnyi, O.; Wallin, J.; Levihn, F.; Shahrokni, H.; Kordas, O. Energy performance certificates—New opportunities for data-enabled urban energy policy instruments? Energy Policy 2019, 127, 486–499. [Google Scholar] [CrossRef]
  30. von Platten, J.; Holmberg, C.; Mangold, M.; Johansson, T.; Mjörnell, K. The renewing of energy performance certificates—reaching comparability between decade-apart energy records. Appl. Energy 2019, 255, 113902. [Google Scholar] [CrossRef]
  31. Cozza, S.; Chambers, J.; Patel, M.K. Measuring the thermal energy performance gap of labelled residential buildings in Switzerland. Energy Policy 2020, 137, 111085. [Google Scholar] [CrossRef]
  32. Galvin, R.; Sunikka-Blank, M. Quantification of (p)rebound effects in retrofit policies—Why does it matter? Energy 2016, 95, 415–424. [Google Scholar] [CrossRef] [Green Version]
  33. COM(2020) 662 Final—A Renovation Wave for Europe—Greening Our Buildings, Creating Jobs, Improving Lives, Communication from the Commission to the European Parliament, the Council, the European Economic and Social Committee and the Committee of the Regions; European Commission: Brussels, Belgium, 2020.
  34. Ahern, C.; Norton, B. Energy Performance Certification: Misassessment due to assuming default heat losses. Energy Build. 2020, 224, 110229. [Google Scholar] [CrossRef]
  35. Majcen, D.; Itard, L.C.M.; Visscher, H. Energy labels in Dutch Dwellings—Their Actual Energy Consumption and Implications for Reduction Targets. In ECEEE 2013 Summer Study Proceedings, Summer Study on Energy Efficiency: Rethink, Renew, Restart; European Council for an Energy Efficient Economy: Hyères, France, 2013. [Google Scholar]
  36. van den Brom, P.; Meijer, A.; Visscher, H. Actual energy saving effects of thermal renovations in dwellings—Longitudinal data analysis including building and occupant characteristics. Energy Build. 2019, 182, 251–263. [Google Scholar] [CrossRef]
  37. Chen, S.; Zhang, G.; Xia, X.; Chen, Y.; Setunge, S.; Shi, L. The impacts of occupant behavior on building energy consumption: A review. Sustain. Energy Technol. Assess. 2021, 45, 101212. [Google Scholar]
  38. Laaroussi, Y.; Bahrar, M.; El Mankibi, M.; Draoui, A.; Si-Larbi, A. Occupant presence and behavior: A major issue for building energy performance simulation and assessment. Sustain. Cities Soc. 2020, 63, 102420. [Google Scholar] [CrossRef]
  39. Santin, O.G. Behavioural Patterns and User Profiles related to energy consumption for heating. Energy Build. 2011, 43, 2662–2672. [Google Scholar] [CrossRef]
  40. Hansen, A.R.; Gram-Hanssen, K.; Knudsen, H.N. How building design and technologies influence heat-related habits. Build. Res. Inf. 2018, 46, 83–98. [Google Scholar] [CrossRef]
  41. Attia, S. Spatial and Behavioral Thermal Adaptation in Net Zero Energy Buildings: An Exploratory Investigation. Sustainability 2020, 12, 7961. [Google Scholar] [CrossRef]
  42. EIA, Price Elasticity for Energy Use in Buildings in the United States; U.S. Energy Information Administration: U.S. Department of Energy: Washington, DC, USA, 2021.
  43. Visscher, H.; Dascalaki, E.; Sartori, I. Towards an energy efficient European housing stock: Monitoring, mapping and modelling retrofitting processes. Energy Build. 2016, 132, 1–3. [Google Scholar] [CrossRef]
  44. ASHRAE Standard 211—Standard for Commercial Building Energy Audits; ASHRAE: Atlanta, GA, USA, 2018.
  45. Balaras, C.A. Tax Adds Fuel to Fire. ASHRAE J. 2013, 55, 70. [Google Scholar]
  46. Dascalaki, E.G.; Balaras, C.A.; Droutsa, K.G.; Kontoyiannidis, S.; Livanas, G. Chapter 13—Towards a Sustainable Refurbishment of the Hellenic Residential Building Stock. In Energy Efficient Building Design, 1st ed.; Dabija, A.-M., Ed.; Springer: Cham, Switzerland, 2020; pp. 199–218. [Google Scholar]
  47. Droutsa, K.G.; Kontoyiannidis, S.; Dascalaki, E.G.; Balaras, C.A. Mapping the Energy Performance of Hellenic Residential Buildings from EPC (energy performance certificate) Data. Energy 2016, 98, 284–295. [Google Scholar] [CrossRef]
  48. Average size of Dwelling by Household Type and Degree of Urbanization, Data Explorer, Eurostat. Available online: https://ec.europa.eu/eurostat/web/energy/data/energy-balances (accessed on 17 May 2021).
  49. Dascalaki, E.G.; Balaras, C.A.; Kontoyiannidis, S.; Droutsa, K.G. Modeling Energy Refurbishment Scenarios for the Hellenic Residential Building Stock Towards the 2020 & 2030 Targets. Energy Build. 2016, 132, 74–90. [Google Scholar]
Figure 1. Annual energy uses in the European Union (EU-27). Data source: Eurostat [1].
Applsci 11 06254 g001
Figure 2. Breakdown of the final energy consumption in (a) European residential buildings (data source: Odyssee [5]) and (b) Hellenic residential buildings (data source: ELSTAT [6]).
Applsci 11 06254 g002
Figure 3. Annual energy uses in Greece. Data source: Eurostat [1].
Applsci 11 06254 g003
Figure 4. Schematic overview of the work.
Applsci 11 06254 g004
Figure 5. (a) Frequency of use of central heating and local heating systems in homes in the past (pattern fill) and in the present (solid colors). (b) Energy conservation measures and actions for lowering operational energy costs. The data presented are for the different building typologies (i.e., single-family houses (SFHs) and multi-family houses (MFHs)).
Applsci 11 06254 g005
Figure 6. Actual primary energy use intensity for normal climate conditions in the audited residential buildings presented for the different typologies (i.e., single-family houses (SFHs) and multi-family houses (MFHs)) for the different construction periods (before and after 1980).
Applsci 11 06254 g006
Figure 7. Actual operating conditions in single-family houses (SFHs) (upper row) and multi-family houses (MFHs) (lower row), showing the (a) average daily space heating hours, (b) non-heated (isolated) floor areas and (c) indoor temperature setpoints. The gray shaded areas identify the assumed values used in the national EPBD calculations.
Applsci 11 06254 g007
Figure 8. Distribution of average operating hours of the heating system and reported perception of indoor thermal comfort conditions in all dwellings. The bubble size represents the number of occupant responses, identified with the numerical label.
Applsci 11 06254 g008
Figure 9. Final energy use for space heating and DHW in Hellenic residential buildings for 2020 and projection toward the target in 2030 as a result of different renovation scenarios with theoretical and adapted actual estimates.
Applsci 11 06254 g009
Table 1. Key indicators for final energy use and efficiency progress in residential buildings at normal EU and national climate conditions [7].
HouseholdsTotal Energy Use (kWh/m2)Space Heating Energy Use (kWh/m2)ODEX Index
(%)
200020182000201820002018
European (EU average climate)214.1169.5148.4109.010072.5
Hellenic (normal climate)164.8133.3114.887.810071.3
Hellenic (EU average climate)261.0201.0206.9158.3
Table 2. Weighted average adaptation factors (f) for the building types: single-family houses (SFHs), multi-family houses (MFHs) and all residential buildings.
Building TypeOperating HoursIsolated AreasIndoor Setpoint
SFH0.4230.8820.881
MFH0.1710.8810.843
All residential0.3960.8820.853
Publisher’s Note: MDPI stays neutral with regard to jurisdictional claims in published maps and institutional affiliations.

