1. Introduction
Thermal energy storage is important for the development of industrial and domestic applications that optimize energy production and use. Efficiency of thermal energy storage systems depends, among other factors, on the properties of the storage material to accumulate and release energy by either changing its temperature, in sensitive heat storage, or undergoing a phase transition, in latent heat storage (for a review, see Sarbu and Sebarchievici, 2018) [
1]. Storing energy as latent heat may provide a large amount of energy at almost constant temperature, an important feature in some technical applications that require close control over temperature, and may be a robust and inexpensive alternative to temperature control automation by electronic devices.
Selection of a material suitable for latent heat energy storage (see Podara et al., 2021) [
2] considers multiple criteria such as temperature for phase change, latent heat, thermal stability of the material, containment, and cost (Hussam et al., 2020) [
3]. Sodium and potassium nitrate salts as phase change materials (PCM) cover the range of relatively high temperatures of interest (300–400 °C) for concentrated solar plants (CSP). Sodium nitrate undergoes a solid–liquid phase change transition at 307 °C (Xu et al., 2018) [
4], whereas potassium nitrate melts at higher temperature, 336 °C (Mohammad 2017; D’Aguanno et al., 2018) [
5,
6]. The latent heats of solid–liquid transition in sodium and potassium nitrate salts are 5.9 and 11.8 times, respectively, smaller than the latent heat for LiF solidification (1.04 MJ/kg at 849 °C). The tradeoff between energy storage capacity and the melting temperature of the material may consider that (a) higher or lower temperatures may not be technically suited for a specific application, (b) temperature increase is associated with accelerated corrosion of containers and pipes, and (c) the heat loss rate from the storage container depends directly on the temperature gradient across the container shell.
For sodium nitrate PCM, limitations of tank charge–discharge rates are related to the low thermal conductivity of the storage material (Bellan et al., 2015) [
7]. Micro and macroencapsulation may increase the thermal conductivity of the storage material if a highly conductive shell material is used (Huang et al., 2019; Cáceres et al., 2017) [
8,
9]. Similarly, composite materials are explored, where a matrix of chemically stable, thermally conductive material mitigates the problem of a highly corrosive and low conductive inorganic salt (or salt mixture) used to store the thermal energy (Courbon et al., 2020; Podara et al., 2021) [
2,
10].
The thermal properties of the storage material may be combined with appropriate design of the storage tank using in silico experiments of computational fluid dynamics (CFD) (Al-abidi et al., 2013) [
11]. The finite element method (FEM) with common software packages (Comsol Multiphysics) was used to compare various inorganic salt PCMs and different suitable PCM-encapsulation materials to render economically viable solutions that would meet the requirements of thermal energy storage (TES) for CSP (Cáceres et al., 2017) [
9].
Micro and nanoencapsulation has been frequently reported for low temperature regime PCMs, mainly using organic polymers as shell materials. For high temperature applications (e.g., CSP), manufacturing micrometer-scale shells that are stable over many PCM melting–solidification cycles is challenging for at least two reasons: (a) coatings made by the versatile organic polymer technology do not withstand high temperatures; and (b) water-based chemistry to prepare shells may dissolve the PCM core, which is typically an inorganic salt/salt mixture [
12]. SiO
2 coating of micrometer-size alkaline nitrate cores was recently demonstrated by several groups (Zhang et al., 2018; Romero-Sanchez et al., 2018; Lee and Jo, 2020) [
12,
13,
14]. A method for microencapsulation of nitrate salts in zinc oxide shells was developed within a project funded by the National Authority for Scientific Research in Romania (project acronym ENERHIGH), as described in our previous papers (Romero-Sanchez et al., 2019; Tudor et al., 2018) [
15,
16]. Briefly, in that work, KNO
3–ZnO microcapsules were prepared from raw materials (zinc nitrate tetrahydrate and potassium nitrate) by the solvothermal method. Spherical morphology of the ZnO-covered KNO
3 microparticles was observed after spray drying, with particle sizes of only a few microns.
The aim of this work is to evaluate the capacity of NaNO3–ZnO microcapsules to store thermal energy and the possibility to retrieve it at high temperatures. To improve the scalability of microcapsule fabrication, a novel protocol for microencapsulation was elaborated and tested, consisting in direct ZnO coating of NaNO3 particles using commercially available NaNO3 grains (relatively large, up to 0.5 mm size) and ZnO powder (0.1 to 2 μm particles) as raw materials. Up to 22.1 kg of NaNO3–ZnO microcapsules were thus prepared. Results from experiments in a 16.7 L cylinder-shaped prototype tank are presented, which show that microcapsules store significant amounts of thermal energy in solid–liquid NaNO3 transitions. To facilitate further development of novel PCM materials for energy storage, a platform for combined in silico prototype-scale investigation was built. For a simplified tank FEM model, thermal transfer is presented in simulations of tank discharge and compared with real temperature data from prototype tank experiments on microcapsules. The goal is to understand and predict material performance in thermal storage applications, starting from material characterization by laboratory methods.
2. Materials and Methods
Chemicals. Analytical grade reagents were used in all experiments. Sodium nitrate was purchased from Roth, Germany. Zinc oxide was provided by Chimreactiv, Romania.
Microcapsules. NaNO
3 was encapsulated in ZnO shells at 4:1 mass ratio, using a simplified protocol derived from our previous work (Tudor et al., 2018) [
16]. Basically, commercially available NaNO
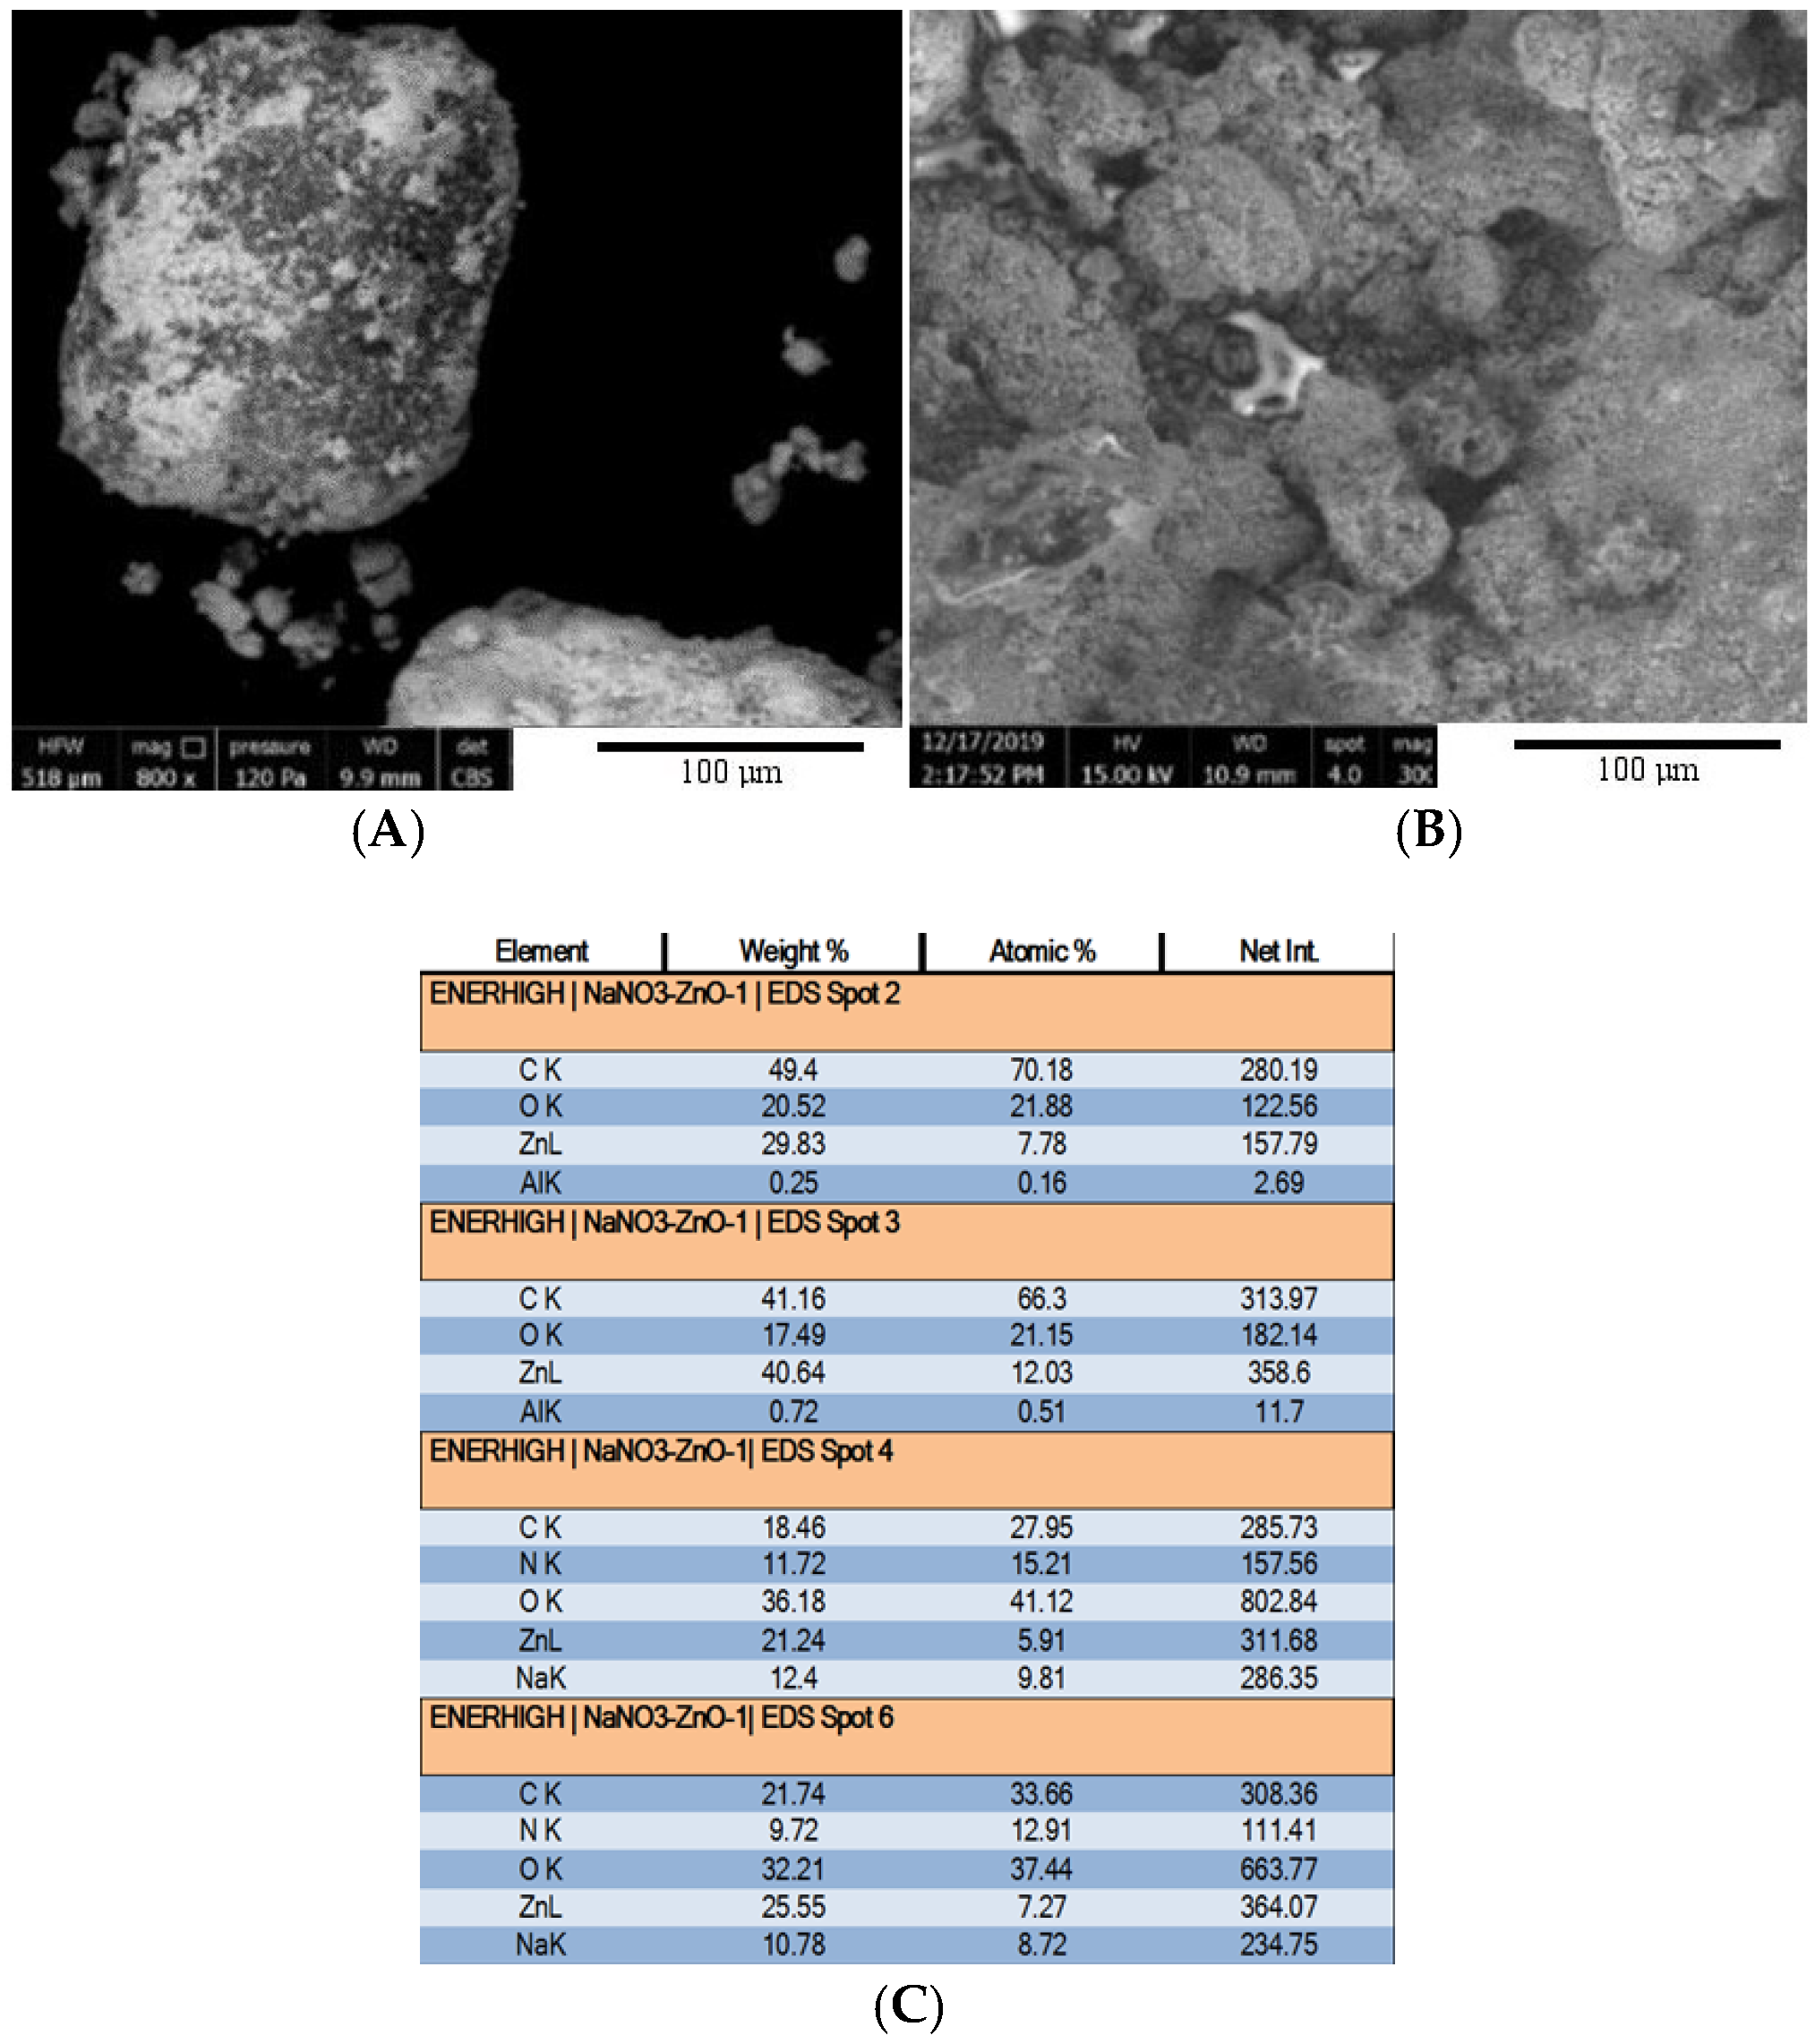
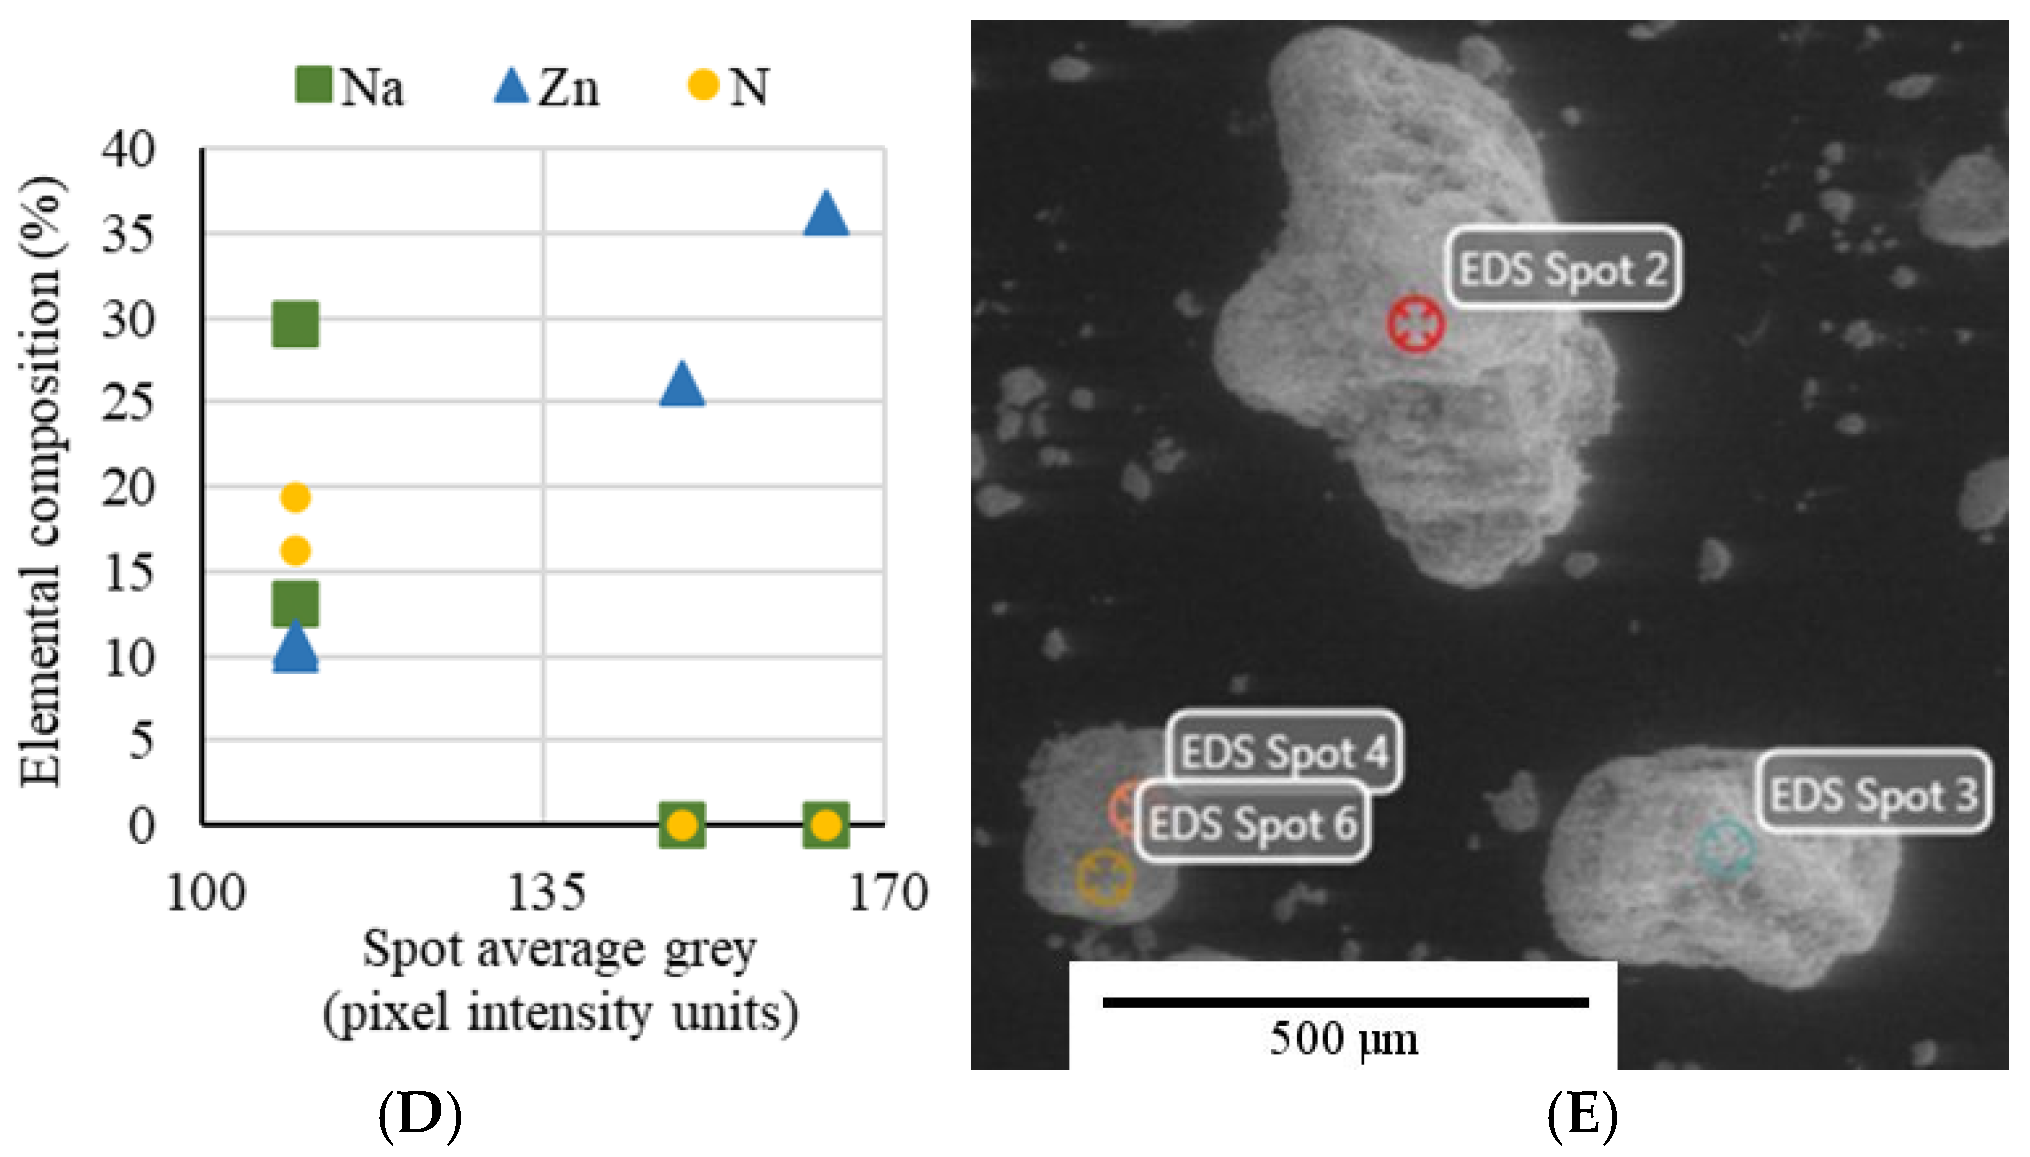
3 powder grains, ZnO, and ethanol were mixed and stirred to achieve homogenous dispersion of components. The mixture was then subjected to a thermal treatment for 1 h at 200 °C in atmospheric air. Microcapsules were characterized by scanning electron microscopy and energy dispersive X-ray spectroscopy to determine their structure and demonstrate encapsulation.
Chemical analysis of the thermal energy storage material was determined by flame atomic absorption spectrometry (ISO 11047:1999) for Na and Zn and wet chemistry (ISO 5664: 2001) for NO3–. Samples were taken from the tank at 14 different positions in the storage material.
Scanning Electron Microscopy (SEM) and Energy Dispersive X-ray Spectroscopy (EDS) were performed on microcapsules using an SEM–EDS Quanta 250 scanning electron microscope (FEI Company, Eindhoven, The Netherlands) equipped with the Element Silicon Drift Detector Fixed and Element EDS Analysis Software Suite APEX™ 1.0, EDAX, Mahwah, NJ, USA. Thus, by EDS, the atomic composition of a selected spot was determined. In the report from the instrument, the abbreviations C K, O K, ZnL, NK, NaK, and AlK are used to indicate that the data are based on detection of energies for specific orbital transitions, corresponding to elements: C, O, Zn, N, Na, and Al, respectively. The elemental composition of each spot is reported as relative weight (%), atom concentration (%), or the net intensity (a.u.) of the respective element-specific peak. For microcapsules, the carbon % reported in analysis is background from the sample immobilization device, and was subtracted from further calculations.
Thermal analysis. Thermal conductivity and thermal diffusivity/specific volumetric heat determinations were made by the transient plane source method (TPS-2200 from Hot Disk, Sweden, model 5082 mica sensor). In laboratory determinations, microcapsule powder was poured to fill a 200 mL stainless steel beaker, the sensor was embedded in the middle, the assembly was placed in the empty (air-filled) storage tank, then exposed to multiple temperature cycles in the 25 to 350 °C temperature interval. The thermal conductivity and specific volumetric heat curves were recorded only after the second cycle of microcapsule melting–solidification, when the microcapsule material was a compact porous material block; thus, the thermal parameters are representative for the material formed after multiple energy storage cycles. Temperature monitoring was achieved by tank thermocouples and corrected to report in-place temperatures using calibrated readings for the sensor resistivity.
Differential Scanning Calorimetry (DSC) was performed using two instruments: SETSYS Evolution from Setaram and DSC F3 Maia from Netzsch, Germany. Microgram amounts of NaNO3 and microcapsules were heated–cooled in cycles to determine melting and crystallization temperatures and enthalpies.
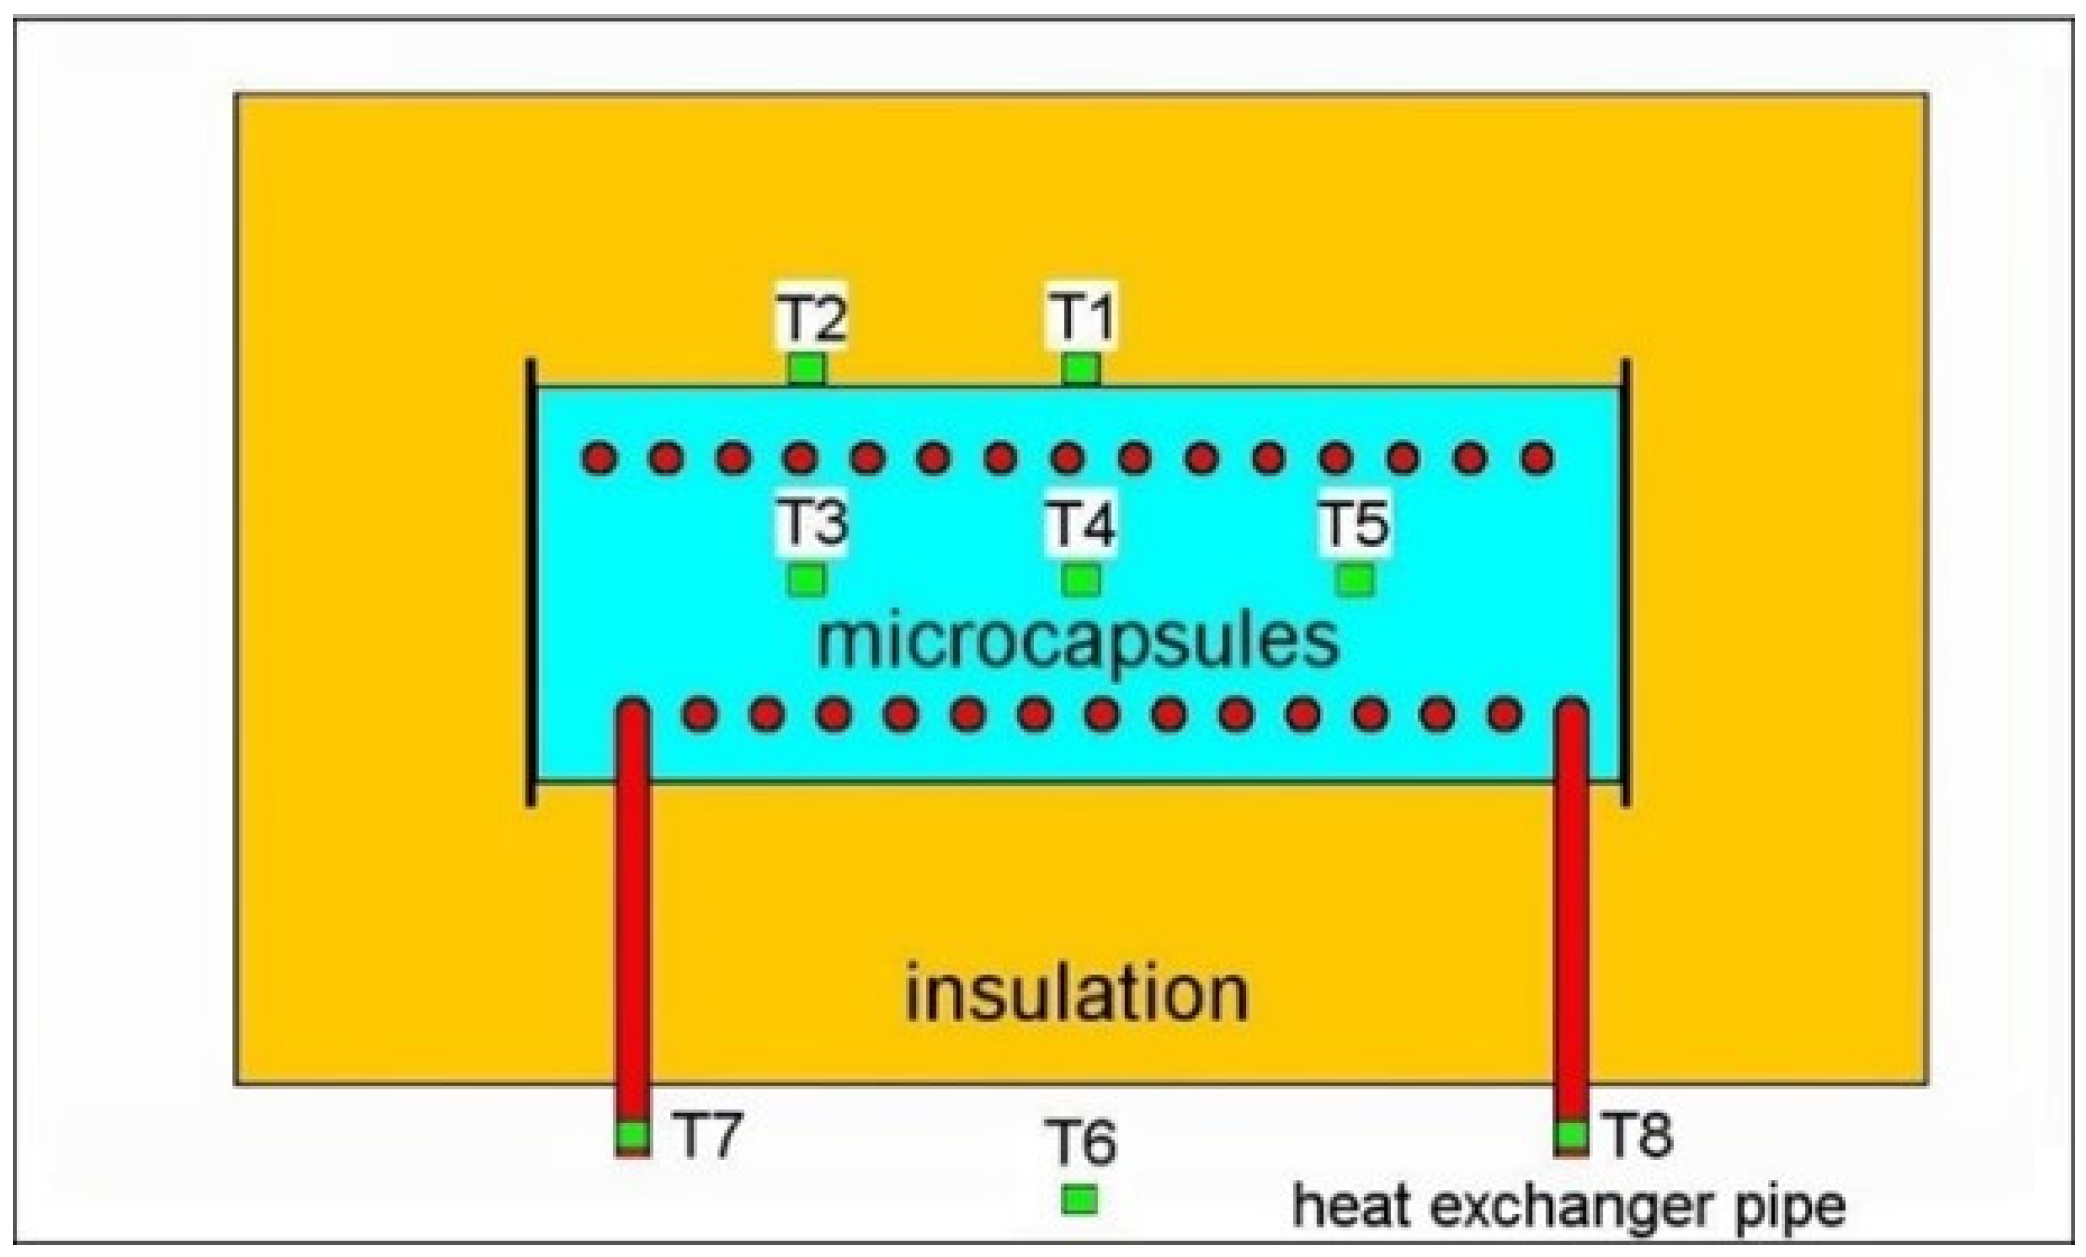
Prototypetank. The thermal storage tank is a right circular cylinder (referred to as the tank cylinder), 0.55 m length, 0.2 m diameter, made of 2 mm-thick stainless steel (SS 316), accommodating temperature sensors in inbuilt sheaths protruding transversally up to the longitudinal axis. A thermal conductivity sensor is located in a holder at the center-bottom of the tank. The cylinder is wrapped in 0.2 m thick Ravaber mineral foam insulation. A stainless-steel envelope covers the insulation to a final cylinder length of 0.95 m and diameter of 0.6 m. Material loading gates (three 20 mm diameter holes) are placed at the top of the storage tank and accessible from outside by cap closed tubes that span the thermal insulation. The heat exchanger is made of a SS 316 tube (12 mm outer diameter, 10 mm inner diameter, 5.04 m length), shaped as a helical-coil wrapped around the longitudinal axis in 15 loops (120 mm diameter). Mineral oil is used as a heat transfer fluid (HTF) at a temperature that is maintained by an external recirculating pump with heating/cooling capability. Temperatures were continuously monitored (digital recording) by eight type J thermocouples (T1–T8) placed as indicated in
Figure 1. For the 50 to 400 °C measurement interval, the thermocouples were linearly calibrated to work within a ±1.5 °C reading error. T3, T4, and T5 measured temperatures inside the tank, at the central longitudinal axis, and they protruded to their measurement spot through tank-fixed one-end-closed tubular sheets (5 mm outer diameter, 3 mm inner diameter, 0.5 m long). The relative positions of the protruding thermocouple sheets and heating coil loops were designed to maximize the separation space and avoid contact. Temperatures were monitored across the energy storage material for two sections that are transversal to the tank cylinder, by placing T1 and T2 directly on the outer surface of the tank cylinder, at the same longitudinal positions as their corresponding T4–T3 (respectively) pair. T7 and T8 were in direct contact with the heating coil at the tank-envelope entry and exit points. The installation is pictured in a previous publication (Tudor et al., 2019) [
17].
Tank heating–cooling cycles. Precise amounts of microcapsules were successively loaded into the storage tank (as powder) to total 15.75, 19.232, and 22.067 kg. After each load, the tank was subjected to several charge–self-discharge cycles. A cycle consists of a heating phase, when HTF (360–375 °C) circulates inside the heat exchanger until T1 to T5 readings are all above the melting temperature of sodium nitrate, then it follows the self-discharging phase when the HTF pump is off and the tank is left to cool by itself downward to room temperature.
Adapted calorimetric method. To assess the amount of thermal energy available as latent heat in the storage tank, a heat flow calorimetry method was developed. It is based on temperature monitoring in key points inside and outside the tank, thus estimating the heat loss through the thermal insulation of the tank.
The method considers a quasi-static approximation to Fourier’s law:
with dt as the time interval for measurements, short enough to approximate a constant ∆T
in-out. The approximation is intended to simplify the calculation, as it was determined that the use of differential form to account for ∆T
in-out changes does not significantly improve the precision for a narrow temperature interval around 300 °C. In the tank setup, at the time-point t, ∆T
in-out = tT1 − tT6, where tT1 and tT6 are the temperatures indicated by T1 and T6, respectively.
For two different material loads of the tank with masses m
1 and m
2, it may be written:
where K is a proportionality coefficient for heat transfer from the storage tank to the environment. A third equation considers the caloric capacities of the tank components for the two loading m
1 and m
2, resulting in:
where dT is a small temperature change that occurred in dt
1, the same that occurred in dt
2 (temperature decay in experimental T1, immediately after the 8–9 h plateau interval—characteristic for latent storage); and c
p is the specific heat of the storage material (microcapsules), determined by DSC just below the solidification offset temperature. For tank calculations, dT is monitored from the T1 curve; the difference between T1 and T2 affects ∆T
in-out estimation less than 8% in the relevant temperature interval. In the tank experiments, a T1 curve just below solidification (point indicated by the offset temperature in T4) is almost a straight line, therefore the dt (respectively, dT) can be quite large without affecting the integration of heat flows to Q
m1 and Q
m2 heats for Equation (3).
Thermal analysis using transient nonlinear FEM.
Model and implementation. The tank model was implemented in Microsoft Excel spreadsheets, with the FEM simulation step progressing on the columns of a simulation table. Visual representation (time course, temperature dependency, etc.) of input parameters and output results was available in charts. To estimate the heat transfer, the tank was modeled as a cylinder, then FEM was applied for 10 concentrical layers (cells), imposing T1 boundary conditions from the experimental dataset. Only conductive transfer was taken into consideration, as suggested by Guo and Zhang (2008) [
18] for sodium nitrate. Heat transfer during PCM solidification was calculated by the apparent capacity method, derived from the enthalpy method (Kousksou et al., 2012; Khattari et al., 2020) [
19,
20]. Thus, microparticle heat transfer during solidification was modeled based on conversion of the solidification heat into specific heat. Thermal conductivity and specific heats were then approximated on specific intervals by polynomial functions on temperature to best fit the experimental data. For a narrow T4 interval at the onset of solidification, a constant thermal conductivity value, 2× higher than measured, was in place for T4 simulations, as it was the single major contributor to simulation–measurement overlap on that interval, probably due to some convective heat transfer by microcapsule deformation in the tank.
Simulations start from the presumed steady-state equilibrium reached at the end of the charging phase. Thus, inside the tank, the radial symmetric temperature distribution was set to range linearly from maximal temperature (T4) to the lowest temperature (T1). After few cycles of initial calculation, the temperature differences between consecutive cycles converged in each calculation point, therefore reaching a more realistic radial temperature distribution than initially assumed. This calculated quasi-steady state was attained with time–space resolution of the FEM mesh (time step 0.25 s and layer thickness 10–2 m) that ensured agreement with the second principle of thermodynamics.
Model limitations and corrections.
Symmetry assumptions. The radial symmetry of the tank is broken on partial tank filling because of the flat horizontal lining at the top of the storage material. In our model, this affects the cross-layer transfer in the material, introducing parallel heat transfer (microcapsule–air in parallel with microcapsule–microcapsule) for a same FEM layer. To overcome this without increasing FEM mesh complexity, for adjacent layers we calculated the effective transfer area (representing only the layers contact within the microcapsule-material block), and use it to express the exchanged heat. Thus, radial heat transfer between consecutive layers occurred on local temperature difference and effective transfer area. Transversal heat transfer occurred for each layer across the insulation, also considering the effective transfer area and T2–T6 temperature gradient (same for all layers, which is justified by a conductive steel plate that contacted all layers at the side-end). Symmetry across a vertical transversal plane intersecting the tank center was assumed. At each simulation step, the transferred thermal energy was assigned to respective layers, and then a new set of temperatures was calculated.
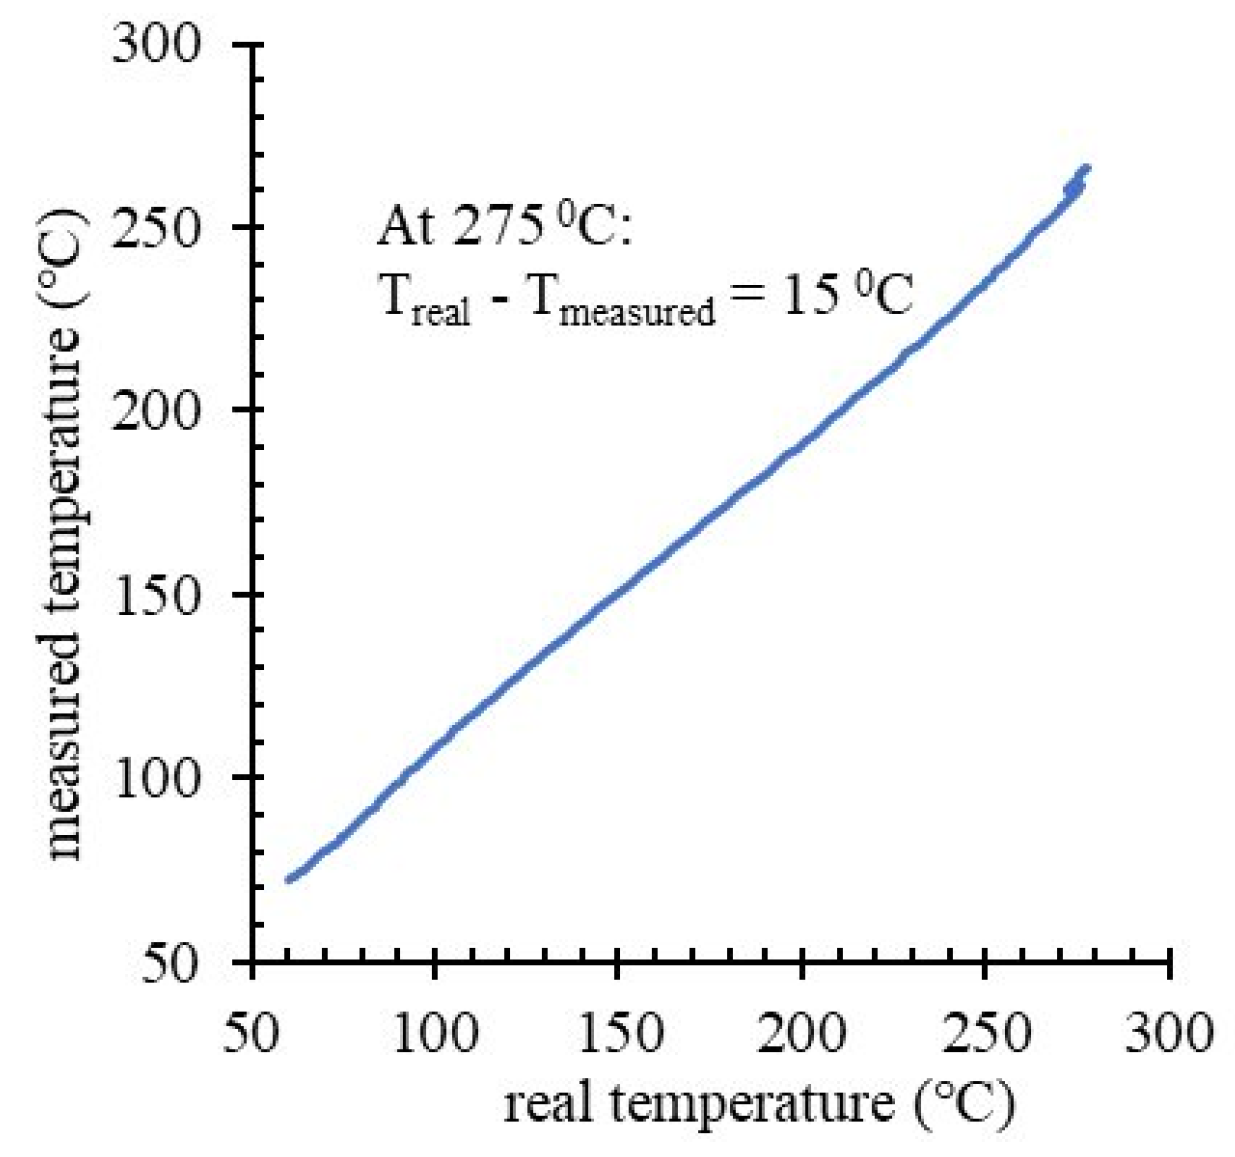
Experimental temperature readings were shifted from real values by thermocouple shielding. This occurred in the one-end-closed sheath tubes (T3, T4, T5) used to protrude with thermocouples at deep places inside the storage material. Therefore, with the tank empty, we performed a verification experiment for thermocouple readings calibration. A thermocouple was placed at T3 through the protruding tube and another thermocouple, in the same spot, from the inside the tank. The sheath of T3 separated the two thermocouples. The tank was then heated and T3 inside–outside values were recorded. A lag in T3 outside readings was observed. Temperatures were not corrected, as the value is change-rate dependent; instead this temperature difference was acknowledged in the calculations (by the adapted calorimetric method) for the stored energy, and reported distinctively for maximally corrected and uncorrected readings.
Input and output data for simulation: A cycle of FEM simulation consisted in complete calculation of the cell array. For each cell, the cycle output was (a) the amount of energy transferred between the respective cell and the surrounding cells, (b) the end-cycle temperature, and (c) the mass ratio between melt/solid PCM in a cell. Microcapsule experiments (Hot Disk and DSC) provided the thermal conductivity, specific heat, and heat of fusion of the storage material at various temperatures. In FEM, feed-in data for those temperature-dependent thermal parameters were generated by polynomial interpolation (up to grade 6) on multiple segments in the 30 to 380 °C interval. The heat of fusion was expressed as apparent specific heat, to account for the temperature - dependent heat-flow profile in the narrow temperature interval from solidification onset to solidification offset. Simulated T4 temperature evolution was compared with the corresponding experimental values.
4. Discussion
PCM microencapsulation aims to enhance the properties of materials for thermal energy storage and holds potential to provide effective solutions for applications in heating systems (Huang 2019) [
8]. Microencapsulation of NaNO
3 in ZnO shell for high temperature thermal energy storage may reduce the investment cost of using high-grade stainless steel (Fernandez et al., 2014) [
22] to contain the highly corrosive salt (Tudor et al., 2018) [
16]. In Tudor et al., 2018 [
16], a solvothermal process was used to produce nanometer-thick zinc oxide shells around potassium nitrate cores, obtaining microcapsules of few microns size. In the present paper, preparation of larger size (100 to 300 μm) microparticles is reported, each encapsulated in a layer of ZnO nanoparticles. Due to changes in the microencapsulation protocol (solvothermal synthesis was eliminated), the ZnO envelopes reported here typically show highly variable thickness, ranging from few nanometers to few microns.
Initially uneven, the shell ZnO layer of microcapsules seems to uniformly distribute upon melting–solidification, and thus resists multiple charging–discharging cycles. In this view of a potential for improvements in ZnO deposition, a 4:1 NaNO3 : ZnO mass ratio may be lower than optimal, where optimization means that for complete covering of the microparticle, the ratio should maximize the PCM mass on the expense of shell thickness. Despite this suboptimal PCM:shell ratio, our novel simplified protocol for microencapsulation may minimize the initial investments in specialized equipment for manufacturing. The observed thermal stability of microcapsules reported here may be explained by the fact that melting–solidification of PCM is able to select, after few cycles, structurally stable microcapsules. With the leaking PCM, compaction of the storage material at macroscale may occur, increasing the thermal energy density in storage cycles.
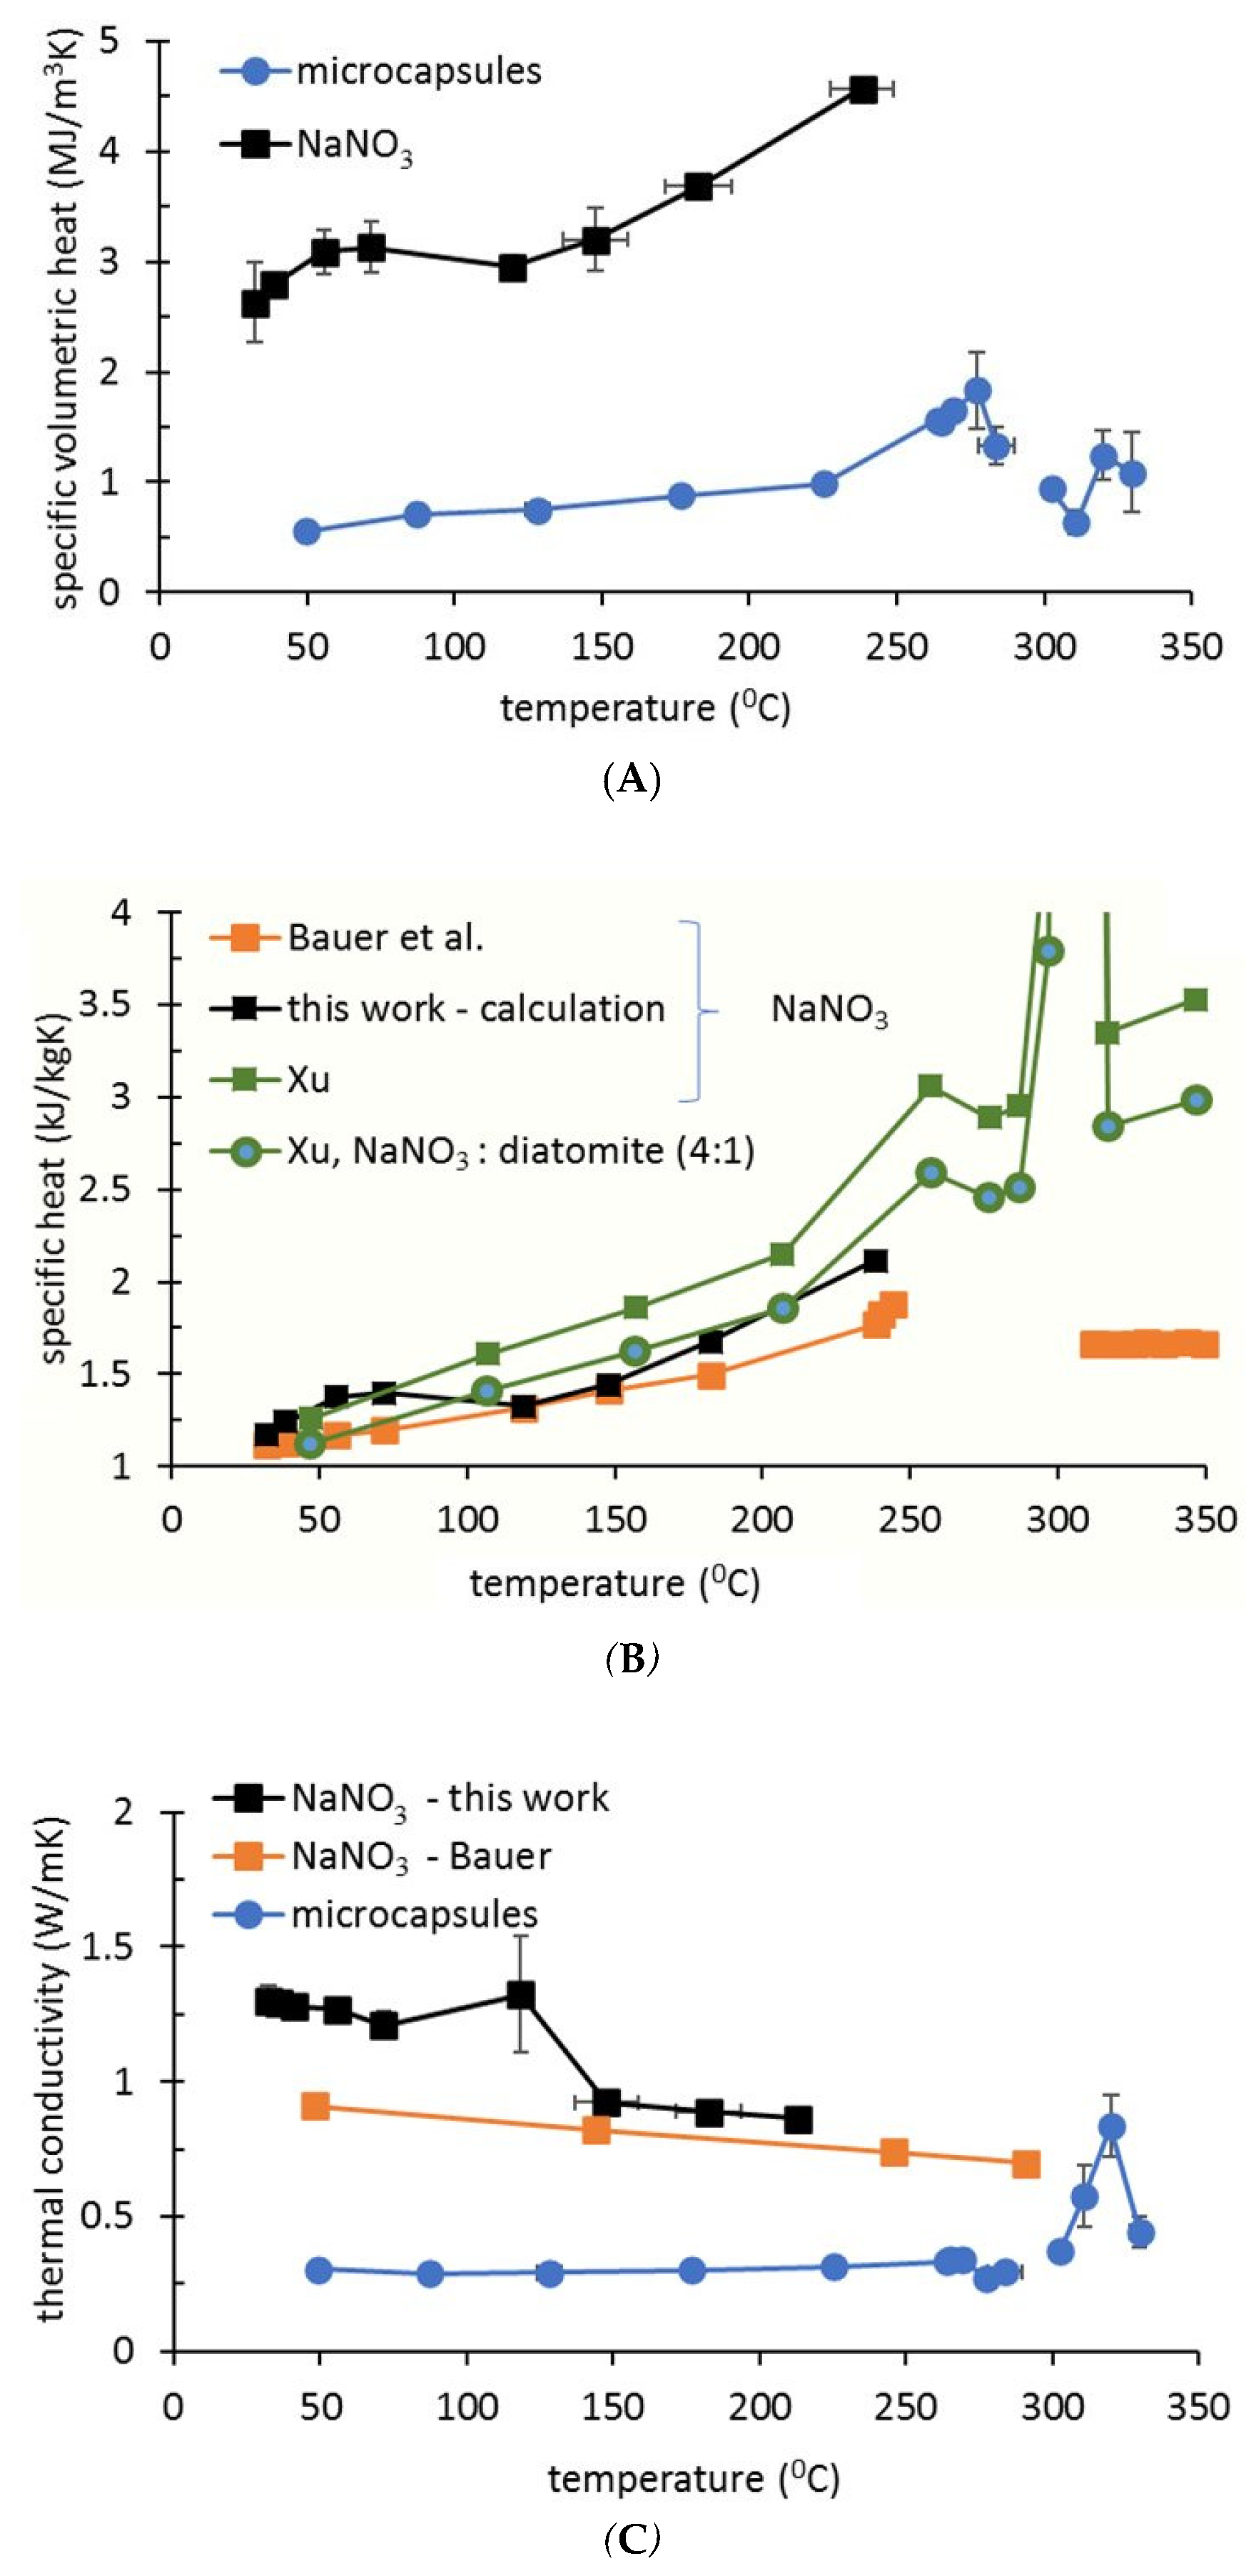
The temperature dependency for density, thermal conductivity, and specific heat of pure NaNO
3 is available from multiple sources (Xu et al., 2018; D’Aguanno et al., 2018; Bauer et al., 2017) [
4,
6,
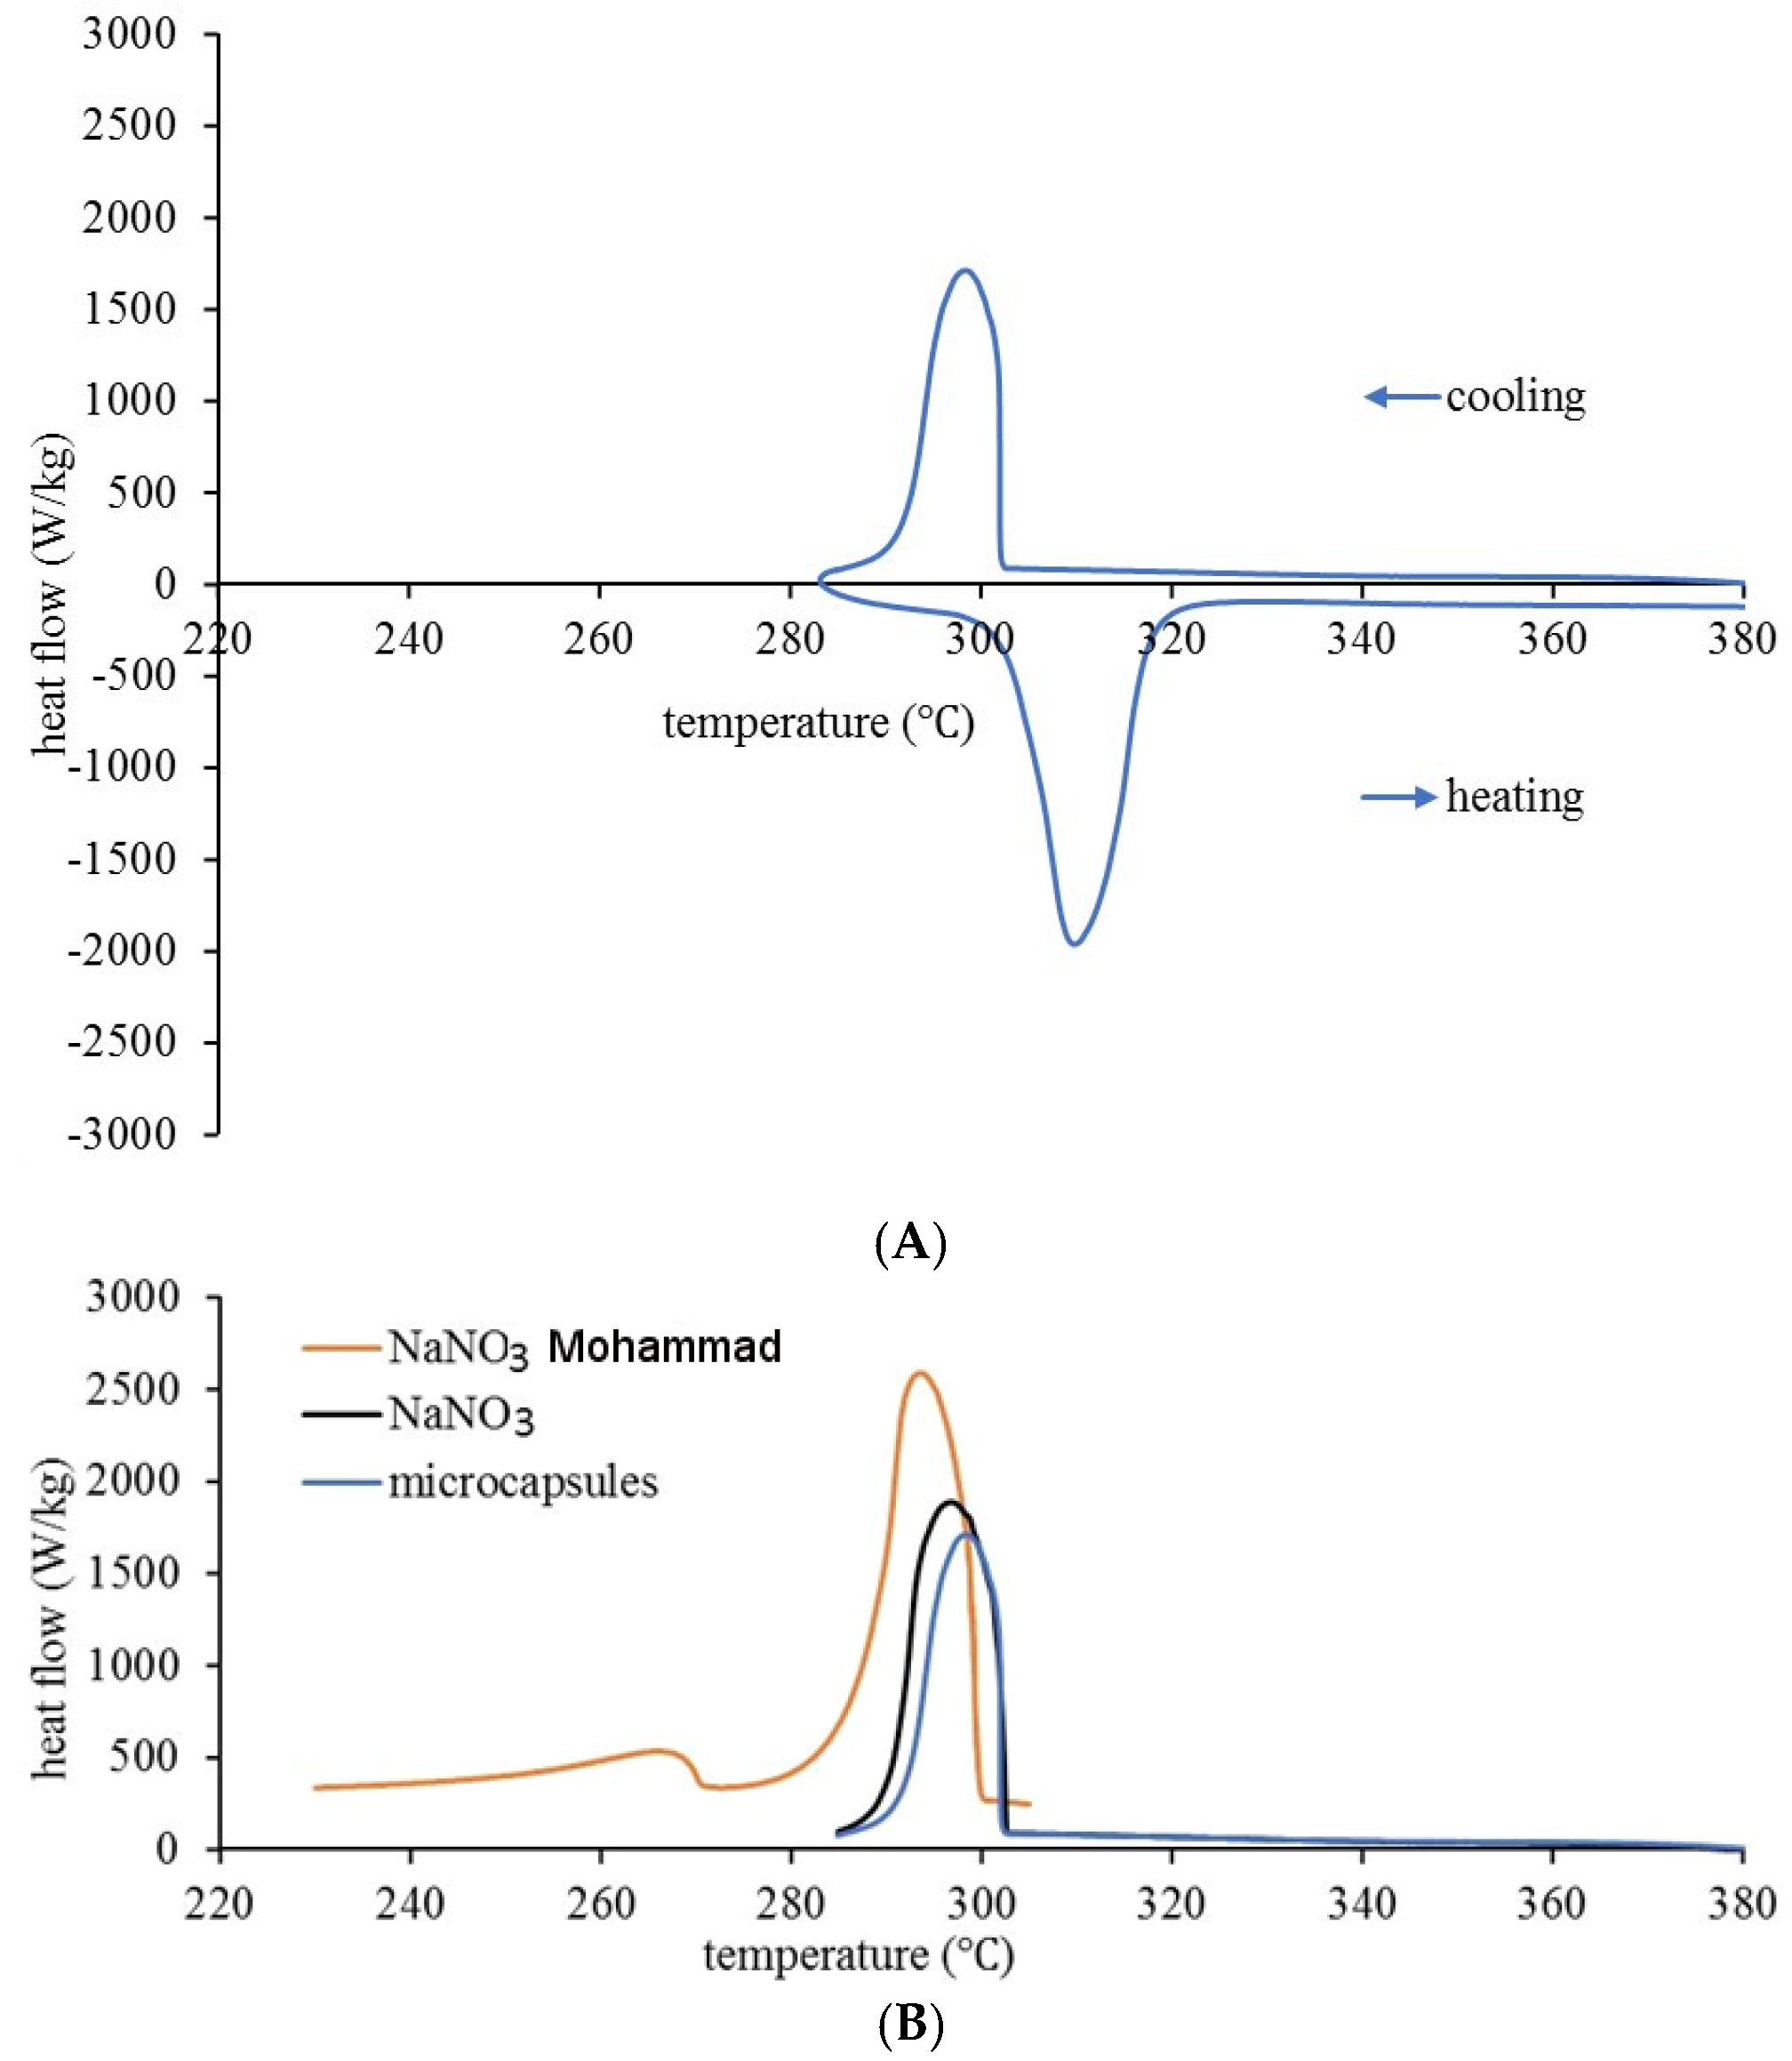
21]. Therefore, it was possible to compare our data (
Figure 4B) in the same graph with results reported by Xu et al., 2018 [
4] for NaNO
3 and for a mixture of diatomite: NaNO
3 at the same weight ratio as our NaNO
3:ZnO (4:1).
From
Figure 4A, which shows the volumetric specific heat, it is possible to calculate the specific heat (gravimetric) of the material by considering the temperature dependency of the material density. Since the density for the microcapsule-based material was not measured for high temperatures, a temperature variation similar to that described for NaNO
3 [
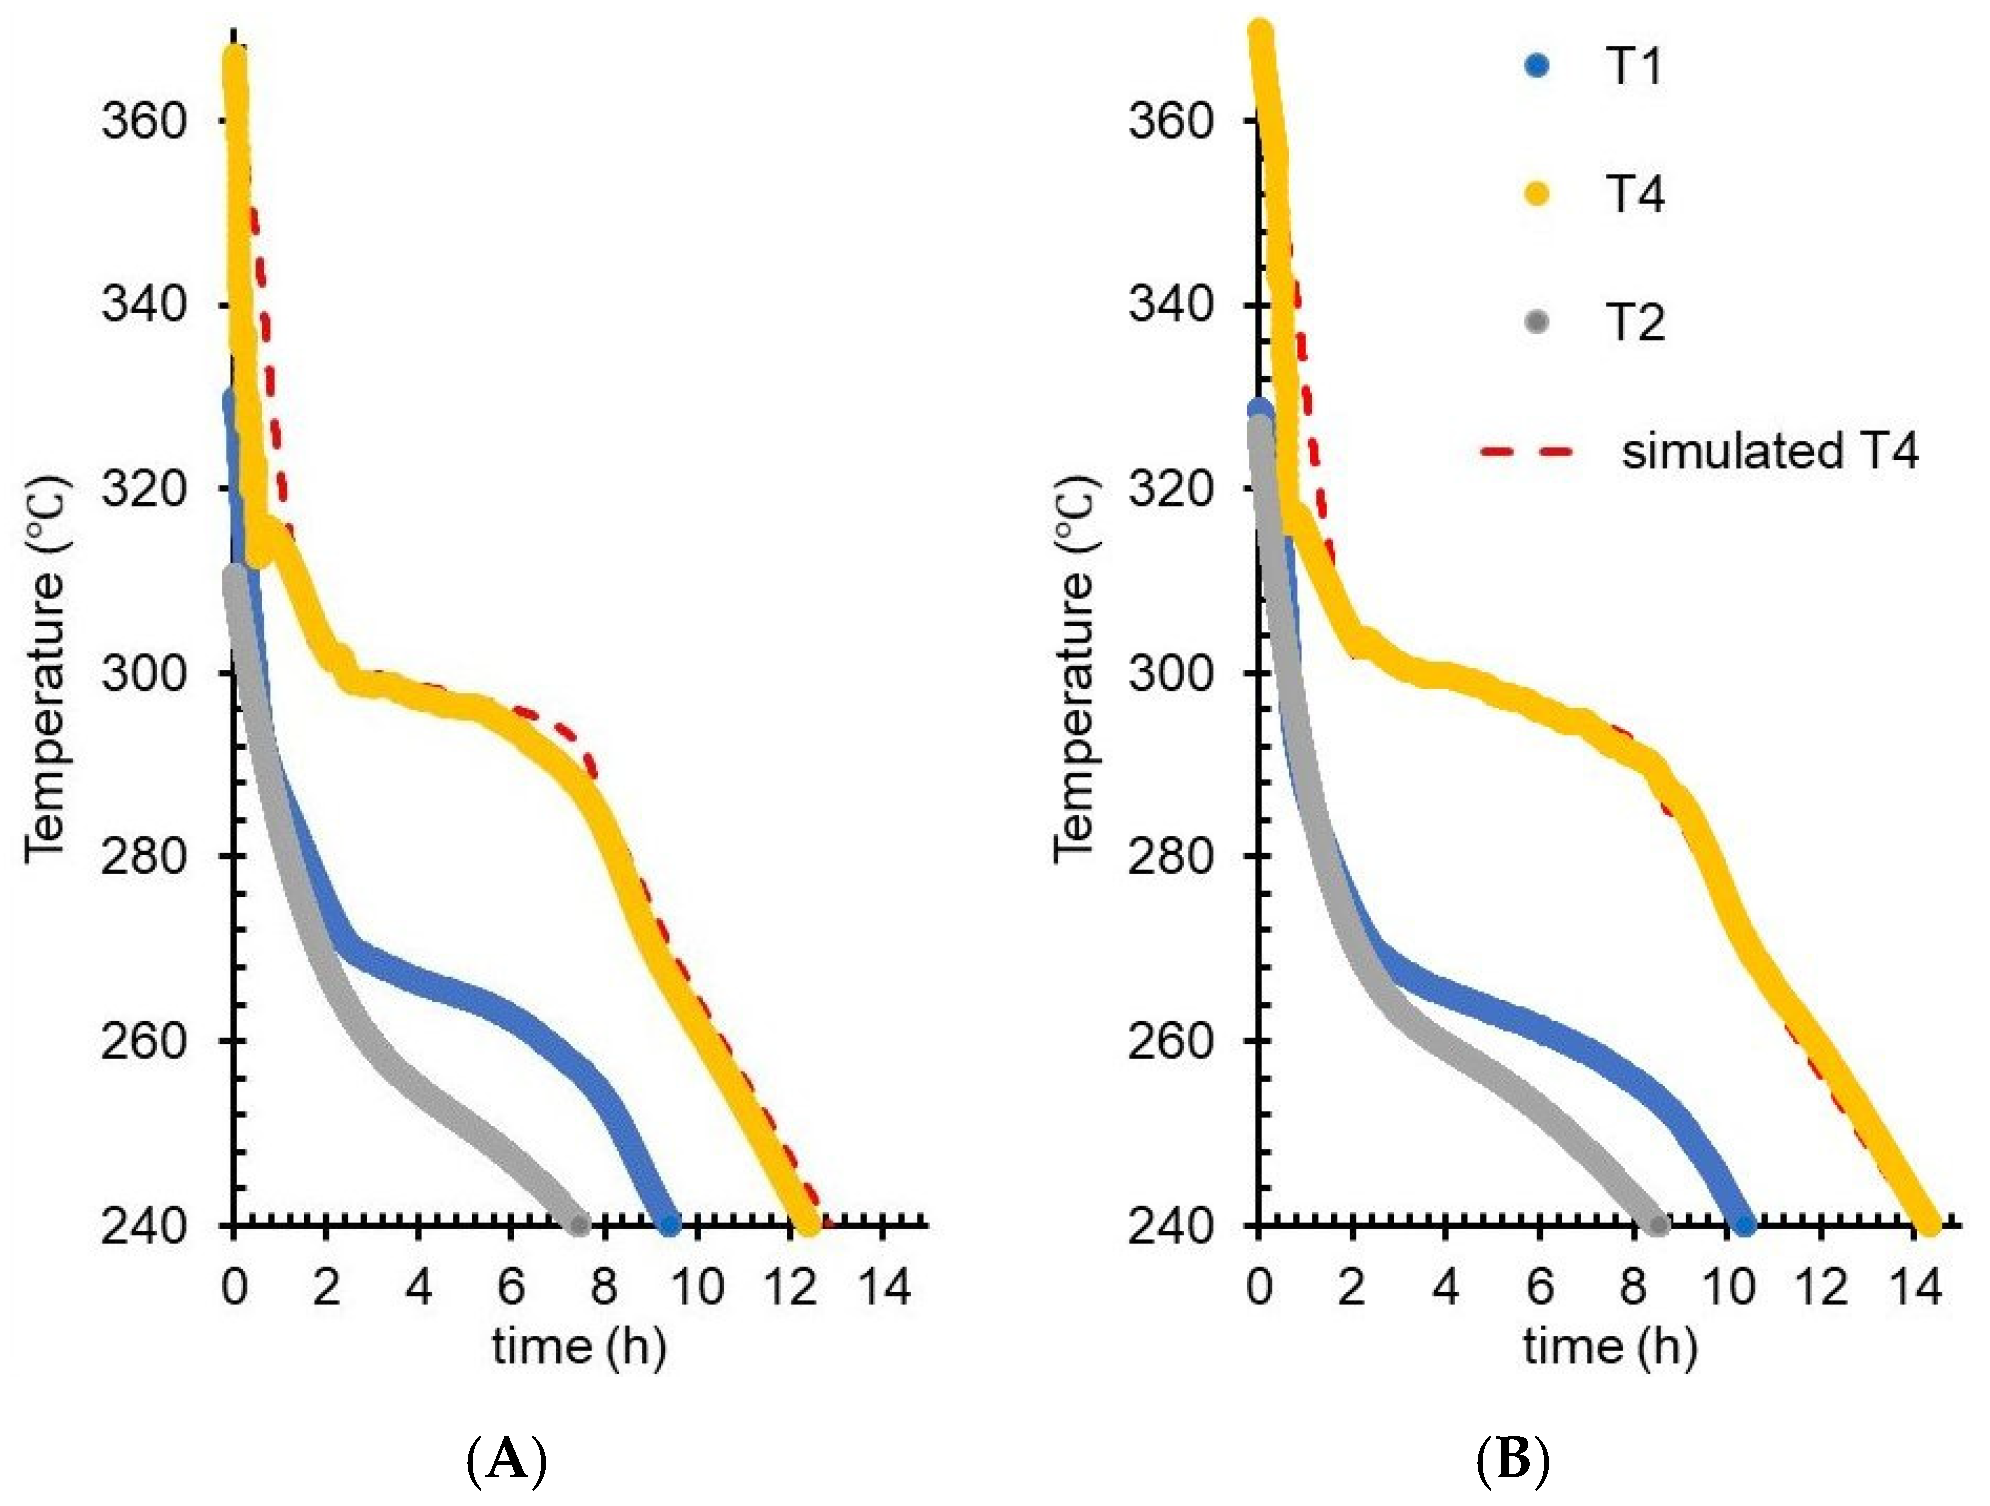
21] was assumed. In the temperature interval from 50 to 284 °C, a value between 300 and 1020 J/kg·K resulted from the calculations of the specific heat of microcapsules; particularly important at 284 °C, where the specific heat for microcapsules is 801 J/kg·K. FEM simulations (
Figure 9) validated 750 J/kg·K as the only value of the specific heat that allows consistent overlap below the solidification T
offset with the experimental T4 slope (for both tank loads). For Equation (3) in the adapted calorimetric method, the 824 J/kg·K value (measured by DSC) was used; this is near 801 J/kg·K value deduced from volumetric specific heat, and close to the 750 J/kg·K value from FEM validation. Thus, FEM simulations not only reproduce the experimental temperatures, but are useful to estimate the accuracy of other methods (e.g., DSC and adapted calorimetric method) by selecting, from multiple fitting (simulation) sessions, a specific set of values for the material thermal parameters.
Multiple applications are designed to simulate thermal transfer (Al-abidi et al., 2013) [
11]. While designing a standalone CFD application [
17] capable of reproducing complex geometries, it was observed that a simplified cylinder model of the storage tank is sufficiently informative and fast to produce end-simulation results. The FEM simulations require as input the (a) tank geometry, (b) thermal properties of the storage material (from laboratory measurements), and (c) time course of temperature on the tank shell (monitored in tank charge–discharge experiments). The simulation output is a time course for temperatures and thermal energy distribution in the virtual tank, confirmed by thermocouple temperature monitoring in the center of the prototype storage tank.
The FEM model allows to evaluate to which degree accuracy is needed for thermal property inputs (thermal conductivity and specific heat), and whereas polynomial fits are good descriptors for experimental data. The unusual choice of Microsoft Excel for the implementation of FEM simulations is based on the cylindrical symmetry and the simplicity of the storage tank, allowing for massive reduction in the mesh size. The validity of the simplification was tested by the convergence of the result, in each cell, for an interval of time steps ranging from 0.1 to 0.5 s. Although in terms of computing resources needed at a glance, Excel simulation approach is more demanding than an equivalent runtime simulation application, it has the advantage of facilitating development of features such as graphically augmented, transparent, and explicative input and output data (Tomimura et al., 2009) [
23].
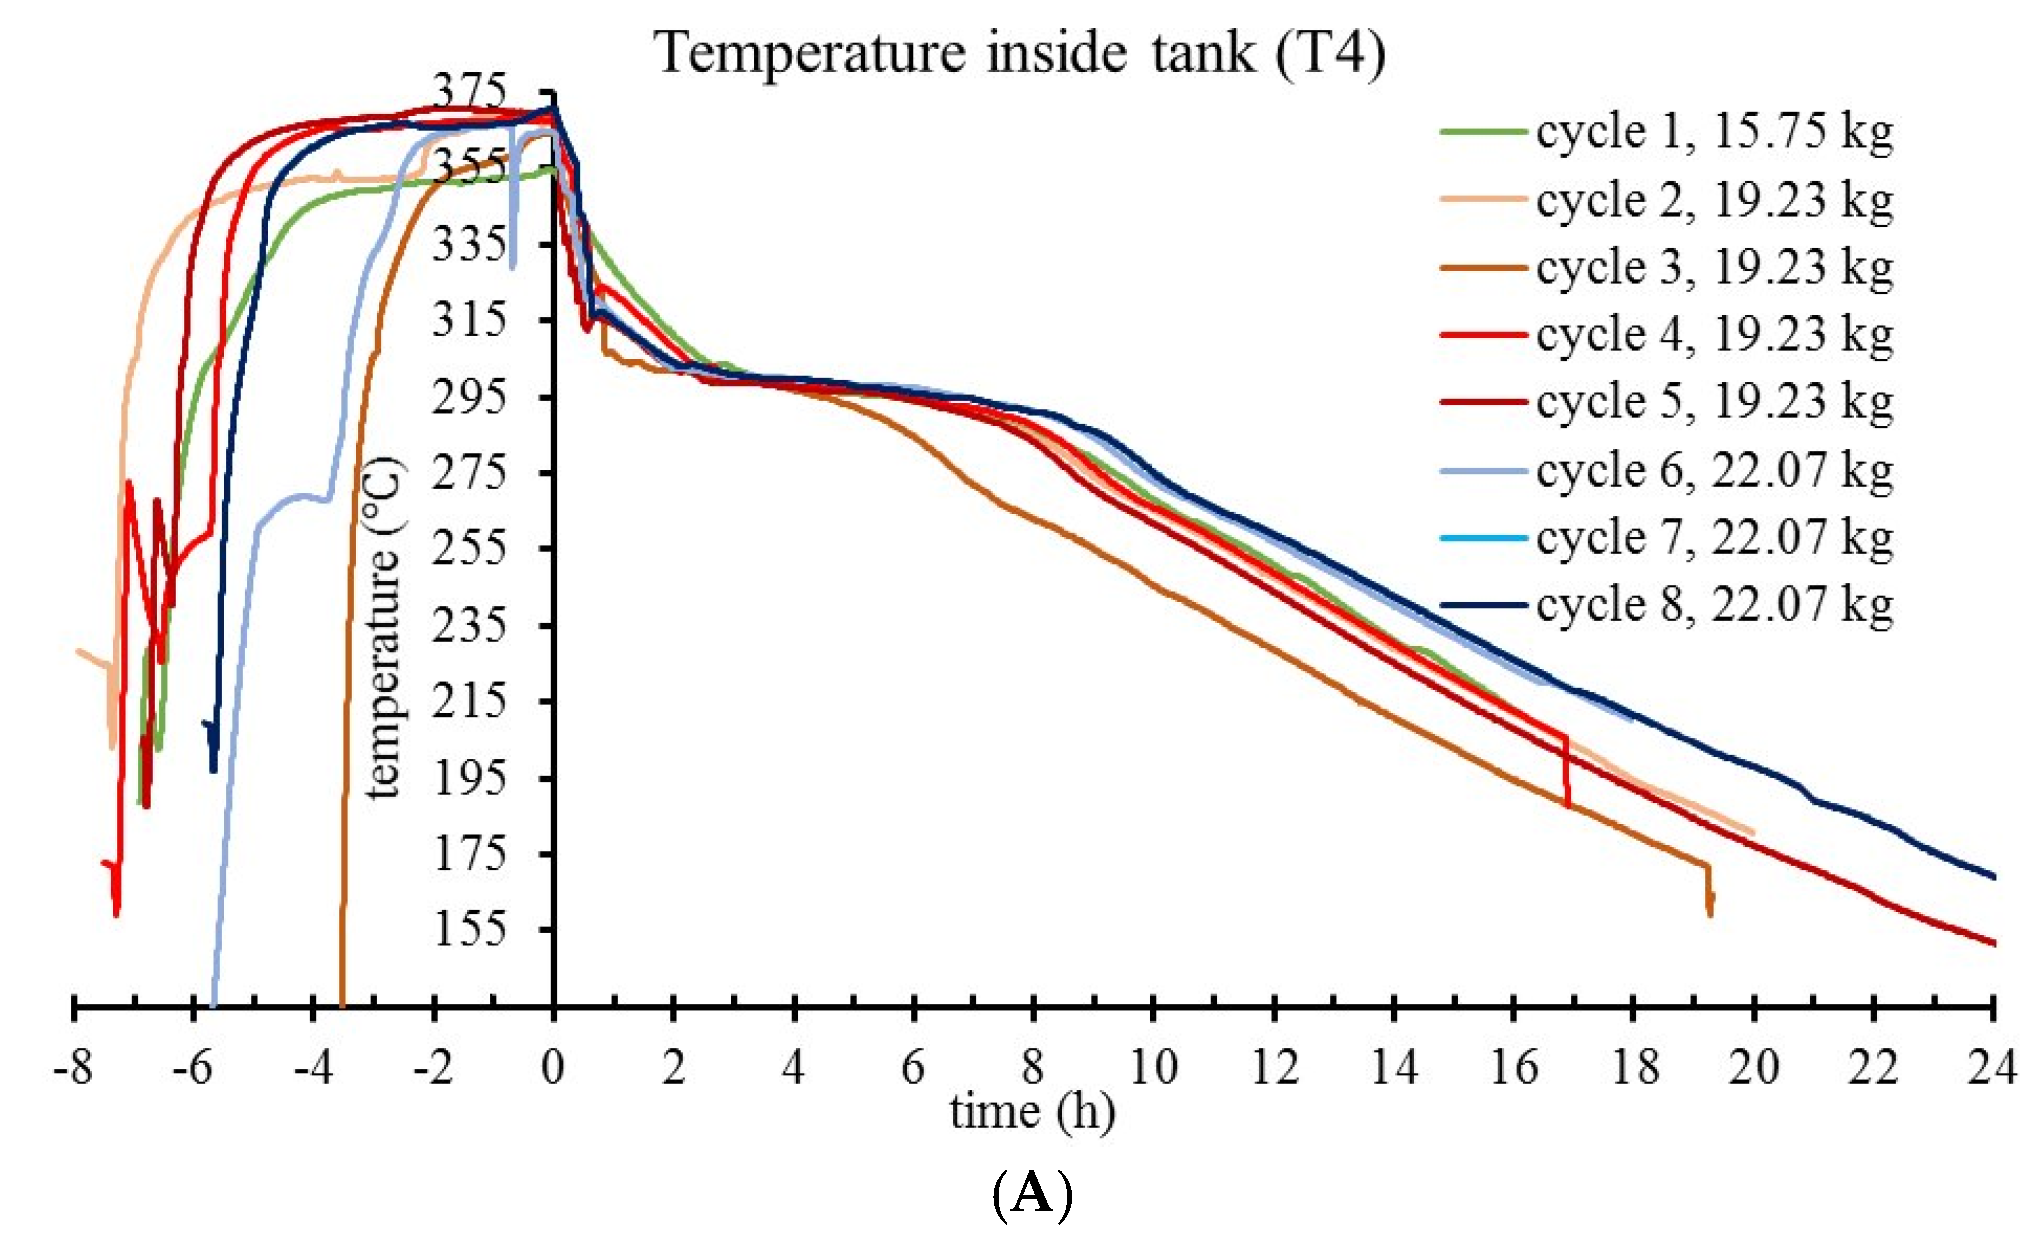
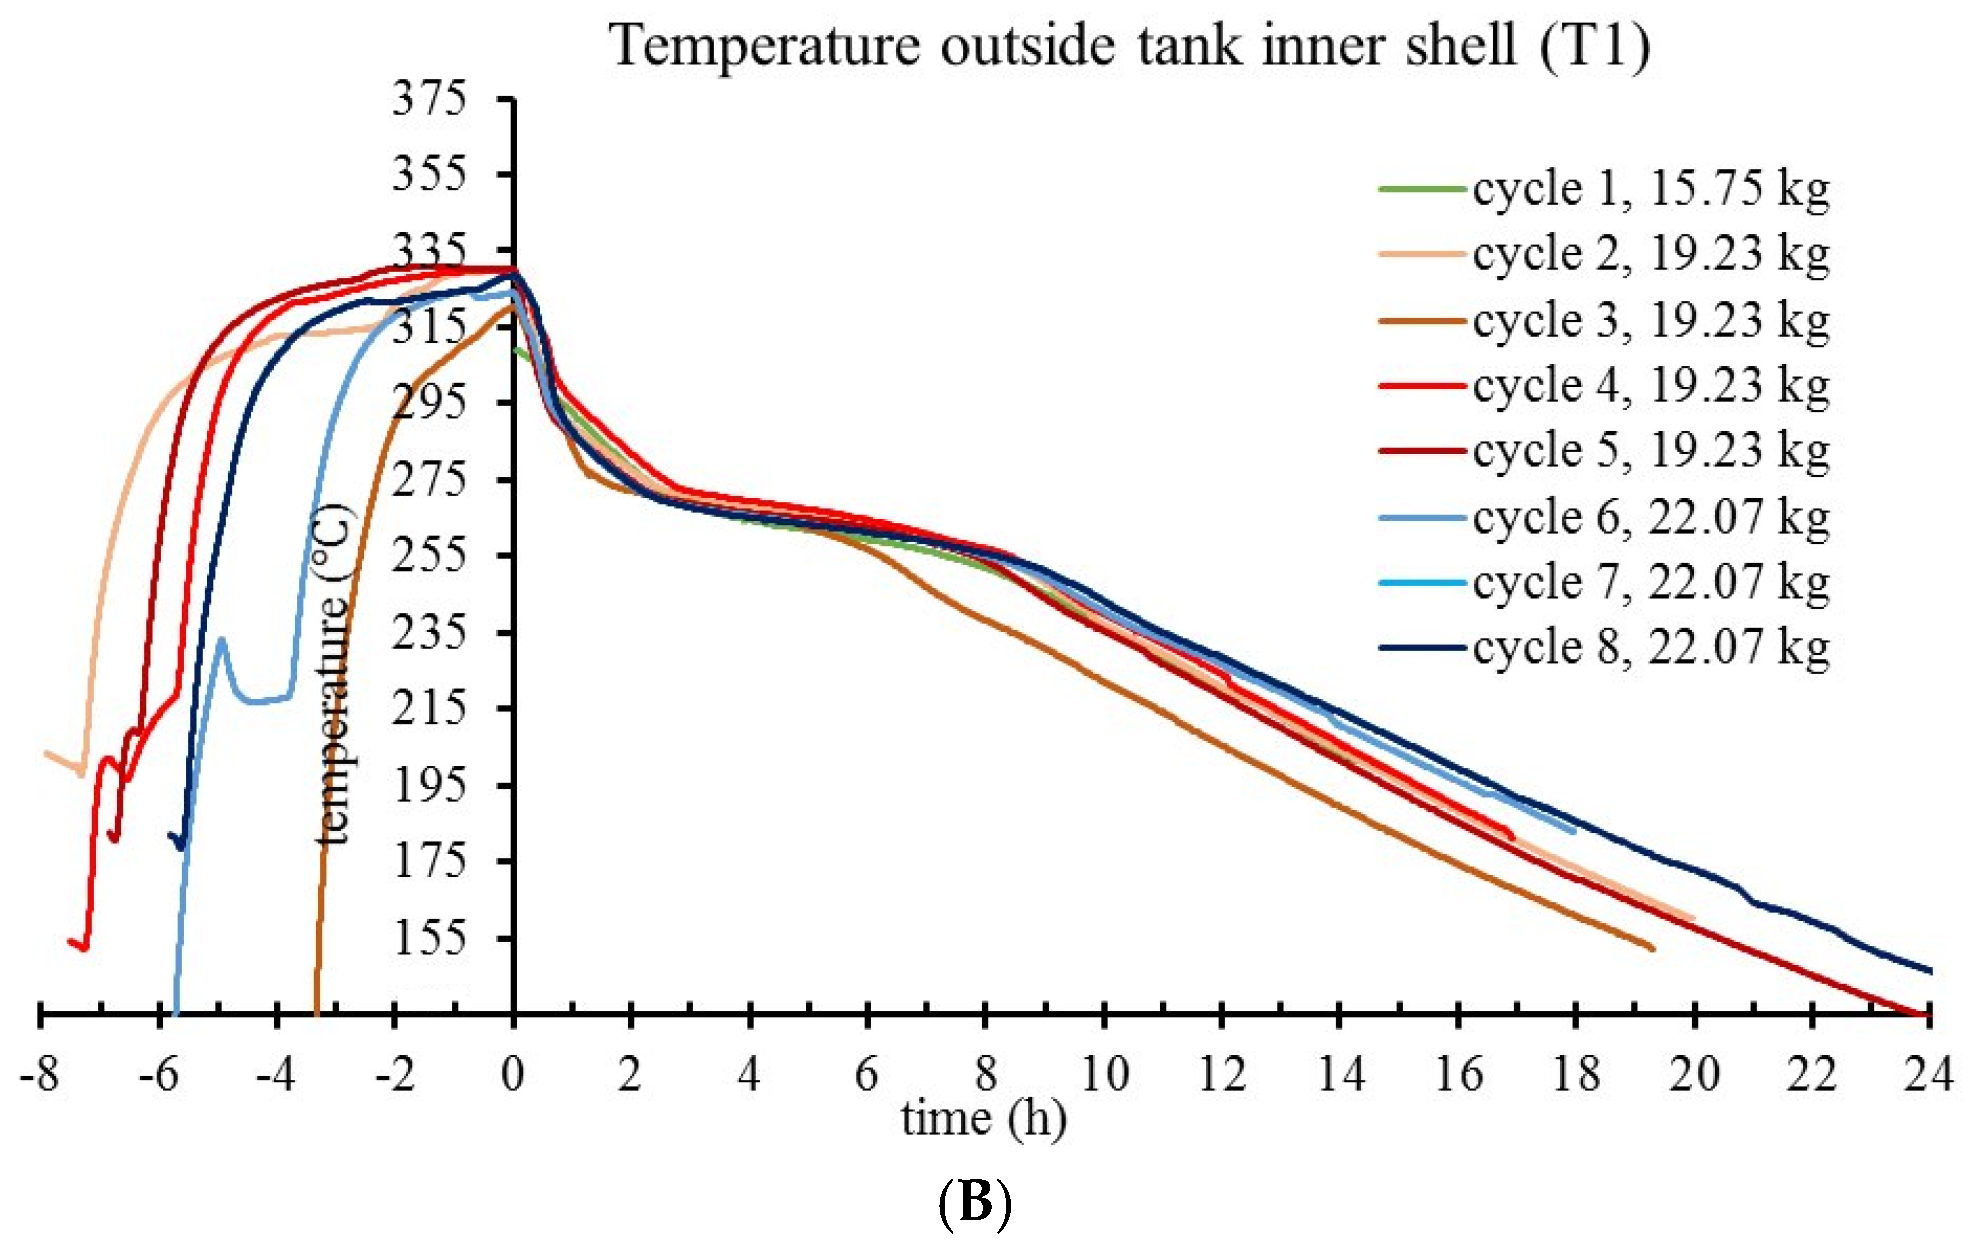
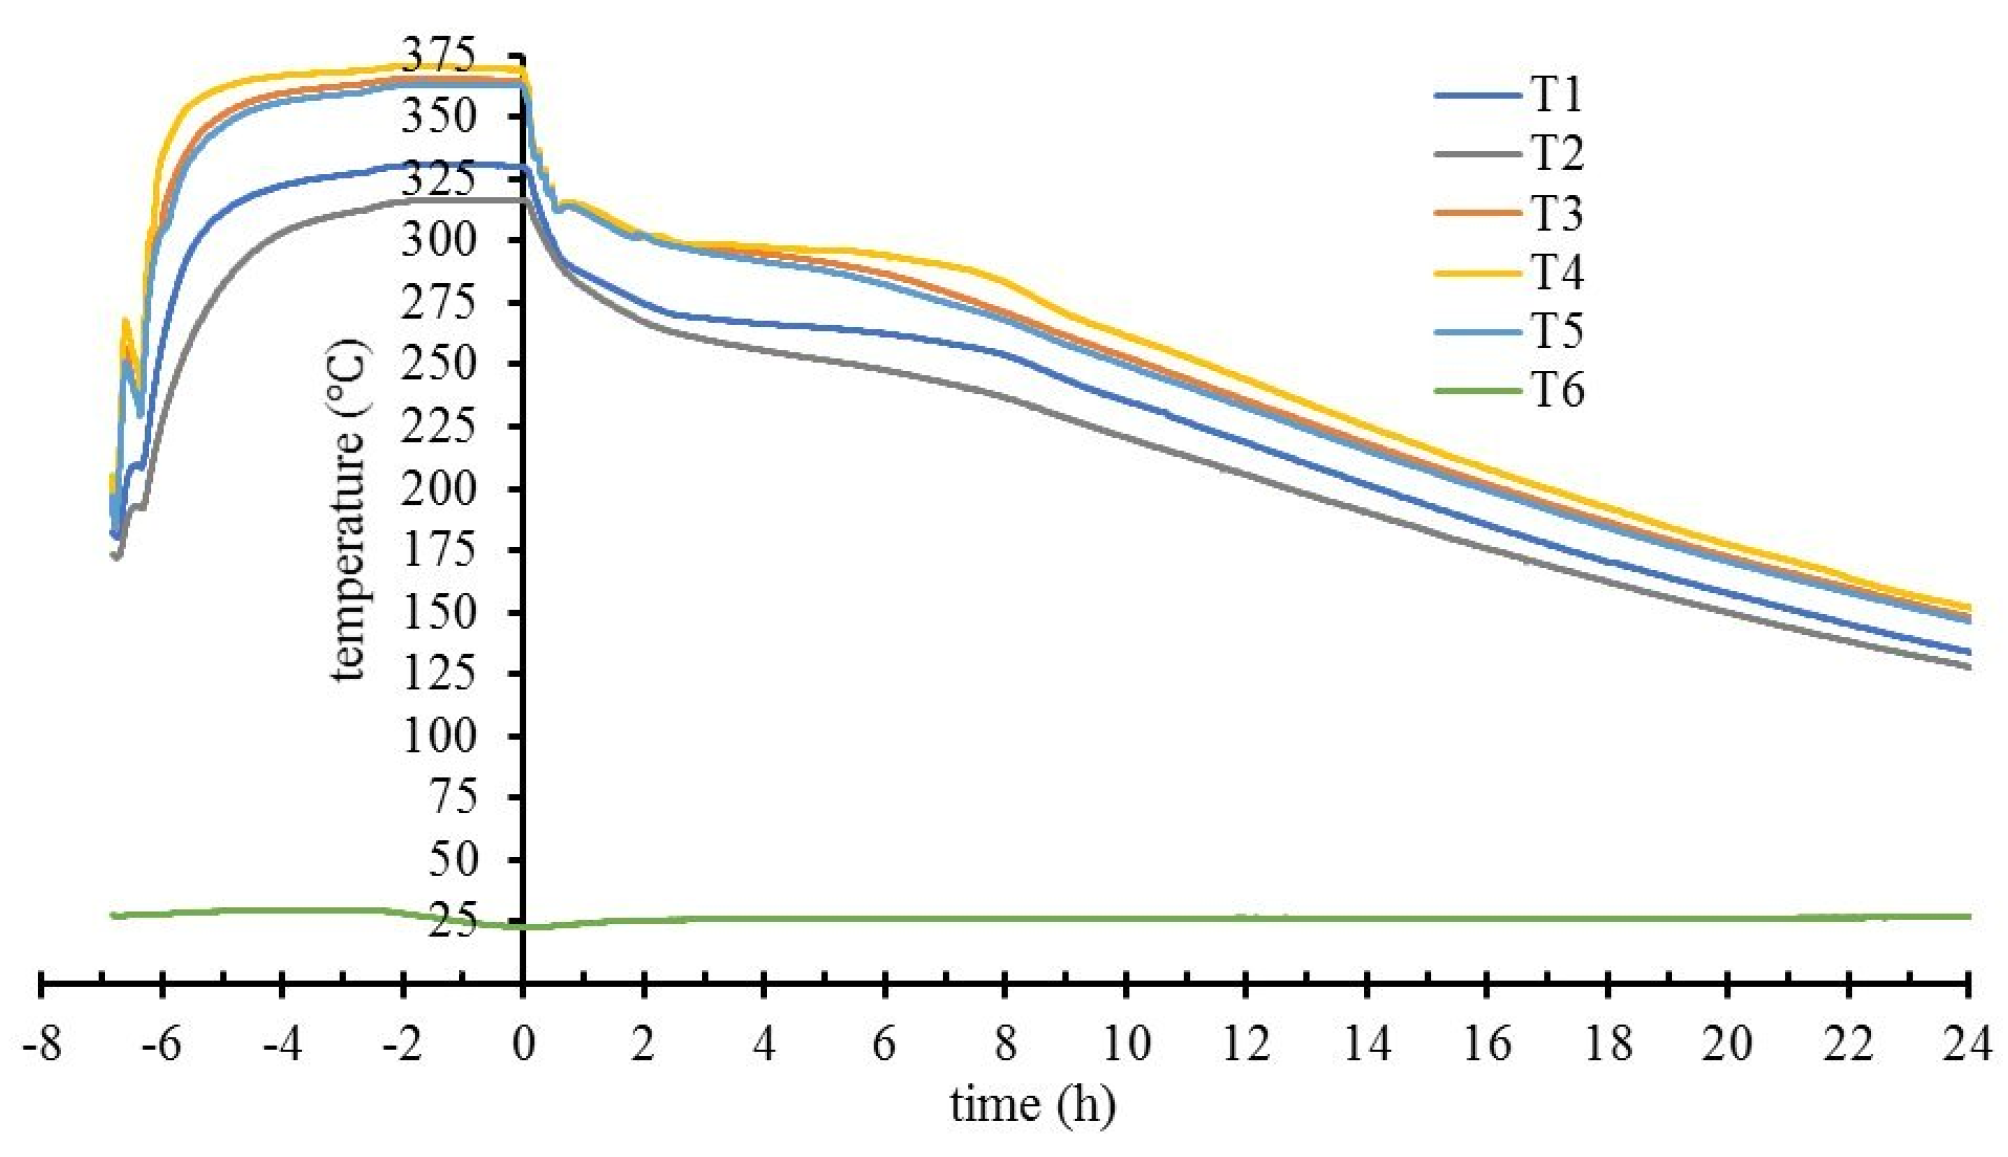
The main question to which this study responded is if high temperature thermal energy may effectively be recovered from storage in microcapsules. In a simplistic evaluation of the tank-stored latent energy, the latent heat of microcapsules is multiplied by their mass, providing a target value (maximal) for the potential of the tank. In real thermal storage cycles, a PCM material is not uniformly exposed to energy transfer during tank charging; melting of all available PCM mass depends on factors such as thermal conductivity of the microcapsules, charging time, and temperature in the heat exchanger circuit. This is evident in the charge–self-discharge cycle 3 (
Figure 6), when a plateau temperature (quasi-steady state) was not reached at charging time, therefore the high-temperature discharge phase was shorter. Ideally, when charging is complete and all NaNO
3 content is liquid, most of its latent heat is retrievable at temperatures that correspond to latent heat storage.
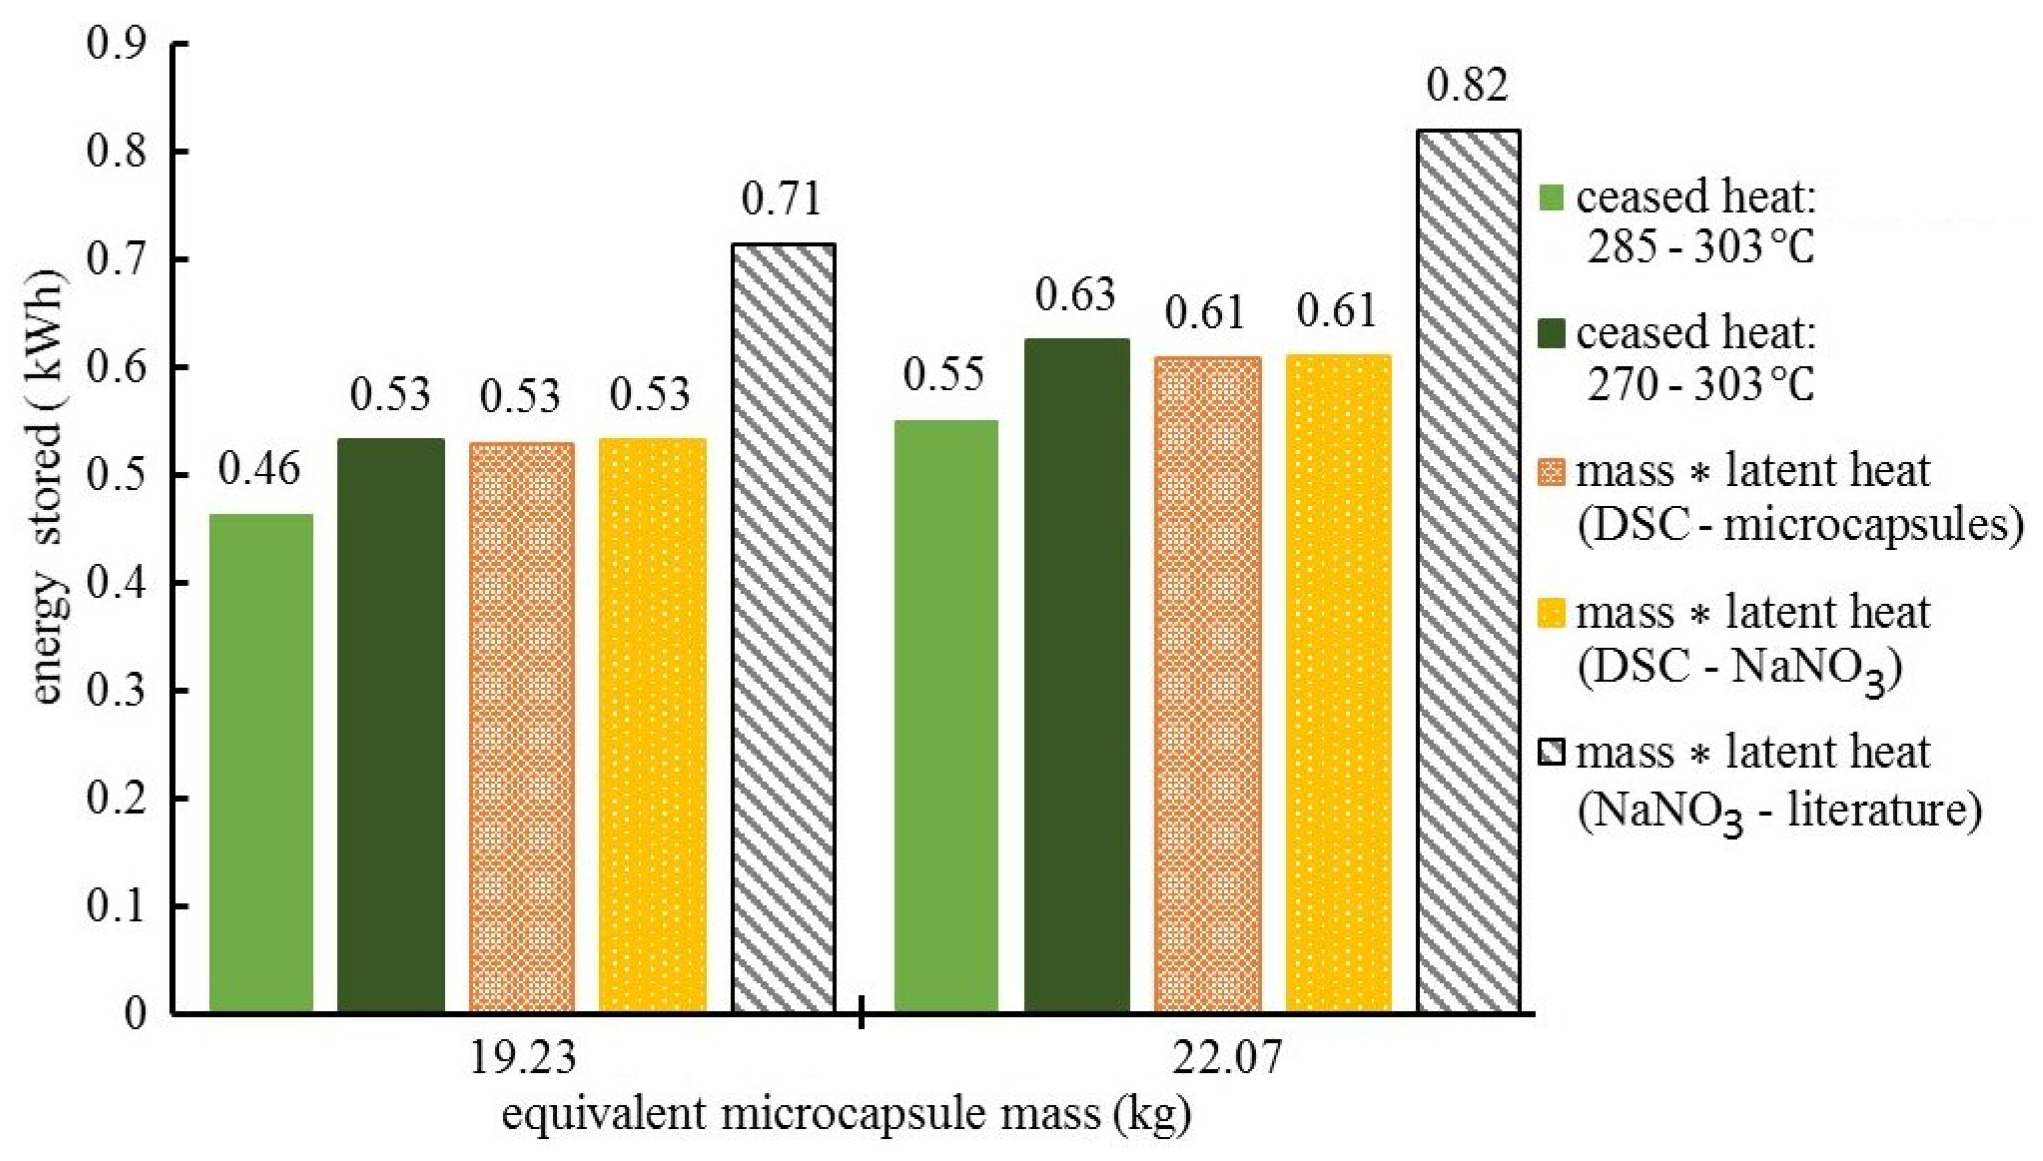
Figure 8 presents the high temperature energy that can be retrieved from NaNO
3–ZnO microcapsules, which corresponds to specific energy storage of 80.5 kJ/kg as the low estimate and 99.5 kJ/kg as the high estimate. These values are comparable with specific energies for other inorganic salt-based PCMs [
24,
25]. The corresponding energy density range (1.45 × 10⁵ to 1.79 × 10⁵ kJ/m
3), considering 1800 kg/m
3 for the microcapsule material density (after melting–solidification cycles), is also as expected.
Noticeable differences of the NaNO
3 tank-stored energy exist (
Figure 8) when calculations are based on literature data versus this work’s DSC measurements. This is explained by a drop of the NaNO
3 latent heat after the first melting–cooling cycle, probably due to partial nitrate decomposition (Bauer et. al 2013) [
21].
Estimations of the specific energy incorporate several sources of error: (a) the lag in T3–T5 temperature readings presented in
Figure 7, (b) small (unintended) variations of experimental conditions in the tank setup (even small sudden changes in the ambient light were spotted in temperature traces), and (c) the precision of the thermocouples that were linearly calibrated for a large temperature interval. Instead of presenting data means from multiple cycles (with error bars), the graphs in
Figure 6 show temperature evolutions for each cycle, which is more informative for tendencies that fall under statistical thresholds. With four cycles on 19.23 kg load and three cycles on 22.07 kg load, data show no pattern for temperature–trace variation between cycles of a same load, whereas temperature traces corresponding to different loads are clustered. By reporting a range for the estimated specific energy density of microcapsules (from
Figure 8 data) instead of a data mean and error bars, this work acknowledges limitations in the precision of the adapted calorimetric method to measure the latent heat that is stored in the prototype tank. Nevertheless, alternative methods such as heat flow balance focused on monitoring the difference between T8 and T7 during active HTF pumping/extraction are seriously affected by the thermocouple precision (±1.5 °C) and the possibility to monitor HTF flow rate, while still dependent on estimation of heat flow through tank insulation.
The workflow for design research and development of a new solution for latent heat energy storage was charted by Whiffen and Riffat (2013) in their
Figure 5 [
24]. It comprises several parallel activities already reported for the ENERHIGH project [
13,
15,
16,
17], such as selection of materials in the appropriate range, design, and development of the heat exchanger and construction of the prototype. Here, laboratory measurements of microcapsule thermophysical properties and prototype experimentation converge to FEM simulation, in a platform for integrated material design and testing, to be used for enhancement of relevant properties and optimization of material use in product applications.
To better evidence the process and optimize charging/extraction for intermittent energy sources, FEM simulations with adequate geometry details can produce time-resolved 3D maps of heat transfer and the possibility to explore various real-use scenarios. Work is in progress to design and implement a software application that enables FEM simulations for complex geometries of the storage tank and spatial resolutions of only a few millimeters (Tudor et al., 2019) [
17]. Implementing methodological solutions from the current study, a simulation application may be able to reproduce thermal transfers with higher fidelity during melting–solidification. The nonlinear temperature dependencies of thermodynamic parameters (thermal conductivity and apparent specific heat) may be obtained from laboratory determinations and used as input in FEM simulations to produce overlap with the experimental temperature curves; the outcome is exemplified in
Figure 9.


 ,
, 


