Featured Application
The presented analytical expression for the atomic volume of the binary alloys at arbitrary composition can be used in the equation of state modeling. This expression is robust and predictive even in the absence of experimental data at a particular alloy composition.
Abstract
Alloys expand or contract as concentrations change, and the resulting relationship between atomic volume and alloy content is an important property of the solid. While a well-known approximation posits that the atomic volume varies linearly with concentration (Zen’s law), the actual variation is more complicated. Here we use the apparent size of the solute (solvent) atom and the elasticity to derive explicit analytical expressions for the atomic volume of binary solid alloys. Two approximations, continuum and terminal, are proposed. Deviations from Zen’s law are studied for 22 binary alloy systems.
1. Introduction
According to the Hume-Rothery rules [1], (a) extensive substitutional solid solution occurs only if the relative difference between the atomic diameters (radii) of two species is less than 15%; (b) for the appreciable solid solubility, the crystal structures of two elements must be identical; (c) a metal will dissolve a metal of a higher valency to a greater extent than one of a lower valency; (d) an electronegativity difference close to zero gives maximum solubility. The more electropositive one element and the more electronegative the other, the greater the likelihood is that they will form an intermetallic compound instead of a substitutional solid solution.
According to Vegard’s law [2], the unit cell parameters should vary linearly with the composition for a continuous substitutional solid solution in which the atoms or ions that substitute for each other are randomly distributed. For ideal solutions, with excess energies and volumes equal to zero, the atomic volumes (Ω) of disordered alloys vary linearly with the composition (Zen’s law, [3]): Ω(x) = ΩAx + ΩB(1 − x), where x is the atomic composition of the element A. One should notice that even for an ideal solution (for which Zen’s law is valid), a deviation from Vegard’s law can occur. Indeed, for a cubic structure, the lattice parameter, a, is related to the cell volume, V, by the relation a = Ω1/3, and the linear variation of the cell volume does not imply the linear variation of the lattice parameter.
Models exist to predict the deviation from Zen’s law; however, they are not sufficiently reliable. Even the accuracy for predicting the sign of the deviation from Zen’s law does not exceed 60%. Hume-Rothery and Raynor [4] found a significant negative deviation from Zen’s law for Cd-Mg solid solutions. Massalski and King [5] found that the numerous intermetallic phases in the Cu-Zn system show a negative deviation from Zen’s law. Indeed, negative deviations from Zen’s law are observed for most of the ordered compounds. The excess volume of the alloy, ΔΩ = Ω − ΩZen’s, usually called “the superstructure contraction”, plays an important role in the stabilization of intermediate structures due to the free energy gain (ΩZen’s is the atomic volume determined by Zen’s law).
Kozlov et al. [6] introduced several parameters that define the geometry of binary alloys. In addition to the dimensional size factor, δ = RA/RB, where RA and RB are the atomic radii of components A and B, respectively, Lawes-Parthé space filling factor, ψ, and superstructure contraction, ΔΩ/Ω, have been introduced. The space filling factor of binary alloys is defined as ψ = [ΩAx + ΩB(1 − x)]/Ω(x). By studying numerous binary alloys with AB and A3B stoichiometry, Kozlov et al. [6] found that among AB stoichiometry structures, B2, B19, and L10 structures with Pm3m, Pmcm, and C4/mmm Space Groups, respectively, show a negative superstructure contraction, ΔΩ/Ω, equal to −0.100, − 0.038, −0.045, respectively, and only L11 structure, the Space Group R-3m, shows a very small but positive superstructure contraction equal to +0.003. Among A3B stoichiometry structures, L12 (Pm3m), D019 (P63/mmc), D023 (4I/mmm), and D024 (P63/mmc) structures show a negative superstructure contraction equal to −0.153, −0.053, −0.105, and −0.144, respectively. Two A3B structures, D022 (4I/mmm) and A15 (I/mmm) show a positive superstructure contraction equal to +0.011 and +0.054, respectively. The existence of stable intermetallic compounds with a positive superstructure contraction is explained in terms of the space filling factor, ψ.
Kozlov et al. [7] constructed the histograms of distribution of the B2 and L12 superstructures in the Ni-Al system as a function of the space filling factor, ψ, and superstructure contraction, ΔΩ/Ω. It was found that the space filling factor and enthalpy of phase formation increase simultaneously in the Ni-Al intermetallic compounds. The space filling factor and superstructure contraction intertwine: the higher the space filling factor, the higher the superstructure contraction. It was shown that the rate of the change in the superstructural contraction determines, in many respects, the enthalpy of phase formation: the higher space filling factor, the higher the enthalpy of phase formation. The highest space filling factor, superstructure contraction, and the enthalpy of formation are observed for the stoichiometric NiAl (B2) structure: 0.785, −0.140, and −59 kJ/mol, respectively.
Klopotov et al. [8] addressed the main crystallogeometrical parameters of compounds in the Ni–Ti system. It was determined that the space filling factor, superstructural contraction, and enthalpy of phase formation increase simultaneously. The highest space filling factor, superstructure contraction, melting temperature and the enthalpy of formation are observed for the stoichiometric Ni3Ti (D024) structure: 0.80, −0.086, 1400 °C and −38 kJ/mole, respectively.
Potekaev et al. [9,10] established the explicit correlation between the type of evolution of the binary phase diagrams based on elements of VIIIA and IB groups of Mendeleyev’s Periodic Table and the nature (positive/negative) of the superstructure contraction.
The superstructure contraction, which reflects the deviation from Zen’s law, is a very important parameter of the binary alloy crystal lattice. In the next section we discuss a theoretical basis, based on Lubarda’s [11] elastic inclusion model, for analytical determination of the atomic volume of solid solutions.
2. Theoretical Background
Lubarda [11] derived an expression for the effective lattice parameter of binary solid solutions by using an elasticity inclusion model, in conjunction with an apparent size of the solute atom when resolved in the solvent matrix. Assuming the R1 is the Wigner-Seitz radius of the solvent material, , the volume increase produced by insertion of the solute atom to the solvent is expressed as
where the misfit coefficient, C, is given by the expression
and is the apparent Wigner-Seitz radius of the solute material, which is introduced to approximately account for the electronic interactions between the outermost quantum shells of the solute and solvent atoms. The parameters γ1 and γ2 are defined by
where μ1(2) and K1(2) are the shear and bulk moduli of the solvent (solute). If x is the atomic concentration of the solute, the total volume increase produced by insertion of the N2 = xN1 solute atoms (N1 is the total number of the solvent atoms) is
and the total volume is
where V1 is the volume of the solvent. The atomic volume of the system with N2 = xN1 solute atoms will be
The apparent radius of the solute atom, , is estimated using one piece of experimental information about the solid solution, i.e., the initial slope of the lattice spacing vs. composition curve, . King [12] introduced the volume size factor:
By differentiating Equation (6), ,
Thus, combining Expressions (7) and (8), one gets or = 3 and 3 Thus, the apparent Wigner-Seitz radius of the solute atom can be calculated from
and an analogous expression is derived for King [12], using the high-precision lattice parameter data available in the literature, presented numerical values of ω2 for 469 metallic solid solutions. The values of the experimental Wigner-Seitz radii, R1, R2, measured at room temperature, the volumes size factors, ω1 and ω2, and the apparent radii, and , are listed in tables one, two and four of Ref. [11].
According to Lubarda [11] and Equation (6), the effective lattice parameter, a, of a binary alloy is
where
where K is the effective bulk modulus and κ is the number of atoms per unit cell used to define the atomic volume = where a1 denotes the lattice parameter of the solvent, and κ is equal to 1 for the simple cubic (SC), 2 for the body-centered cubic (BCC), 4 for the face-centered cubic (FCC), 6 for the hexagonal close-packed (HCP), and 8 for the diamond-cubic lattice (DCL) structure. The parameter for cubic lattices, and for the ideal hexagonal close-packed lattice. Lubarda [11] suggested performing calculations of the effective lattice parameter of a binary alloy in two stages based on micromechanics. First, assume that a1 is the lattice constant of the solvent and a2 is the lattice constant of the solute. In this case, the effective lattice parameter becomes:
where
and
The terminal solid solution at the other end of the phase diagram can be treated by reversing the role of two materials (a2 is the lattice constant of the solvent and a1 is the lattice constant of the solute). Thus, Equation (10) is replaced with
where
and
In that case, Equation (15) becomes
where
and
To use Equations (12) and (18), one must calculate the effective shear (μ) and bulk (K) moduli. Lubarda [11] used Hill’s self-consistent method, as presented by Nemat-Nasser and Hori, [13], which gives the following system of equations for the effective shear and bulk moduli:
and the atomic volume for the alloys can be calculated as
where = 1 + is written by Equation (11).
However, if Equation (22) has a reasonable solution in both terminal cases, x = 0, K = K1 and x = 1, K = K2, Equation (21) has negative solutions in both terminal cases:
In the present calculations we use the Voigt-Reuss-Hill approximation [14] to calculate the effective shear modulus, μVRH(x):
Equations (22) and (23) are solved self-consistently. For a special case of the small atomic volume misfit, Lubarda [11] assumed:
which allows rewriting Equation (23):
Lubarda wrote this expression in a slightly different form:
emphasizing that in the case of ===, which, according to Equations (3) and (11), means if K = K2, Zen’s mixture rule of additive atomic volumes of the solute and solvent will be fulfilled.
In this paper, several additional assumptions have been made to achieve a continuous solution for the alloy atomic volume within the whole composition range. As pointed out above, see Equations (10) and (15), Lubarda assumed that calculations should be performed for two opposite terminal solid solutions located at the ends of the binary phase diagram. In that case the calculated lattice constants typically have a discontinuity in the middle, at the equiatomic composition. To avoid this problem, we redefine (symmetrize) the coefficient γ1, Equation (3), as well as assuming that the effective coefficient, γ, defined by Equation (11), should be recalculated at each alloy composition, x, and be expressed through the effective bulk, K(x), and shear, μ(x), moduli calculated by Equations (22) and (24):
In addition, we rewrote Equation (26) for the two terminal solid solutions:
Additionally, the atomic volume of the alloy is defined as a function of composition, x,
Lubarda [11] used the apparent Wigner-Seitz radius, Equation (9), in calculations of the lattice parameters of the alloy. In our calculations we introduce two approximations for the atomic volumes of the alloy components which, in turn, are used as input parameters in Equation (32).
- 1.
- Continuum approximation. In cases where the field of the disordered solid solution spans throughout the whole composition range, we assume that the atomic volume of the solvent (Ω1(x)) changes linearly with composition from the real value, Ω1, x = 0, to its apparent value, , in the pure solute, x = 1.
Similarly, the atomic volume of the solute, Ω2(x), changes linearly with composition, from its apparent value in the pure solvent,, x = 0, to the real value, Ω2, x = 1.
- 2.
- Terminal approximation. In cases of limited mutual solubility of the alloy components, it is reasonable to consider the atomic volume of the solvent to be constant and equal to its real value, Ω1(2),
The atomic volume of the solute, Ω1(2), undergoes a linear change with composition, x,
The experimental (real) atomic volumes of selected elements at the room temperature, together with the bulk and shear moduli, are listed in Table 1. The atomic volumes correspond to the Wigner-Seitz radii reported in table one of Ref. [11], and the elastic constants are the same as in table three of Ref. [11]. In addition to the binary alloys studied in Ref. [11], we present data for Mg-Cd and Fe-Cr solid solutions. The volume size factors, ω1 and ω2, for the alloy systems under consideration are reproduced in Table 2. The values of the real and apparent atomic volumes are listed in Table 3 (table four of Ref. [11]).

Table 1.
The experimental atomic volumes and elastic constants for polycrystalline metals [11].
Table 2.
The volume size factor data: ω1 is the volume size factor when the first element of the alloy system is the solute, and ω2 when the second element is the solute [11].
Table 3.
The real (experimental) atomic volumes (Ω1 and Ω2) and apparent atomic volumes ( and ) for the selected binary alloys.
We introduced continuum and terminal approximations because, according to [11], the apparent Wigner-Seitz radius of the solvent atom was assumed to be constant, Equation (9). This is a reasonable assumption for the limited solubility of the solute component in the solvent matrix. However, in the case of continuous solid solutions, especially in the region around the vicinity of the equiatomic composition, the definitions “solvent” and “solute” are meaningless. Thus, we introduce the continuum approximation, Equations (33) and (34), which ensures continuity of the atomic volume of the alloy within the whole compositional range. In the case of the limited solubility of the alloy components, the terminal approximation, it is reasonable to consider the compositional change of the atomic volume of the solute only, Equation (36), assuming that the atomic volume of the solvent does not undergo a significant change with the alloy composition, which validates Equation (35).
3. Results
In this section, we report calculations of the atomic volume as a function of concentration for 22 binary alloy systems chosen because of the availability of experimental data. All calculations and data are at room temperature. Both continuum and terminal approximations are applied.
3.1. Al-Ag
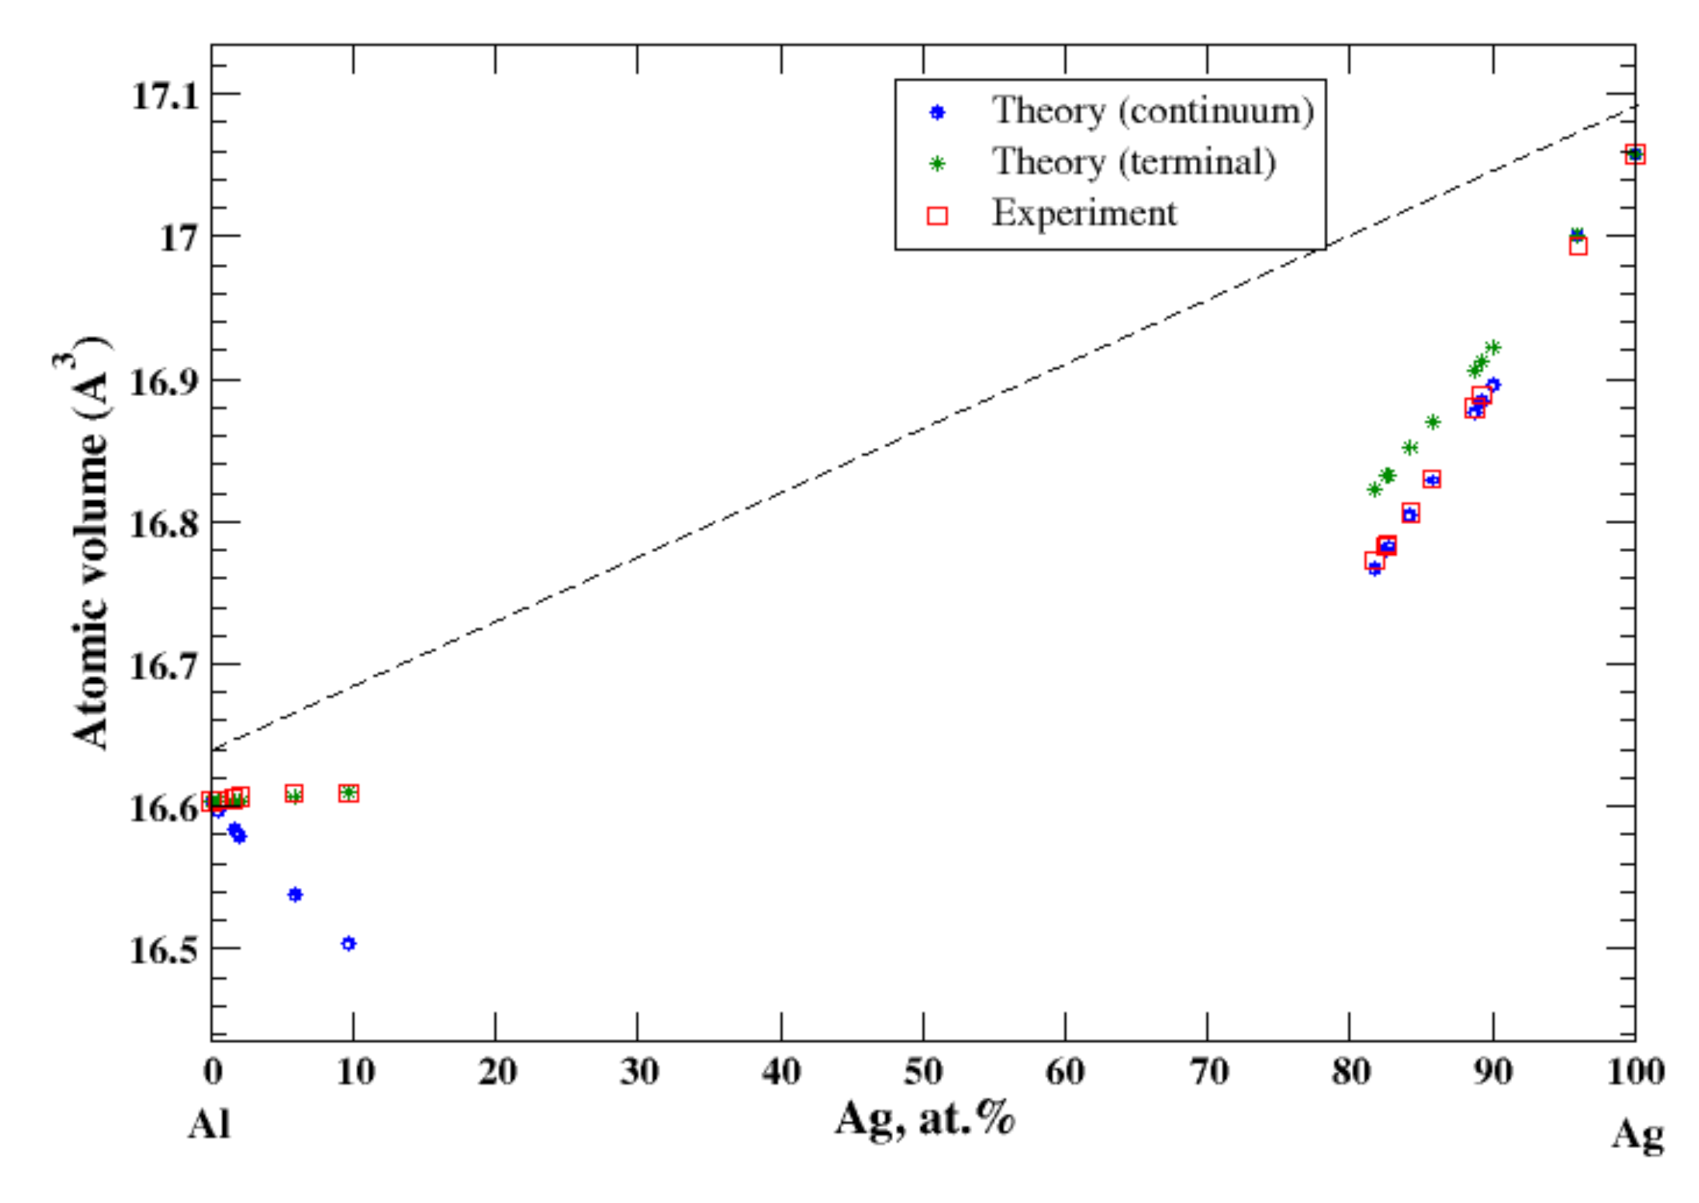
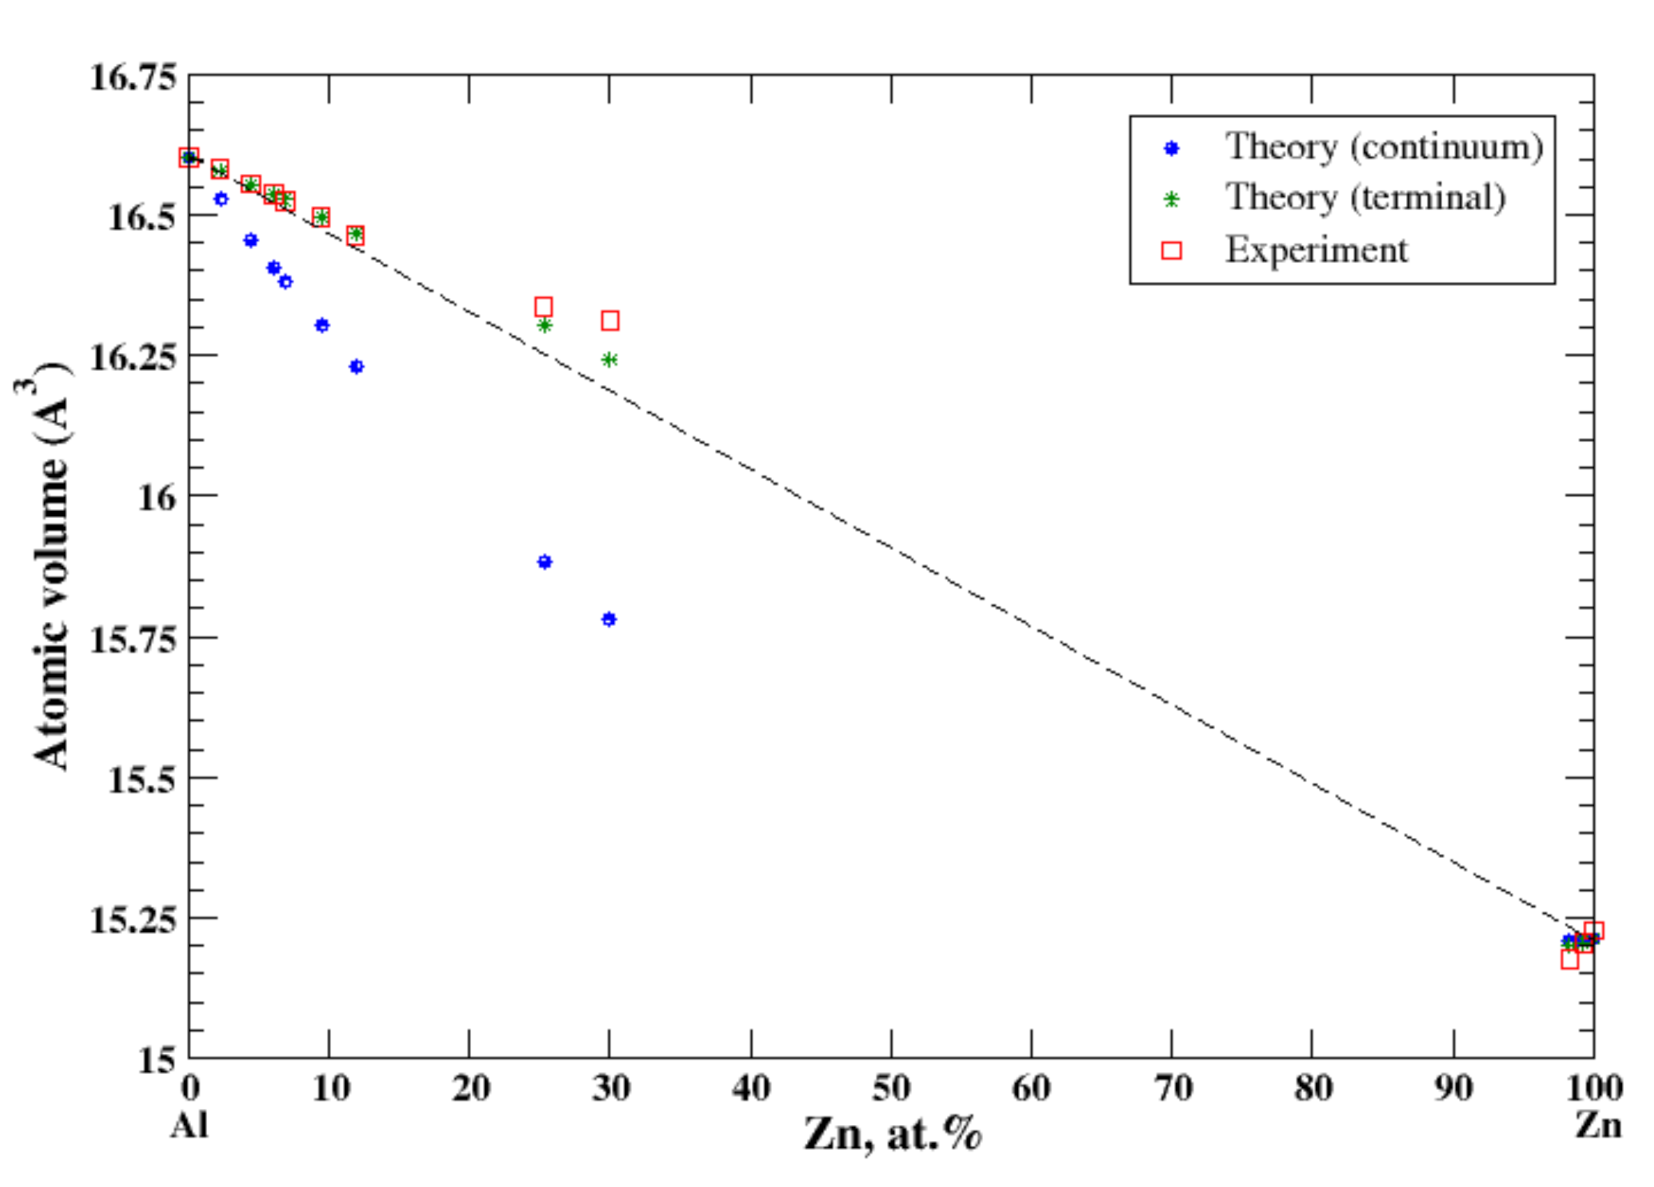
According to Refs. [11,15], the maximum solubility of silver in aluminum is about 20 at.% at the eutectic temperature (567 °C). The lattice parameter of aluminum-based solid solution remains practically unchanged up to 10 at.% Ag. The maximum solubility of aluminum in silver is about 20 at.% and occurs over a wider range of temperatures (450–610 °C) [11,15]. In the terminal approximation, the calculated atomic volume of Al-based solid solution is in good agreement with experimental data [16] although the continuum approximation significantly underestimates the atomic volume, Figure 1. For Ag-based solution, both continuum and terminal approximations produce a significant negative deviation from Zen’s law which is in an accord with experimental observation [16]; however, in this case, the atomic volume calculated in the continuum approximation almost exactly matches the experimental results, but the terminal approximation slightly overestimates the atomic volume, Figure 1. The significant negative deviation from Zen’s law for Ag-based solid solution correlates with the negative heat of mixing observed in disordered Al-Ag alloys [17].
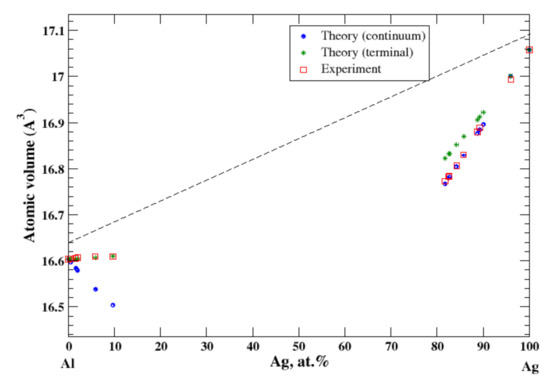
Figure 1.
Atomic volume vs. concentration for Al-Ag alloy system. The experimental data are from Ref. [16] (p. 261 and p. 351).
3.2. Al-Cu
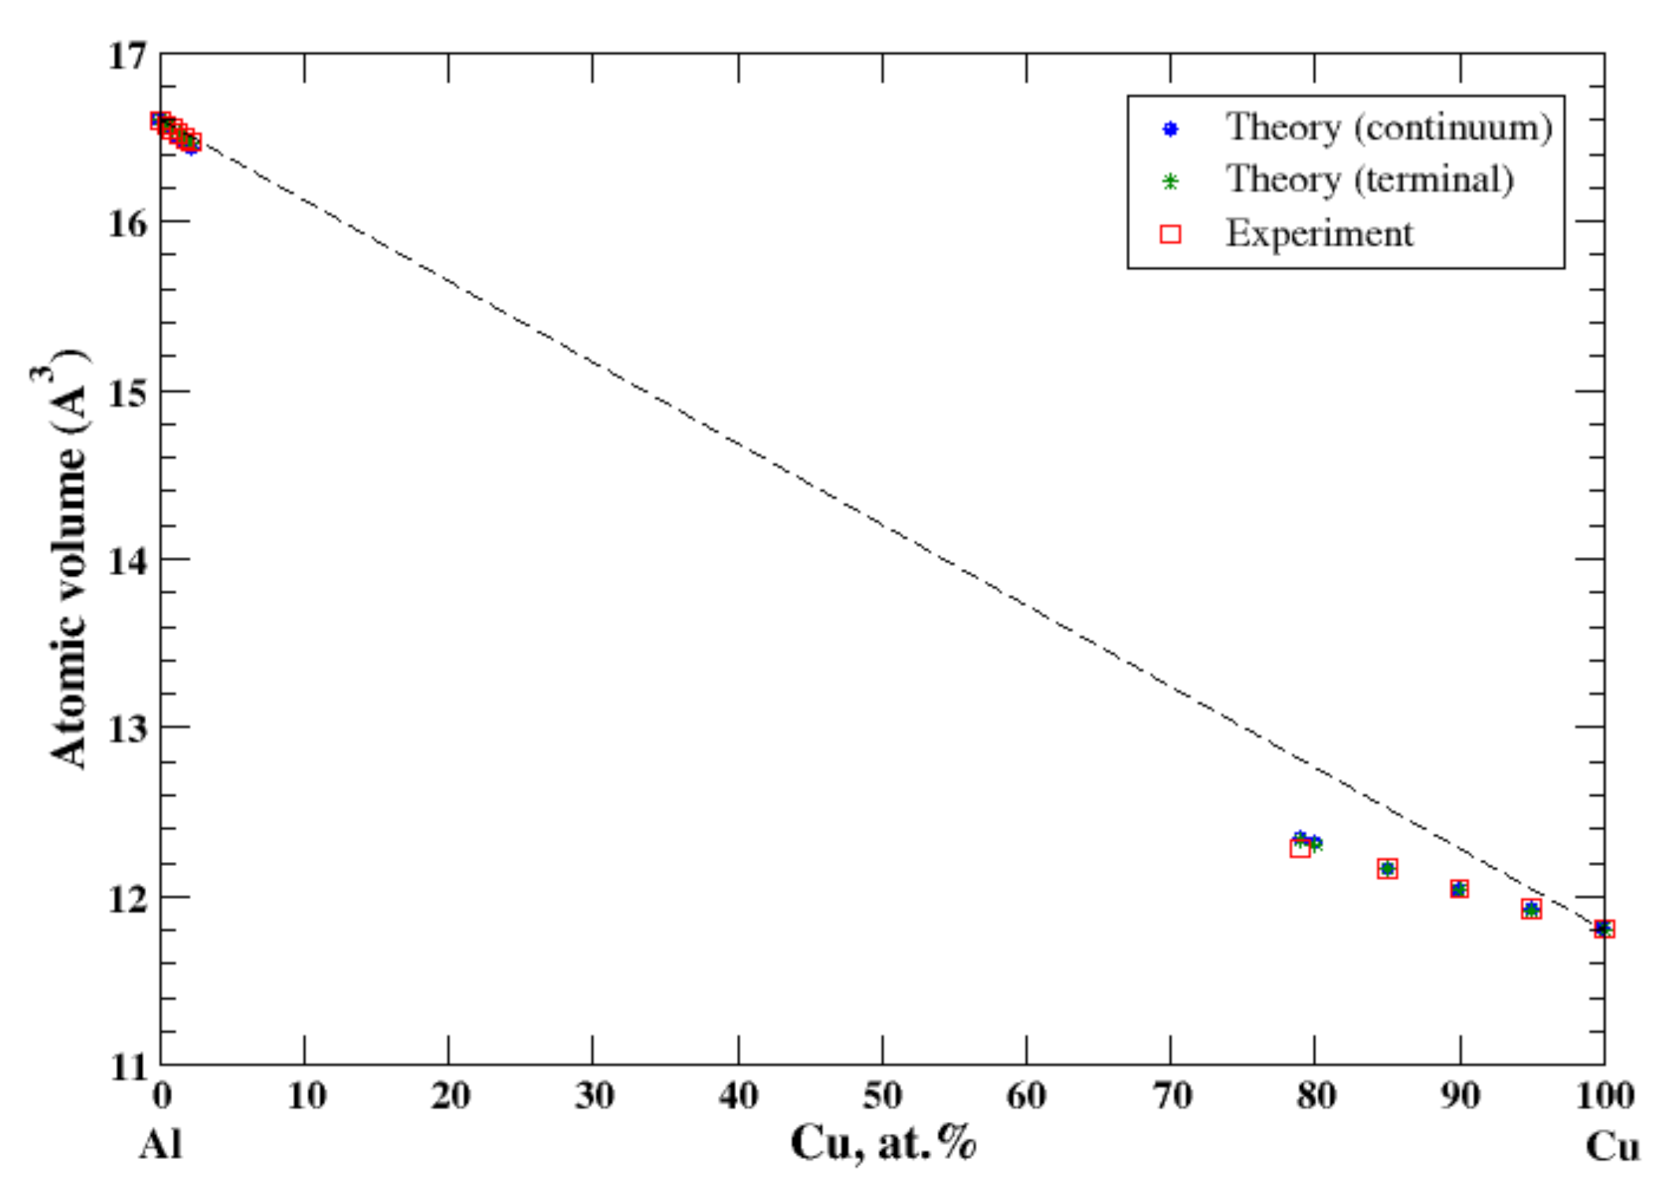
There is a very limited solubility (~2.5 at.%, at 550 °C) of copper in aluminum [11,18]. The maximum solubility of aluminum in copper is about 20 at.% and occurs over a wide range of temperatures (360–567 °C) [11,18]. The good agreement between the calculations (continuum and terminal approximations) occurs at the ends of the concentration range, Figure 2. However, contrary to results of calculation of the lattice parameter of the FCC Al-Cu solid solutions reported by Lubarda [11], which show a jump in the lattice parameter at the equiatomic composition, the continuum approximation eliminates this kind of jump of the atomic volume. As in the case of Al-Ag solid solutions, the negative deviation from Zen’s law for Cu-based solid solution correlates with the negative heat of mixing observed in disordered Al-Cu alloys [17].
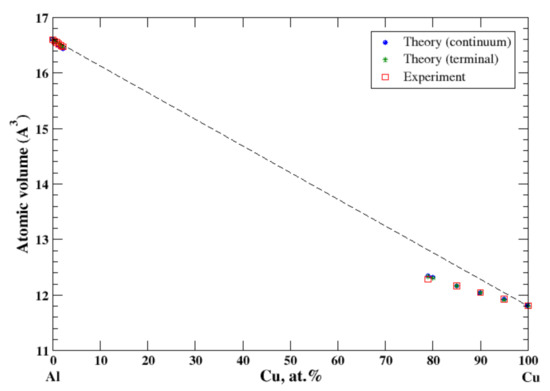
Figure 2.
Atomic volume vs. concentration for Al-Cu alloy system. The experimental data are from Ref. [16] (p. 328 and p. 331).
3.3. Al-Mg
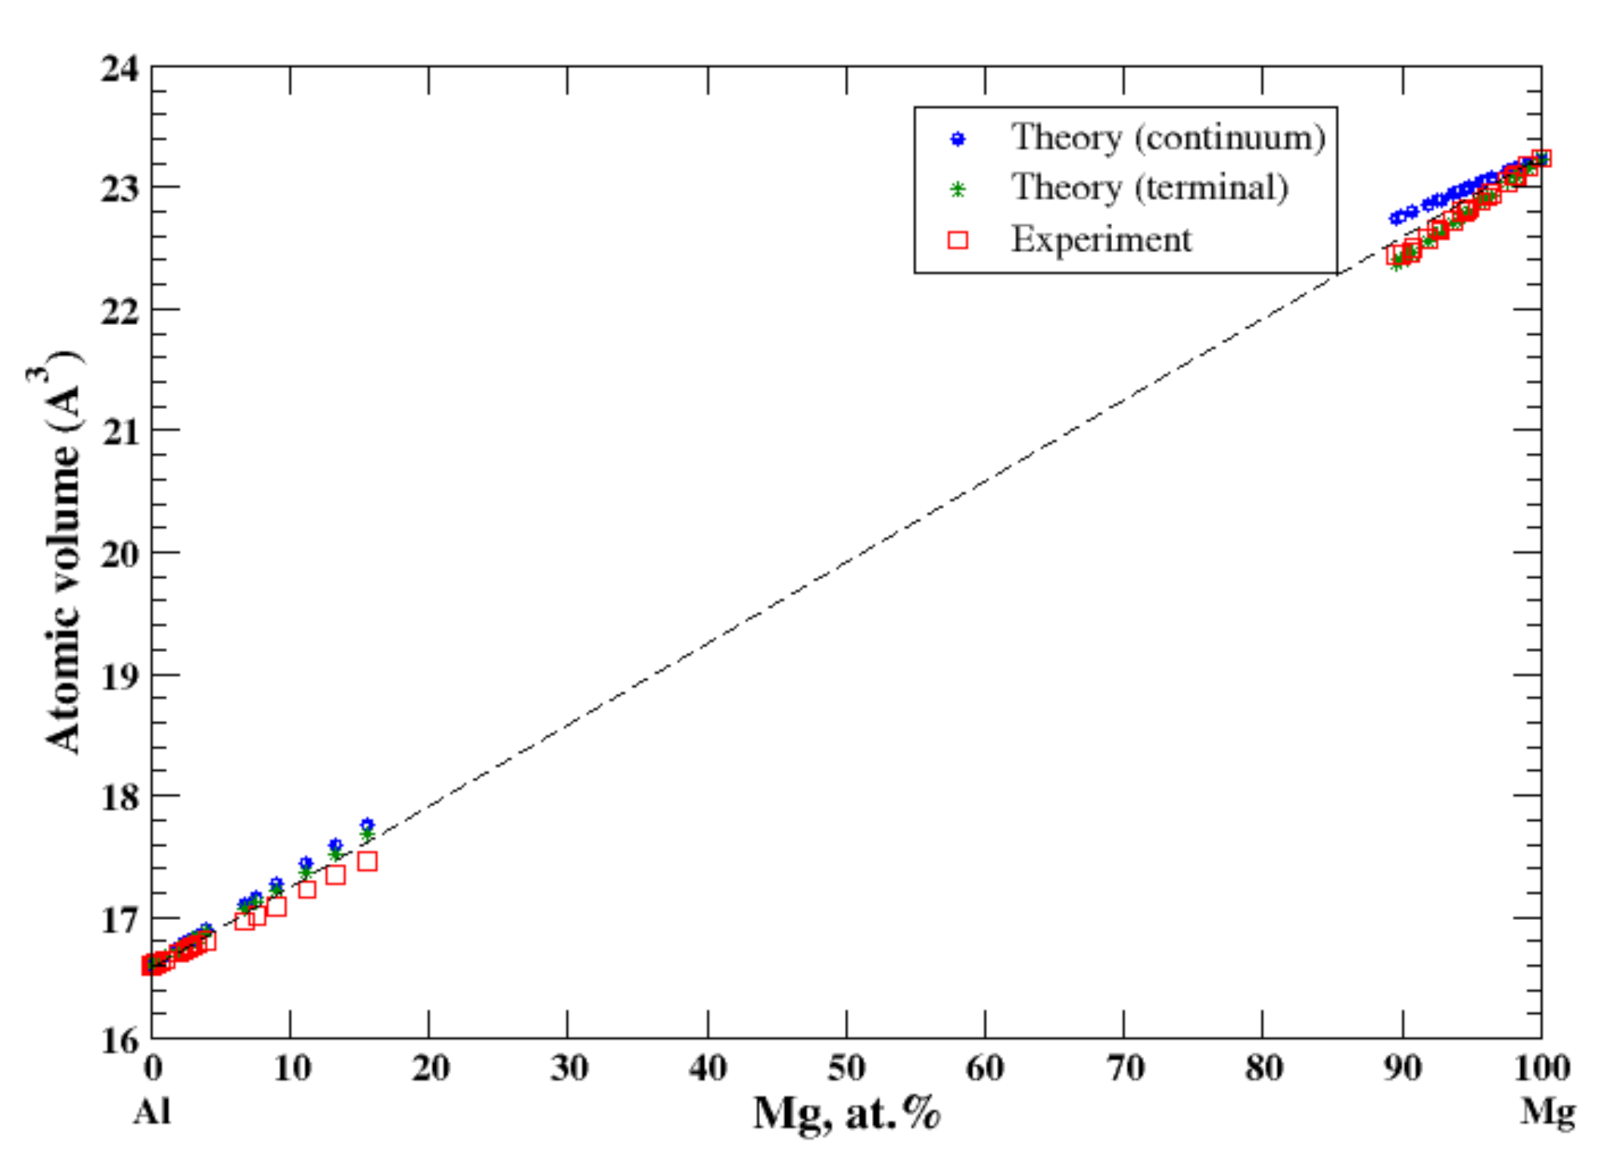
According to Refs. [11,19], the maximum solubility of magnesium in aluminum is about 18 at.% at 450 °C, and that of aluminum in magnesium is about 12 at.% at 437 °C. According to Lubarda [11], the lattice spacing of Al-based alloys increases by introduction of larger Mg atoms and the lattice spacing of Mg-based alloys decreases by introduction of smaller Al atoms. Superposition of these results produces a positive deviation from Vegard’s law for Al-based alloys and a negative deviation from Vegard’s law for Mg-based alloys, which results in a significant jump of the lattice parameter at the equiatomic composition [11]. However, it is inappropriate to talk about the lattice parameter for the system formed by the FCC metal, Al, with a single lattice parameter, a, the lattice constant, and the HCP metal, Mg, with two parameters, the lattice constant, a and c/a ratio. In this case, description of the atomic volume behavior as a function of composition (the deviation from Zen’s law) is more appropriate because it excludes ambiguity imposed by the different crystal structure of the alloy components. The results of calculations are shown in Figure 3. In the terminal approximation, the calculated atomic volume of Al-based solid solution shows the slight positive deviation from Zen’s law while the slightly negative deviation from Zen’s law is found experimentally [16]. In the terminal approximation, the calculated atomic volume of Mg-based solid solution is in excellent agreement with experimental data (the negative deviation from Zen’s law). The continuum approximation shows the positive deviation from Zen’s law for both Al- and Mg-based solid solutions.
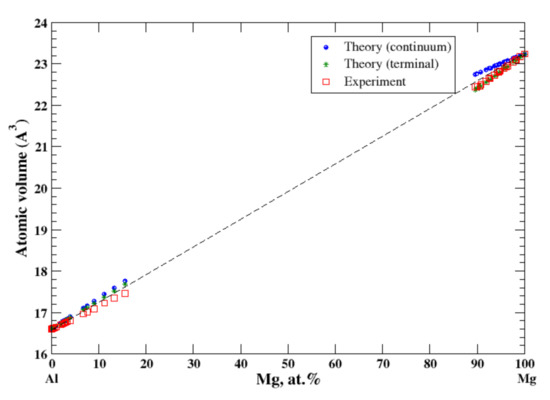
Figure 3.
Atomic volume vs. concentration for Al-Mg alloy system. The experimental data are from Ref. [16] (p. 367 and p. 728).
3.4. Al-Mn
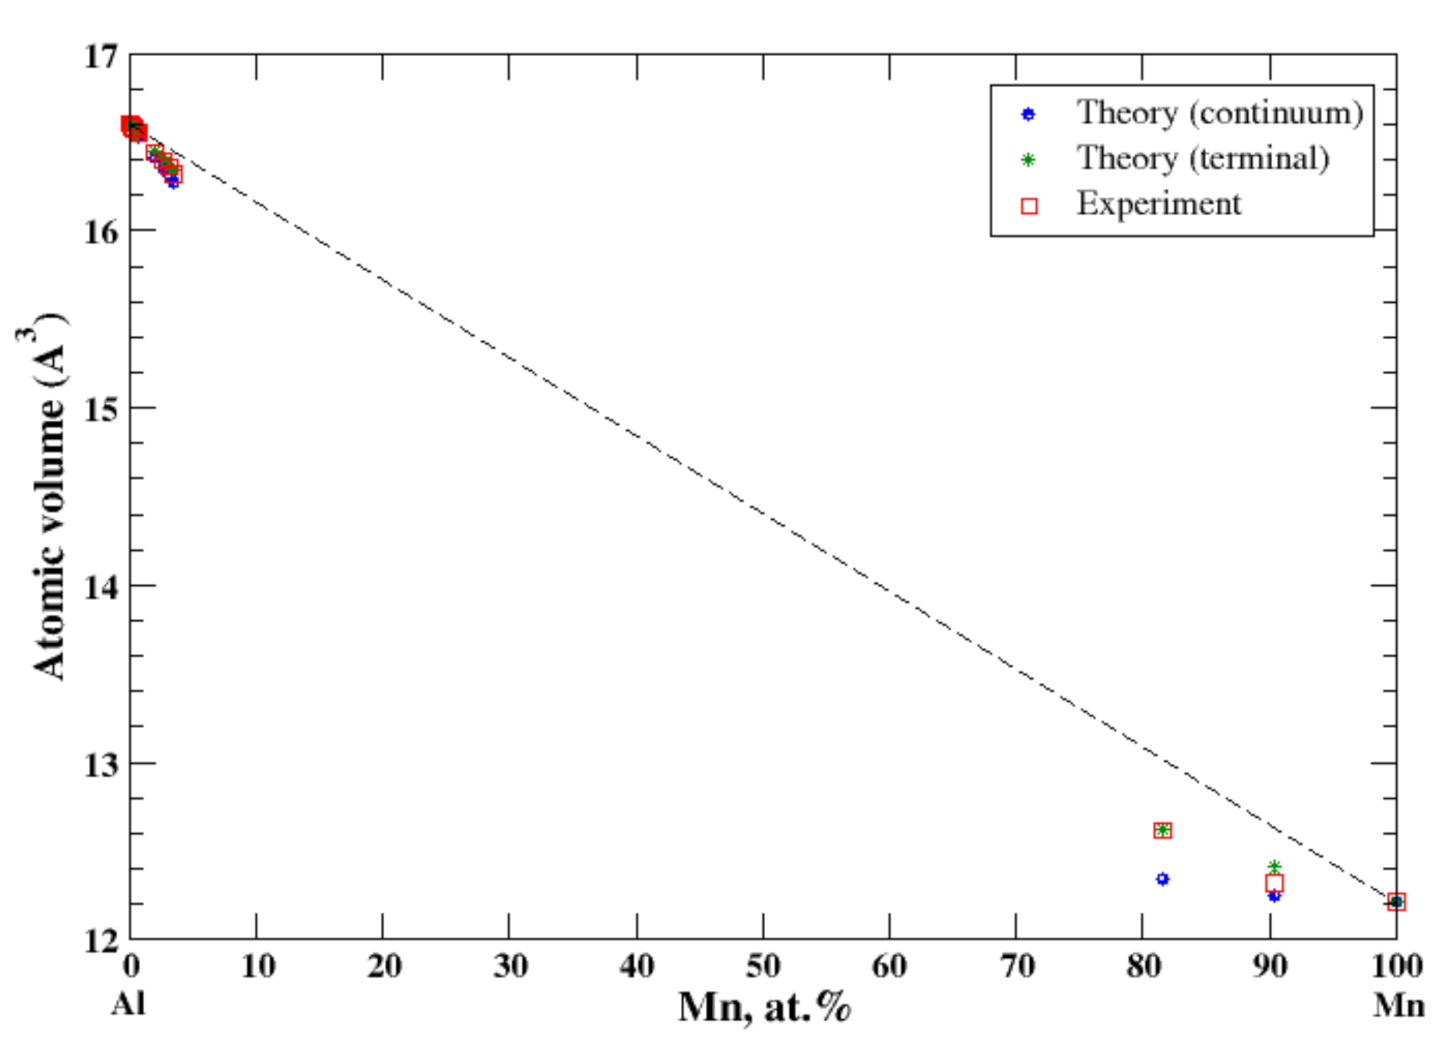
There is a very limited solubility (~3.5 at.%, at 658 °C) of manganese in aluminum [16,20]. The lattice parameters for the quenched β-Mn-based Al-Mn alloys have been reported at 9.65 at.% and 18.4 at.% Al [16]. Good agreement between the calculated (the terminal approximation) atomic volume and the experimental data occurs at both ends of the concentration range, Figure 4. The continuum approximation shows the negative deviation from Zen’s law for both Al- and Mg-based solid solutions; however, only for Al-based solid solutions do both continuum and terminal approximations agree well the experimental data. For Mn-based solid solutions, the continuum approximation underestimates the calculated atomic volume. The negative deviation from Zen’s correlates with the negative heat of mixing observed in disordered Al-Mn alloys [17].
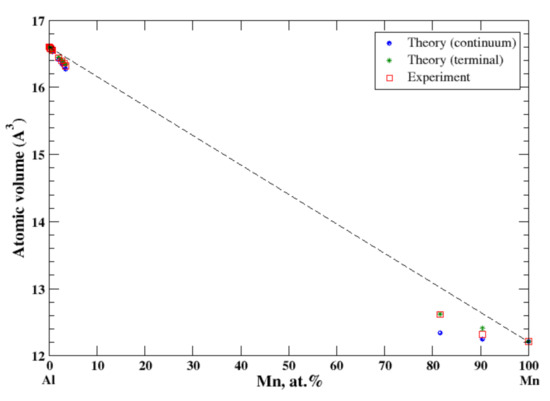
Figure 4.
Atomic volume vs. concentration for Al-Mn alloy system. The experimental data are from Ref. [16] (pp. 373–374).
3.5. Al-Ti
According to Refs. [16,21], the aluminum-based Al-Ti solid solution is very restricted. The maximum solubility of titanium in aluminum is about 0.2 at.% and is not considered in the present study. The maximum solubility of aluminum in titanium, quenched from 1200 °C, is about 42 at.% [16]. In the terminal approximation, the calculated atomic volume of Ti-based solid solutions is in fair agreement with experimental data, Figure 5, although above ~25 at.% of Al calculations overestimate the observed atomic volume. For Ti-based solid solutions the continuum approximation significantly underestimates the calculated atomic volume. The significant negative deviation from Zen’s law for Ti-based solid solutions correlates with the negative heat of mixing measures for Al-Ti solid solutions at room temperature [17].
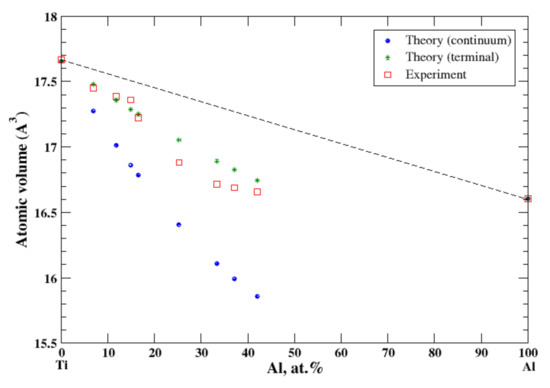
Figure 5.
Atomic volume vs. concentration for Al-Ti alloy system. The experimental data are from Ref. [16] (p. 386).
3.6. Al-Zn
According to Refs. [16,22], there is a slight solid solubility of aluminum in zinc and the extensive solubility of zinc in aluminum extending to ~65 at.% Zn at 381 °C. For Al-based Al-Zn solid solutions the lattice spacing has been measured for alloys containing up to 35 at.% Zn [16]. For Zn-based Al-Zn solid solutions the lattice spacing has been measured for alloys containing up to ~1.7 at.% of Al [16]. In the terminal approximation, the calculated atomic volume of Al-Zn solid solutions is in good agreement with experimental data, Figure 6. The positive deviation from Zen’s law is described (the terminal approximation) for Al-based Al-Zn solid solutions in a perfect accord with experimental data. In contrast, the continuum approximation shows the negative deviation from Zen’s law. For Zn-based Al-Zn solid solutions, the present calculations show a negative deviation from Zen’s law for both continuum and terminal approximations, which is in an accord with experimental data available up to ~2 at.% of Al [16]. Al and Zn form a eutectic phase diagram with the small but positive heat of formation for solid Al-Zn alloys [17]. This positive heat of formation correlates with the positive deviation from Zen’s law for the extended range of Al-based Al-Zn solid solutions.
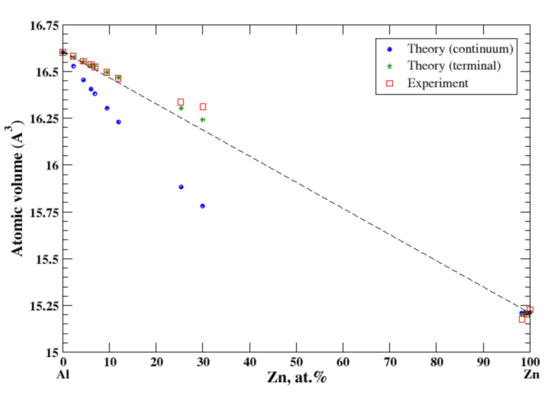
Figure 6.
Atomic volume vs. concentration for Al-Zn alloy system. The experimental data are from Ref. [16] (p. 389 and p. 886).
3.7. Ag-Cu
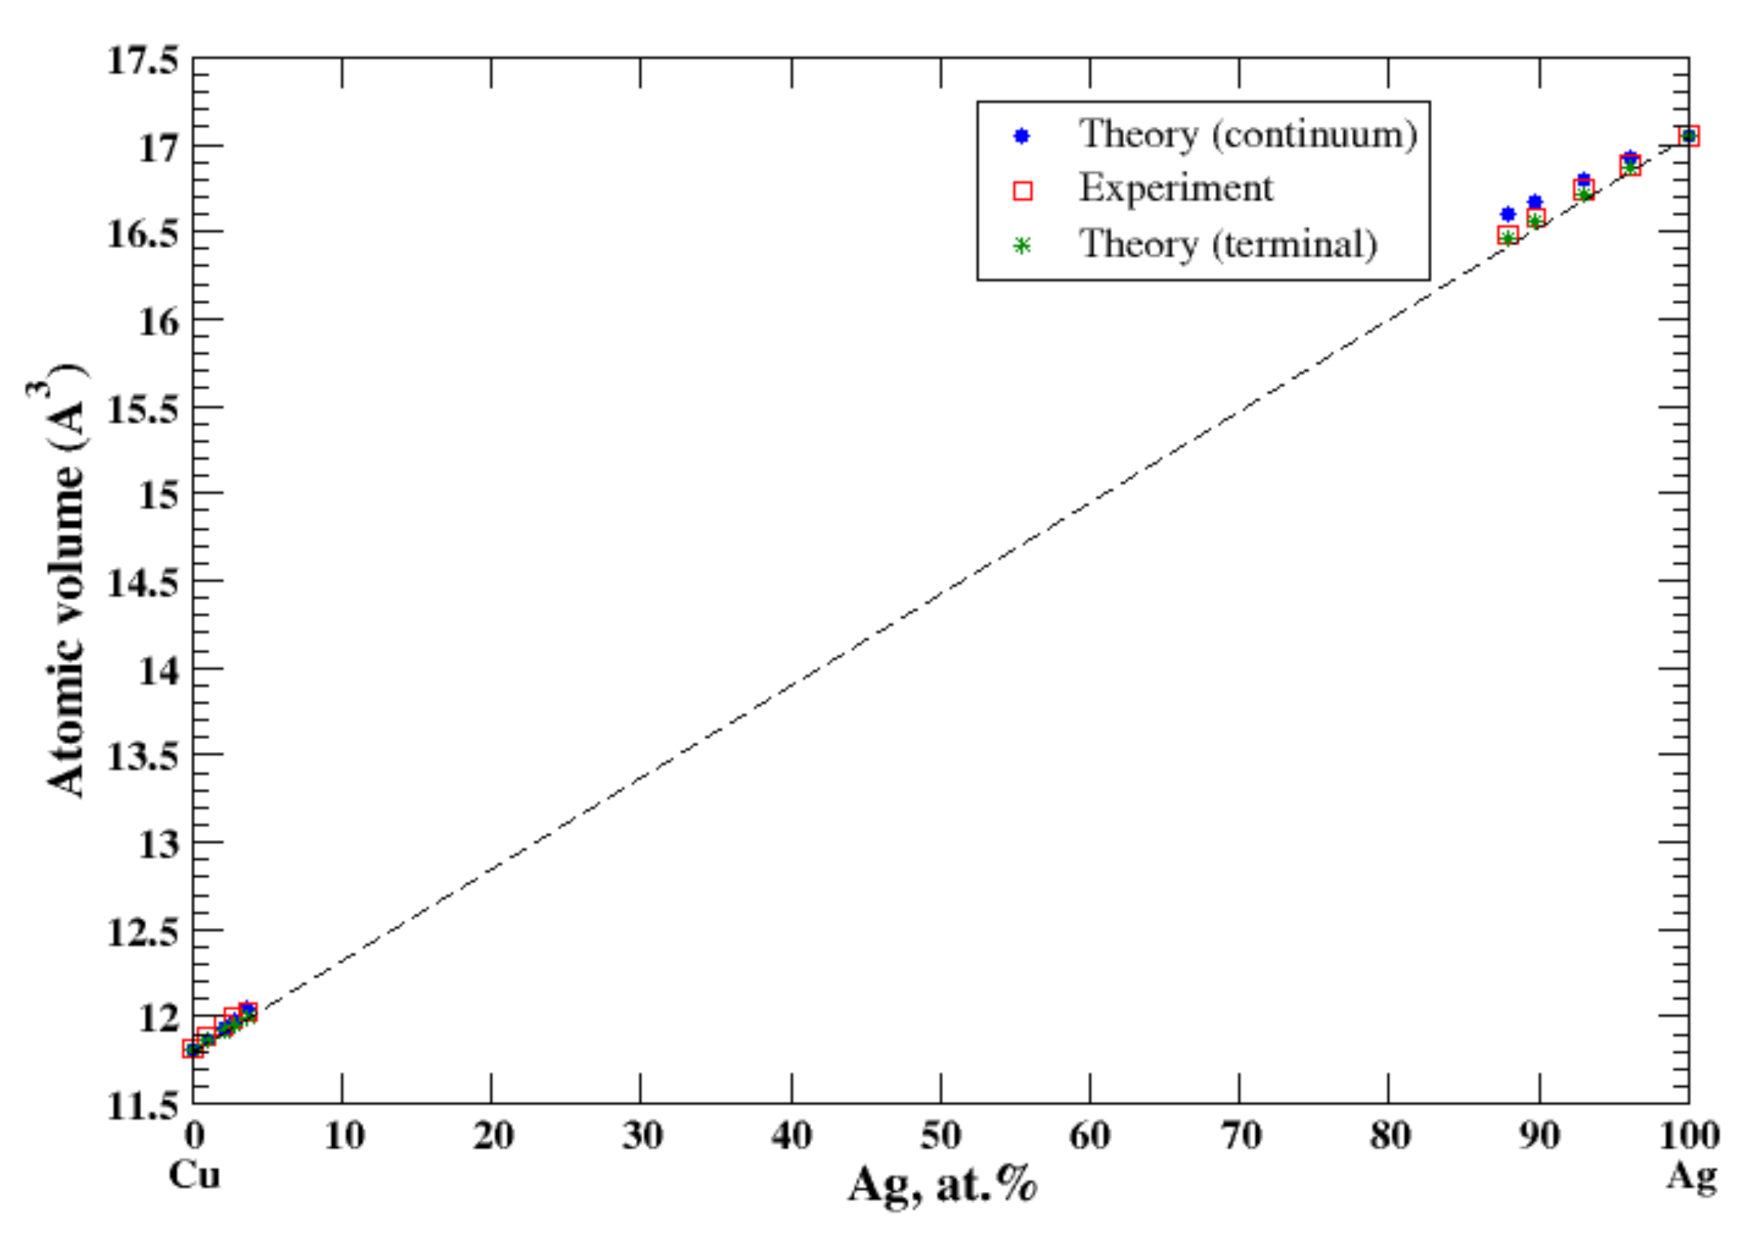
According to Refs. [16,23], Ag and Cu form the eutectic type of phase diagram with restricted terminal solid solutions. The maximum solubility of silver in copper is about 5 at.% and the maximum solubility of copper in silver is about 14 at.% at the eutectic temperature of 779 °C. For Cu-based alloys, calculations of the atomic volume, performed within both continuum and terminal approximation, give excellent agreement with experimental data measured up to 3.7 at.% of Ag at 770 °C. [16], Figure 7. For Ag-based alloys, calculations of the atomic volume, performed within the terminal approximation, give excellent agreement with experimental data measured up to 12.1 at.% of Cu at 770 °C [16], Figure 7. The continuum approximation slightly overestimates the atomic volume of Ag-based alloys. The small positive deviation from Zen’s law correlated with a small but positive heat of formation observed in Cu-Ag alloys [17].

Figure 7.
Atomic volume vs. concentration for Ag-Cu alloy system. The experimental data are from Ref. [16] (p. 279 and p. 602).
3.8. Cu-Au
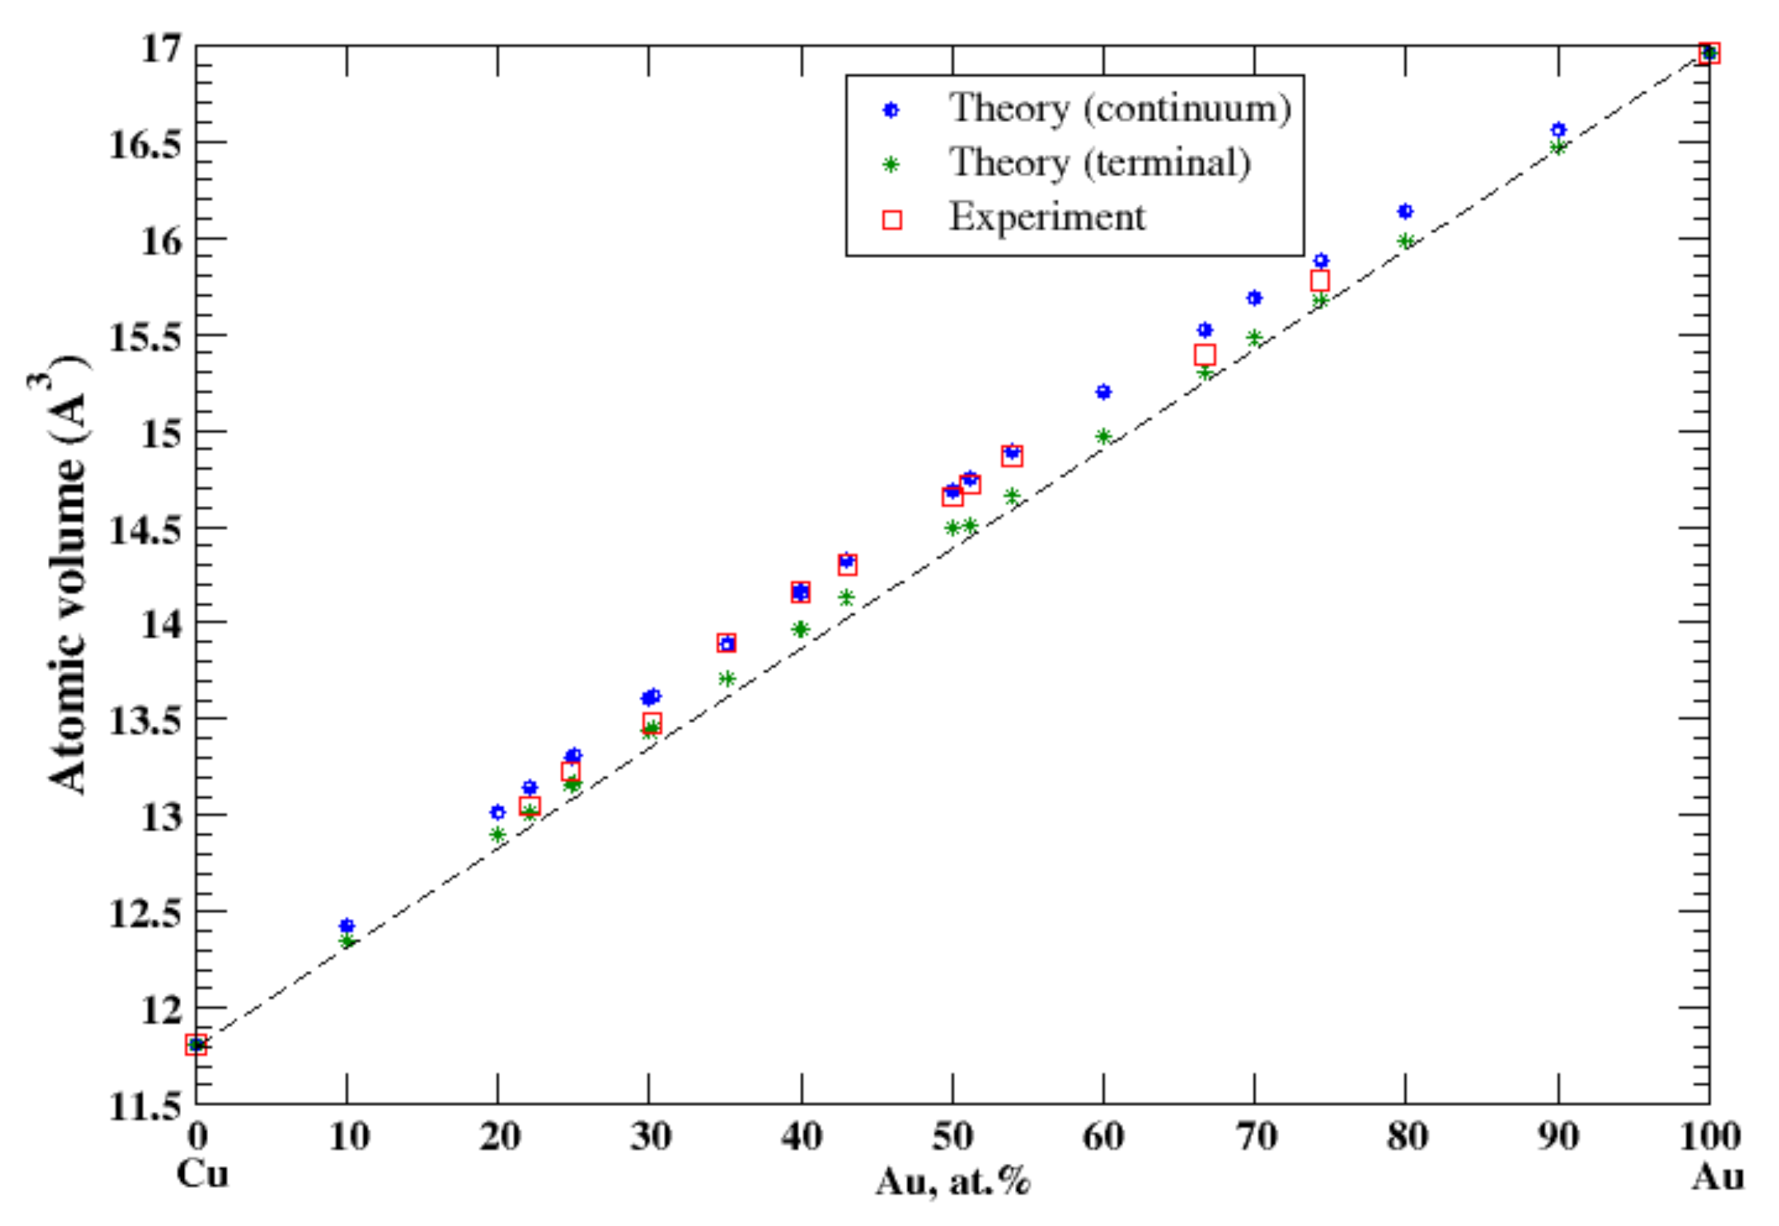
According to Refs. [16,24], copper and gold form continuous solid solutions at high temperatures. The calculated, within continuum approximation, atomic volume of Cu-Au solid solutions is in good agreement with experimental data [16], Figure 8, reproducing a positive deviation from Zen’s law. The terminal approximation also reveals the positive deviation from Zen’s law but slightly underestimates the atomic volume. The heat of formation measured at high temperatures, ~500–700 °C, of continuous solid Cu-Au solutions is negative [17] and the positive deviations from Zen’s law is stipulated exclusively by the size effect.
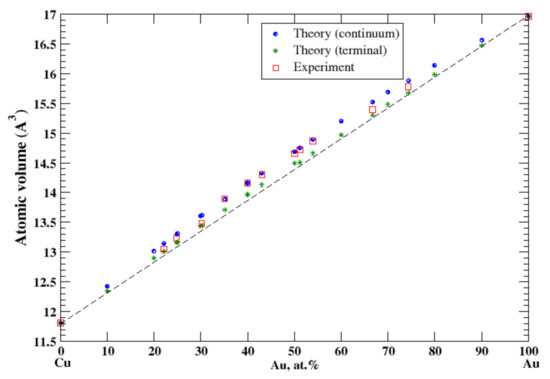
Figure 8.
Atomic volume vs. concentration for Au-Cu alloy system. The experimental data are from Ref. [16] (p. 411 and p. 601).
3.9. Cu-Fe
According to Ref. [25], the solubility limit of copper in α-iron is small, ~1.9 at.%. at eutectoid temperature 840 °C; the solubility of α-iron in copper at the same temperature is also small, 1.3 at.%. At peritectic temperature, 1090 °C, about 7.5% of copper can be dissolved in γ-iron and about 4.6 at.% of γ-iron can be dissolved in copper. The experimental data of the lattice constant for Cu-based alloys is reported up to 2.7 at.% of Fe, and for Fe-based alloys the lattice constant is reported only up to 0.66 at.% of Cu [16]. In the terminal approximation, the atomic volume reproduces experimental measurements and shows a positive deviation from Zen’s law, Figure 9. However, for Cu-based alloys, the continuum approximation overestimates the atomic volume. The very small solubility limits in Cu-Fe solid solutions correlate with a significant positive heat of formation in this system [17].
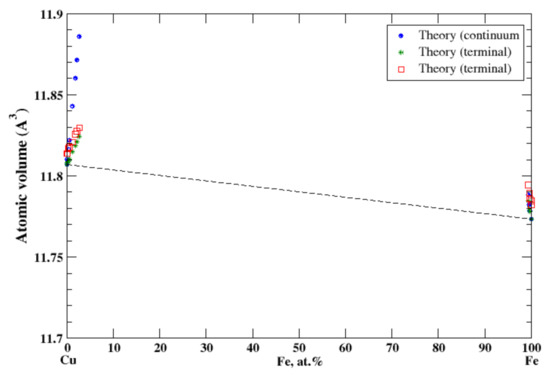
Figure 9.
Atomic volume vs. concentration for Cu-Fe alloy system. The experimental data are from Ref. [16] (p. 571 and p. 632).
3.10. Cu-Ni
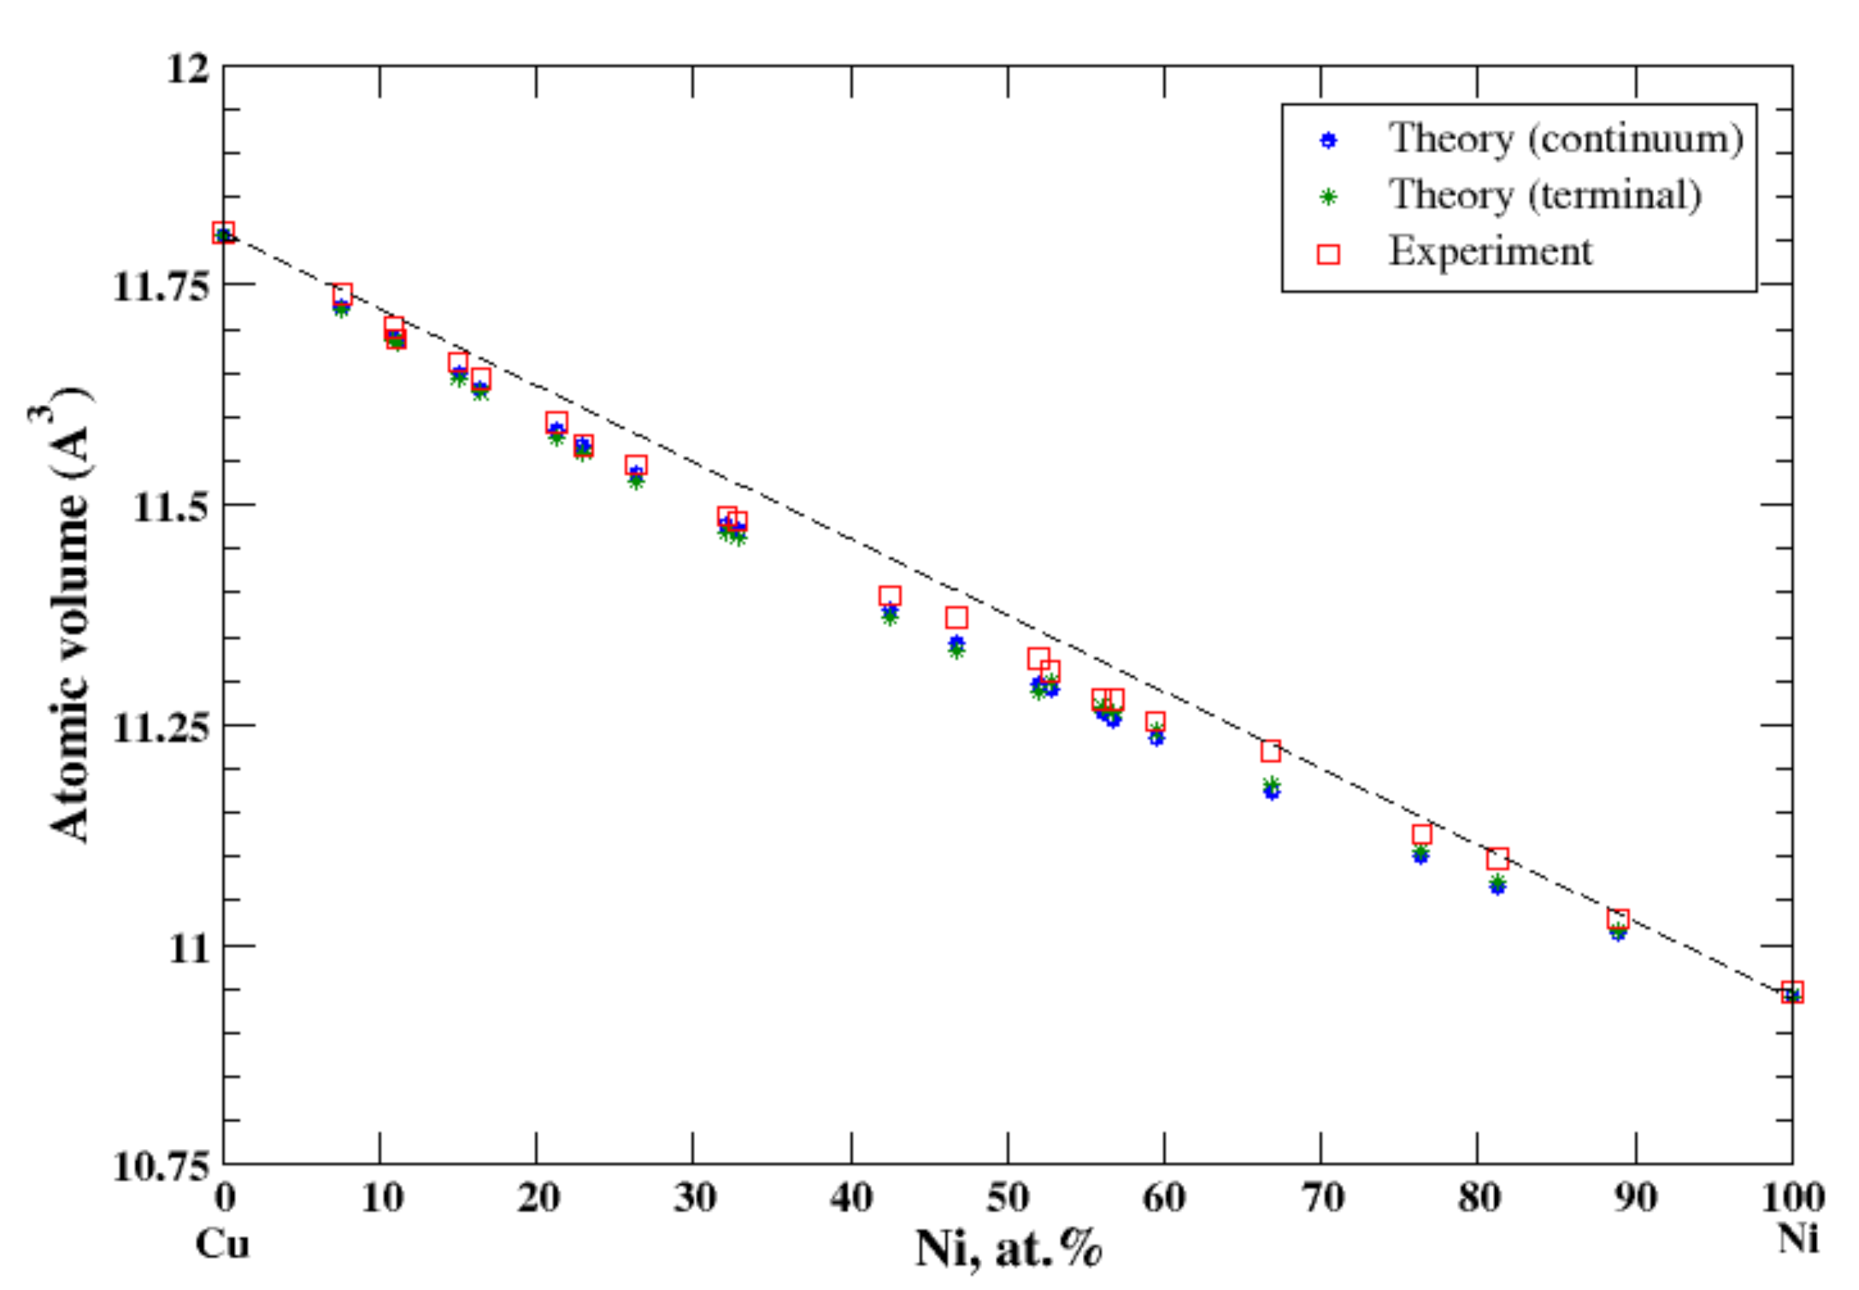
According to Refs. [16,26], copper and nickel form continuous solid solutions. In the terminal approximation, the calculated atomic volume of Cu-Ni solid solutions is in good agreement with experimental data [16], Figure 10, reproducing a slight negative deviation from Zen’s law. The heat of formation of the Cu-Ni solid solution is moderate positive within the composition range, [17], signaling that the entropy factor plays a decisive role in formation of a continuous solid solutions above 365 °C [17].
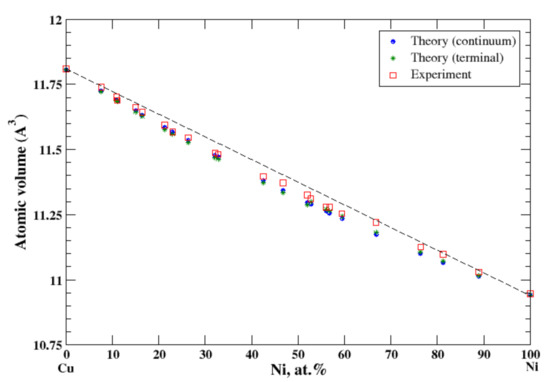
Figure 10.
Atomic volume vs. concentration for Cu-Ni alloy system. The experimental data are from Ref. [16] (p. 592 and p. 601).
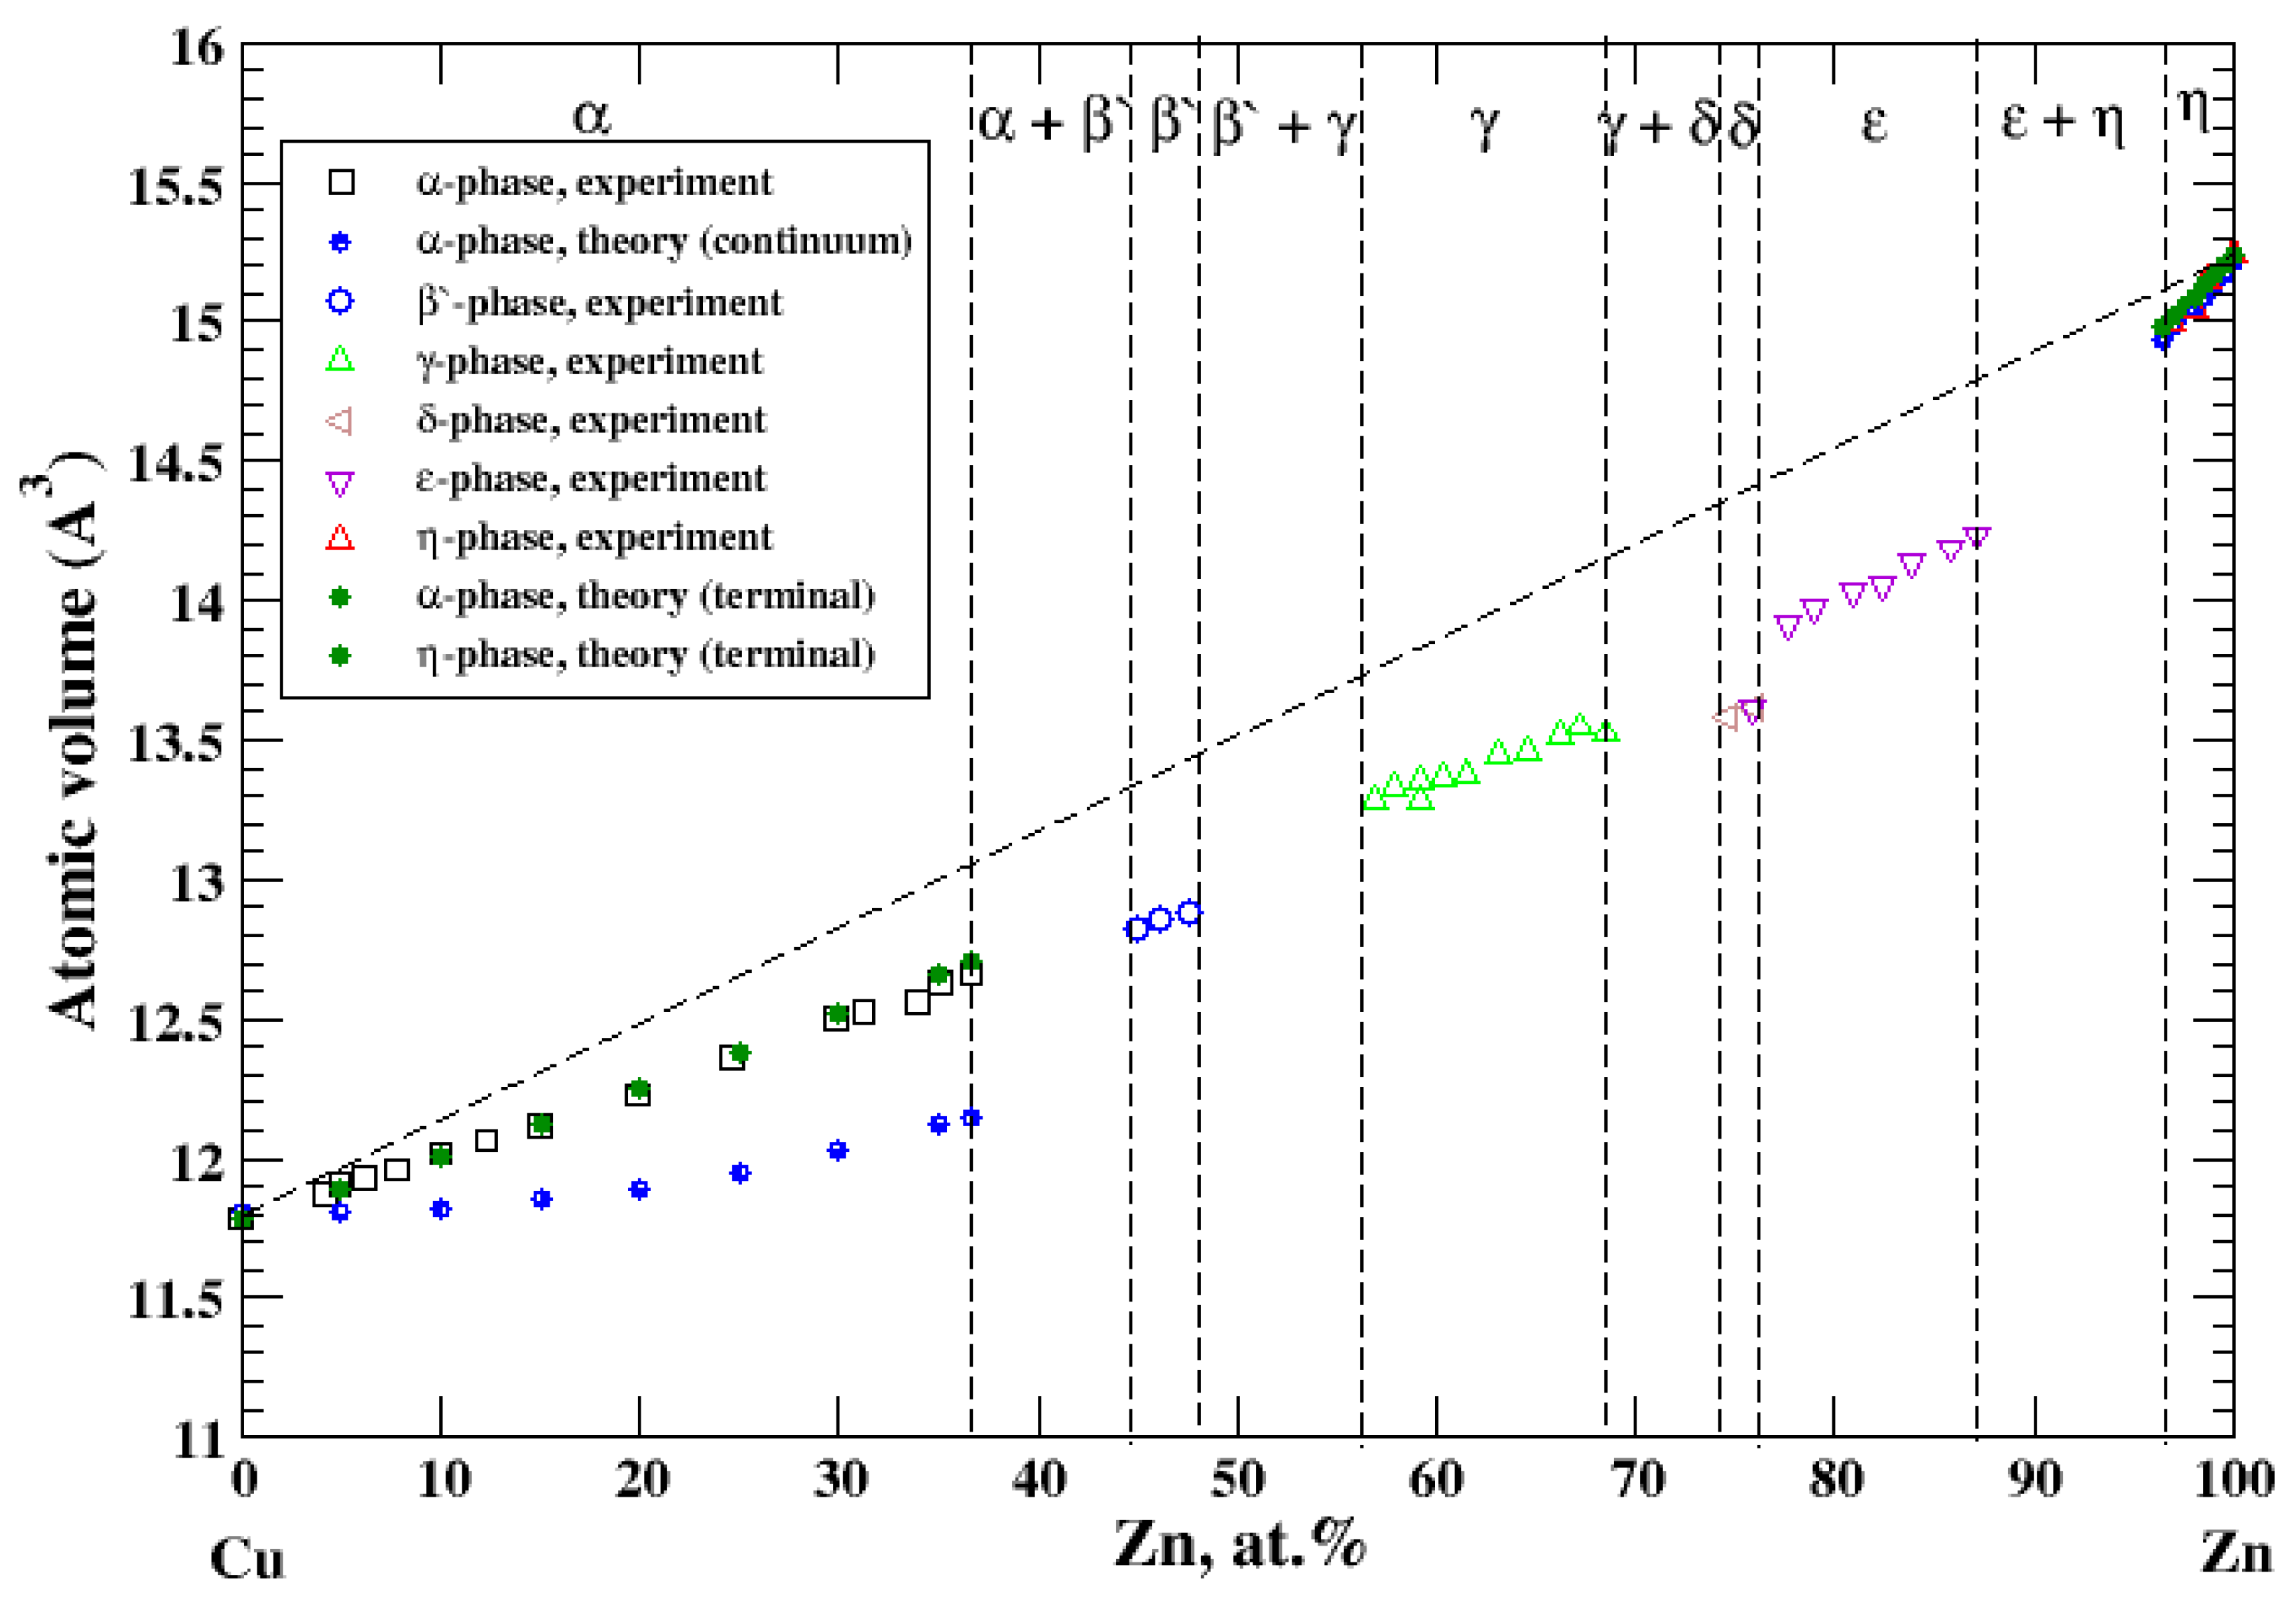
3.11. Cu-Zn
According to Refs. [16,27], the Cu-Zn system contains six intermediate phases over a composition range. Two of them, α and η, represent solid solutions based on Cu-rich and Zn-rich parts of the Cu-Zn phase diagram, respectively. The maximum solubility of Zn- in Cu-based solid solutions is about 37 at.% [16]. The maximum solubility of Cu in Zn-based solid solutions is about 3 at.% [16]. The atomic volume, calculated within the terminal approximation, for both Cu-based and Zn-based solid solutions reproduces experimental measurements and shows a significant negative deviation from Zen’s law, Figure 11, which is in accord with a significant negative heat of formation of disordered Cu-Zn alloys [17]. For Cu-based solid solutions, the continuum approximation significantly underestimates the calculated atomic volume.
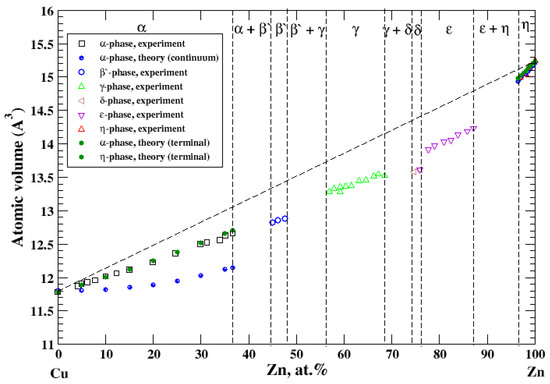
Figure 11.
Atomic volume vs. concentration for Cu-Zn alloy system. The experimental data are from Ref. [16] (p. 620 and p. 622).
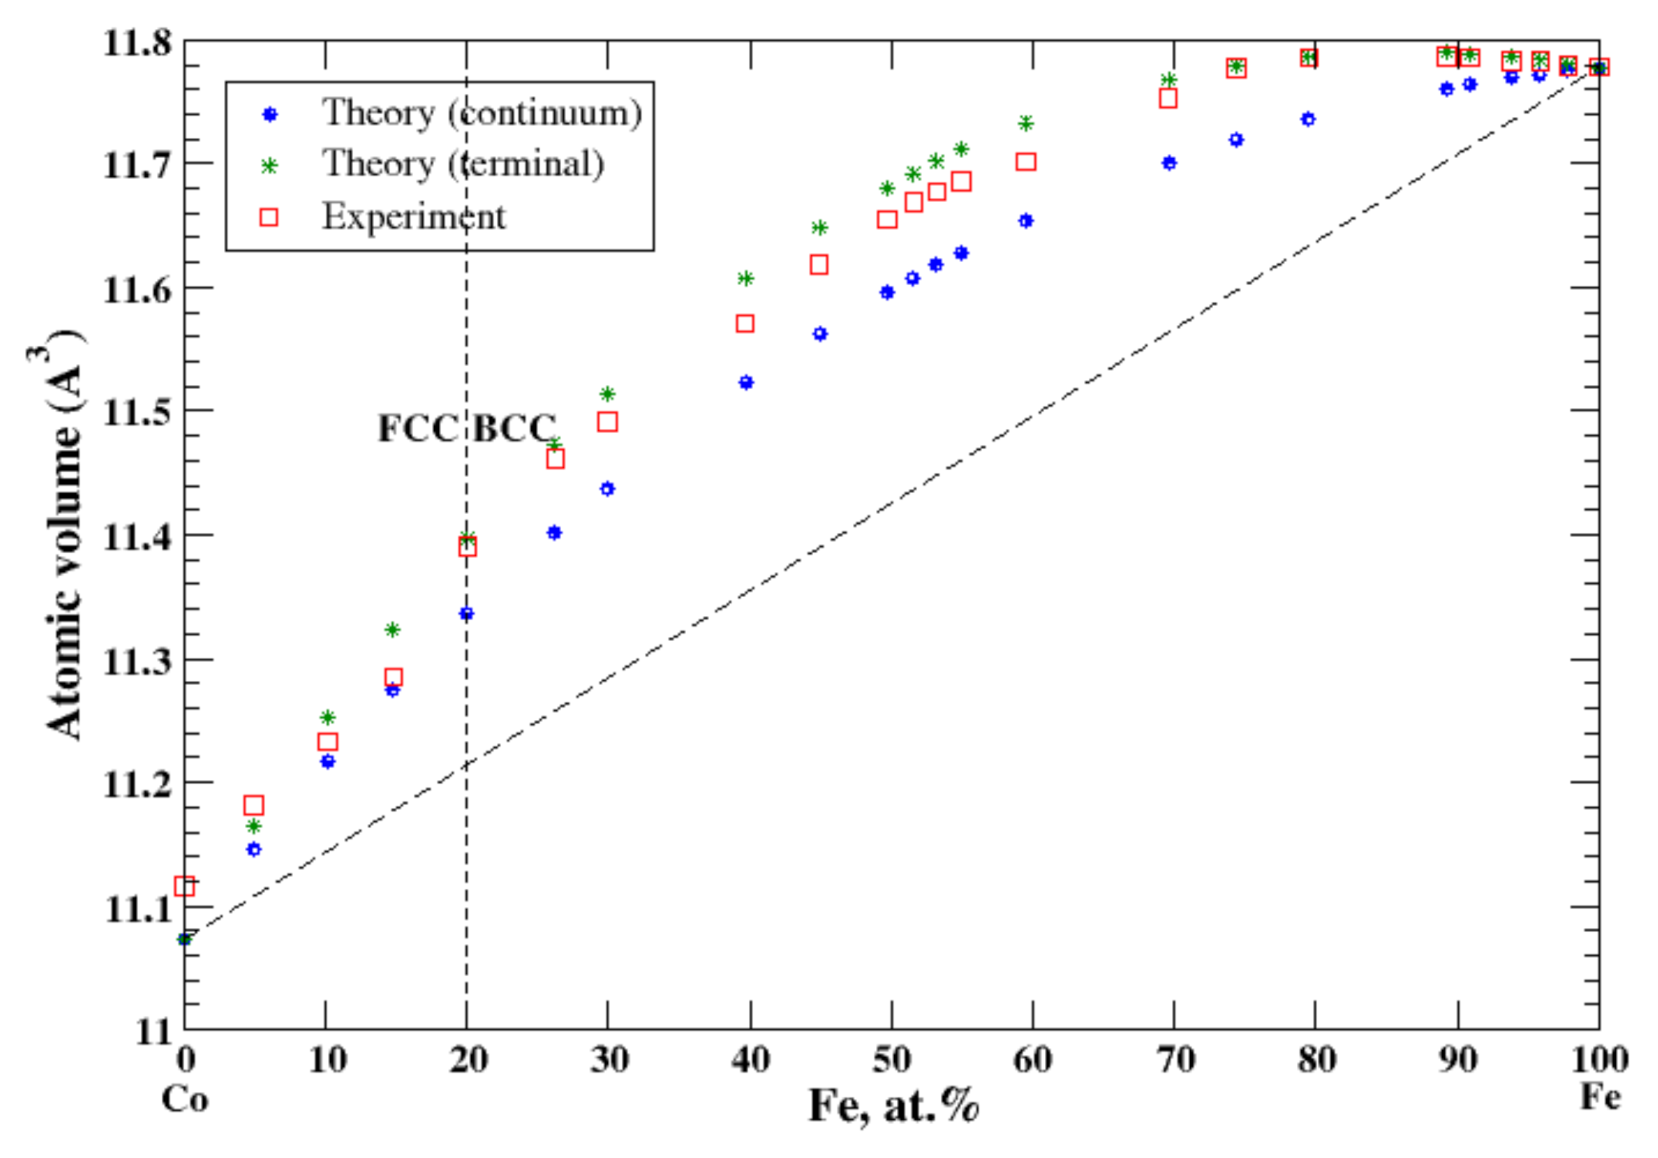
3.12. Co-Fe
According to Refs. [16,28], cobalt and iron form continuous solid solutions at high temperatures. In the terminal approximation, the calculated atomic volume of Co-Fe solid solutions is in good agreement with experimental data measured at 575 °C for FCC and BCC solid solutions [16], Figure 12, reproducing a positive deviation from Zen’s law. The continuum approximation also reveals the positive deviation from Zen’s law but underestimates the atomic volume. The heat of formation of liquid Co-Fe alloys at 1590 °C is a small negative value [17] reflecting a continuous solid solution at high temperature.
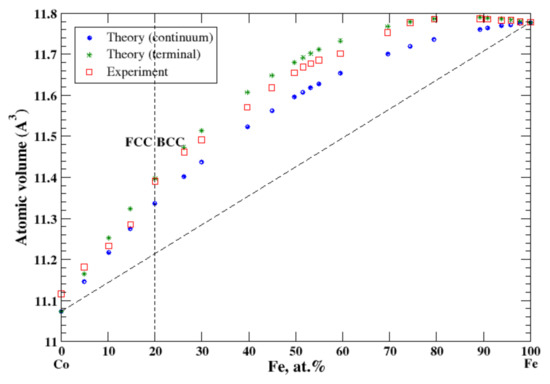
Figure 12.
Atomic volume vs. concentration for Fe-Co alloy system. The experimental data are from Ref. [16] (p. 505 and p. 634).
3.13. Fe-Cr
According to Refs. [16,29], iron and chromium form continuous solid solutions at elevated temperatures. In the terminal approximation, the calculated atomic volume of Fe-Cr solid solutions shows a strong positive deviation from Zen’s law that is in accord with experimental data up to ~12 at.% of Cr [16], Figure 13. However, between ~12 and 17 at.% of Cr the experimental atomic volume remains almost unchanged, then slightly increases between 17 and 25 at.% of Cr, then drops to its value at ~19 at.% of Cr, and then gradually increases within the remaining compositional range, [16]. Figure 13 also shows calculated, within the terminal approximation, the volume of Cr-based solid solutions in the compositional range, 30 at.% −100 at.% of Cr, which is in excellent agreement with experimental data [16] (and Zen’s law). The heat of formation of Fe-Cr solid solutions, measured at 1327 °C [17], is positive, indicating that the entropy factor is responsible for formation of a continuous solid solutions at elevated temperatures.
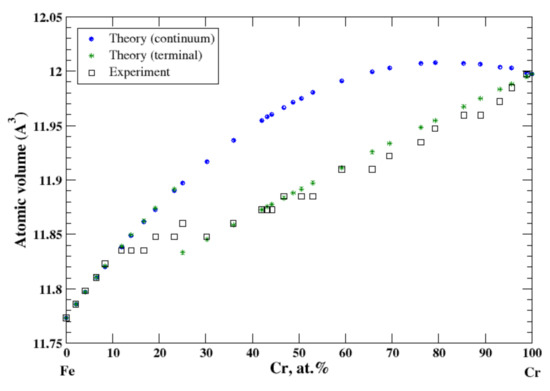
Figure 13.
Atomic volume vs. concentration for Fe-Cr alloy system. The experimental data are from Ref. [16] (p. 533 and p. 544).
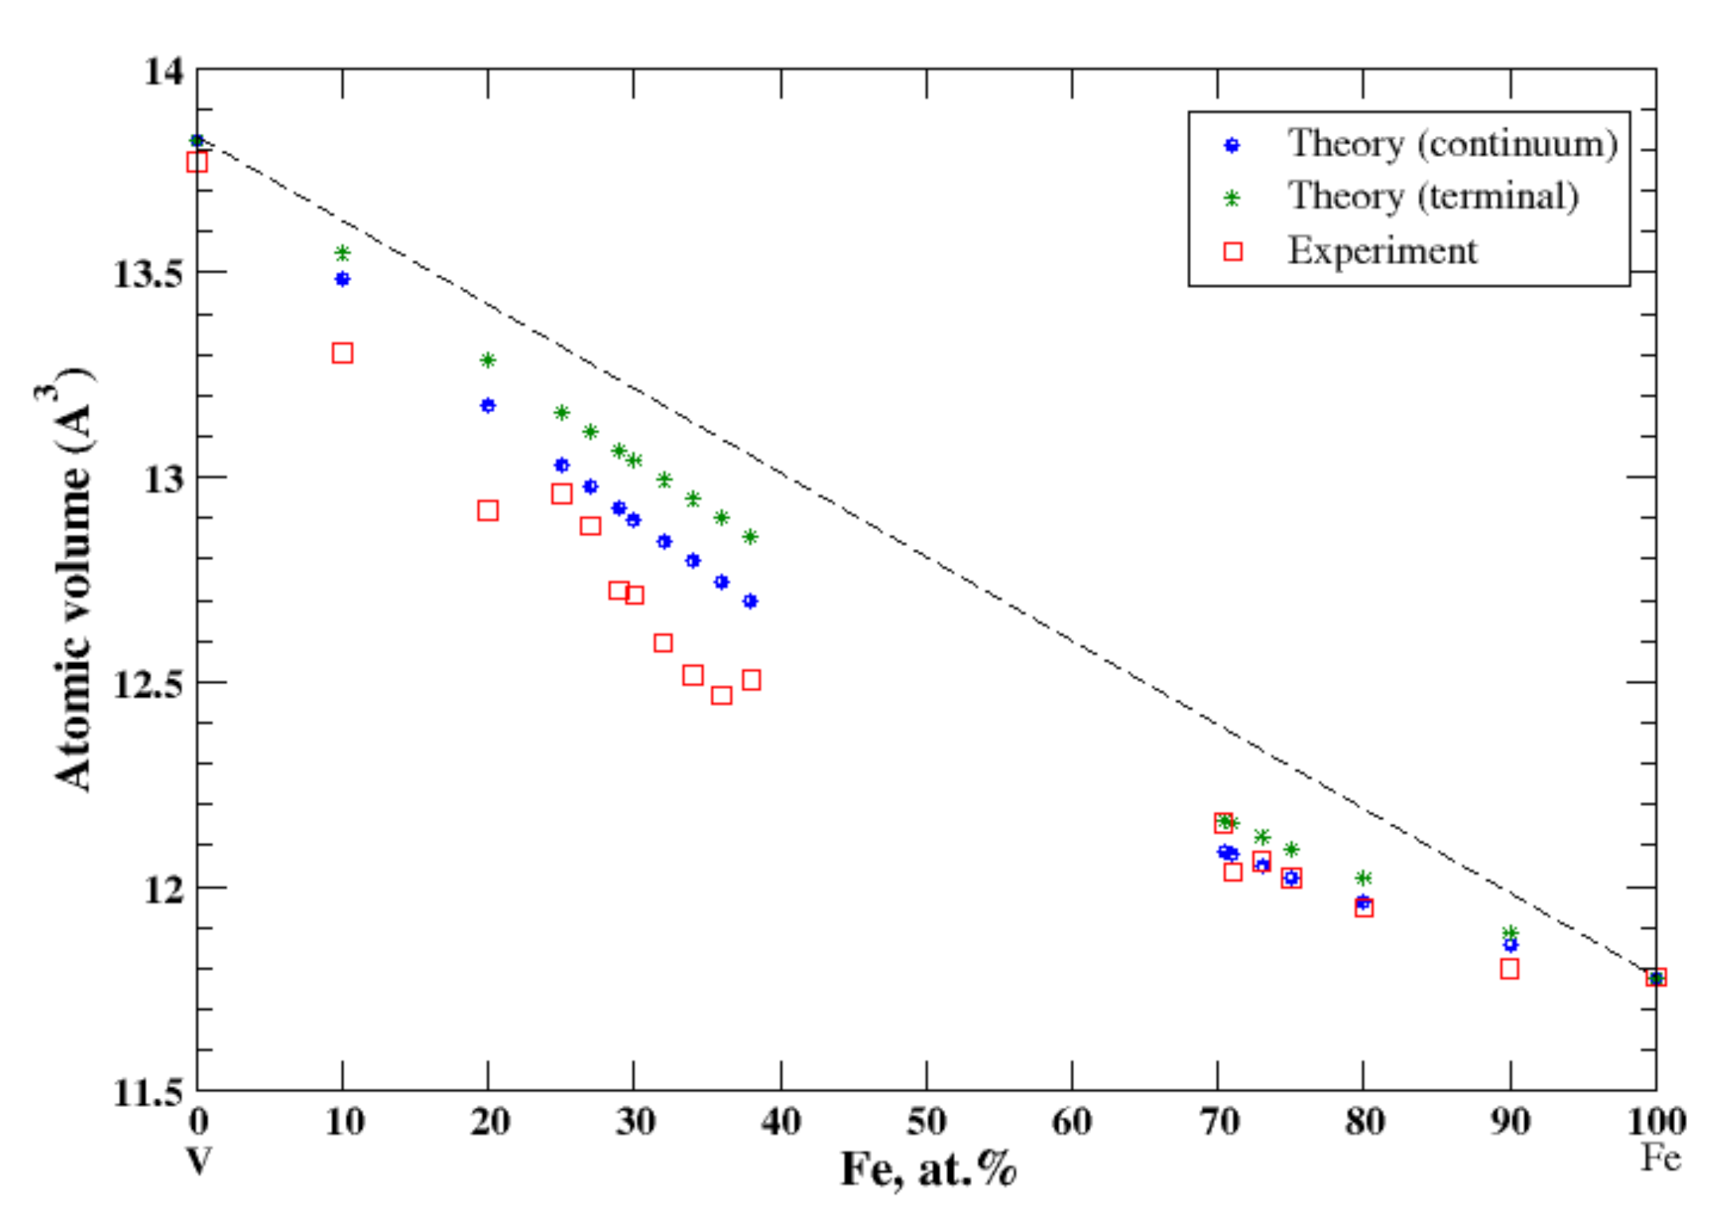
3.14. Fe-V
According to Refs. [16,30], iron and vanadium form continuous solid solutions at elevated temperatures. In the continuum approximation, the calculated atomic volume of Fe-V solid solutions is in good agreement with experimental data measured above 1252 °C [16], Figure 14, reproducing a negative deviation from Zen’s law, although above ~20 at.% of Fe calculations slightly overestimate the observed atomic volume. In the terminal approximation, calculated atomic volume of Fe-V solid solutions also shows a negative deviation from Zen’s law, but this approximation overestimates the experimental data for V-rich solid solutions. According to [17], the heat of formation of Fe-V solid solutions, measured at 1327 °C, is positive up to ~52 at.% of V and slightly negative in the remaining part of the composition range.

Figure 14.
Atomic volume vs. concentration for Fe-V alloy system. The experimental data are from Ref. [16] (p. 634 and p. 663).
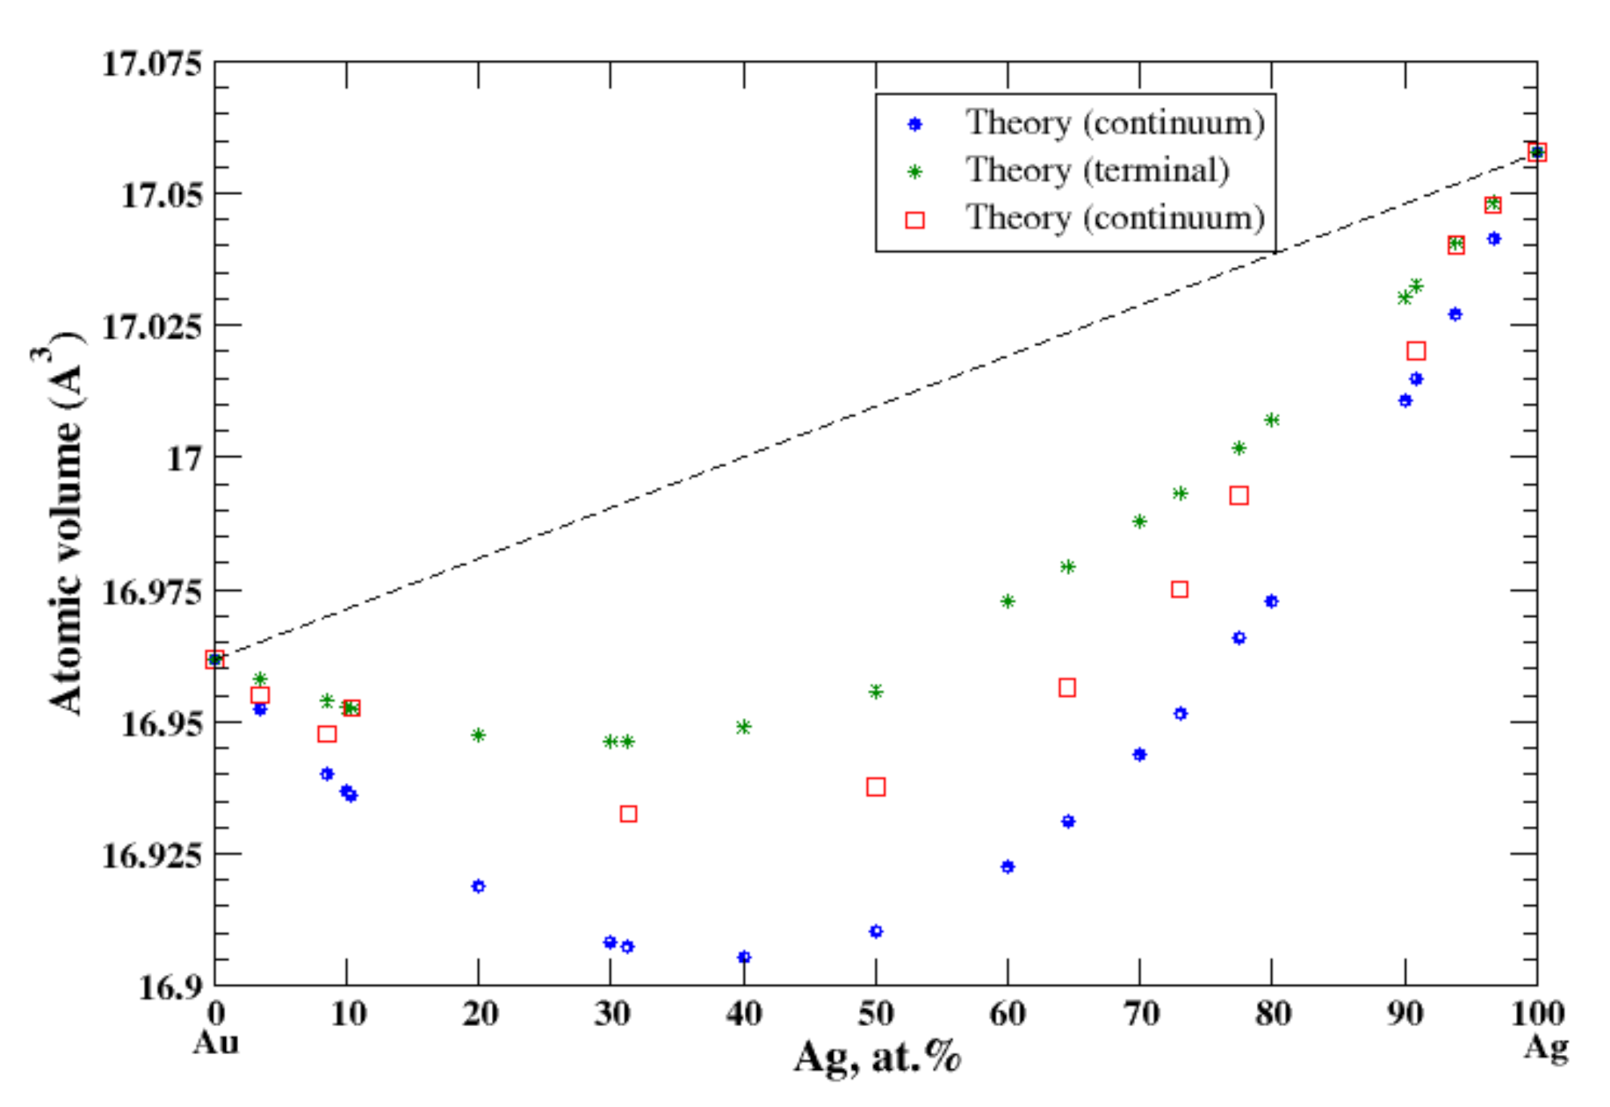
3.15. Ag-Au
According to Refs. [16,31], silver and gold form continuous solid solutions. In the continuum and terminal approximation, the calculated atomic volume shows a significant negative deviation from Zen’s law which is in an accord with the experimental data [16], Figure 15, although the continuum approximation significantly underestimates the atomic volume, and the terminal approximation overestimates it. The heat of formation of the solid solutions, measured at 527 °C [17] is significantly negative.
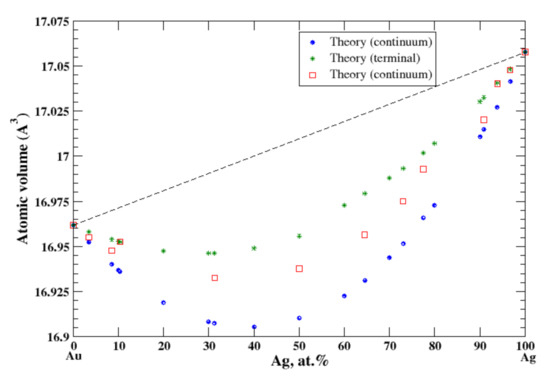
Figure 15.
Atomic volume vs. concentration for Ag-Au alloy system. The experimental data are from Ref. [16] (p. 267 and p. 289).
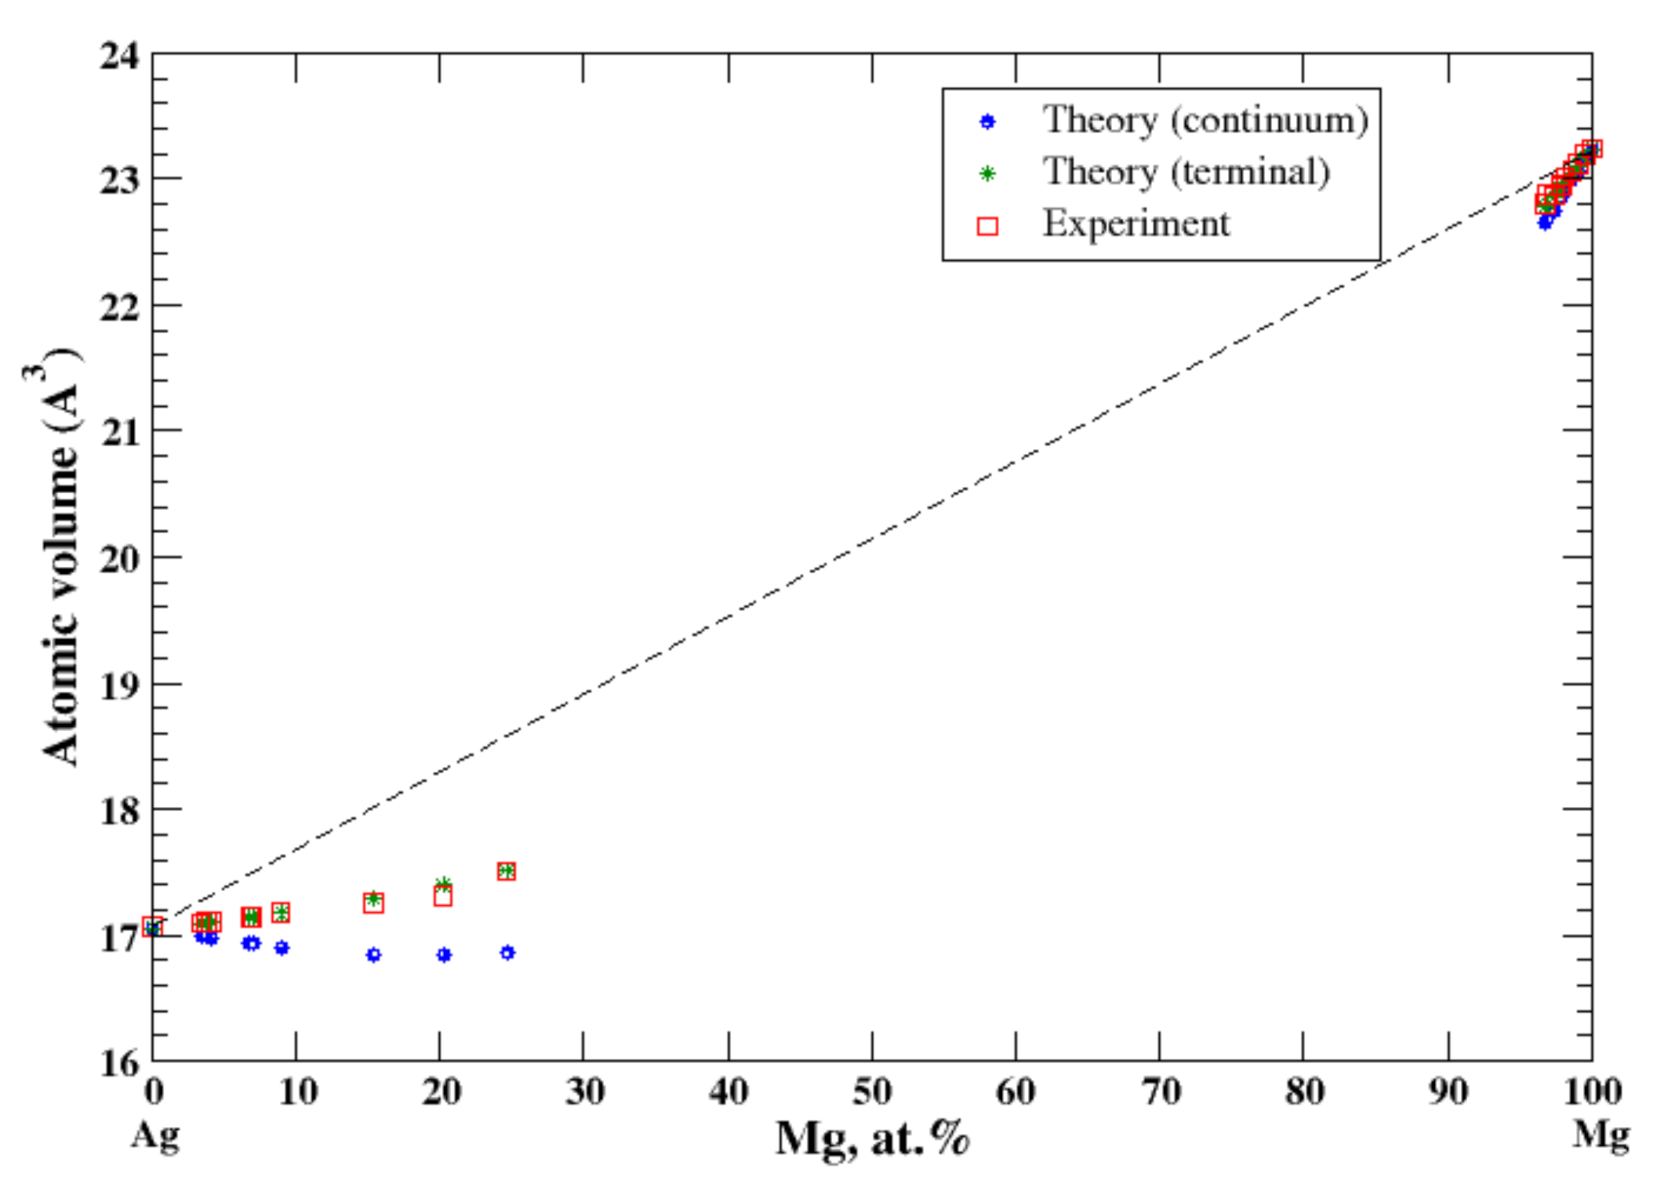
3.16. Ag-Mg
According to Refs. [16,32], the magnesium dissolved in silver is beyond 25 at.% (the maximum solubility of Mg in Ag is ~29 at.% at eutectic temperature of 759 °C). The maximum solubility of Ag in Mg is significantly lower, ~4 at.% at eutectic temperature 472 °C, Figure 16. In the terminal approximation, the calculated atomic volumes for both Ag-based and Mg-based solid solutions show the negative deviation from Zen’s law with excellent accord with experimental data [16], Figure 16. For Ag-based solid solutions the continuum approximation significantly underestimates the calculated atomic volume. The significant negative heat of formation of Ag-based alloys is reported in [17].
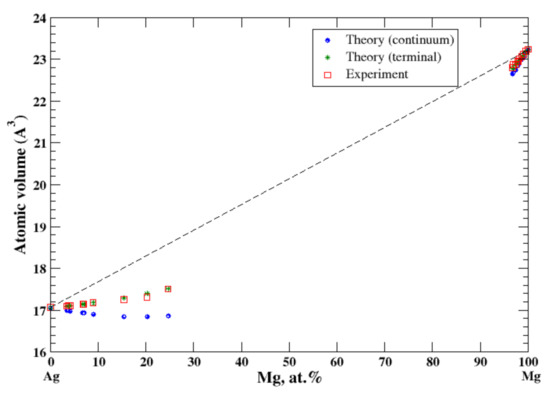
Figure 16.
Atomic volume vs. concentration for Ag-Mg alloy system. The experimental data are from Ref. [16] (p. 292 and p. 729).
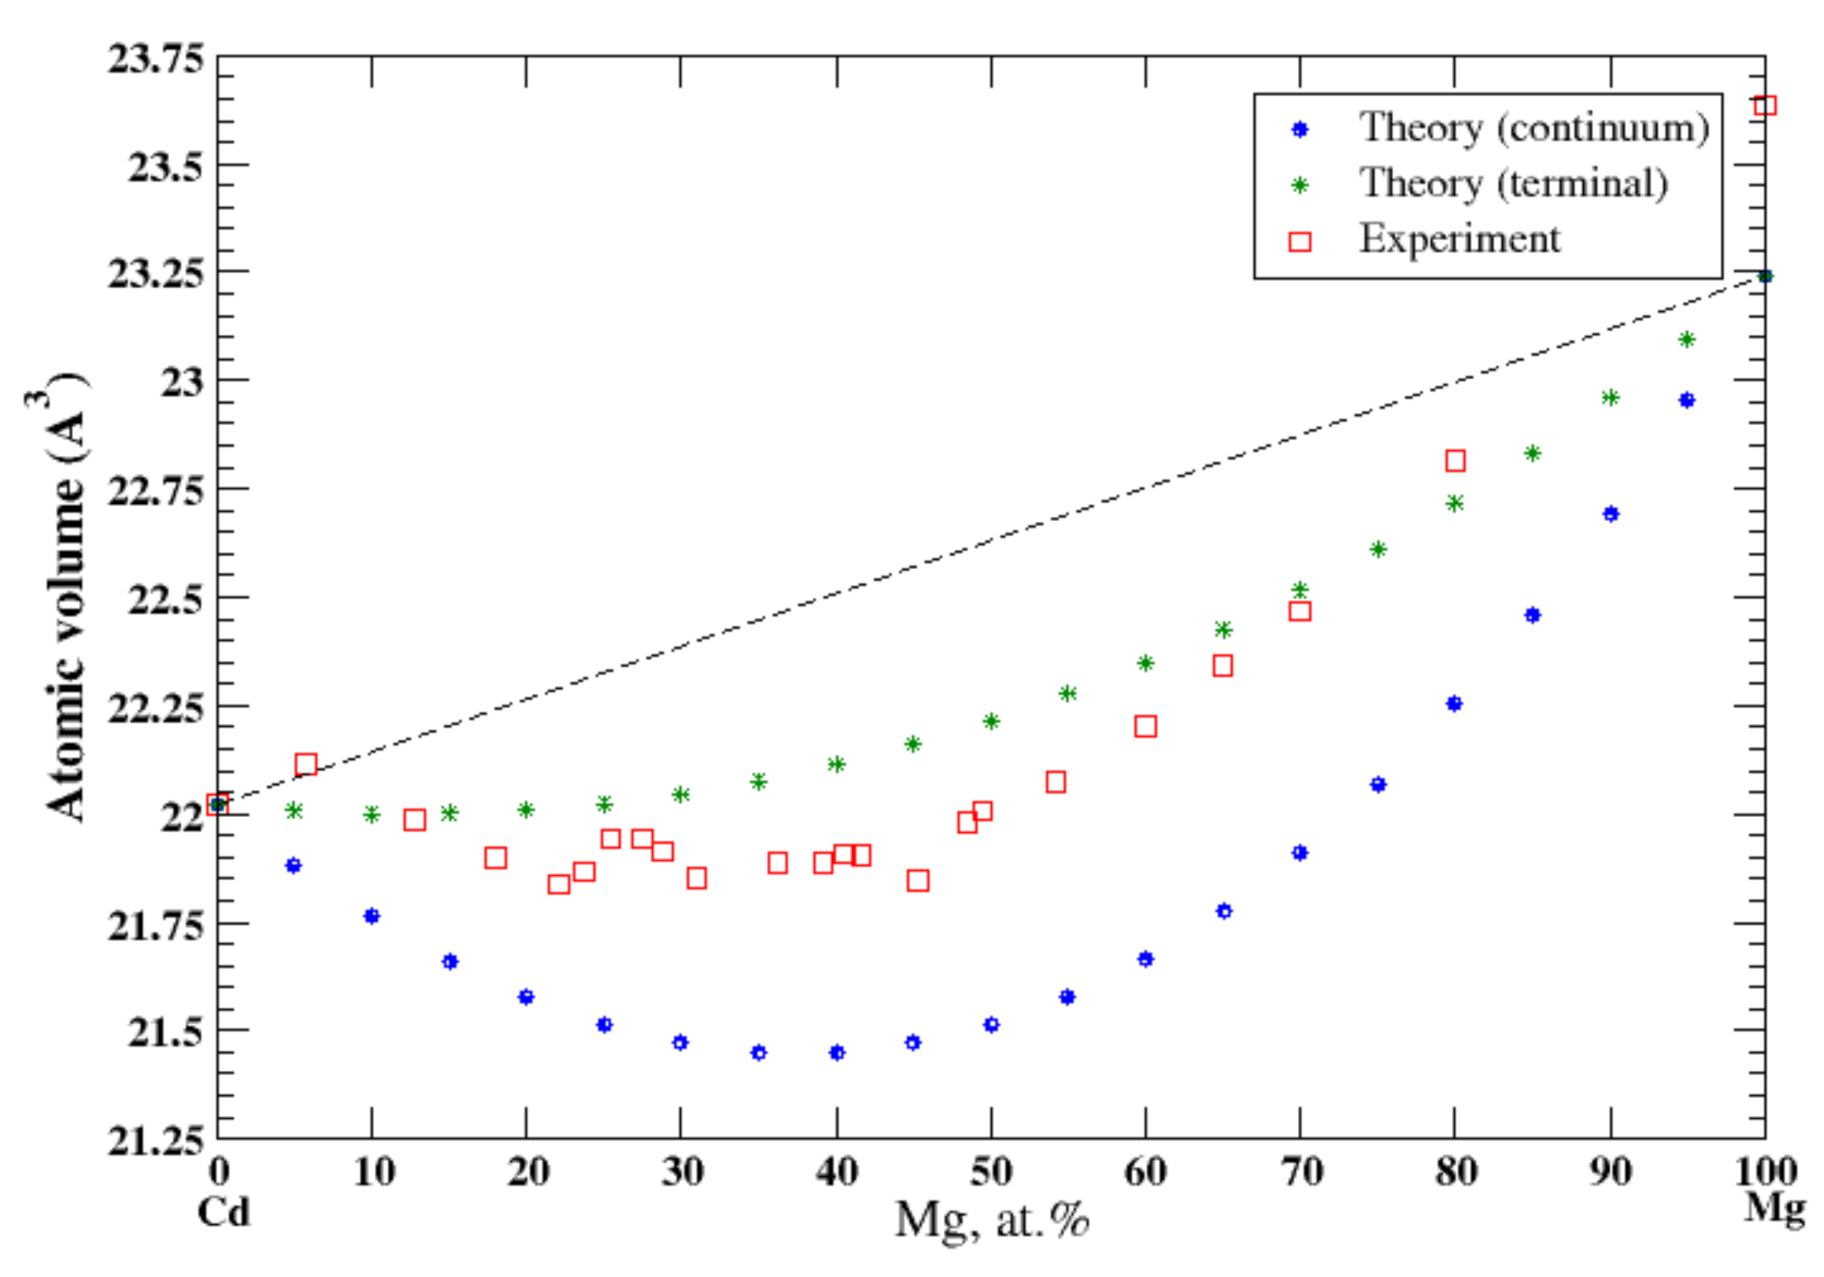
3.17. Cd-Mg
According to Refs. [16,33], cadmium and magnesium form continuous solid solutions at high temperatures. In the continuum approximation, the calculated atomic volume of Cd-Mg solution show a significant negative deviation from Zen’s law following the tendency that was observed experimentally [16] at 310 °C, Figure 17, although this approximation significantly underestimates the atomic volume. The terminal approximations also show the negative deviation from the Zen’s law with a better agreement with experimental data, although it slightly overestimates the atomic volume. According to [17], the heat of formation of solid Cd-Mg solutions, measured at 270 °C, is also negative.
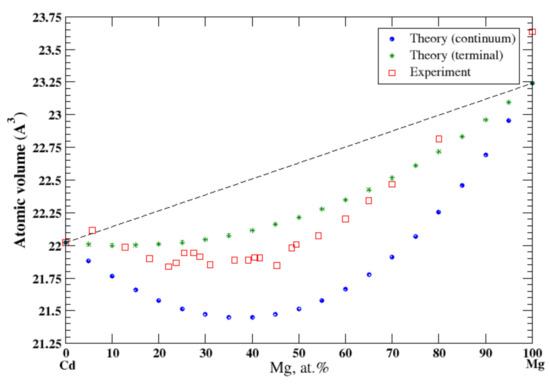
Figure 17.
Atomic volume vs. concentration for Cd-Mg alloy system. The experimental data are from Ref. [16] (p. 49 and p. 485).
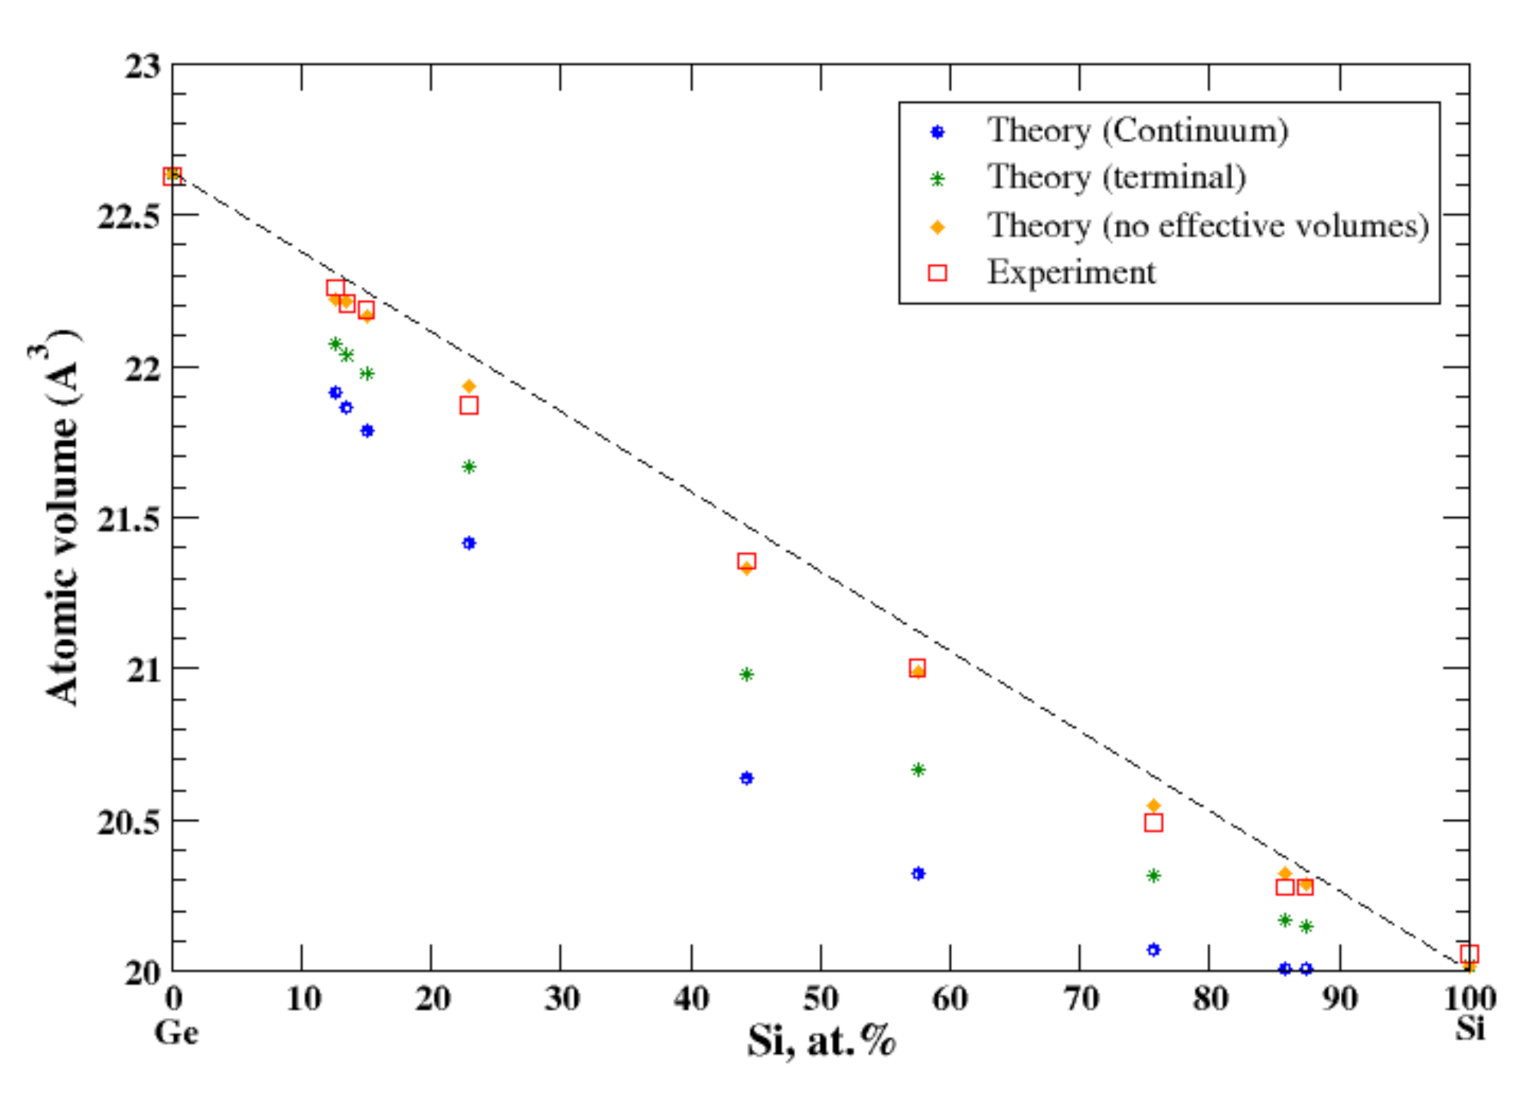
3.18. Ge-Si
According to Refs. [16,34], germanium and silicon form a continuous solid solution. The measured atomic volume, [16], shows a very small negative deviation from Zen’s law which cannot be reproduced either by the terminal or by the continuum approximation, Figure 18. Only if one uses the real volumes instead of apparent volumes, can the experimental results be reproduced, Figure 18. Neither pure Ge and Si are the metals, unlike the components of other systems studied here. This is probably a partial explanation of the failure of the apparent volume theory for Ge-Si alloys.
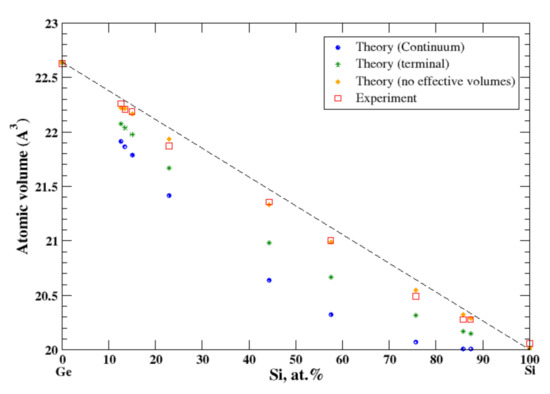
Figure 18.
Atomic volume vs. concentration for Ge-Si alloy system. The experimental data are from Ref. [16] (p. 679).
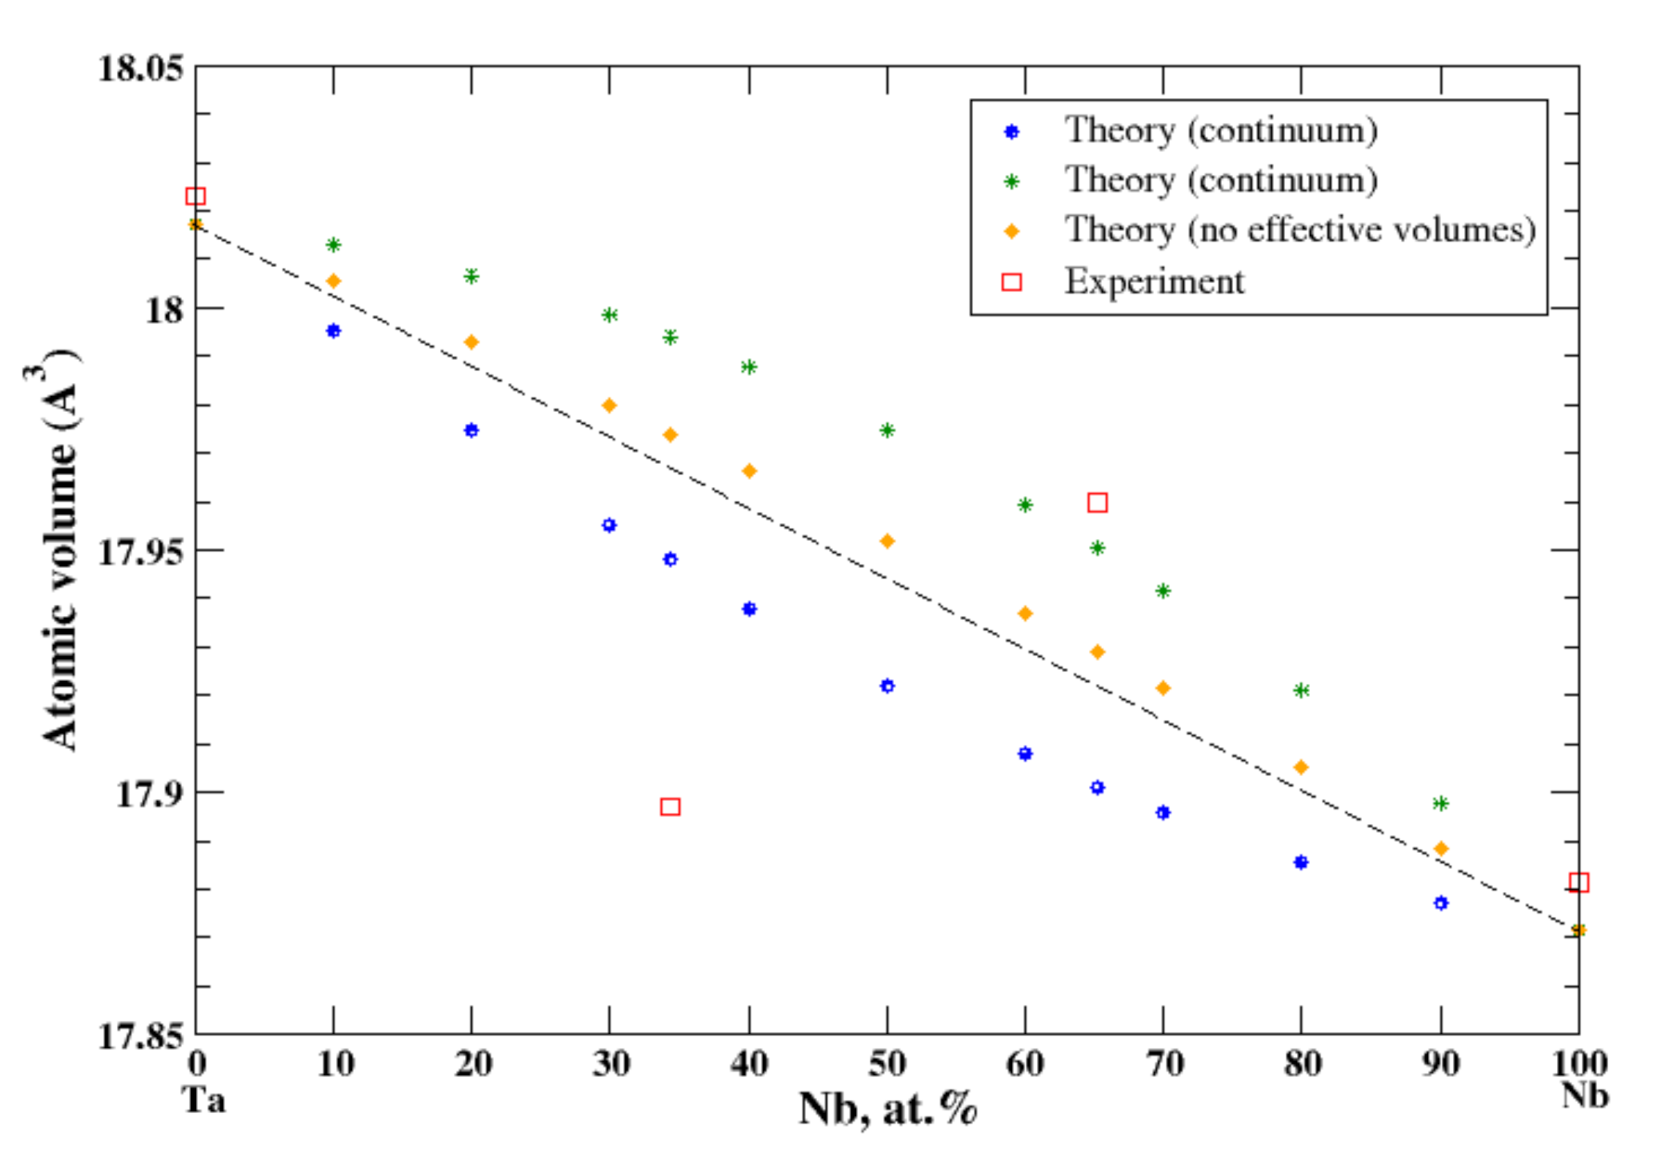
3.19. Nb-Ta
According to Refs. [16,35], niobium and tantalum form a continuous solid solution. However, the experimental data for the atomic volume are available only for 34.3 at.% and 62.25 at.% of Nb [16], Figure 19. In the continuum and terminal approximations, the calculated atomic volume of Nb-Ta solutions is shown on Figure 19, although the continuum (terminal) approximation shows a negative (positive) deviation from Zen’s law. If we use the real volumes instead of the apparent volumes, a weak positive deviation from Zen’s law is observed.
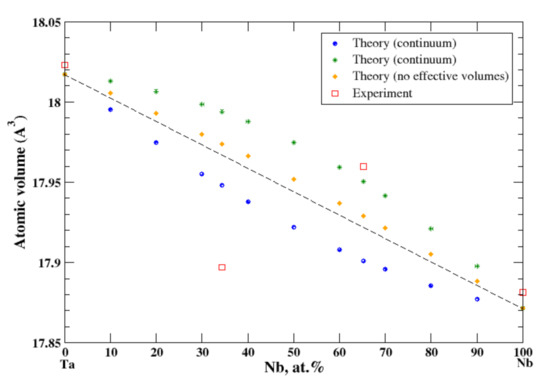
Figure 19.
Atomic volume vs. concentration for Nb-Ta alloy system. The experimental data are from Ref. [16] (p. 757 and p. 773).
3.20. Pb-Sn
According to Refs. [16,36], lead and tin form a eutectic phase diagram. The maximum solubility of Sn in Pb is ~29 at.% at eutectic temperature 183 °C, and the maximum solubility of Pb in Sn is 1.5 at.% at the same temperature. In the terminal and continuum approximations, the calculated atomic volume for both Pb-based and Sn-based solid solutions together with experimental data [16] is shown in Figure 20. For Pb-based alloys the calculated volume follows Zen’s law in an accord with experimental data. Slight positive deviation from Zen’s law is observed for Sn-based alloys. The heat of formation of solid Pb-based alloys is positive which is in accord with the eutectic type of the Pb-Sn phase diagram [16,17].
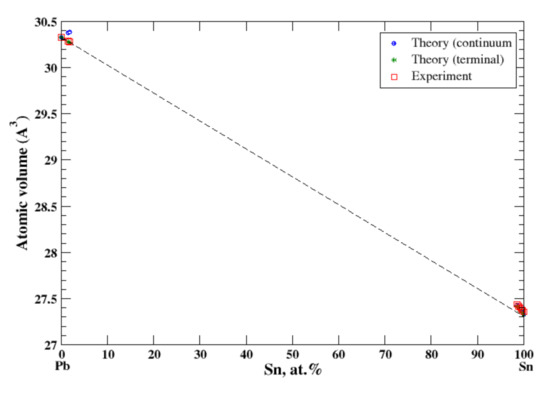
Figure 20.
Atomic volume vs. concentration for Pb-Sn alloy system. The experimental data are from Ref. [16] (p. 818 and p. 862).
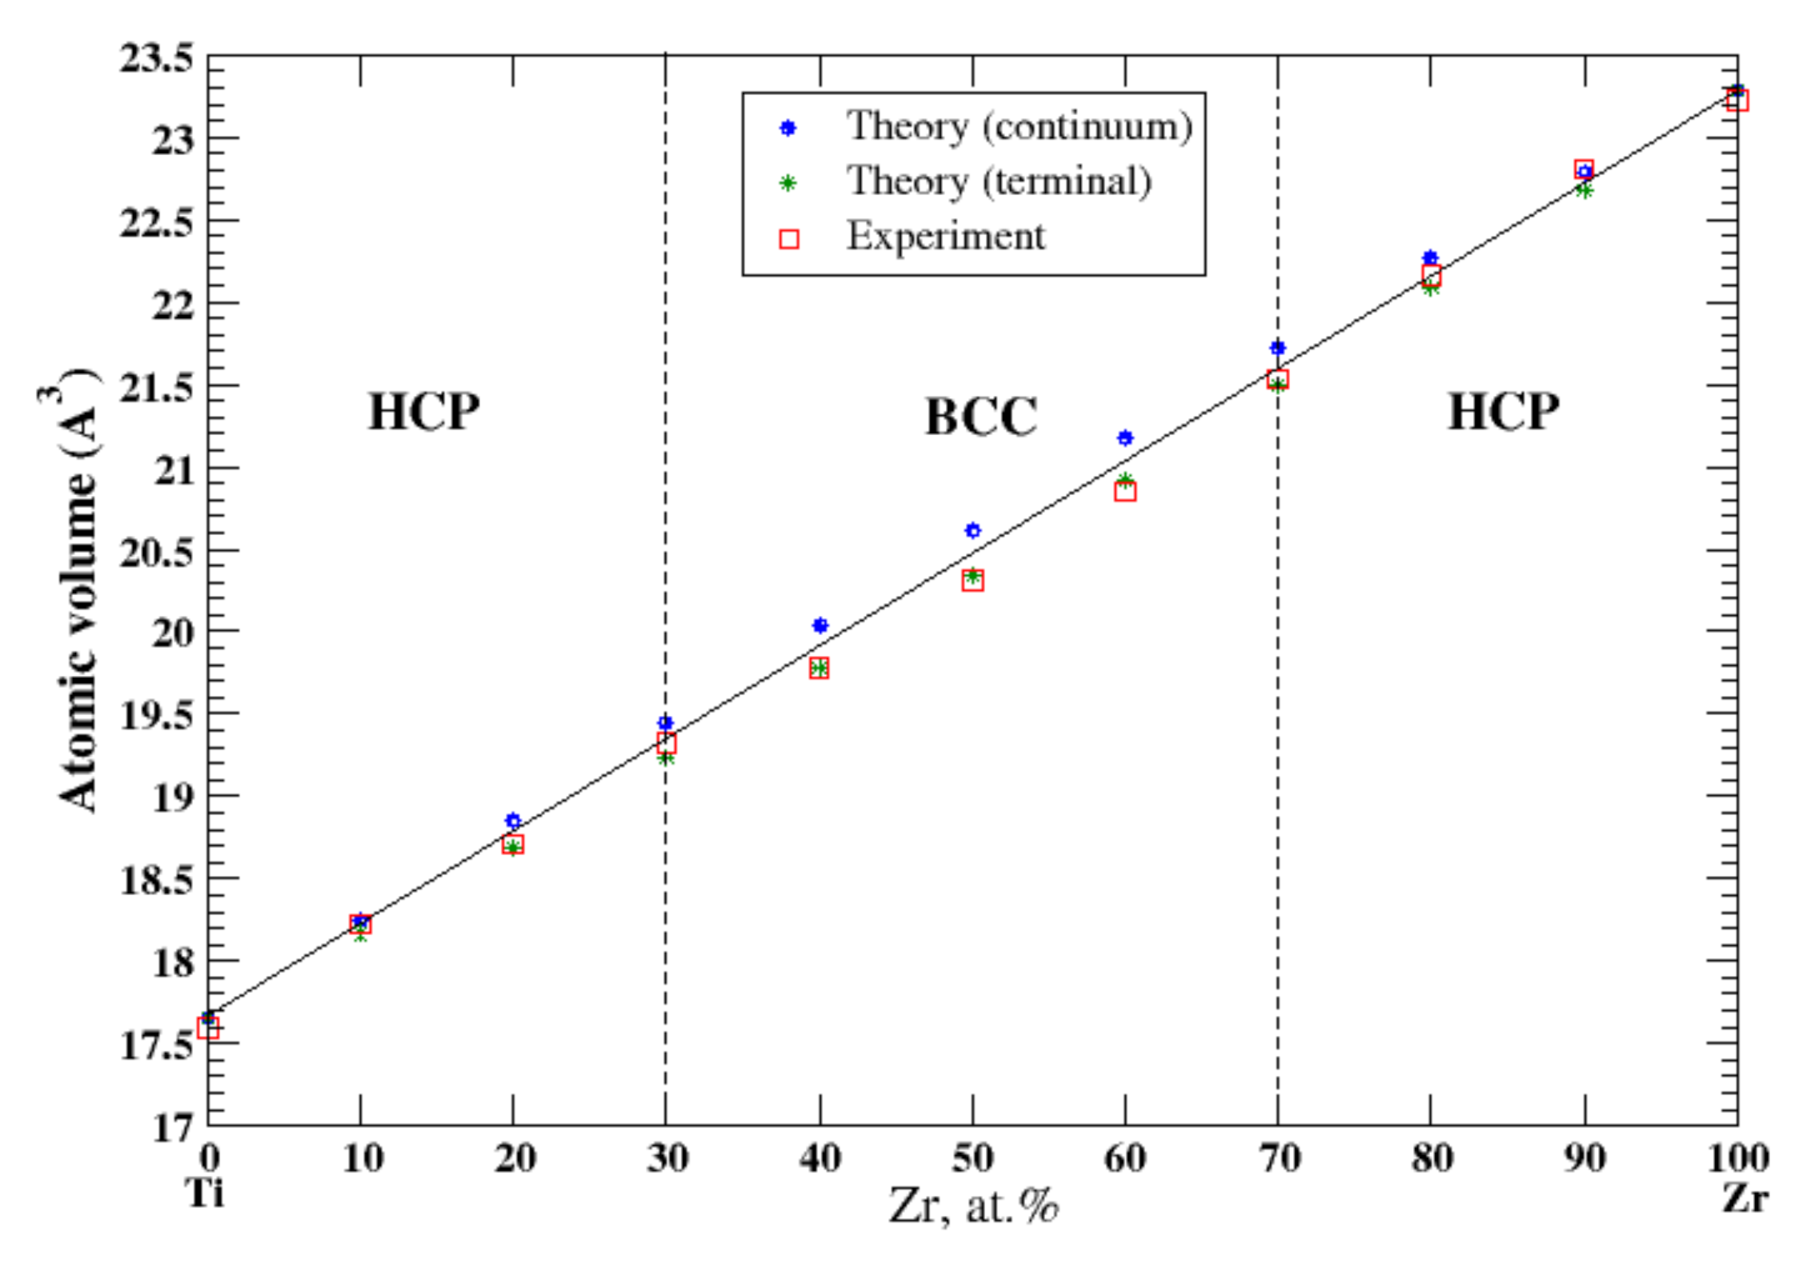
3.21. Ti-Zr
According to Refs. [16,37], titan and zirconium form a continuous solid solution. In the continuum (terminal) approximation, the calculated atomic volume of Ti-Zr solutions show a slight positive (negative) deviation from Zen’s law. In the terminal approximation, the results of the calculations better agree with the experimental data [16] shown in Figure 21.
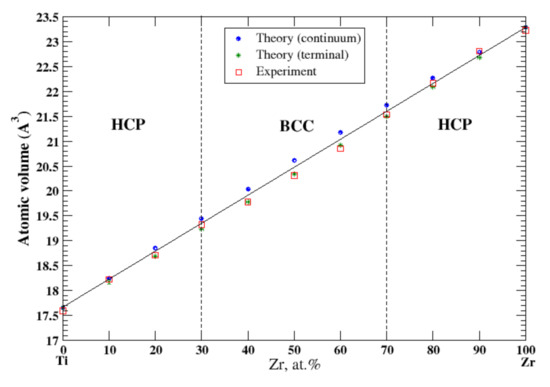
Figure 21.
Atomic volume vs. concentration for Ti-Zr alloy system. The experimental data are from Ref. [16] (p. 873 and p. 876).
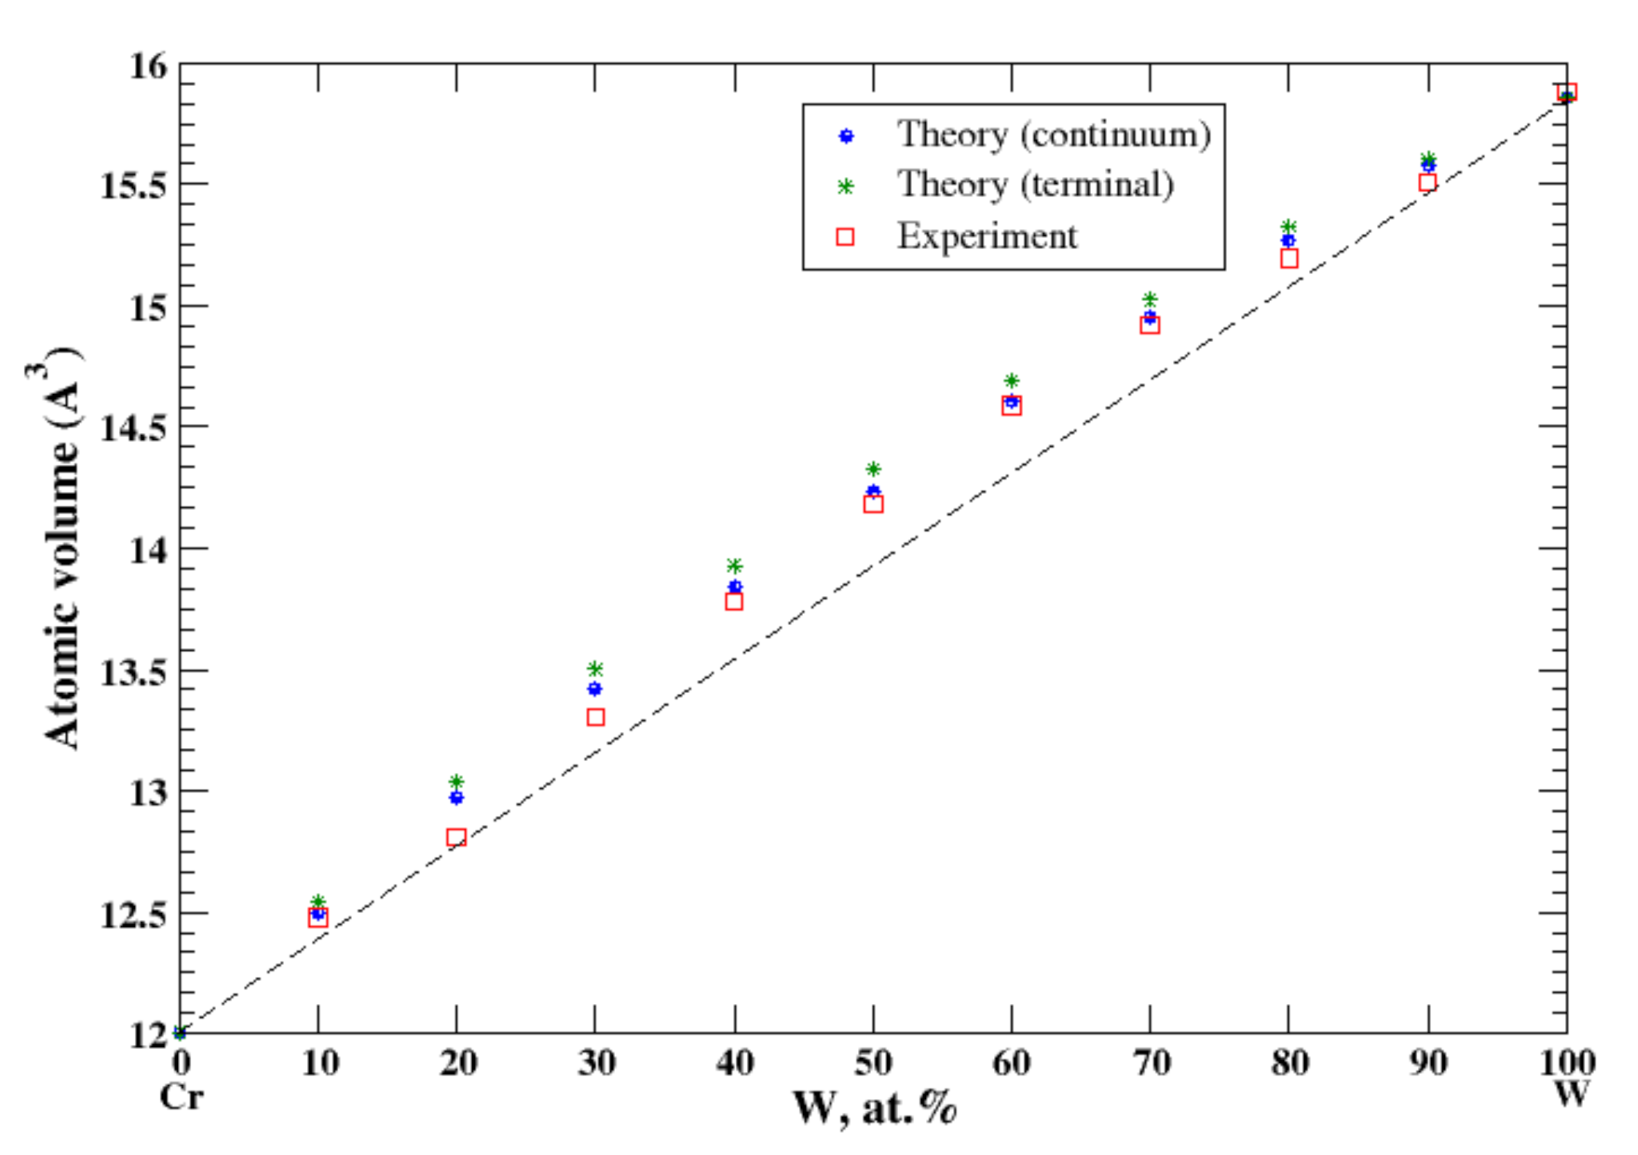
3.22. Cr-W
According to Refs. [16,38], chromium and tungsten form a continuous solid solution at high temperatures (above 1677 °C). In the continuum approximation, the calculated atomic volume of Cr-W solutions shows a positive deviation from Zen’s law, which is in excellent accord with the experimental data [16], Figure 22. The terminal approximation slightly overestimates the atomic volume.
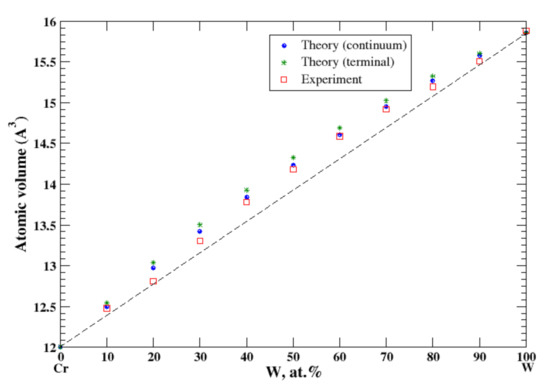
Figure 22.
Atomic volume vs. concentration for Cr-W alloy system. The experimental data are from Ref. [16] (p. 545 and p. 567).
4. Discussion
Lubarda [11] studied the validity of Vegard’s law in five systems: Al-Cu, Al-Ag, Al-Mg, Cu-Au, and Au-Ag. Four of these alloys are isostructural (FCC), and in Al-Mg alloy, Al and Mg have FCC and HCP crystal structures, respectively, which causes discontinuity of the lattice constant calculated for Al- and Mg-based terminal solutions, where the sign of the deviation from Vegard’s law changes from positive (Al-based) to negative (Mg-based) solid solutions at the equiatomic composition. Even for Al-Cu and Al-Ag isostructural solid solutions, the discontinuity of the lattice constant, calculated for two terminal solutions, is observed at the equiatomic composition [11]. We show that the study of the deviation from Zen’s law, instead of Vegard’s law, removes the problem related to the discontinuity of the calculated value (the atomic volume) at the equiatomic composition.
We place twenty-two studied binary alloys in seven different groups: 1. Alloys that contain aluminum (Al-Ag, Al-Cu, Al-Mg, Al-Mn, Al-Ti, and Al-Zn); 2. Alloys that contain copper (Cu-Ag, Cu-Au, Cu-Fe, Cu-Ni, and Cu-Zn); 3. Alloys that contain iron (Co-Fe, Fe-Cr, Fe-V); 4. Alloys that contain silver (Ag-Au, Ag-Mg); 5. Alloys with both transition metal components (Nb-Ta, Ti-Zr, and Cr-W); 6. Alloys whose elements belong to the same group of the Periodic Table (Ge-Si, Pb-Sn); and 7. Cd-Mg alloys.
4.1. Al-Ag, Al-Cu, Al-Mg, Al-Mn, Al-Ti, and Al-Zn
These alloys do not form continuous solid solutions. The maximum solubility of aluminum (about 42 at.%) is observed in the Al-Ti system, although the solubility of titanium in aluminum is very low (0.2 at.%). Al-Ti system possesses both the maximum and minimum mutual solubilities of the alloy components for this group. As we mentioned above, Al-Cu, Al-Ag, and Al-Mg alloys were discussed in Ref. [11]. The terminal approximation works perfectly for all six systems, reflecting the correct deviation (the sign) from Zen’s law, except for Al-based solid solutions in the Al-Mg system, where calculations revealed a slight positive deviation from Zen’s law, contrary to the experimentally observed slight negative deviation. The continuum approximation significantly fails for Al-based alloys in Al-Ag and Al-Zn systems as well as for Mn-based alloys in Al-Mn system and for Ti-based alloys in Al-Ti system. The success of the terminal approximation and failure of the continuum approximation indicates the validity of the usage of Equations (35) and (36) for the alloys with limited mutual solubility components over Equations (33) and (34), which were designed for continuous, across the whole compositional range, solid solutions.
4.2. Cu-Ag, Cu-Au, Cu-Fe, Cu-Ni, and Cu-Zn
The isostructural Cu-Au and Cu-Ni alloys form continuous solid solutions; however, Cu-Au alloys show a slight positive deviation from Zen’s law and Cu-Ni alloys show a slight negative deviation from Zen’s law. The continuum approximation works perfectly for both these alloys. The continuum and terminal approximations produce almost identical values of the atomic volume for Cu-Ni alloys because the real and effective volumes are almost identical for Cu (Ω = 11.8072 Å3, Ω* = 11.8510 Å3) and for Ni (Ω = 10.9415 Å3, Ω* = 10.9128 Å3). Cu-Ag and Cu-Fe alloys show the limited mutual solubility of the components. The terminal approximation works perfectly for both alloys, although the positive deviation from Zen’s law is more pronounced in Cu-Fe alloys due to the very small mutual solubility of the components that have different crystallographic structures, Cu (FCC) and Fe (BCC). Cu (FCC) and Zn (HCP) also have different crystallographic structures; however, there is a significant, about 40 at.%, solubility of Zn in Cu. It is really surprising that the terminal approximation works successfully within the above-mentioned concentration range, despite that it is supposed to work well for the limited solubility of the solute in the solvent matrix as occurs for Zn-based solid solutions (only approximately 3 at.% of Cu dissolved in Zn). The continuum approximation significantly overestimates the atomic volume of Cu-rich Cu-Fe alloys and underestimates the atomic volume of Cu-based Cu-Zn alloys. We consider that the failure of the continuum approximation for these two alloys is due to the different crystallographic structures of the alloys’ components, (Cu, Fe) and (Cu, Zn), respectively.
4.3. Co-Fe, Fe-V, and Fe-Cr
As we already mentioned, iron and vanadium form continuous solid solutions at elevated temperature. Both components, Fe and V, are isostructural (BCC). At ambient temperatures, there is no mutual solubility in the composition region that spans from ~40 at.% to ~70 at.% of Fe. Fe-based alloys, with an amount of Fe ≥ 70 at.%, are described pretty well within both continuum and terminal approximations. For the same reason (Fe and V are isostructural), one should expect good agreement between the calculated atomic volume, within the continuum approximation, and the experimental data for V-based alloys. However, while both continuum and terminal approximations produce a “smooth” behavior of the calculated atomic volume of the V-based alloys up to almost 40 at.% of Fe, the experiment shows a significant decrease of the atomic volume in the compositional region between 25 and 40 at.% of Fe, which we relate to the presence of the complex Ve0.5Fe0.5 phase [30] (the Cr0.49Fe0.51 prototype) with a wide region of homogeneity. Two other alloys, Fe-Co and Fe-Cr are formed by magnetic components. Although at room temperature Fe and Co have different structures, BCC and HCP, respectively, iron transforms to the FCC structure at elevated temperatures, which causes the mutual solubility of the components of Fe-Co alloys within the whole composition range. The continuum and terminal approximations describe a positive deviation from Zen’s law that is in good accord with experimental data, although the terminal approximation shows a better agreement with experiment in the BCC regions that spans between 20 at.% and 100 at.% of Fe. Fe and Cr are both isostructural at room temperature; however, due to existence of the complex narrow σ-phase in the vicinity of the equiatomic composition, the continuous Fe-Cr solid solutions are formed only above 830 °C. Both continuum and terminal approximations work well in the Fe-rich side of the Fe-Cr phase diagram, up to 12 at.% of chromium, describing the strong positive deviation from Zen’s law; however, due to the unusual behavior of the atomic volume of this system in the composition region between 12 at.% and 25 at.% of Cr, see Refs. [29,39] for details, both approximations fail in that region. On the remaining part of the Fe-Cr phase diagram, above 25 at.% of Cr, the terminal approximation gives excellent agreement with the experimental data (and Zen’s law). This is only the case where the terminal approximation works better than the continuum approximation for alloys with the mutual solubility of the components.
4.4. Ag-Au and Ag-Mg
Both Ag and Au are isostructural (FCC) metals and belong to the same subgroup of the Periodic Table. They form continuous Ag-Au solid solutions that are described within the continuum and terminal approximations (the negative deviation from Zen’s Law). Ag and Mg have different structural modifications, FCC, and HCP, respectively. Thus, a limited mutual solubility is observed in Al-Mg alloys. The terminal approximation works well for both end points of the Al-Mg phase diagram. We consider that the significantly underestimated atomic volume for Ag-based solid solutions, calculated within the continuum approximation, is due to the different structure modifications of Ag and Mg.
4.5. Nb-Ta, Ti-Zr, and Cr-W
Both Ti and Zr are isostructural (HCP) metals and belong the IVB subgroup of the Periodic Table. Cr and W are also isostructural (BCC) and belong to the VIB subgroup of the Periodic Table. The composition dependence of the atomic volume is described by the continuum and terminal approximations in good accord with experimental data, although the almost perfect Zen’s law behavior is observed in Ti-Zr alloys, and a slight positive deviation from Zen’s law is observed in Cr-W alloys. The situation with Nb-Ta alloys is more complex. Both Nb and Ta metals are isostructural (BCC) and belong to the same VB subgroup of the Periodic Table. According to the phase diagram [35], Nb and Ta form continuous solid solutions. However, according to Ref. [16], the experimental data for atomic volume are available for two compositions of Nb-Ta system only: the negative deviation from Zen’s law is observed at ~34 at.% of Nb and the positive deviation from Zen’s law is observed at ~62 at.% of Nb. The continuum (terminal) approximation shows a negative (positive) deviation from Zen’s law.
4.6. Ge-Si and Pb-Sn
Both Pb and Sn belong to the same 4A group of the Periodic Table and form the eutectic phase diagram. At room temperature the mutual solubilities of the components are negligibly small, and the composition dependence of the atomic volume is described well within the terminal approximation. Ge and Si also belong the same 4A group of the Periodic Table; however, contrary to Pb-Sn system, Ge-Si alloys form continuous solid solutions. As we already mentioned, both the continuum and terminal approximations could not reproduce the very small negative deviation from Zen’s law, so we speculate that this failure is due to the non-metallic nature of both Si and Ge.
4.7. Cd-Mg
In 1940, Hume-Rothery and Raynor [40] found that the experimental atomic volume of Mg-Cd solid solutions was smaller than the one calculated using the additivity rule (the negative deviation from Zen’s law formulated in 1956, Ref. [3]). Since then, the behavior of Mg-Cd disordered solid solutions has been the subject of numerous investigations [41,42,43,44]. These works used the pseudopotential method in conjunction with thermodynamic perturbation theory (the Gibbs-Bogoliubov inequality) to calculate the phase diagram and equation of state of the disordered solid and liquid MgxCd1-x alloys. The calculated composition dependence of the equilibrium volume of the solid MgxCd1-x alloys [44] shows a negative deviation from Zen’s law, but not to such an extent as was reported in the experiment in Ref. [40]. The calculations [41,42,43,44] were performed within the local pseudopotential approximations, which excluded the charge transfer between alloy components due to the difference of their electronegativity, see Ref. [45] for details. Incorporation of the apparent size of solute atom, suggested in Ref. [11], together with modifications suggested in the present study, Equations (28)–(36), makes it possible, for the first time, to describe quantitively the negative deviation from Zen’s law in Mg-Cd solid solutions.
5. Conclusions
We derived an analytical expression for the atomic volume of the binary alloys at arbitrary composition for use in the equation of state modeling. We wanted this expression to be robust and predictive even in the absence of experimental data at a particular concentration. This paper tests our proposed expression by comparison with experimental data for the binary alloys.
Our method is based on the work of Lubarda [11], who introduced an apparent size of the solute atom in order to account for the electronic interactions between the outermost quantum shells of the solute and solvent atoms. This idea reflects, to some extent, the electron density rearrangement due to the charge transfer in order to cancel the chemical potential difference due to alloying. The method [11] was designed to calculate the lattice parameter of a binary alloy as the function of the alloy composition (the deviation from Vegard’s law) and had deficiencies in several cases, e.g., when the alloy components were not isostructural or when the deviations from Vegard’s law had different signs for the end points of the binary phase diagram.
To remove these problems, we applied Lubarda’s approach to the atomic volume instead the lattice parameter, or in other words, studied the deviation from Zen’s law, instead of Vegard’s law. In addition, we redefined (symmetrized) some parameters of Lubarda’s model and assumed that they should be recalculated at each alloy composition. Moreover, we introduced two approximations, continuum and terminal, where each is suited to get more accurate results for the atomic volume in the case of continuous solid solutions and the in the case of solutions with limited solubility of the solute component in the solvent matrix, respectively. Jacob et al. [46] concluded that both Vegard’s and Zen’s laws should be downgraded to an approximation that is valid in specific conditions. We agree with this by describing numerous cases of the deviation from Zen’s law, along with a satisfactory way to describe (or predict) these deviations, which is the primary motivation for this study.
Author Contributions
A.L., J.E.K. and K.J.C. conceived the study. A.L. and R.E.R. modified and expanded the elasticity inclusion model [11]. A.L. performed calculations. D.A.Y. analyzed correspondence between theoretical and experimental results. All authors helped writing the paper. All authors have read and agreed to the published version of the manuscript.
Funding
This research received no external funding.
Institutional Review Board Statement
Not applicable.
Informed Consent Statement
Not applicable.
Data Availability Statement
The data relevant to this study are provided in the article.
Acknowledgments
This work was performed under the auspices of the U.S. DOE by LLNL under Contract DE-AC52-07NA27344.
Conflicts of Interest
The authors declare no conflict of interest.
References
- Mizutani, U. Hume-Rothery Rules for Structurally Complex Alloy Phases; CRC Press: Boca Raton, FL, USA, 2010. [Google Scholar] [CrossRef]
- Vegard, L. Die Konstitution der Mischkristallen und die Raumfüllung der Atome. Z. Phys. 1921, 5, 17–26. [Google Scholar] [CrossRef]
- Zen, E. Validity of “Vegard’s Law”. J. Mineral. Soc. Am. 1956, 41, 523–524. [Google Scholar]
- Hume-Rothery, W.; Raynor, G.V. The Structure of Metals and Alloys; Institute of Metals: London, UK, 1962. [Google Scholar]
- Massalski, T.B.; King, H.W. Alloy Phases of the Noble Metal. Prog. Mater. Sci. 1963, 10, 3–78. [Google Scholar] [CrossRef]
- Kozlov, E.V.; Klopotov, A.A.; Solonitsina, N.O.; Tailashev, A.S. Dimensional crystal geometry of binary intermetallic alloys. Russ. Phys. J. 2006, 49, 35–46. [Google Scholar] [CrossRef]
- Kozlov, E.V.; Klopotov, A.A.; Tailashev, A.S.; Solonitsina, N.O. The Ni-Al system: Crystal-geometrical features. Russ. Bull. Acad. Sci. Phys. 2006, 70, 1113–1116. [Google Scholar]
- Klopotov, A.A.; Yasenchuk, Y.F.; Abzaev, Y.A.; Dement’eva, M.G.; Kozlov, E.V.; Potekaev, A.I.; Solonitsyna, N.O. System Ni-Ti. Crystallogeometrical Features. Russ. Phys. J. 2008, 51, 226–239. [Google Scholar] [CrossRef]
- Potekaev, A.I.; Kondratyuk, A.A.; Porobova, S.A.; Klopotov, A.A.; Markova, T.N.; Kukushkun, Y.A.; Klopotov, V.D. Zen’s Law and Features in Liquidus-solidus Curves in Binary State Diagrams Based on Elements VIIIA and IB of the Periodic Table. IOP Conf. Ser. Mater. Sci. Eng. 2016, 156, 012030. [Google Scholar] [CrossRef]
- Potekaev, A.I.; Klopotov, A.A.; Porobova, S.A.; Klopotov, V.D.; Markova, T.N.; Imanaliev, M.I. Binary Phase Diagrams Based on Elements VIIIA and IB Periods of the D.I. Mendeleev’s Table and Features of Crystallographic Parameters. IOP Conf. Ser. Mater. Sci. Eng. 2017, 168, 012071. [Google Scholar] [CrossRef] [Green Version]
- Lubarda, V.A. On the effective lattice parameter of binary alloys. Mech. Mater. 2003, 35, 53–68. [Google Scholar] [CrossRef]
- King, H.W. Quantitative size-factors for metallic solid solutions. J. Mater. Sci. 1966, 1, 79–90. [Google Scholar] [CrossRef]
- Nemat-Nasser, S.; Hori, M. Micromechanics: Overall Properties of Heterogeneous Materials, 2nd ed.; Elsevier: Amsterdam, The Netherlands, 1999. [Google Scholar]
- Chung, D.-H. Elastic Moduli of Single Crystal and Polycrystalline MgO. Phil. Mag. 1963, 8, 833–841. [Google Scholar] [CrossRef]
- McAlister, A.J. Ag-Al (Silver-Aluminum). In Binary Alloy Phase Diagrams, 2nd ed.; Massalski, T.B., Ed.; ASM International: Materials Park, OH, USA, 1990; Volume 1, pp. 8–9. [Google Scholar]
- Pearson, W.B. Handbook of Lattice Spacings and Structures of Metals and Alloys; Pergamon Press: London, UK, 1958; Volume 1. [Google Scholar]
- Hultgren, R.; Desai, P.D.; Hawkins, D.T.; Gleiser, M.; Kelley, K.K. Selected Values of Thermodynamic Properties of Binary Alloys; American Society for Metals: Metal Park, OH, USA, 1973. [Google Scholar]
- Murray, J.L. Al-Cu (Aluminum-Copper). In Binary Alloy Phase Diagrams, 2nd ed.; Massalski, T.B., Ed.; ASM International: Materials Park, OH, USA, 1990; Volume 1, pp. 141–143. [Google Scholar]
- Okamoto, H. Al-Mg (Aluminum-Magnesium). J. Phase Equilib. 1998, 19, 598. [Google Scholar] [CrossRef]
- Liu, X.J.; Ohnuma, I.; Kainuma, R.; Ishida, K. Thermodynamic Assessment of the Aluminum-Manganese (Al-Mn) Binary Phase Diagram. J. Phase Equilib. 1999, 20, 45–56. [Google Scholar] [CrossRef]
- Schuster, J.C.; Palm, M. Reassessment of the Binary Aluminum-Titanium Phase Diagram. J. Phase Equilib. Diffus. 2006, 27, 255–277. [Google Scholar] [CrossRef]
- Okamoto, H. Al-Zn (Aluminum-Zinc). J. Phase Equilib. 1995, 16, 281–282. [Google Scholar] [CrossRef]
- Subrumanian, P.R.; Perepezko, J.H. The Ag-Cu (Silver-Copper) System. J. Phase Equilib. 1993, 14, 62–75. [Google Scholar] [CrossRef]
- Okamoto, H.; Chakrabarti, D.J.; Laughlin, D.E.; Massalski, T.B. Au-Cu (Gold-Copper). In Binary Alloy Phase Diagrams, 2nd ed.; Massalski, T.B., Ed.; ASM International: Materials Park, OH, USA, 1990; Volume 1, pp. 358–362. [Google Scholar]
- Amara, S.E.; Belhadj, A.; Kesri, R.; Hamar-Thibault, S. Stable and Metastable Equilibria in the Binary Fe-Cu and Ternary Fe-Cu-C systems. Z. Metallkd. 1999, 90, 116–123. [Google Scholar]
- Chakrabarti, D.J.; Laughlin, D.E.; Chen, S.W.; Chang, Y.A. Cu-Ni (Copper-Nickel). In Binary Alloy Phase Diagrams, 2nd ed.; Massalski, T.B., Ed.; ASM International: Materials Park, OH, USA, 1990; Volume 1, pp. 1442–1446. [Google Scholar]
- Miodownik, A.P. Cu-Zn (Copper-Zinc). In Binary Alloy Phase Diagrams, 2nd ed.; Massalski, T.B., Ed.; ASM International: Materials Park, OH, USA, 1990; Volume 1, pp. 1508–1510. [Google Scholar]
- Nishizawa, T.; Ishida, K. Co-Fe (Cobalt-Iron). In Binary Alloy Phase Diagrams, 2nd ed.; Massalski, T.B., Ed.; ASM International: Materials Park, OH, USA, 1990; Volume 1, pp. 1186–1187. [Google Scholar]
- Okamoto, H. Cr-Fe (Chromium-Iron). In Binary Alloy Phase Diagrams, 2nd ed.; Massalski, T.B., Ed.; ASM International: Materials Park, OH, USA, 1990; Volume 1, pp. 1271–1273. [Google Scholar]
- Smith, J.F. Fe-V (Iron-Vanadium). In Binary Alloy Phase Diagrams, 2nd ed.; Massalski, T.B., Ed.; ASM International: Materials Park, OH, USA, 1990; Volume 1, pp. 1787–1791. [Google Scholar]
- Okamoto, H.; Massalski, T.B. Ag-Au (Silver-Gold). In Binary Alloy Phase Diagrams, 2nd ed.; Massalski, T.B., Ed.; ASM International: Materials Park, OH, USA, 1990; Volume 1, pp. 12–13. [Google Scholar]
- Nayeb Hashemi, A.A.; Clark, J.B. Ag-Mg (Silver-Magnesium). In Binary Alloy Phase Diagrams, 2nd ed.; Massalski, T.B., Ed.; ASM International: Materials Park, OH, USA, 1990; Volume 1, pp. 55–57. [Google Scholar]
- Moser, Z.; Gasior, W.; Wypartowicz, J.; Zabdyr, L. Cd-Mg (Cadmium-Magnesium). In Binary Alloy Phase Diagrams, 2nd ed.; Massalski, T.B., Ed.; ASM International: Materials Park, OH, USA, 1990; Volume 1, pp. 995–996. [Google Scholar]
- Olesinski, R.W.; Abbaschian, G.J. Ge-Si (Germanium-Silicon). In Binary Alloy Phase Diagrams, 2nd ed.; Massalski, T.B., Ed.; ASM International: Materials Park, OH, USA, 1990; Volume 1, pp. 2000–2001. [Google Scholar]
- Krishnan, R.; Garg, S.P.; Krishnamurthy, N. Nb-Ta (Niobium-Tantalum). In Binary Alloy Phase Diagrams, 2nd ed.; Massalski, T.B., Ed.; ASM International: Materials Park, OH, USA, 1990; Volume 1, pp. 2772–2773. [Google Scholar]
- Fetch, H.J.; Perepezko, J.H. Metastable Phase Equilibria in the Lead-Tin Alloy System: Part I. Experimental. Metall. Trans. A 1989, 20, 785–794. [Google Scholar] [CrossRef]
- Saunders, N.; Argent, B.B. On the α->β transformation in Ti-Zr alloys. J. Less Common Met. 1986, 125, L11–L13. [Google Scholar] [CrossRef]
- Naidu, S.V.N.; Sriramamurthy, A.M.; Rama Rao, P. Cr-W (Chromium-Tungsten). In Binary Alloy Phase Diagrams, 2nd ed.; Massalski, T.B., Ed.; ASM International: Materials Park, OH, USA, 1990; Volume 1, pp. 1353–1354. [Google Scholar]
- Ponomareva, A.V.; Ruban, A.V.; Vekilova, O.; Yu Simak, S.I.; Abrikosov, I.A. Effect of Pressure on Phase Stability in Fe-Cr Alloys. Phys. Rev. B 2011, 84, 094422. [Google Scholar] [CrossRef] [Green Version]
- Hume-Rothery, W.; Raynor, G.V. The Equilibrium and Lattice-Spacing Relations in the System Magnesium-Cadmium. Proc. R. Soc. 1940, A174, 471–486. [Google Scholar] [CrossRef] [Green Version]
- Leung, C.H.; Scott, M.J.; Young, W.H. Thermodynamic Properties of Solid Alloys: Application to MgxCd1-x. J. Phys. F Metal. Phys. 1976, 6, 1039–1051. [Google Scholar] [CrossRef]
- Hasegawa, M.; Young, W.H. Pseudopotential Theory of the Solid-Liquid Transition in Binary Alloys: Applications to CdxMg1-x and NaxK1-x. J. Phys. F Metal. Phys. 1977, 7, 2271–2283. [Google Scholar] [CrossRef]
- Hasegawa, M.; Young, W.H. Entropy-Volume Correlation for Some Homovalent Disordered solid Alloys. J. Phys. F Metal. Phys. 1978, 8, 1105–1117. [Google Scholar] [CrossRef]
- Landa, A.I.; Psahie, S.G.; Panin, V.E.; Zhorovkov, M.F. Vegard’s Rule for the Equilibrium Volume of Solid Solutions. Izv. Vyssh. Uchebnykh Zaved. Fiz. 1981, 24, 118–120. [Google Scholar]
- Landa, A.I.; Yuryev, A.A.; Ruban, A.V.; Gurskaya, E.G.; Kovnersityi, Y.K.; Vatolin, N.A. Pseudopotential Calculation of Thermodynamic Properties and Glass Transition Temperatures of Binary Ni-Al Alloys. J. Phys. Condens. Matter 1991, 3, 9229–9243. [Google Scholar] [CrossRef]
- Jacob, K.T.; Raj, S.; Rannesh, L. Vegard’s Law: A Fundamental Relation or an Approximation? Int. J. Mater. Res. 2007, 98, 776–779. [Google Scholar] [CrossRef] [Green Version]


Publisher’s Note: MDPI stays neutral with regard to jurisdictional claims in published maps and institutional affiliations. |
© 2021 by the authors. Licensee MDPI, Basel, Switzerland. This article is an open access article distributed under the terms and conditions of the Creative Commons Attribution (CC BY) license (https://creativecommons.org/licenses/by/4.0/).