
Improving Bridge Expansion and Contraction Installation Replacement Decision System Using Hybrid Chaotic Whale Optimization Algorithm


Abstract
:1. Introduction
2. Objective
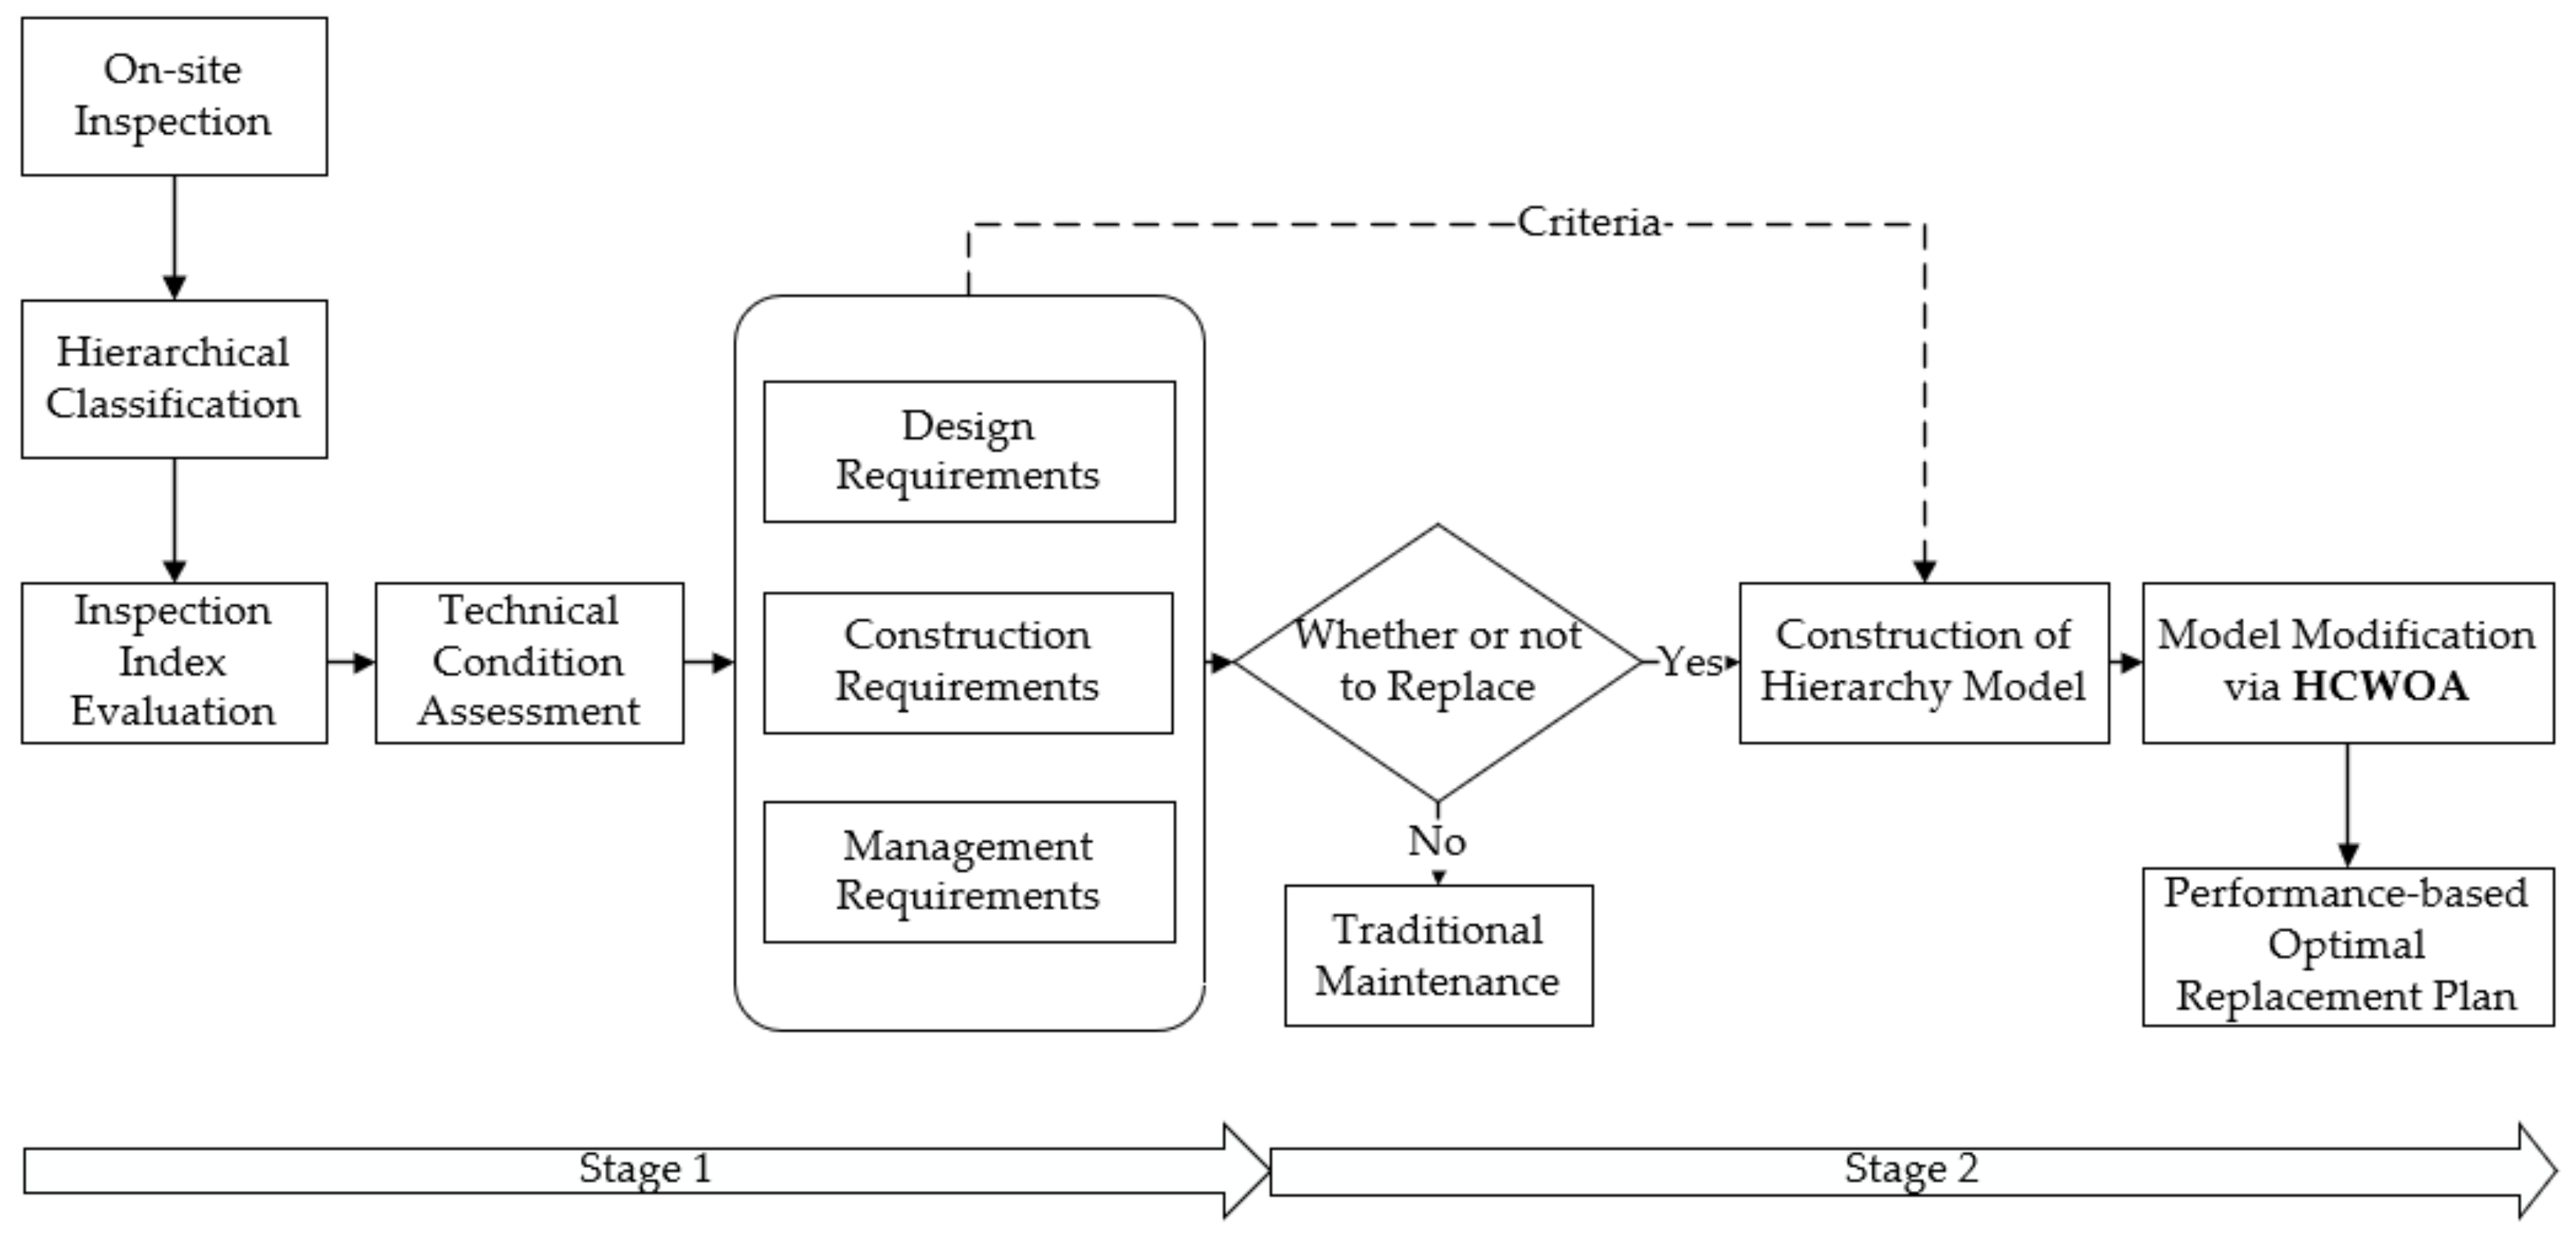
3. Methodology
3.1. Technical Condition Assessment
3.1.1. Hierarchical Classification
3.1.2. Inspection Index Evaluation
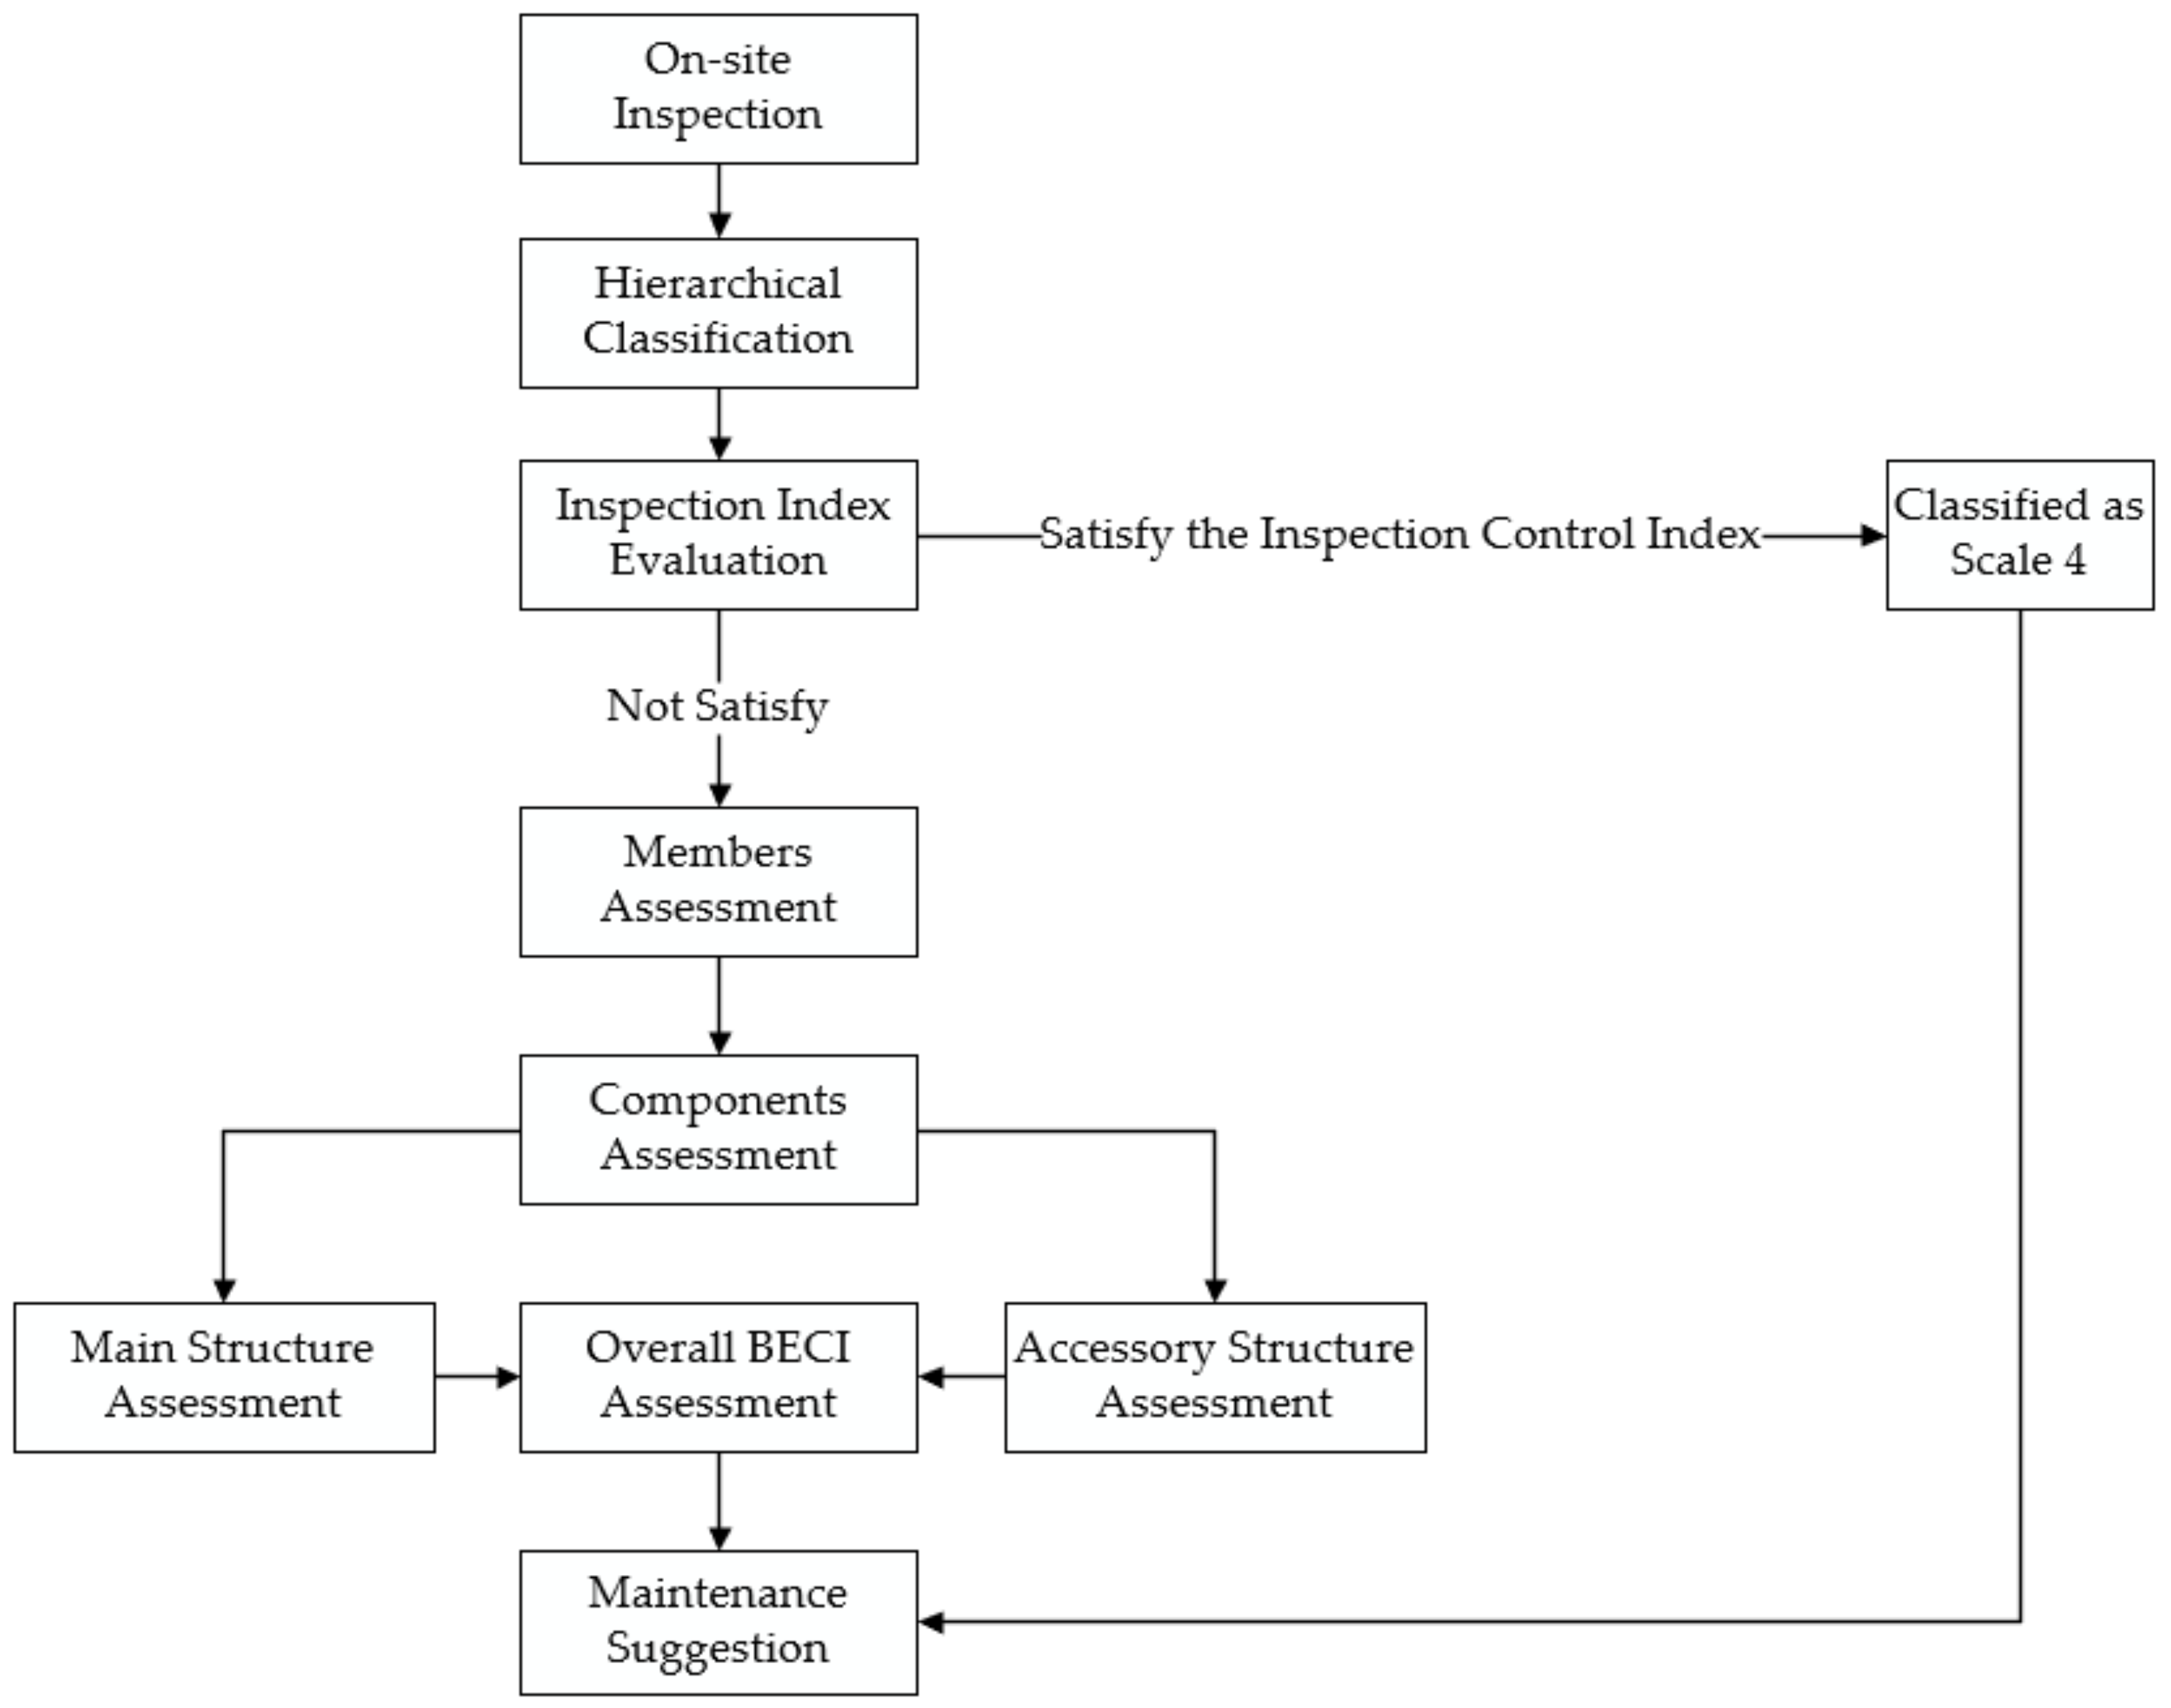
3.1.3. Calculation of Progressive Assessment
- Technical condition assessment of BECI members
- 2.
- Technical condition assessment of BECI components
- 3.
- Technical condition assessment of BECI main structure and accessory structure
- 4.
- Technical condition assessment of overall BECI
- 5.
- Technical condition scale classification of BECI
- 6.
- Inspection control index of BECI
- More than 2 fractures occur in side beam or intermediate beam;
- The damaged area of comb plate exceeds 30% and more than 3 defective units occur;
- The damaged area of elastic expansion body exceeds 30%.
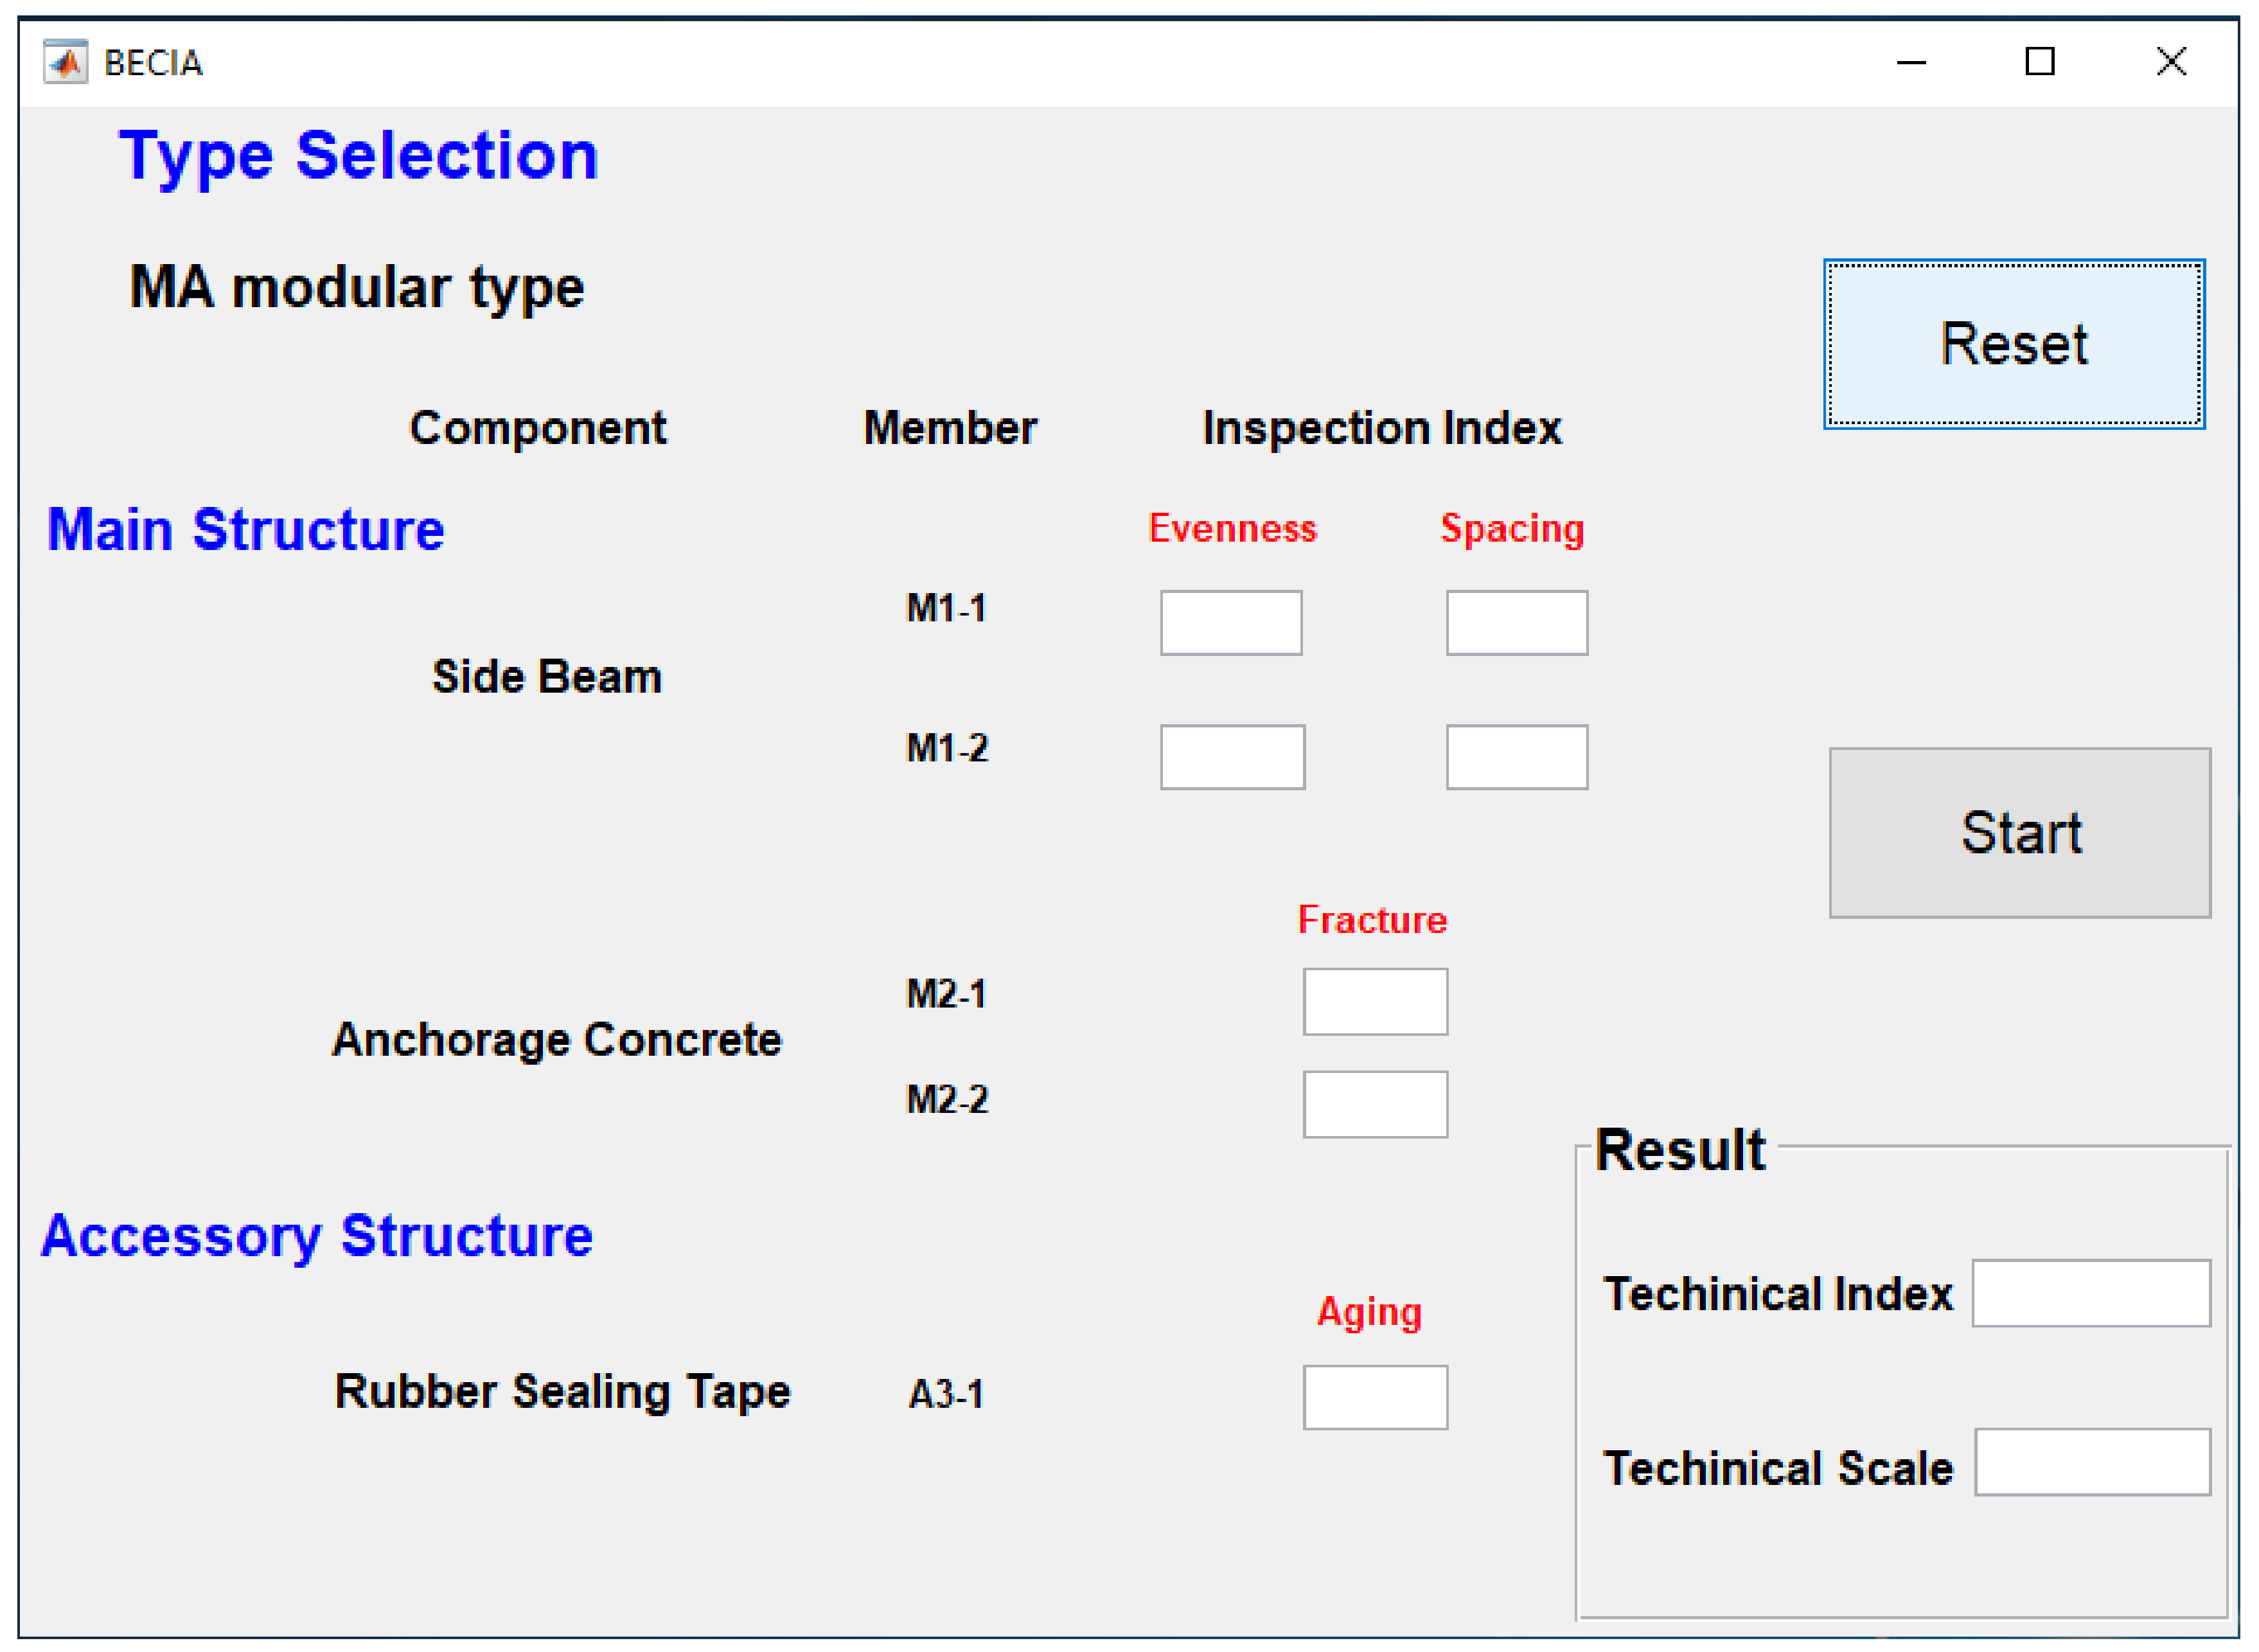
3.1.4. Software Development
3.2. Selection of Replacement Plan Using Hybrid Chaotic Whale Optimization Algorithm
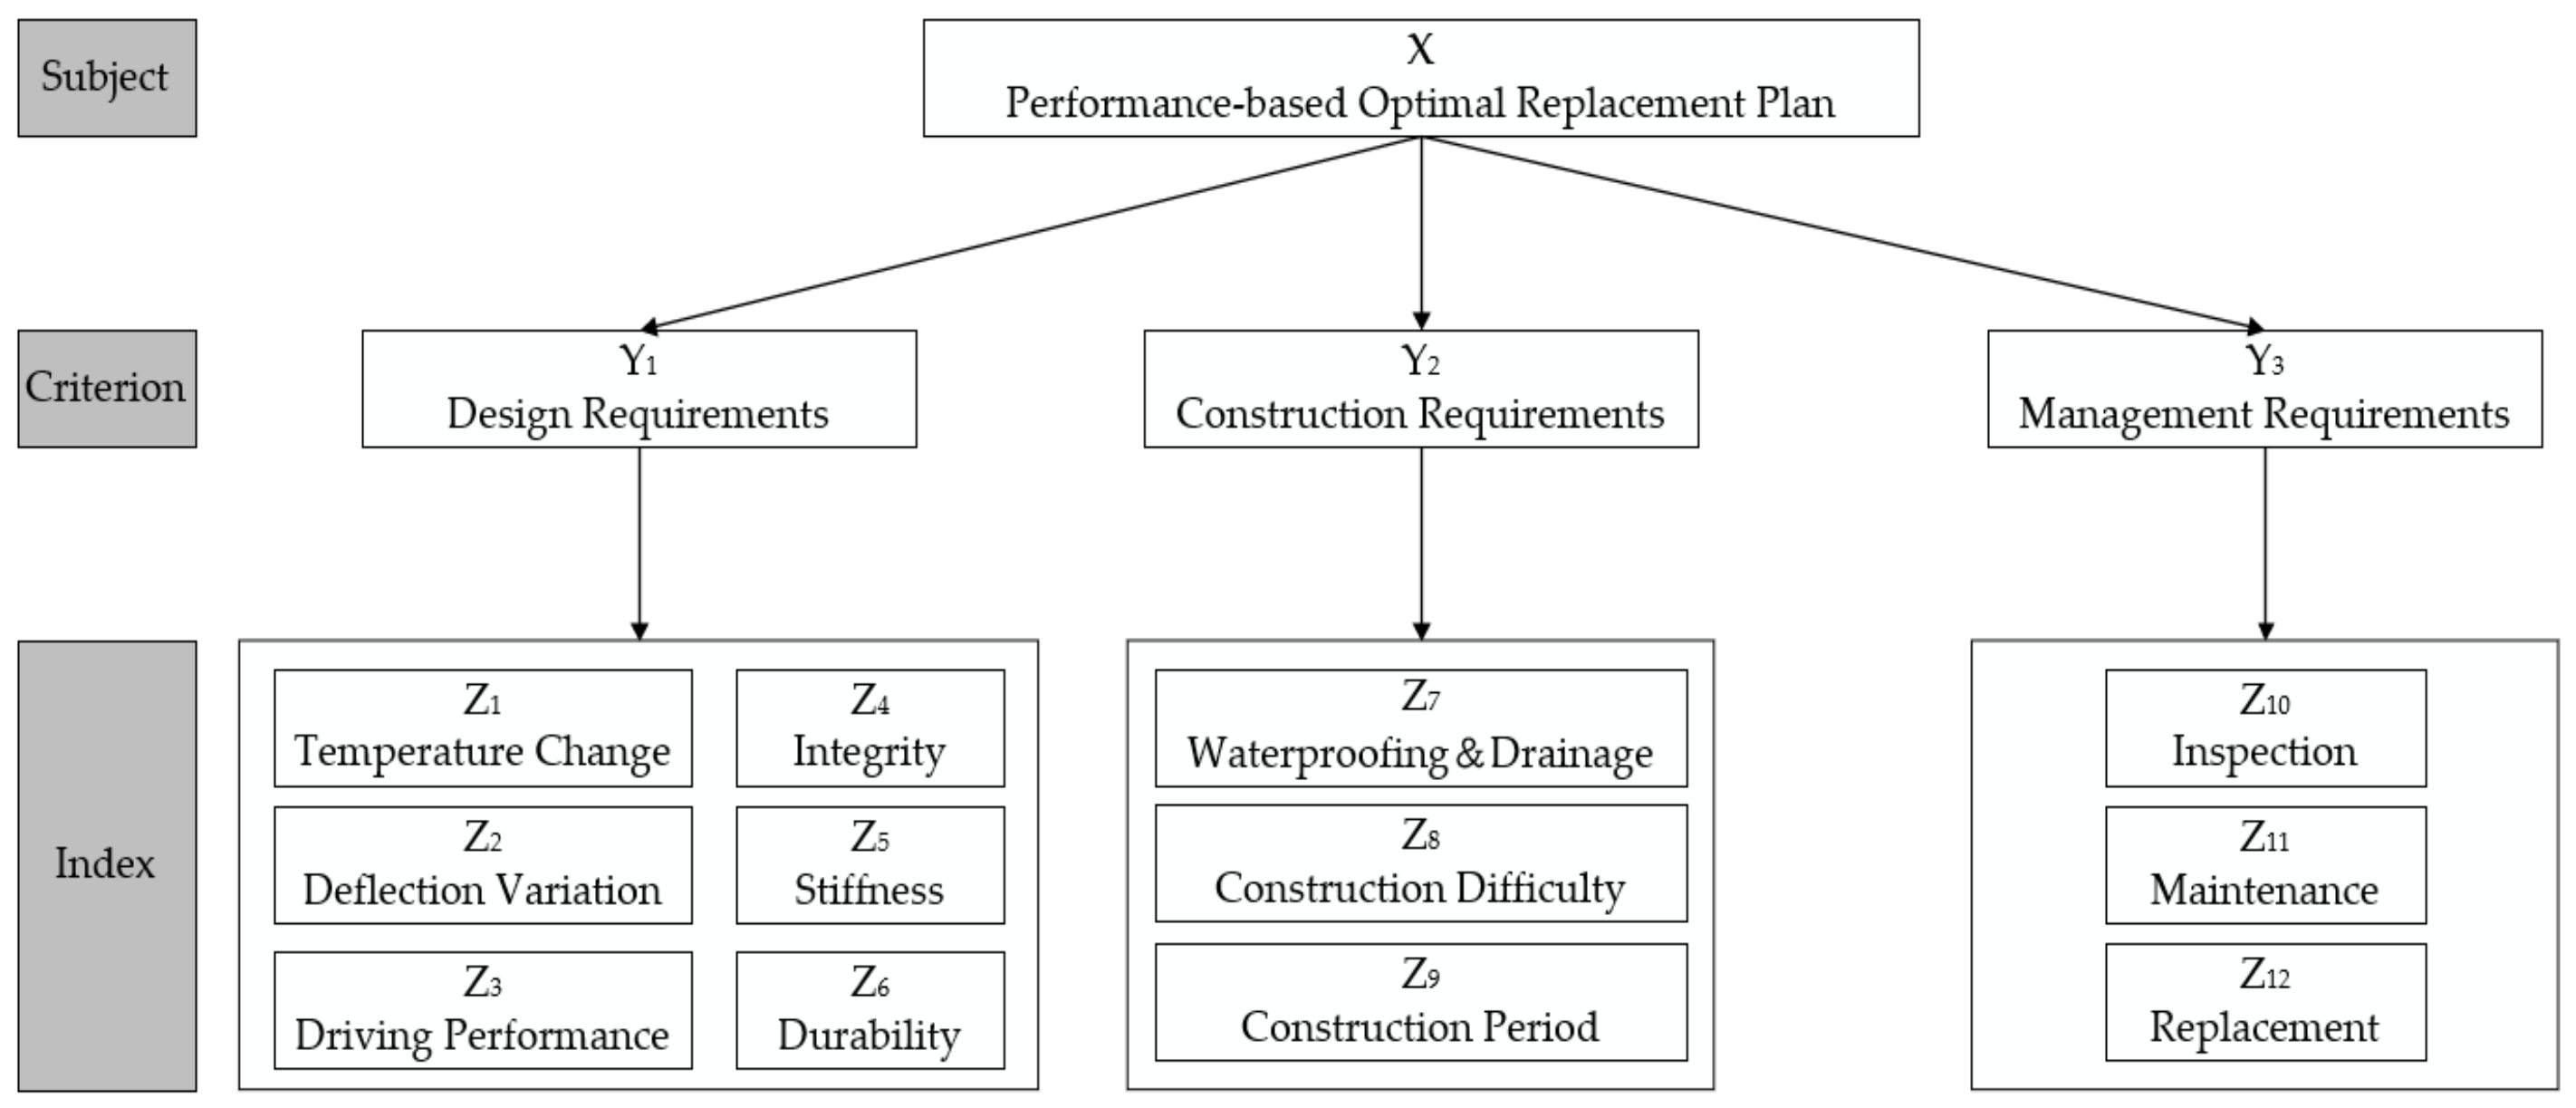
3.2.1. Analytic Hierarchy Process
3.2.2. Modification Strategy of Inconsistent Comparison Matrix
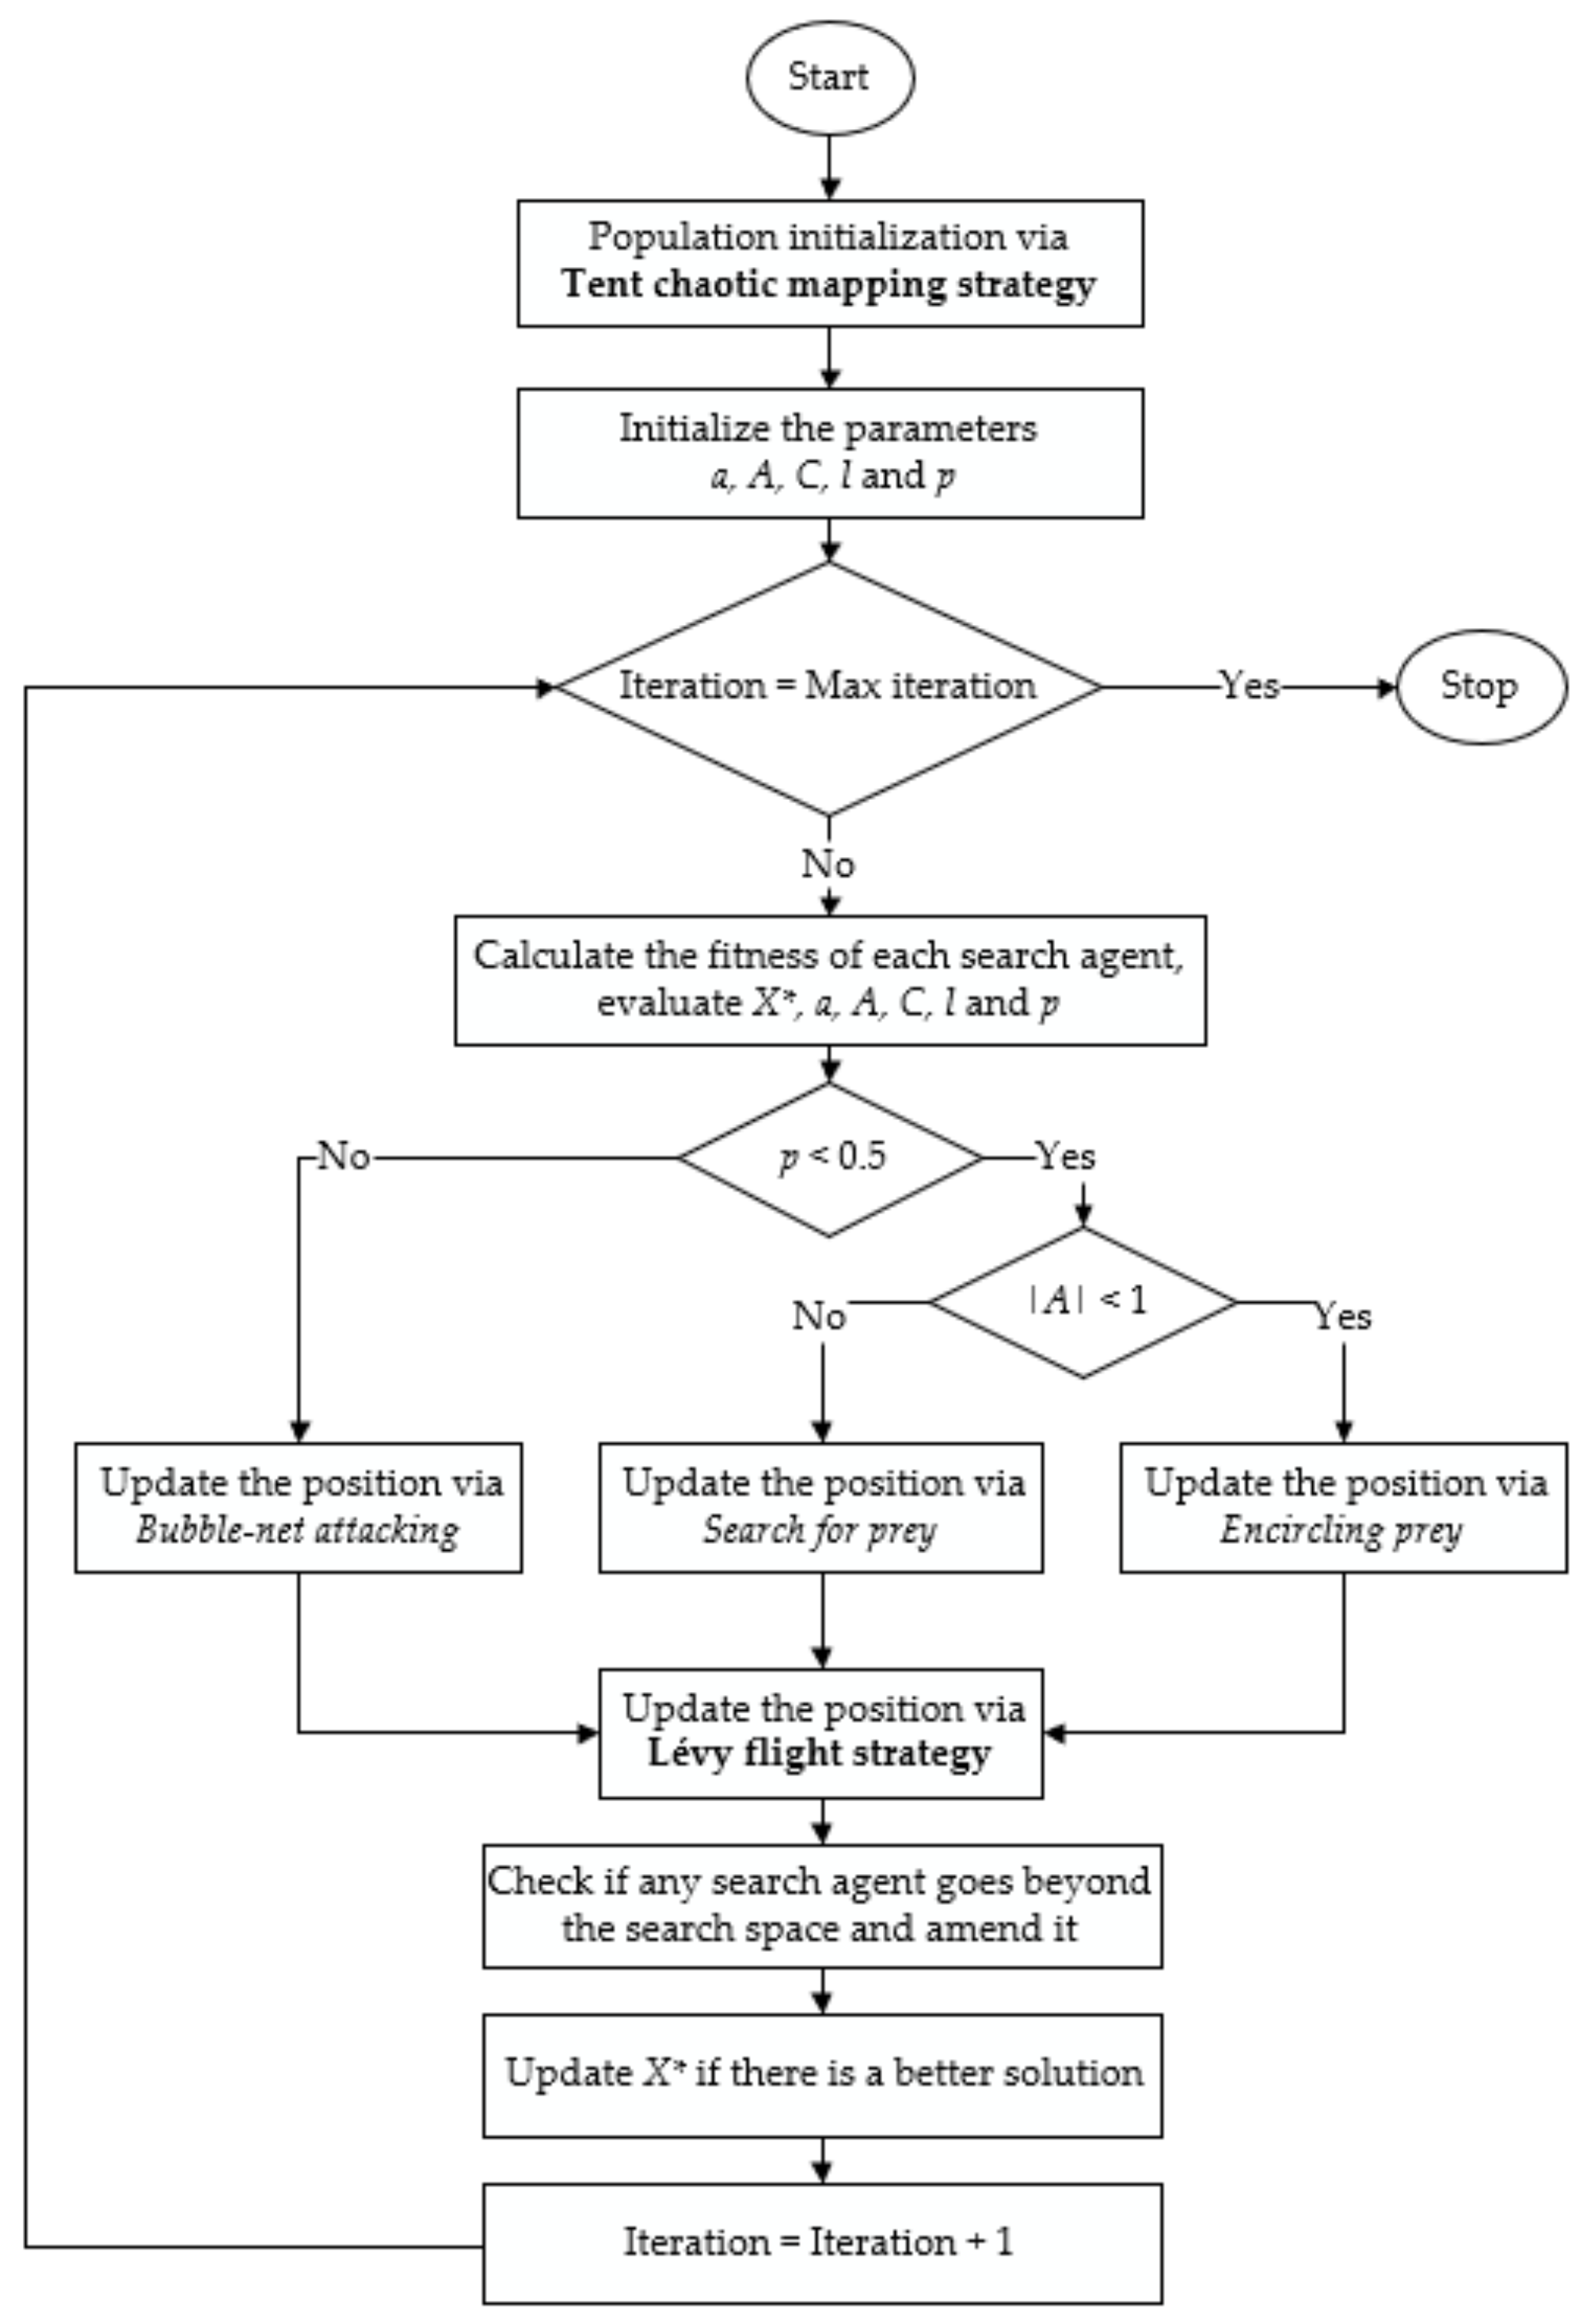
3.2.3. Hybrid Chaotic Whale Optimization Algorithm
- Standard whale optimization algorithm.
- Encircling prey.
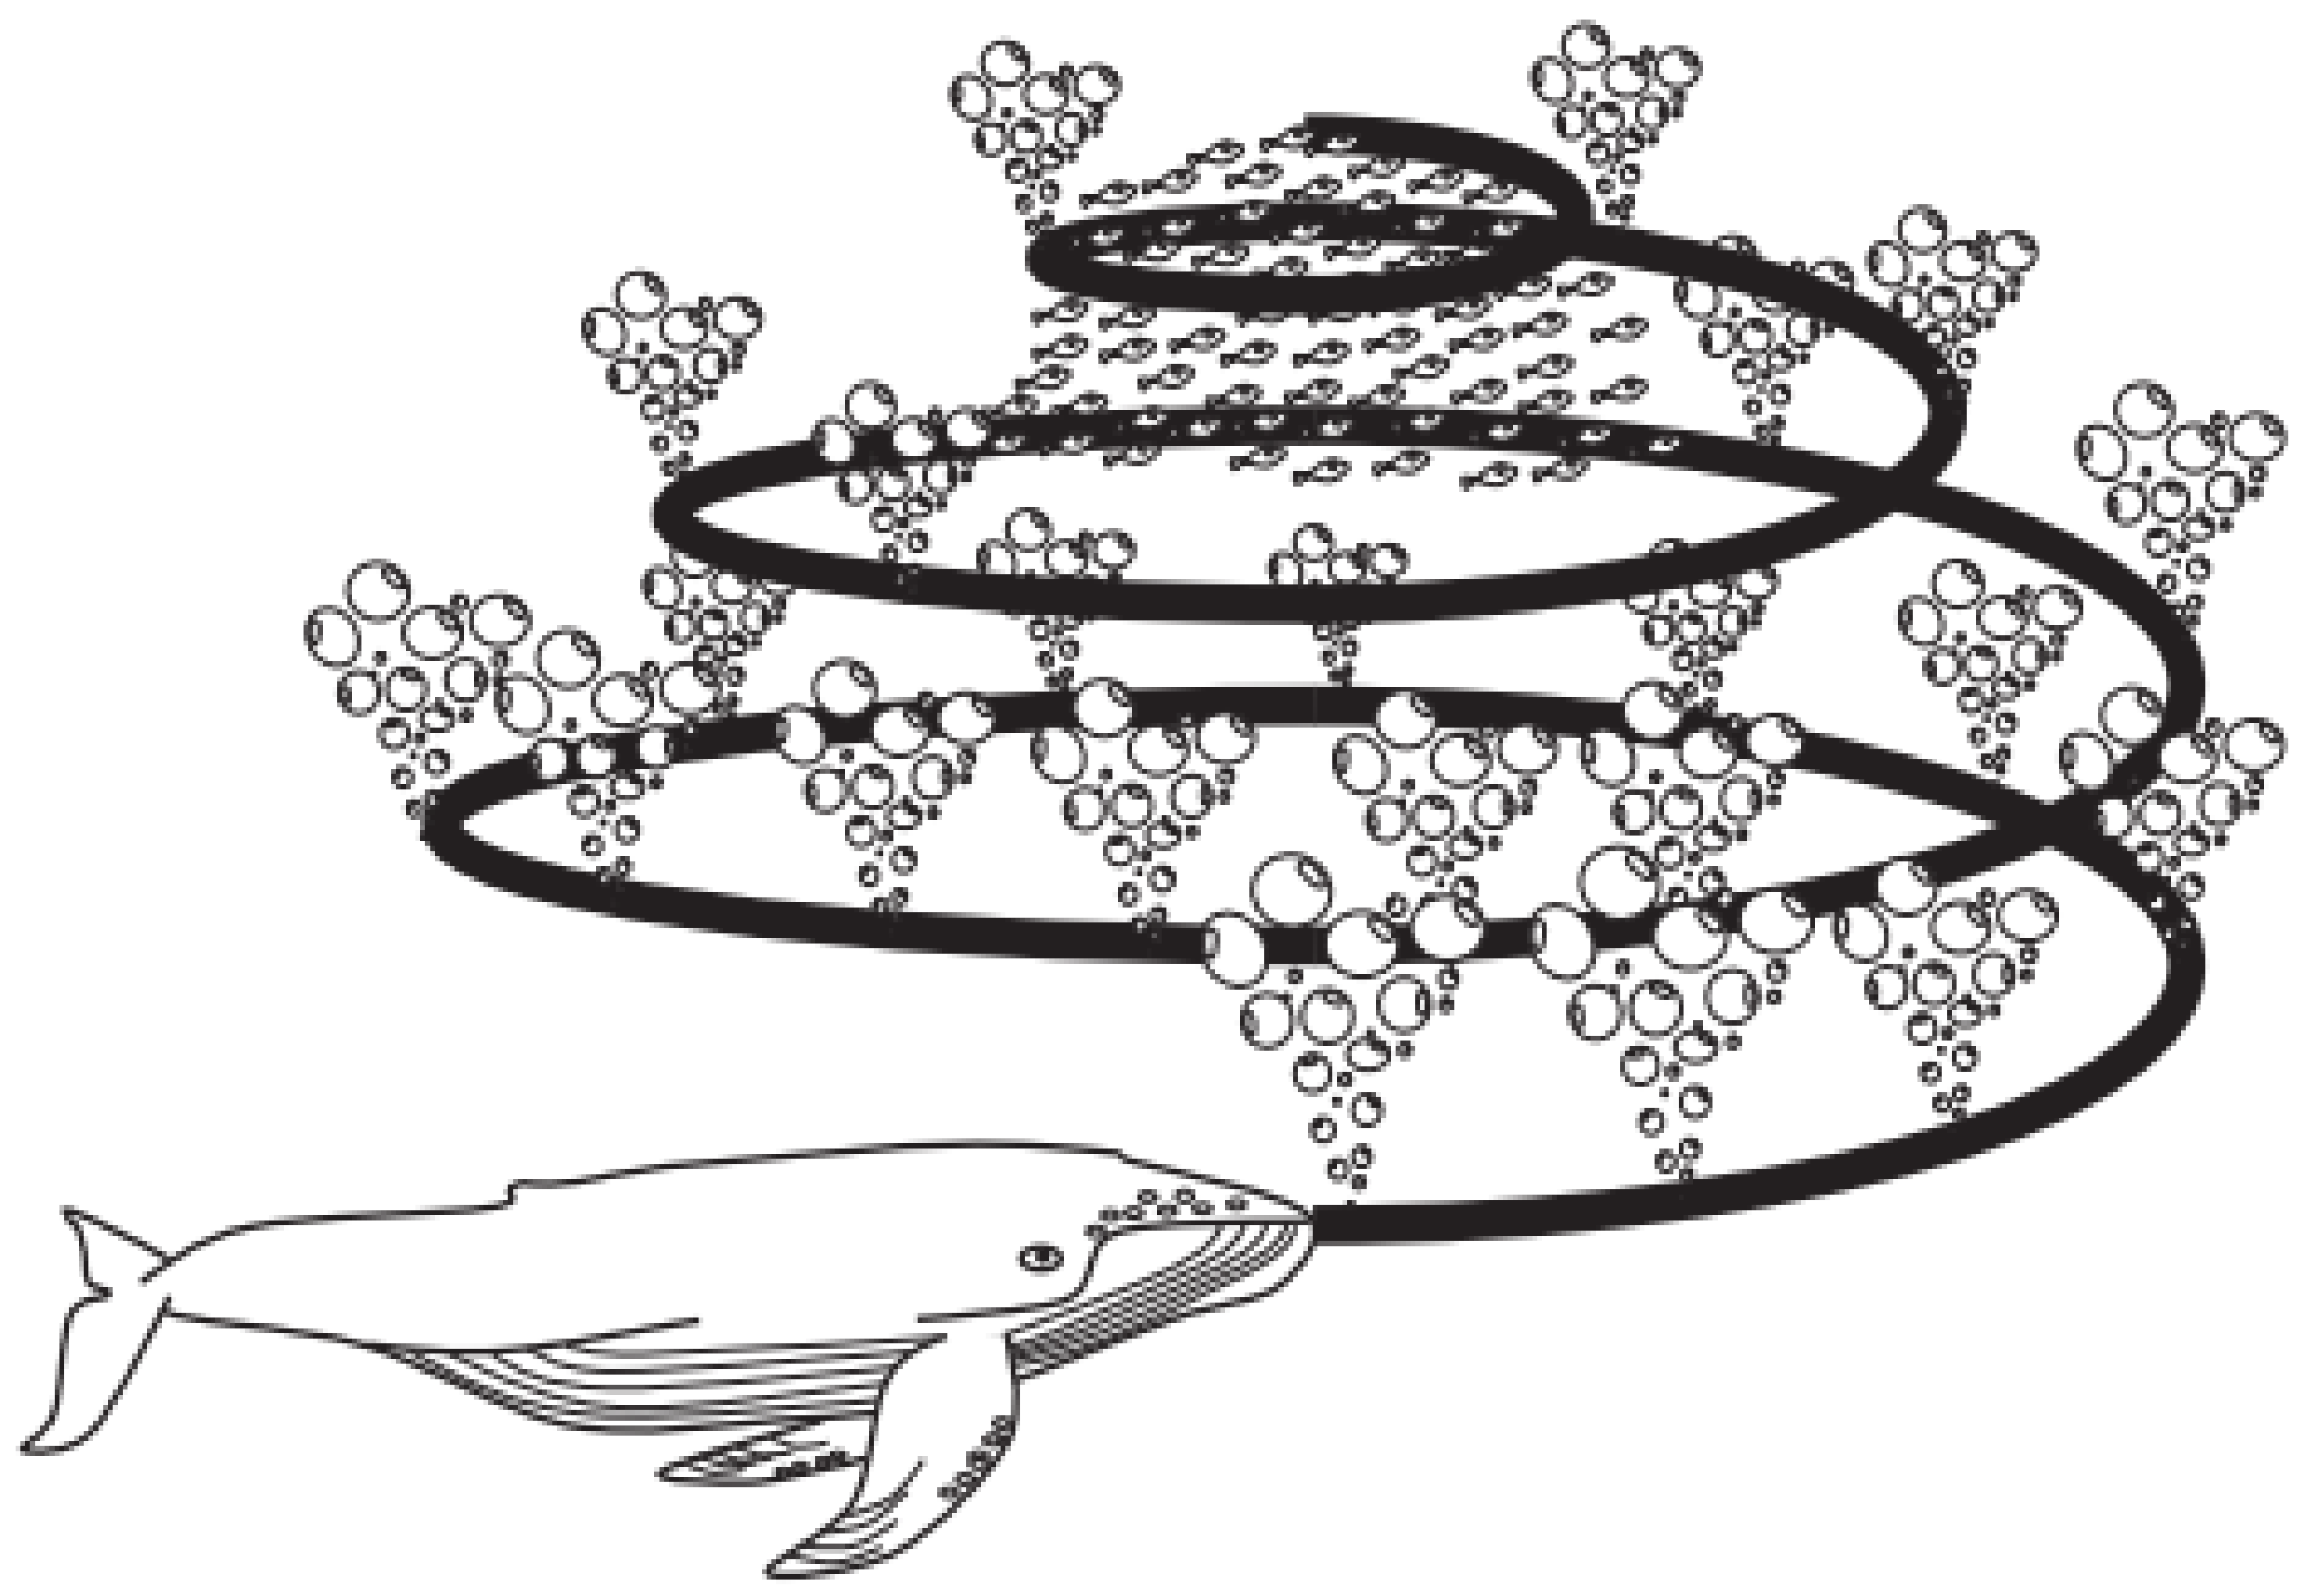
- Bubble-net attacking (exploitation phase).
- Search for prey (exploration phase).
- 2.
- Tent chaotic mapping strategy.
- 3.
- Lévy flight strategy.
3.2.4. Performance Coefficient Determination
4. Case Study
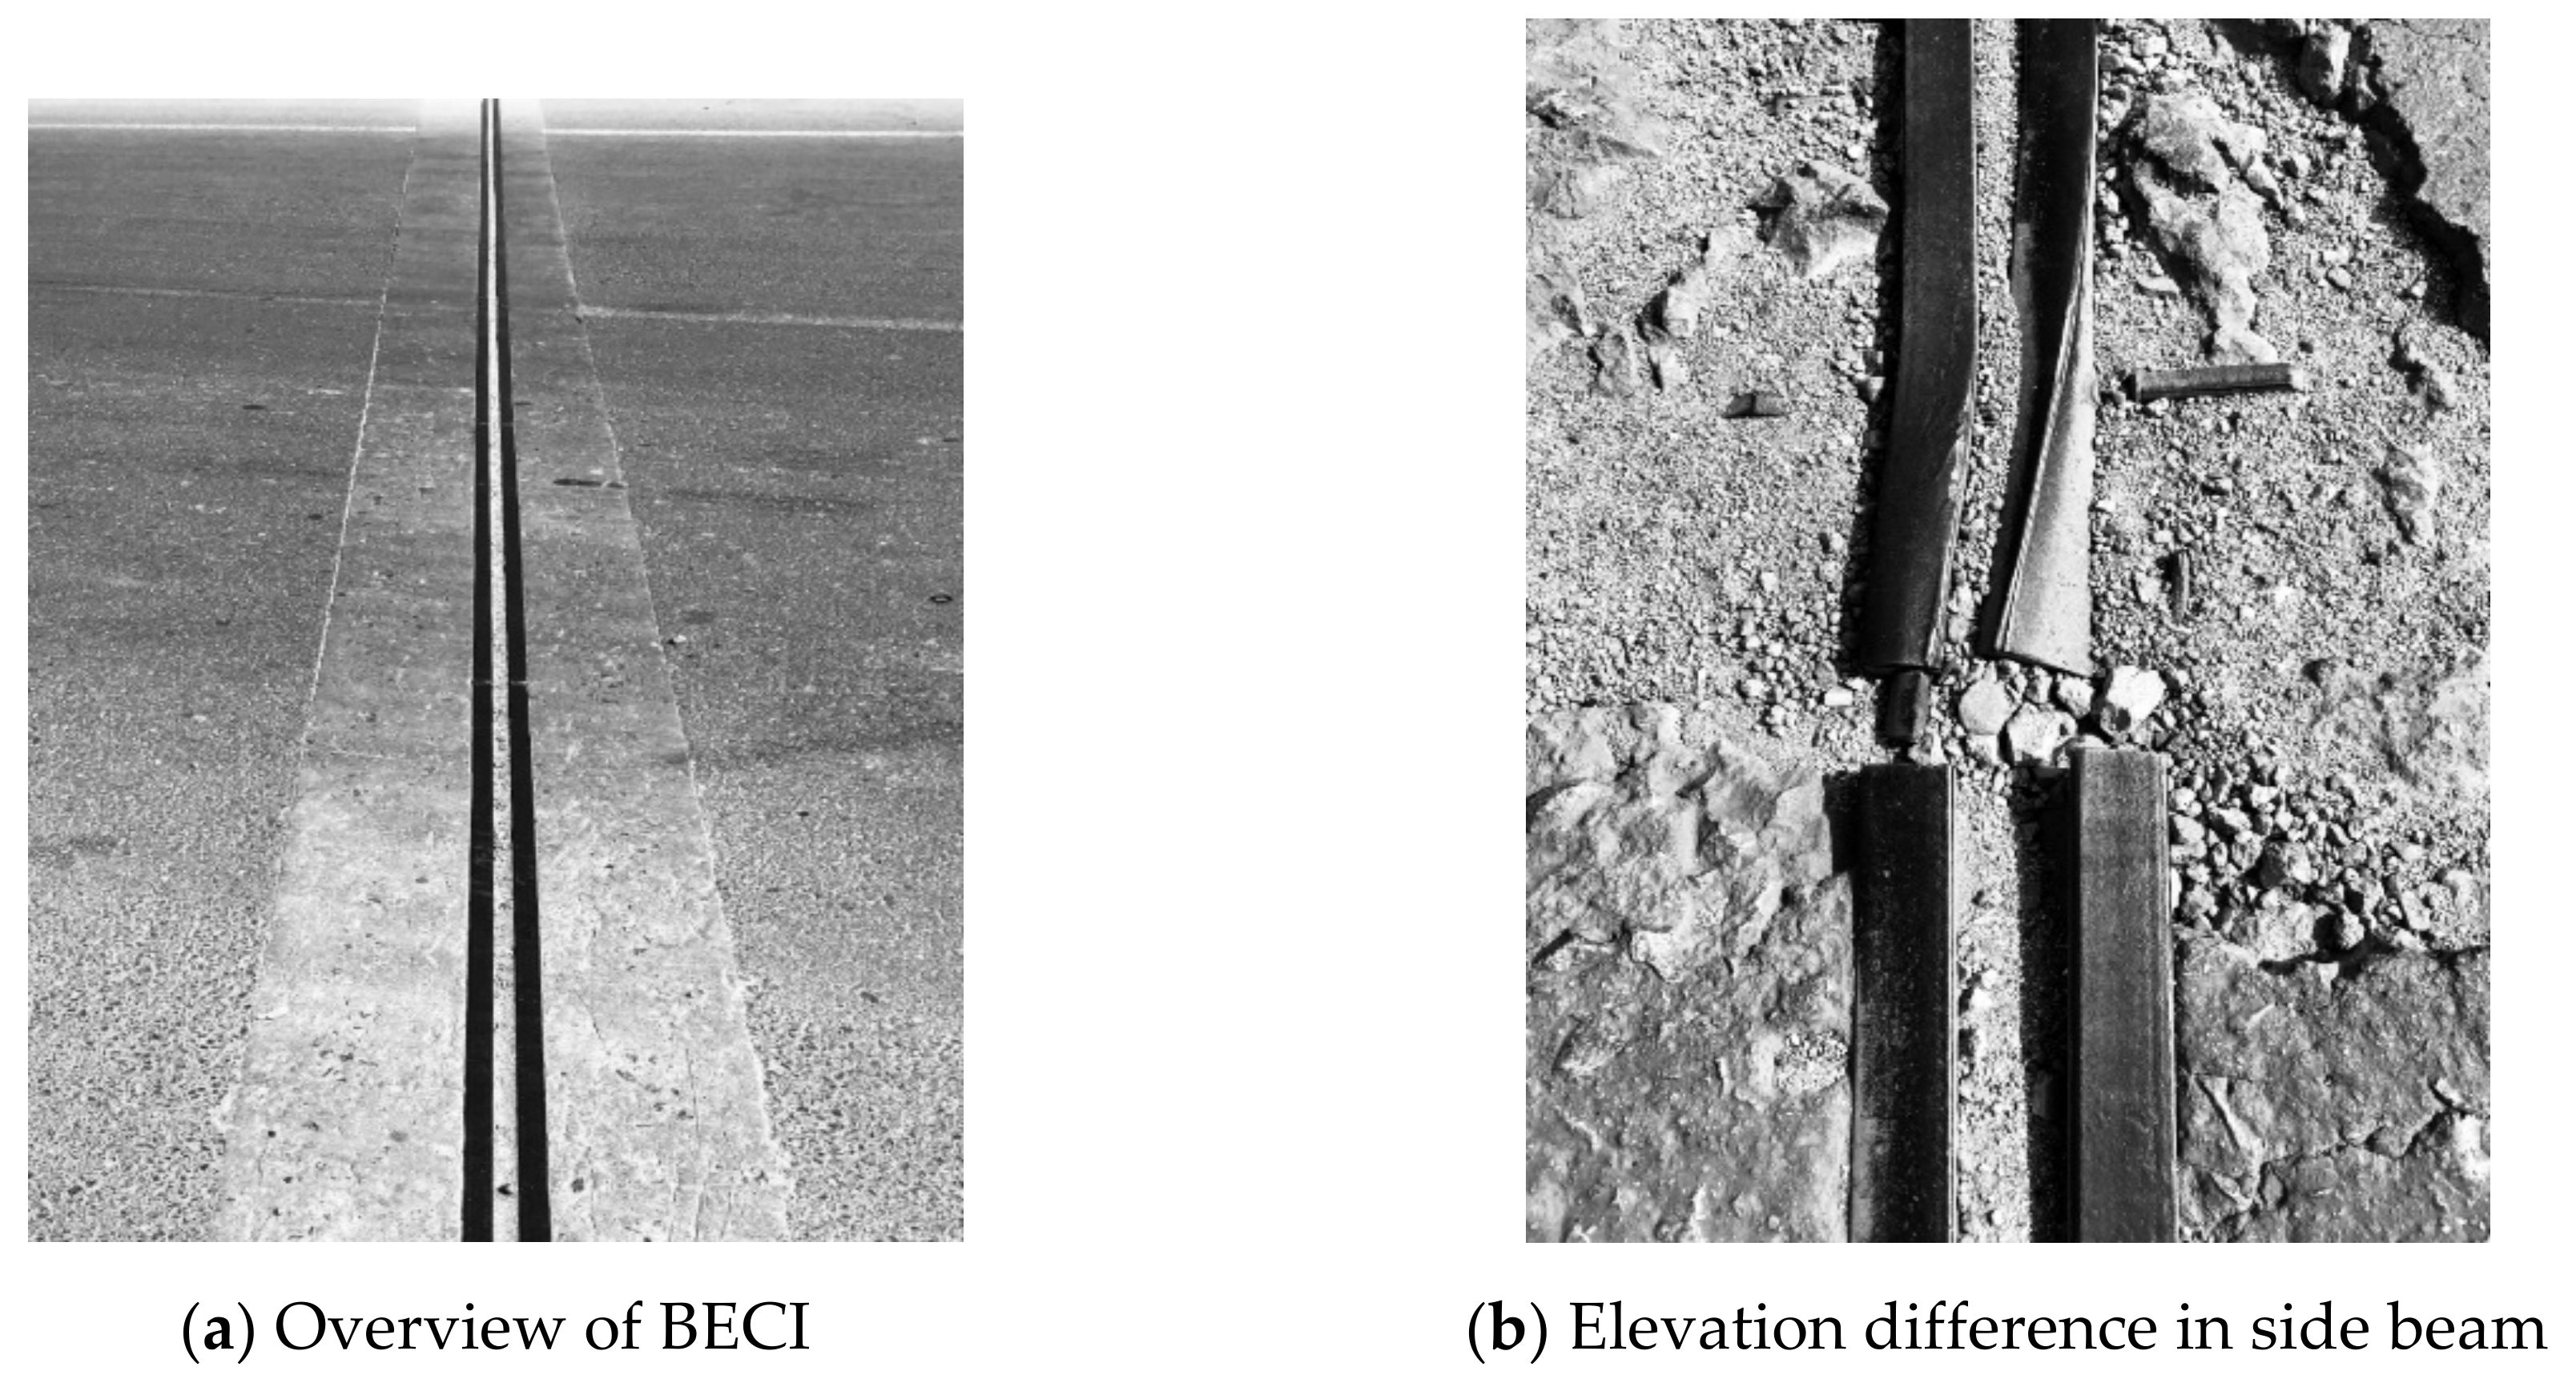
4.1. Research Background
4.2. Technical Condition Assessment
4.2.1. Inspection Index Evaluation
4.2.2. Calculation of Progressive Assessment
- Technical condition assessment of BECI members.
- Members of side beam.
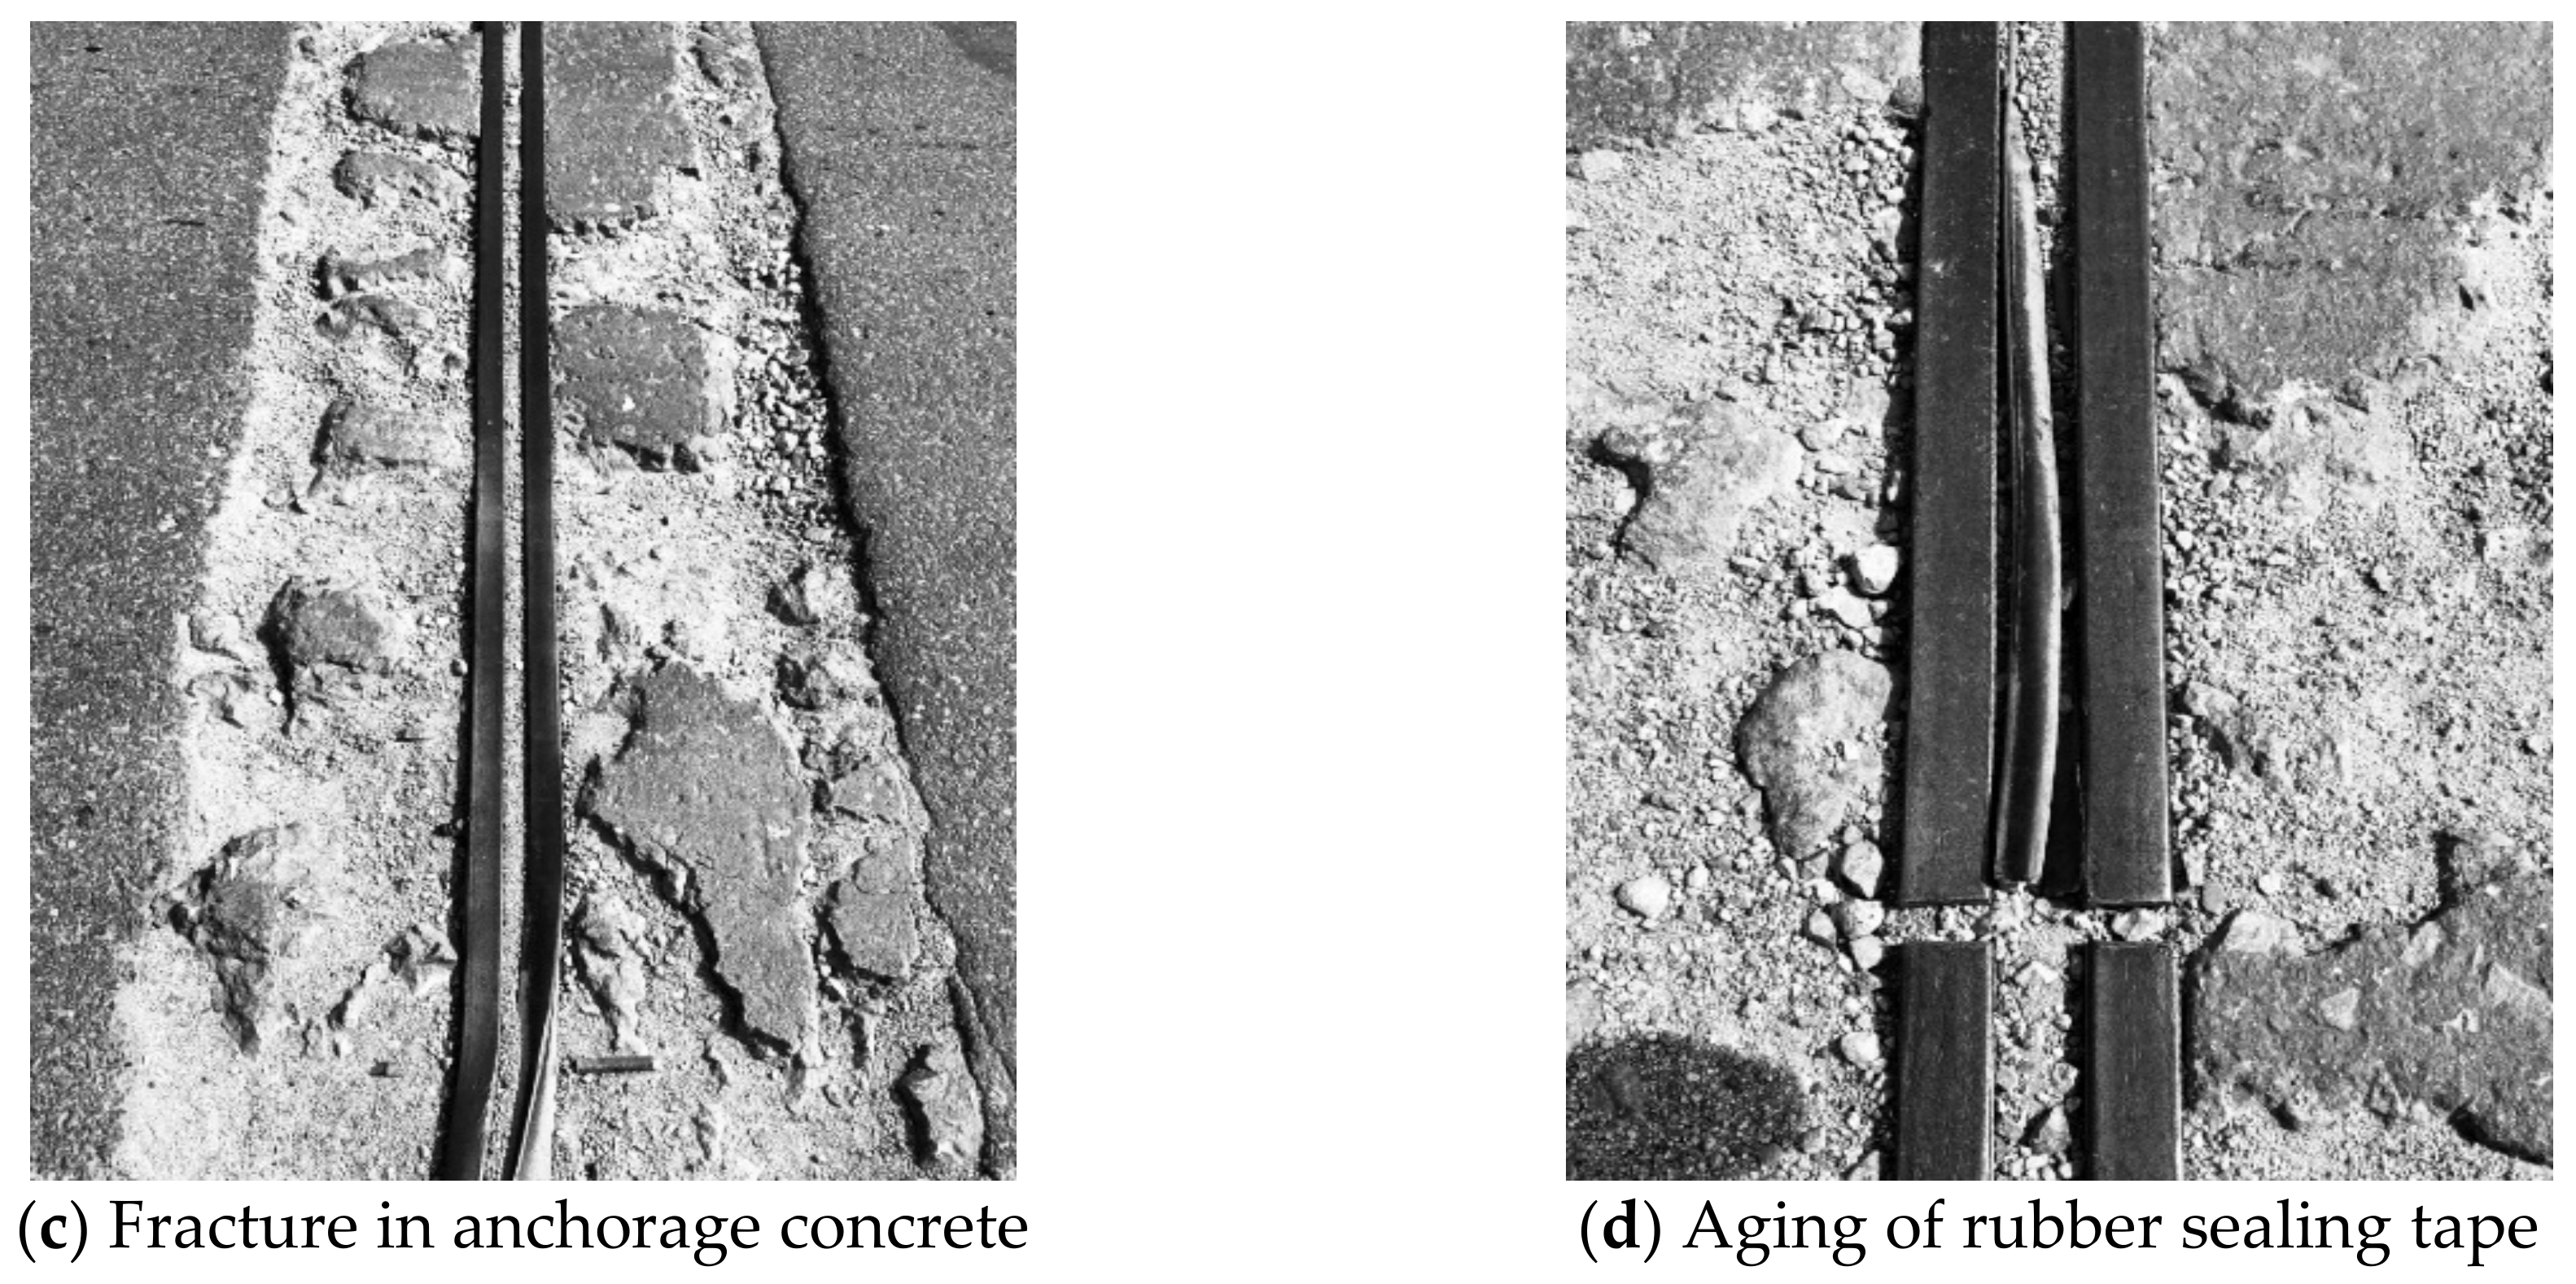
- Members of anchorage concrete.
- Members of rubber sealing tape.
- 2.
- Technical condition assessment of BECI components.
- Side beam.
- Anchorage concrete.
- Rubber sealing tape.
- 3.
- Technical condition assessment of BECI main structure and accessory structure.
- 4.
- Technical condition assessment of overall BECI.
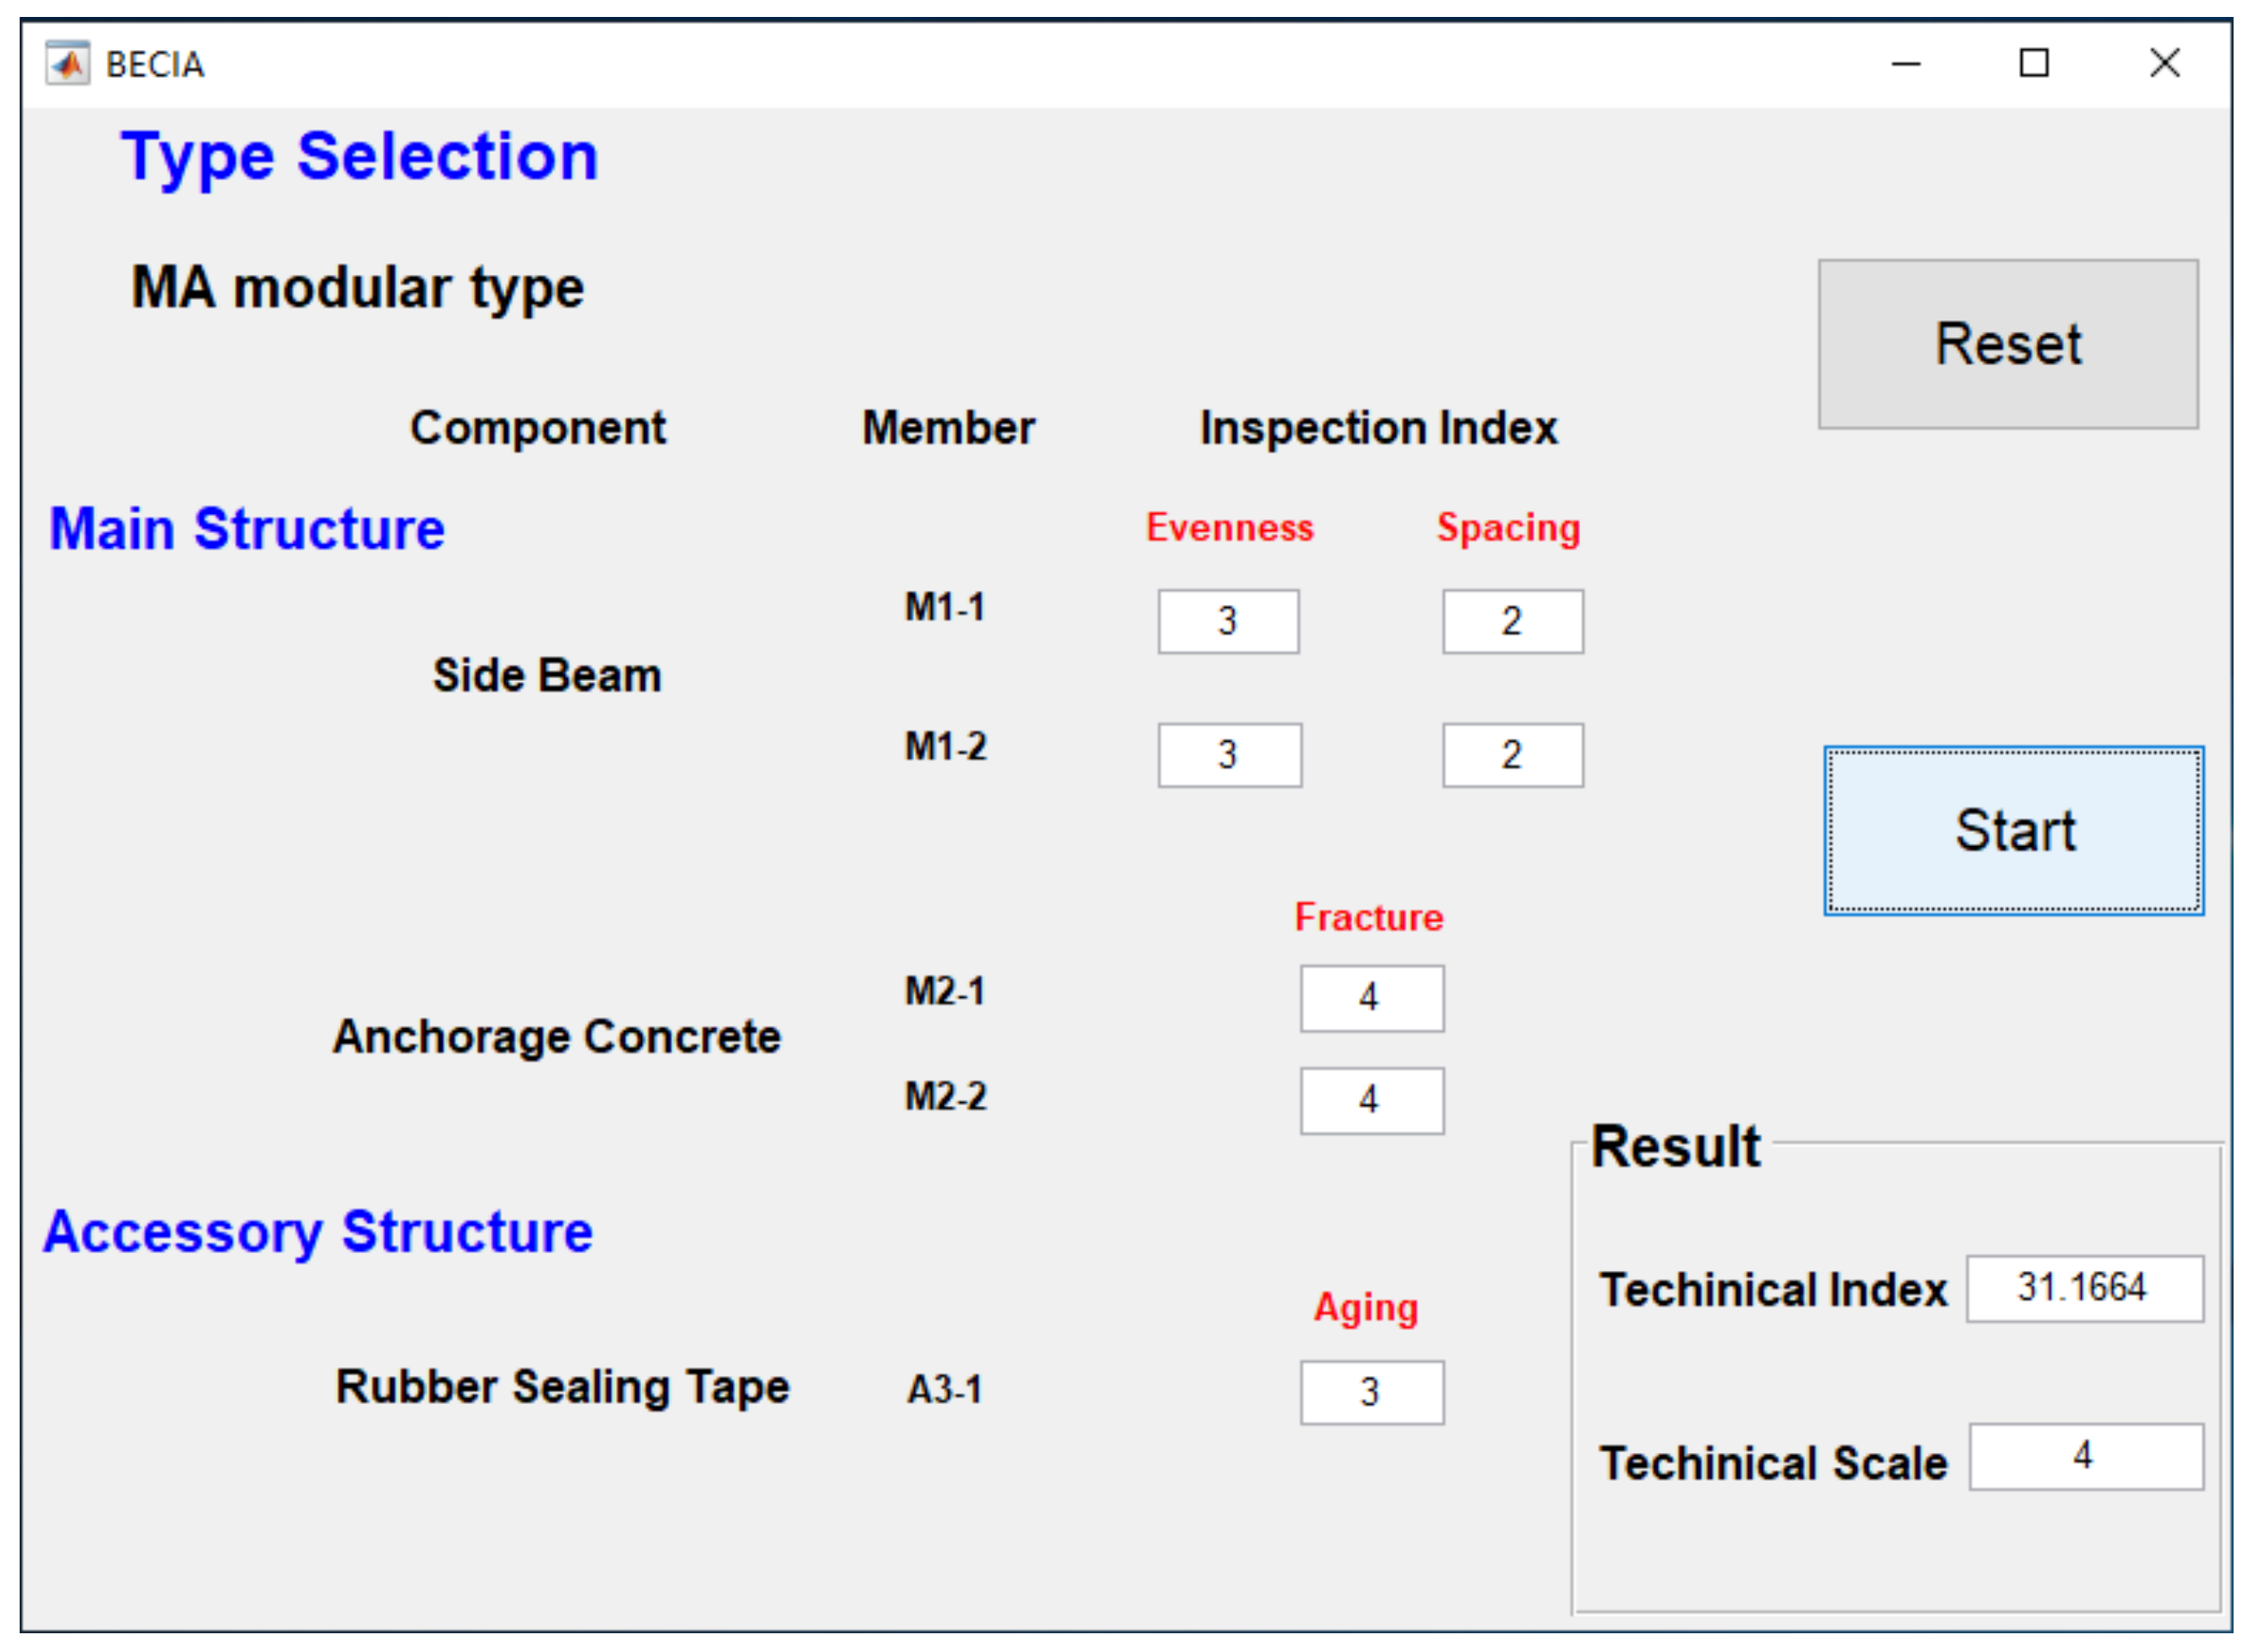
4.2.3. Operation of BECIA Software
4.3. Selection of Replacement Plan
- Plan A: MA modular type with the allowable expansion amount from 20 mm to 80 mm.
- Plan B: SC comb plate type with the allowable expansion amount from 60 mm to 240 mm.
4.3.1. Construction of Comparison Matrix
4.3.2. Modification of Inconsistent Comparison Matrix
4.3.3. Performance Coefficient Determination
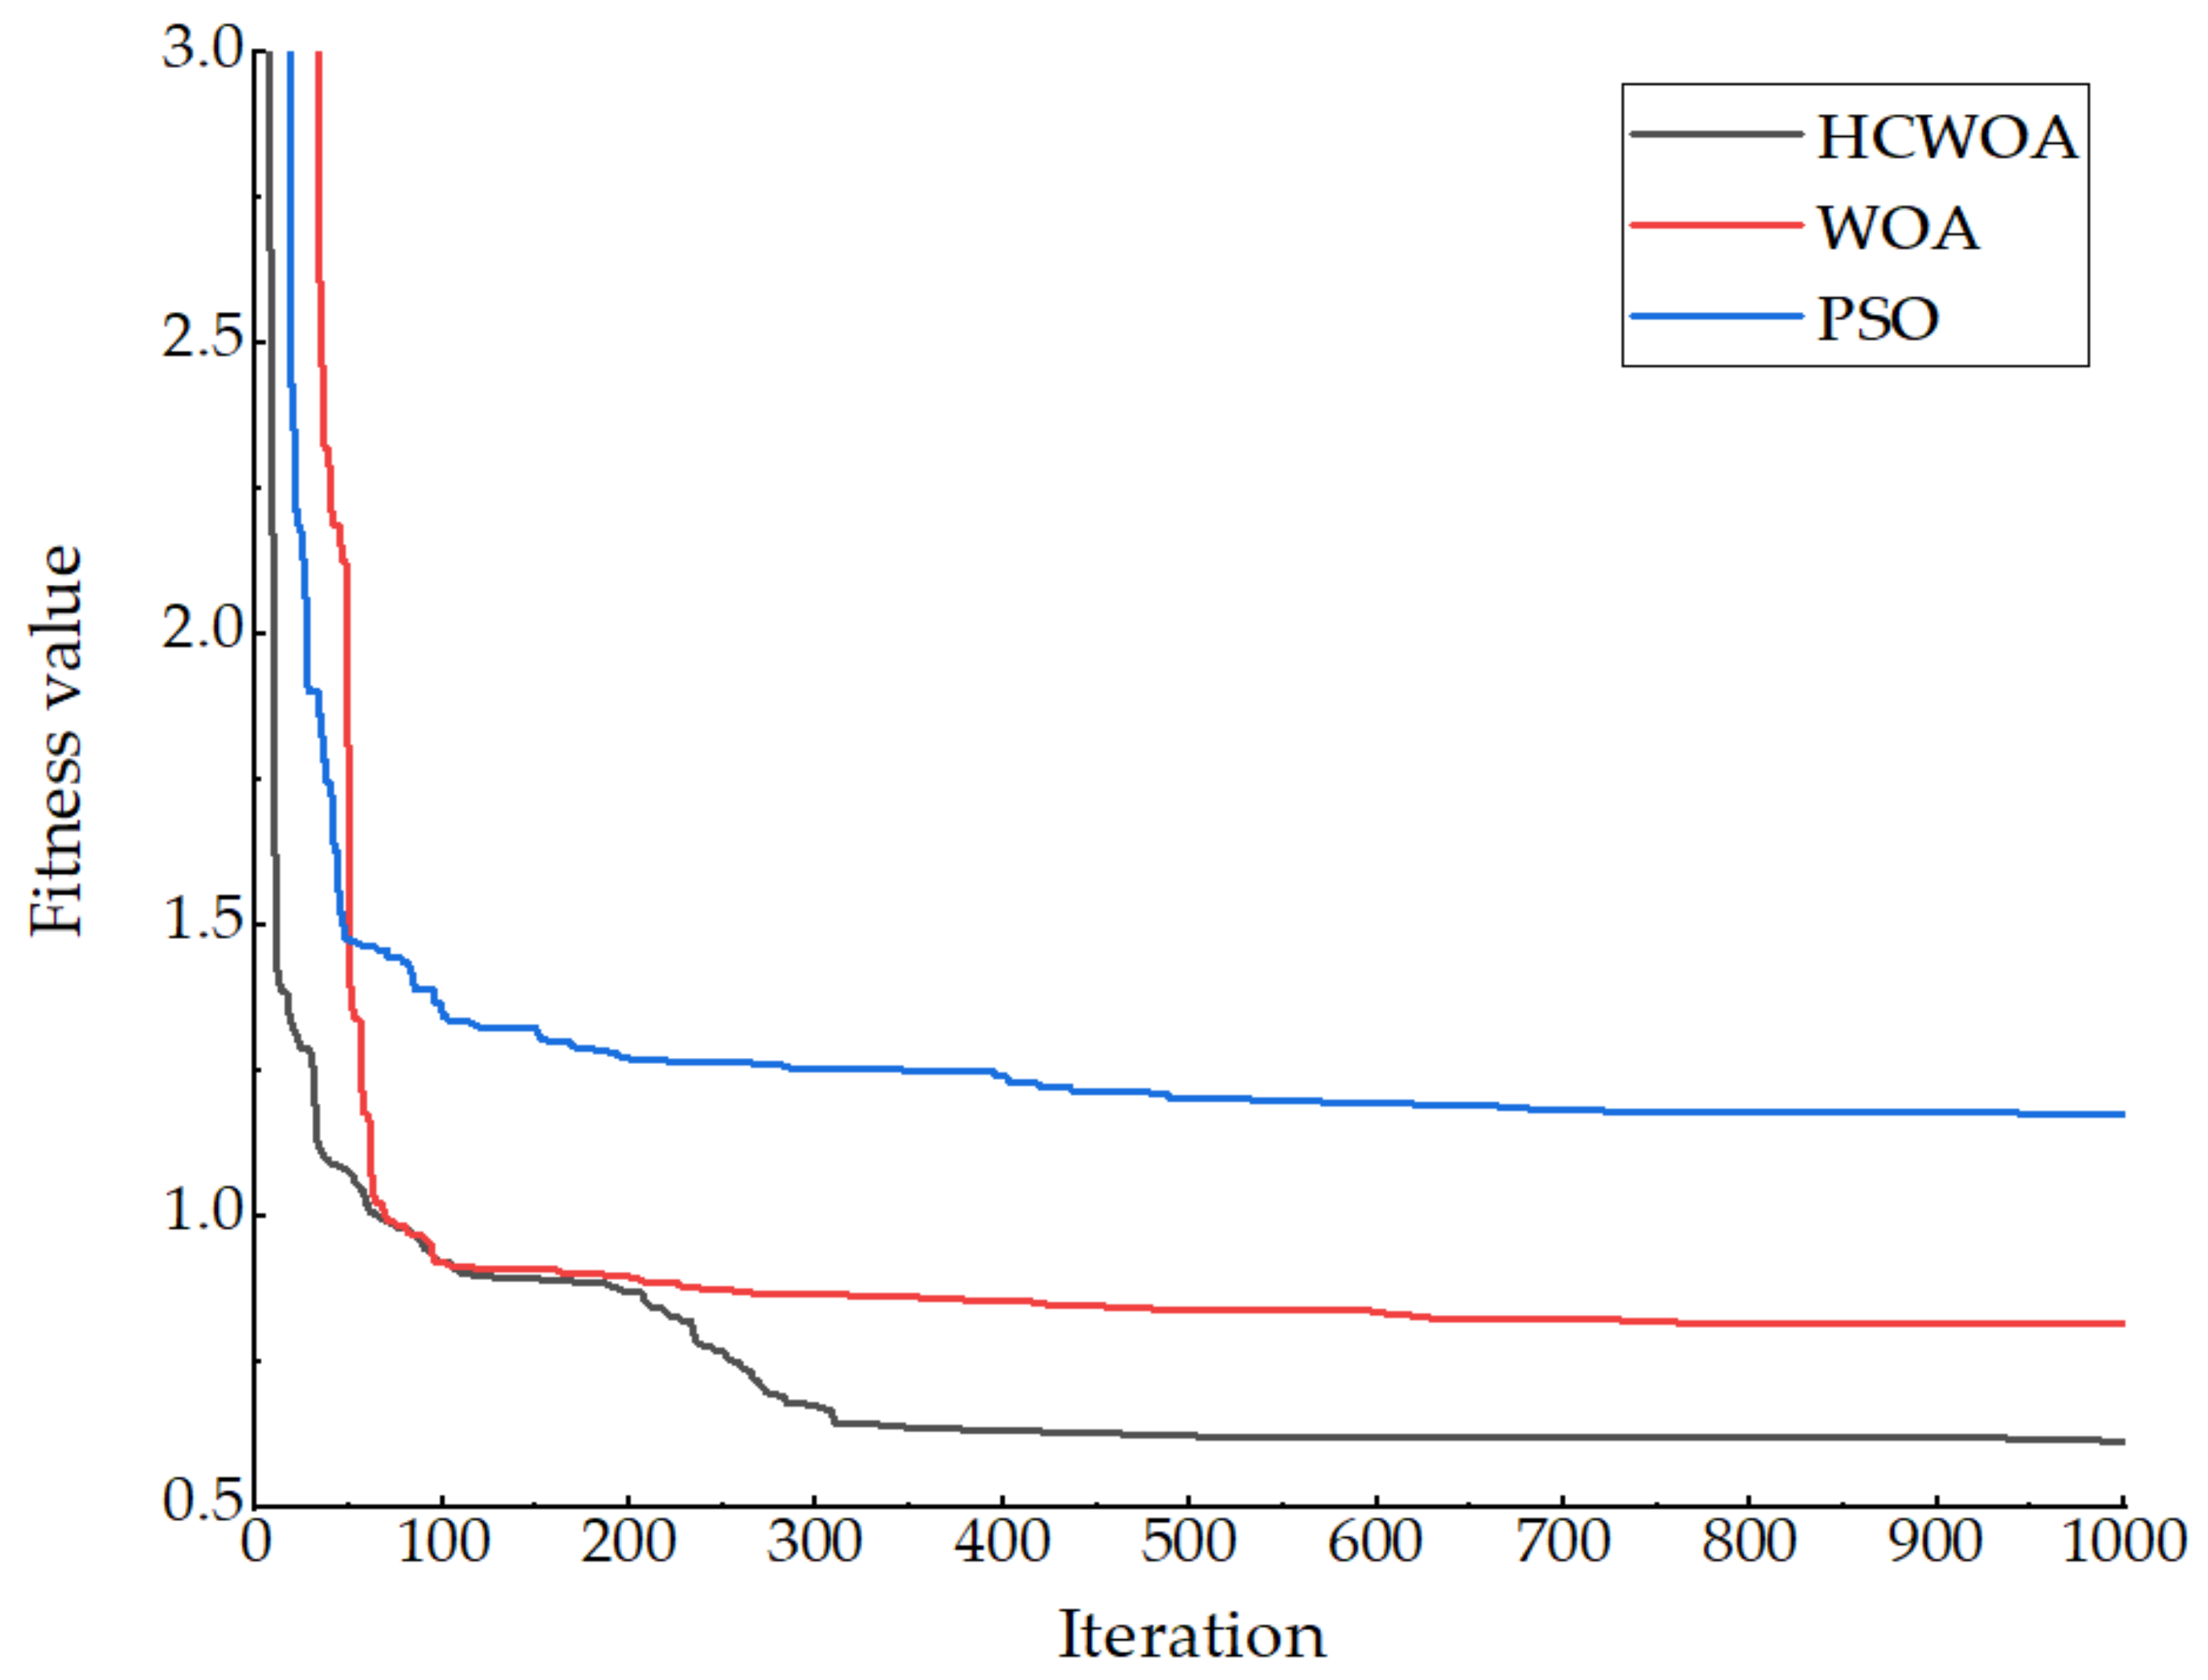
5. Comparative Experimental Analysis
6. Summary and Conclusions
Author Contributions
Funding
Institutional Review Board Statement
Informed Consent Statement
Data Availability Statement
Conflicts of Interest
References
- Ministry of Transport of the People’s Republic of China (MOT). General Technical Requirements of Expansion and Contraction Installation for Highway Bridge; China Communications Press: Beijing, China, 2016. (In Chinese)
- Huang, M.; Xu, Z.; Li, L.; Lei, Y. Construction and Application of Bridge Expansion and Contraction Installation Replacement Decision System Based on the Analytic Hierarchy Process. Materials 2020, 13, 4177. [Google Scholar] [CrossRef]
- Saaty, T.L. How to make a decision: The Analytic Hierarchy Process. Eur. J. Oper. Res. 1990, 48, 9–26. [Google Scholar] [CrossRef]
- Harputlugil, T.; Prins, M.A.; Topcu, I. Conceptual framework for potential implementations of multi criteria decision making (MCDM) methods for design quality assessment. In Proceedings of the Management and Innovation for a Sustainable Built Environment, CIB International Conference, Amsterdam, The Netherlands, 20–23 June 2011. [Google Scholar]
- Vidal, L.A.; Marle, F.; Bocquet, J.C. Using a Delphi process and the Analytic Hierarchy Process (AHP) to evaluate the complexity of projects. Expert Syst. Appl. 2011, 38, 5388–5405. [Google Scholar] [CrossRef]
- Liu, X.; Pan, Y.; Xu, Y.; Yu, S. Least square completion and inconsistency repair methods for additively consistent fuzzy preference relations. Fuzzy Set. Syst. 2012, 198, 1–19. [Google Scholar] [CrossRef]
- Ahmed, F.; Kilic, K. Fuzzy Analytic Hierarchy Process: A performance analysis of various algorithms. Fuzzy Set. Syst. 2019, 362, 110–128. [Google Scholar] [CrossRef]
- Wang, H.; Kou, G.; Peng, Y. An Iterative Algorithm to Derive Priority from Large-Scale Sparse Pairwise Comparison Matrix. IEEE Trans. Syst. Man Cybern. Syst. 2021. [Google Scholar] [CrossRef]
- Yang, I.; Wang, W.; Yang, T. Automatic repair of inconsistent pairwise weighting matrices in analytic hierarchy process. Automat. Constr. 2012, 22, 290–297. [Google Scholar] [CrossRef]
- Lin, C.; Wang, W.; Yu, W. Improving AHP for construction with an adaptive AHP approach (A3). Automat. Constr. 2008, 17, 180–187. [Google Scholar] [CrossRef]
- Girsang, A.S.; Tsai, C.; Yang, C. Ant algorithm for modifying an inconsistent pairwise weighting matrix in an analytic hierarchy process. Neural Comput. Appl. 2015, 26, 313–327. [Google Scholar] [CrossRef]
- Huang, M.; Cheng, S.; Zhang, H.; Mustafa, G.; Lu, H. Structural Damage Identification under Temperature Variations Based on PSO–CS Hybrid Algorithm. Int. J. Struct. Stab. Dyn. 2019, 19, 1950139. [Google Scholar] [CrossRef] [Green Version]
- Huang, M.; Li, X.; Lei, Y.; Gu, J. Structural damage identification based on modal frequency strain energy assurance criterion and flexibility using enhanced Moth-Flame optimization. Structures 2020, 28, 1119–1136. [Google Scholar] [CrossRef]
- Huang, M.; Mustafa, G.; Zhu, H. Vibration-Based Structural Damage Identification under Varying Temperature Effects. J. Aerosp. Eng. 2018, 31, 04018014. [Google Scholar] [CrossRef]
- Mirjalili, S.; Lewis, A. The Whale Optimization Algorithm. Adv. Eng. Softw. 2016, 95, 51–67. [Google Scholar] [CrossRef]
- Gharehchopogh, F.S.; Gholizadeh, H. A comprehensive survey: Whale Optimization Algorithm and its applications. Swarm. Evol. Comput. 2019, 48, 1–24. [Google Scholar] [CrossRef]
- Xiong, G.; Zhang, J.; Shi, D.; He, Y. Parameter extraction of solar photovoltaic models using an improved whale optimization algorithm. Energ. Convers. Manag. 2018, 174, 388–405. [Google Scholar] [CrossRef]
- Moodi, Y.; Mousavi, S.R.; Ghavidel, A.; Sohrabi, M.R.; Rashki, M. Using Response Surface Methodology and providing a modified model using whale algorithm for estimating the compressive strength of columns confined with FRP sheets. Constr. Build. Mater. 2018, 183, 163–170. [Google Scholar] [CrossRef]
- Mafarjaa, M.M.; Mirjalili, S. Hybrid Whale Optimization Algorithm with simulated annealing for feature selection. Neurocomputing 2017, 260, 302–312. [Google Scholar] [CrossRef]
- Reddy, M.P.; Babu, M.R. Implementing self adaptiveness in whale optimization for cluster head section in Internet of Things. Cluster. Comput. 2019, 22, 1361–1372. [Google Scholar] [CrossRef]
- Aziz, M.A.; Ewees, A.A.; Hassaniend, A.E. Whale Optimization Algorithm and Moth-Flame Optimization for multilevel thresholding image segmentation. Expert Syst. Appl. 2017, 83, 242–256. [Google Scholar] [CrossRef]
- Srivastava, A.; Das, D.K.; Rai, A.; Raj, R. Parameter Estimation of a Permanent Magnet Synchronous Motor using Whale Optimization Algorithm. In Proceedings of the 2018 Recent Advances on Engineering, Technology and Computational Sciences (RAETCS), Allahabad, India, 6–8 February 2018; pp. 1–6. [Google Scholar]
- Zhang, X.; Liu, Z.; Miao, Q.; Wang, L. Bearing fault diagnosis using a whale optimization algorithm-optimized orthogonal matching pursuit with a combined time–frequency atom dictionary. Mech. Syst. Signal Process. 2018, 107, 29–42. [Google Scholar] [CrossRef]
- Dao, T.; Pan, T.; Pan, J. A Multi-Objective Optimal Mobile Robot Path Planning Based on Whale Optimization Algorithm. In Proceedings of the 2016 IEEE 13th International Conference on Signal Processing (ICSP), Chengdu, China, 6–10 November 2016; pp. 337–342. [Google Scholar]
- Horng, M.; Dao, T.; Shieh, C.; Nguyen, T. A Multi-Objective Optimal Vehicle Fuel Consumption Based on Whale Optimization Algorithm. In Advances in Intelligent Information Hiding and Multimedia Signal Processing; Springer: Cham, Switzerland, 2017; pp. 371–380. [Google Scholar]
- Khalilpourazari, S.; Pasandideh, S.H.; Ghodratnama, A. Robust possibilistic programming for multi-item EOQ model with defective supply batches: Whale Optimization and Water Cycle Algorithms. Neural Comput. Appl. 2019, 31, 6587–6614. [Google Scholar] [CrossRef]
- Sreenu, K.; Sreelatha, M. W-Scheduler: Whale optimization for task scheduling in cloud computing. Cluster Comput. 2019, 22, 1087–1098. [Google Scholar] [CrossRef]
- Huang, M.; Cheng, X.; Lei, Y. Structural damage identification based on substructure method and improved whale optimization algorithm. J. Civ. Struct. Health Monit. 2021, 11, 351–380. [Google Scholar] [CrossRef]
- Kaur, G.; Arora, S. Chaotic Whale Optimization Algorithm. J. Comput. Des. Eng. 2018, 5, 275–284. [Google Scholar] [CrossRef]
- Yang, X.S.; Suash, D. Cuckoo search via levy flights. In World Congress Nature Biologically Inspired Computer (NaBIC); IEEE Publication: New York, NY, USA, 2009; pp. 210–214. [Google Scholar]
- Kamaruzaman, A.F.; Zain, A.M.; Yusuf, S.M.; Udin, A. Levy flight algorithm for optimization problems—A literature review. Appl. Mech. Mater. 2013, 421, 496–501. [Google Scholar] [CrossRef]
- Abdel-Basset, M.; El-Shahat, D.; Sangaiah, A.K. A modified nature inspired meta-heuristic whale optimization algorithm for solving 0-1 knapsack problem. Int. J. Mach. Learn. Cyb. 2019, 10, 495–514. [Google Scholar] [CrossRef]
- Abdel-Basset, M.; Abdle-Fatah, L.; Sangaiah, A.K. An improved Lévy based whale optimization algorithm for bandwidth-efficient virtual machine placement in cloud computing environment. Cluster Comput. 2019, 22, 8319–8334. [Google Scholar] [CrossRef]
- Sun, Y.; Wang, X.; Chen, Y.; Liu, Z. A modified whale optimization algorithm for large-scale global optimization problems. Expert Syst. Appl. 2018, 114, 563–577. [Google Scholar] [CrossRef]
- Ministry of Transport of the People’s Republic of China (MOT). Highway Performance Assessment Standards; China Communications Press: Beijing, China, 2018. (In Chinese)
- Ministry of Transport of the People’s Republic of China (MOT). Standards for Technical Condition Evaluation of Highway Bridges; China Communications Press: Beijing, China, 2011. (In Chinese)
- Ocampoa, L.; Ebisab, J.A.; Ombeb, J.; Escotob, M.G. Sustainable ecotourism indicators with fuzzy Delphi method—A Philippine perspective. Ecol. Indic. 2018, 93, 874–888. [Google Scholar] [CrossRef]
- Cao, W.D.; Wang, A.T.; Yu, D.S.; Liu, S.T.; Hou, W. Establishment and implementation of an asphalt pavement recycling decision system based on the analytic hierarchy process. Resour. Conserv. Recycl. 2019, 149, 738–749. [Google Scholar] [CrossRef]
- Gandomi, A.H.; Yang, X.-S.; Talatahari, S.; Alavi, A.H. Firefly algorithm with chaos. Commun. Nonlinear Sci. 2013, 18, 89–98. [Google Scholar] [CrossRef]
- Liu, M.; Yao, X.; Li, Y. Hybrid whale optimization algorithm enhanced with Lévy flight and differential evolution for job shop scheduling problems. Appl. Soft Comput. 2019, 87, 105954. [Google Scholar] [CrossRef]
- Mantegna, R.N. Fast, accurate algorithm for numerical simulation of Lévy stable stochastic processes. Phys. Rev. E 1994, 49, 4677. [Google Scholar] [CrossRef] [PubMed]


| Installation | Part | No. | Component | Quantity of Members |
|---|---|---|---|---|
| MA Modular type | Main structure | 1 | Side beam | 2 |
| 2 | Anchorage concrete | 2 | ||
| Accessory structure | 3 | Rubber sealing tape | 1 | |
| MB Modular type | Main structure | 1 | Side beam | 2 |
| 2 | Intermediate beam | Quantity of intermediate beams | ||
| 3 | Bearing system | Quantity of support beams | ||
| 4 | Displacement control system | 1 | ||
| 5 | Elastic support | 1 | ||
| 6 | Anchorage concrete | 2 | ||
| Accessory structure | 7 | Rubber sealing tape | Quantity of intermediate beams +1 | |
| SC Comb plate type | Main structure | 1 | Comb plate | Quantity of comb plate units |
| 2 | Anchor bolt | Quantity of comb plate units | ||
| 3 | Anchorage concrete | 2 | ||
| Accessory structure | 4 | Drainage device | 1 | |
| SSA, SSB Comb plate type | Main structure | 1 | Fixed comb plate | Quantity of fixed comb plate units |
| 2 | Movable comb plate | Quantity of movable comb plate units | ||
| 3 | Stainless steel sliding plate | Quantity of comb plate units | ||
| 4 | Anchor bolt | Quantity of comb plate units | ||
| 5 | Multidirectional displacement device | Quantity of movable comb plate units | ||
| 6 | Anchorage concrete | 2 | ||
| Accessory structure | 7 | Drainage device | 1 | |
| Seamless type | Main structure | 1 | Elastic expansion body | 1 |
| Accessory structure | 2 | Steel cover plate | 1 | |
| 3 | Nail | 1 | ||
| 4 | Foam plate | 1 |
| Inspection Object | Inspection Index | Scale | Qualitative Description | Quantitative Description |
|---|---|---|---|---|
| Side beam | Evenness | 2 | Slightly uneven | Elevation difference ≤ 10 mm |
| 3 | Obviously uneven, local fractures occur | 10 mm < elevation difference ≤ 30 mm | ||
| 4 | Excessively uneven, vehicle bumping, and side sinking occur | Elevation difference > 30 mm | ||
| Spacing | 2 | Slightly narrow | 50 mm < spacing ≤ design value | |
| 3 | Obviously narrow | 10 mm < spacing ≤ 50 mm | ||
| 4 | Excessively narrow or wide | Spacing > design value, or spacing ≤ 10 mm | ||
| Anchorage concrete | Fracture | 2 | Local fractures occur | Fractures ≤ 3, fracture width ≤ 2 mm, damaged area ≤ 10% anchorage concrete area |
| 3 | Multiple fractures occur | 3 < fractures ≤ 5, 2 mm < fracture width ≤ 10 mm, 10% < damaged area ≤ 20% anchorage concrete area | ||
| 4 | Serious fractures occur, anchorage function fails | Fractures > 5, fracture width > 10 mm, damaged area > 20% anchorage concrete area | ||
| Rubber sealing tape | Aging | 2 | Slightly aging, local fractures occur | Fractures ≤ 3, damaged area ≤ 20% |
| 3 | Obviously aging, multiple fractures occur | 3 < fractures ≤ 5, 20% < damaged area ≤ 50% | ||
| 4 | Excessively aging, serious fractures occur | Fractures > 5, damaged area > 50% |
| Inspection Object | Inspection Index | Scale | Qualitative Description | Quantitative Description |
|---|---|---|---|---|
| Side beam, intermediate beam | Evenness | 2 | Slightly uneven | Elevation difference ≤ 15 mm |
| 3 | Obviously uneven, local fractures occur | 15 mm < spacing ≤ 30 mm | ||
| 4 | Excessively uneven, vehicle bumping, and side sinking occur | 30 mm < spacing ≤ 100 mm | ||
| Spacing | 2 | Slightly narrow | 50 mm < spacing ≤ design value | |
| 3 | Obviously narrow | 10 mm < spacing ≤ 50 mm | ||
| 4 | Excessively narrow or wide | Spacing > design value, or spacing ≤10 mm | ||
| Bearing system | Bolt looseness, hanger damage | 2 | Local anchor bolts are unfixed, local hanger damages occur | Proportion of unfixed bolts ≤ 10%, or 1 hanger damage |
| 3 | Multiple anchor bolts are unfixed, multiple hanger damages occur | 10% < proportion of unfixed bolts ≤ 30%, or 2 hanger damages | ||
| 4 | Massive anchor bolts are unfixed, massive hanger damages occur | Proportion of unfixed bolts > 30%, or hanger damages > 2 | ||
| Displacement control system | Spring deformation, bolt looseness, hinge damage | 2 | Serious spring deformations occur, local bolts are unfixed, local hinges are damaged | Spring deformation > 20% design value, or proportion of unfixed bolts ≤ 10%, or 1 hinge damage |
| 3 | Local springs are damaged, multiple bolts are unfixed, multiple hinges are damaged | Proportion of damaged springs ≤ 10%, or 10% < proportion of unfixed bolts ≤ 30%, or 2 hinge damages | ||
| 4 | Multiple springs are damaged, massive bolts are unfixed, massive hinges are damaged | Proportion of damaged springs 10%, or proportion of unfixed bolts > 30%, or hinge damages > 2 | ||
| Elastic support | Support deformation | 2 | Slight support deformations occur | Support deformations ≤ allowable value |
| 3 | Obvious support deformations occur | Support deformations > allowable value | ||
| 4 | Serious support deformations occur | Proportion of damaged supports > 30% | ||
| Anchorage concrete | Fracture | 2 | Local fractures occur | Fractures ≤ 3, fracture width ≤ 2 mm, damaged area ≤ 10% |
| 3 | Multiple fractures occur | 3 < fractures ≤ 5, 2 mm < fracture width ≤ 10 mm, 10% < damaged area ≤ 20% | ||
| 4 | Serious fractures occur, anchorage function fails | Fractures > 5, fracture width > 10 mm, damaged area > 20% | ||
| Rubber sealing tape | Aging | 2 | Slightly aging, local fractures occur | Fractures ≤ 3, damaged area ≤ 20% |
| 3 | Obviously aging, multiple fractures occur | 3 < fractures ≤ 5, 20% < damaged area ≤ 50% | ||
| 4 | Excessively aging, serious fractures occur | Fractures > 5, damage area > 50% |
| Inspection Object | Inspection Index | Scale | Qualitative Description | Quantitative Description |
|---|---|---|---|---|
| Comb plate | Evenness | 2 | Slightly uneven, local fractures occur | Damaged area ≤ 10%, 1 mm < elevation differences ≤ 2 mm |
| 3 | Obviously uneven, multiple fractures occur | 10% < damaged area ≤ 30%, 2 mm < elevation differences ≤ 4 mm | ||
| 4 | Seriously uneven, serious fractures differences occur | Damaged area > 30%, elevation differences > 4 mm | ||
| Anchor bolt | Looseness | 2 | Local anchor bolts are unfixed | Proportion of damaged bolts ≤ 10% |
| 3 | Multiple anchor bolts are unfixed | 10% < proportion of damaged bolts ≤ 30% | ||
| 4 | Massive anchor bolts are unfixed | Proportion of damaged bolts > 30% | ||
| Anchorage concrete | Fracture | 2 | Local fractures occur | Fractures ≤ 3, fracture width ≤ 2 mm, damaged area ≤ 10% anchorage concrete area |
| 3 | Multiple fractures occur | 3 < fractures ≤ 5, 2 mm < fracture width ≤ 10 mm, 10% anchorage concrete area < damaged area ≤ 20% anchorage concrete area | ||
| 4 | Serious fractures occur, anchorage function fails | Fractures > 5, fracture width > 10 mm, damaged area > 20% anchorage concrete area | ||
| Drainage device | Fracture | 2 | Local fractures occur | Fractures ≤ 3, damaged area ≤ 10% total area |
| 3 | Multiple fractures occur | 3 < fractures ≤ 5, 10% < damaged area ≤ 30% total area | ||
| 4 | Serious fractures occur | Fractures > 5, damaged area > 30% total area |
| Inspection Object | Inspection Index | Scale | Qualitative Description | Quantitative Description |
|---|---|---|---|---|
| Fixed comb plate, movable comb plate | Evenness | 2 | Slightly uneven, local fractures occur | Damaged area ≤ 10%, 1 mm < elevation differences ≤ 2 mm |
| 3 | Obviously uneven, multiple fractures occur | 10% < damaged area ≤ 30%, 2 mm < elevation differences ≤ 4 mm | ||
| 4 | Seriously uneven, serious fractures differences occur | Damaged area > 30%, elevation differences > 4 mm | ||
| Stainless steel sliding plate | Abrasion | 2 | Local abrasions occur | Abrasion area ≤ 10% total area |
| 3 | Multiple abrasions occur | 10% < abrasion area ≤ 30% total area | ||
| 4 | Massive abrasions occur | Abrasion area > 30% total area | ||
| Anchor bolt | Looseness | 2 | Local anchor bolts are unfixed | Proportion of damaged bolts ≤ 10% |
| 3 | Multiple anchor bolts are unfixed | 10% < proportion of damaged bolts ≤ 30% | ||
| 4 | Massive anchor bolts are unfixed | Proportion of damaged bolts > 30% | ||
| Multidirectional displacement device | Flexibility | 2 | Individual unit is inflexible | 1 inflexible unit |
| 3 | Partial units are inflexible | 2 inflexible units | ||
| 4 | Multiple units are inflexible, device function fails | Inflexible units > 2 | ||
| Anchorage concrete | Fracture | 2 | Local fractures occur | Fractures ≤ 3, fracture width ≤ 2 mm, damaged area ≤ 10% anchorage concrete area |
| 3 | Multiple fractures occur | 3 < fractures ≤ 5, 2 mm < fracture width ≤ 10 mm, 10% anchorage concrete area < damaged area ≤ 20% anchorage concrete area | ||
| 4 | Serious fractures occur, anchorage function fails | Fractures > 5, fracture width > 10 mm, damaged area > 20% anchorage concrete area | ||
| Drainage device | Fracture | 2 | Local fractures occur | Fractures ≤ 3, damaged area ≤ 10% total area |
| 3 | Multiple fractures occur | 3 < fractures ≤ 5, 10% < damaged area ≤ 30% total area | ||
| 4 | Serious fractures occur | Fractures > 5, damaged area > 30% total area |
| Inspection Object | Inspection Index | Scale | Qualitative Description | Quantitative Description |
|---|---|---|---|---|
| Elastic expansion body | Fracture | 2 | Local fractures occur | Damaged area ≤ 10% total area |
| 3 | Multiple fractures occur | 10% < damaged area ≤ 30% total area | ||
| 4 | Serious fractures occur, anchorage function fails | Damaged area > 30% total area | ||
| Steel cover plate | Abrasion | 2 | Local abrasions occur | Abrasion area ≤ 10% total area |
| 3 | Multiple abrasions occur | 10% < abrasion area ≤ 30% total area | ||
| 4 | Massive abrasions occur | Abrasion area > 30% total area | ||
| Nail | Corrosion | 2 | Local corrosions occur | Corrosions ≤ 3 |
| 3 | Multiple corrosions occur | 3 < corrosions ≤ 5 | ||
| 4 | Massive corrosions occur | Corrosions > 5 | ||
| Foam plate | Fracture | 2 | Local fractures occur | Damaged area ≤ 10% total area |
| 3 | Multiple fractures occur | 10% < damaged area ≤ 30% total area | ||
| 4 | Serious fractures occur | Damaged area > 30% total area |
| The Highest Scale That Can Be Achieved by Inspection Index | Scale of Inspection Index | |||
|---|---|---|---|---|
| 1 | 2 | 3 | 4 | |
| 4 | 0 | 25 | 50 | 100 |
| Quantity of Members | Quantity of Members | ||
|---|---|---|---|
| 1 | ∞ | 11 | 7.9 |
| 2 | 10 | 12 | 7.7 |
| 3 | 9.7 | 13 | 7.5 |
| 4 | 9.5 | 14 | 7.3 |
| 5 | 9.2 | 15 | 7.2 |
| 6 | 8.9 | 16 | 7.08 |
| 7 | 8.7 | 17 | 6.96 |
| 8 | 8.5 | 18 | 6.84 |
| 9 | 8.3 | 19 | 6.72 |
| 10 | 8.1 | 20 | 6.6 |
| Installation | Part | No. | Component | |
|---|---|---|---|---|
| MA Modular type | Main structure | 1 | Side beam | 0.75 |
| 2 | Anchorage concrete | 0.25 | ||
| Accessory structure | 3 | Rubber sealing tape | 1 | |
| MB Modular type | Main structure | 1 | Side beam | 0.27 |
| 2 | Intermediate beam | 0.27 | ||
| 3 | Bearing system | 0.10 | ||
| 4 | Displacement control system | 0.10 | ||
| 5 | Elastic support | 0.10 | ||
| 6 | Anchorage concrete | 0.16 | ||
| Accessory structure | 7 | Rubber sealing tape | 1 | |
| SC Comb plate type | Main structure | 1 | Comb plate | 0.52 |
| 2 | Anchor bolt | 0.24 | ||
| 3 | Anchorage concrete | 0.24 | ||
| Accessory structure | 4 | Drainage device | 1 | |
| SSA, SSB Comb plate type | Main structure | 1 | Fixed comb plate | 0.25 |
| 2 | Movable comb plate | 0.35 | ||
| 3 | Stainless steel sliding plate | 0.05 | ||
| 4 | Anchor bolt | 0.10 | ||
| 5 | Multidirectional displacement device | 0.12 | ||
| 6 | Anchorage concrete | 0.13 | ||
| Accessory structure | 7 | Drainage device | 1 | |
| Seamless type | Main structure | 1 | Elastic expansion body | 1 |
| Accessory structure | 2 | Steel cover plate | 0.40 | |
| 3 | Nail | 0.40 | ||
| 4 | Foam plate | 0.20 |
| Part | Weight |
|---|---|
| Main structure | 0.8 |
| Accessory structure | 0.2 |
| Qualitative Description | Maintenance Suggestion | ||
|---|---|---|---|
| 1 | [90, 100] | Healthy | Normal maintenance |
| 2 | [75, 90) | Slightly damaged | Individual members repair or replacement |
| 3 | [60, 75) | Obviously damaged | Essential components replacement |
| 4 | [0, 60) | Seriously damaged | BECI replacement |
| Evaluation Scale | Comparison of the Priority |
|---|---|
| 1 | are equally important |
| 3 | is slightly important compared with |
| 5 | is obviously important compared with |
| 7 | is highly important compared with |
| 9 | is extremely important compared with |
| 2, 4, 6, 8 | Intermediate values used to represent compromise |
| N | 1 | 2 | 3 | 4 | 5 | 6 | 7 | 8 |
|---|---|---|---|---|---|---|---|---|
| 0.00 | 0.00 | 0.58 | 0.90 | 1.12 | 1.24 | 1.32 | 1.41 |
| Layer | Item | Hierarchical Weight | |||||||||||
|---|---|---|---|---|---|---|---|---|---|---|---|---|---|
| Criterion | |||||||||||||
| 0.40 | 0.40 | 0.20 | |||||||||||
| Index | |||||||||||||
| 0.45 | 0.07 | 0.07 | 0.12 | 0.12 | 0.17 | 0.24 | 0.62 | 0.14 | 0.25 | 0.50 | 0.25 | ||
| Plan A | 85 | 80 | 80 | 90 | 90 | 85 | 80 | 85 | 80 | 90 | 90 | 90 | |
| 0.854 | |||||||||||||
| Plan B | 90 | 90 | 85 | 85 | 80 | 85 | 90 | 80 | 75 | 80 | 80 | 80 | |
| 0.835 | |||||||||||||
| Item | Initial Matrix | Optimization Algorithm | ||
|---|---|---|---|---|
| HCWOA | WOA | PSO | ||
| Optimal fitness value | / | 0.6131 | 0.8166 | 1.1767 |
| Consistency ratio | 0.110 | 0.066 | 0.085 | 0.090 |
Publisher’s Note: MDPI stays neutral with regard to jurisdictional claims in published maps and institutional affiliations. |
© 2021 by the authors. Licensee MDPI, Basel, Switzerland. This article is an open access article distributed under the terms and conditions of the Creative Commons Attribution (CC BY) license (https://creativecommons.org/licenses/by/4.0/).
Share and Cite
Xu, Z.; Huang, M. Improving Bridge Expansion and Contraction Installation Replacement Decision System Using Hybrid Chaotic Whale Optimization Algorithm. Appl. Sci. 2021, 11, 6222. https://doi.org/10.3390/app11136222
Xu Z, Huang M. Improving Bridge Expansion and Contraction Installation Replacement Decision System Using Hybrid Chaotic Whale Optimization Algorithm. Applied Sciences. 2021; 11(13):6222. https://doi.org/10.3390/app11136222
Chicago/Turabian StyleXu, Zian, and Minshui Huang. 2021. "Improving Bridge Expansion and Contraction Installation Replacement Decision System Using Hybrid Chaotic Whale Optimization Algorithm" Applied Sciences 11, no. 13: 6222. https://doi.org/10.3390/app11136222
APA StyleXu, Z., & Huang, M. (2021). Improving Bridge Expansion and Contraction Installation Replacement Decision System Using Hybrid Chaotic Whale Optimization Algorithm. Applied Sciences, 11(13), 6222. https://doi.org/10.3390/app11136222