Article

Characterizations of a Plasma-Water System Generated by Repetitive Microsecond Pulsed Discharge with Air, Nitrogen, Oxygen, and Argon Gases Species

1
Center for Plasma and Thin Film Technologies, Ming Chi University of Technology, New Taipei City 24301, Taiwan
2
Department of Safety, Health and Environment Engineering, Ming Chi University of Technology, New Taipei City 24301, Taiwan
3
Department of Materials Engineering, Ming Chi University of Technology, New Taipei City 24301, Taiwan
*
Author to whom correspondence should be addressed.
Appl. Sci. 2021, 11(13), 6158; https://doi.org/10.3390/app11136158
Submission received: 7 May 2021 / Revised: 29 June 2021 / Accepted: 29 June 2021 / Published: 2 July 2021
(This article belongs to the Special Issue Plasma Science and Technology)

Abstract

:
A non-thermal plasma-water system using a microsecond pulsed high-voltage power supply was investigated with air, nitrogen, oxygen, and argon gas feedings individually. Optical emission spectroscopy (OES) was utilized to characterize the primary active species inside the plasmas generated by different gas feedings. The OES method was also employed to estimate the neutral gas and electron temperatures. The pH and the oxidation-reduction potential (ORP) of plasma-activated water (PAW) were measured in the liquid phase. An ion chromatography system (ICS) was employed to present the PAW activity, such as nitrite and nitrate species. Moreover, hydrogen peroxide as a secondary active species inside the activated water, generated by the gases mentioned above, was measured by potassium permanganate titration. It was found that the gas species have a noticeable effect on the pH level as well as the ORP of PAW. In the cases of argon and oxygen plasmas, the pH level of PAW does not change significantly. In contrast, the pH values of PAW generated by air and nitrogen plasmas decline sharply during the treatment time. Moreover, the gas species have a significant impact on the concentrations of nitrite, nitrate, and hydrogen peroxide generated in PAW. The activated water generated by oxygen plasma provides the highest level of hydrogen peroxide. Although the consumed power of argon plasmas was half of the other plasma sources, it provides relatively high hydrogen peroxide contents compared to the nitrogen and air plasmas.

1. Introduction

In an interaction between non-thermal atmospheric pressure plasma (NTAPP) and water, a process appears, such as plasma-activated water (PAW), that provides wide applications [1,2]. PAW, as an adaptable medium, is being paid much attention to promising applications in biomedical [3], food, and agriculture [4]. Following the generation of enormous chemically active species in the gas phase by NTAPP in the interaction with water, PAW initiates chemical reaction processes inside the water leading huge amount of chemically active species. Since PAW contains mainly reactive oxygen and nitrogen species inside the water, it can be considered an alternative method for disinfection [5].
NTAPPs have been emerging with different configurations in and contact with water [6] for treatment. In the case of discharge formation inside the water, the conductivity of water strongly affects the discharge conditions. The discharge volume and energy efficiency significantly change with water conductivity [7] that causes difficulties to ignite discharge as well as discharge instabilities inside the water. To overcome this problem, the discharge is generated in a gas phase over a water surface [8]. In this way, dielectric barrier discharge (DBD) is developed as an NTAPP over the water surface for PAW to control and stabilize the discharge.
NTAPPs are sources of producing chemically reactive species that act as oxidizing agents. The reactive species are applied for PAW due to the advanced oxidation process [9]. Hydrogen peroxide, as a long-lived species, along with the other produced species inside the PAW, contributes as an indirect plasma treatment for biological and medical applications [10]; thus, it is necessary to characterize the active species generated inside the PAW. Hydrogen peroxide, as one of the most stable species generated inside the PAW, plays a significant role in the antimicrobial properties of PAW [11,12]. Hydrogen peroxide is also able to improve the taste of water and unpleasant smell [13]. There are enormous articles in which the pH and oxidation-reduction potential (ORP) levels were investigated as well as the physiochemistry of the treated/activated water and applications. The findings of these investigations have been performed with different plasma sources and experimental conditions. It is known that the plasma source with various electrode configurations [14], voltage waveform [15], frequency [16] affect discharge conditions and produced active species. Thus, it is pretty difficult or impossible to compare the results. For instance, argon plasma using a high-voltage needle with positive and negative pulsed discharges was considered on produced active species in the gas phase and hydrogen peroxide concentration in the liquid [17]. Ke et al. [18] utilized a needle electrode configuration, but the effect of oxygen, nitrogen, and air plasmas was considered on nitrite and nitrate concentrations with AC discharge. Neretti et al. [19] reported a volume DBD reactor with sinusoidal and nanosecond discharge in the ambient air. Argon/oxygen plasmas were reported using a plasma jet [4] and microjet [20]. Thirumdas et al. [1] classified plasma sources with various gas species conducted for PAW. In this work, we are motivated to investigate the effect of the gas species on the pH and chemical strength (ORP) levels of the water as well as the concentration of nitrite, nitrate, and hydrogen peroxide inside the treated/activated water with four typical gas species of air, nitrogen, oxygen, and argon under the same experimental conditions.
This study aimed to characterize generated active species in the gas phase and inside the water as well as activated water properties by changing the gas feeding. In this study, the NTAPPs were generated using DBD over the water surface, where primary active species are generated by using different gas feedings as mentioned above. To have a uniform and broad plasma treatment, a two-parallel plate configuration was employed. The neutral gas and electron temperatures were estimated using a spectroscopic method as knowing these values is essential to understand the possible mechanisms of water dissociation and active species formation [17]. We also characterized the DBDs using optical emission spectroscopy (OES) to identify the primary reactive species produced in the gas phase. They are responsible for generating secondary species such as hydrogen peroxide, nitrite, and nitrate, formed inside the PAW. The level of acidity of the PAW was performed by pH meter. To investigate the ability of PAW oxidizing, oxidation-reduction potential (ORP) was measured. An ion chromatography system (ICS) was employed to measure nitrite and nitrate concentrations. Hydrogen peroxide generated as secondary species were measured by potassium permanganate titration.

2. Materials and Methods

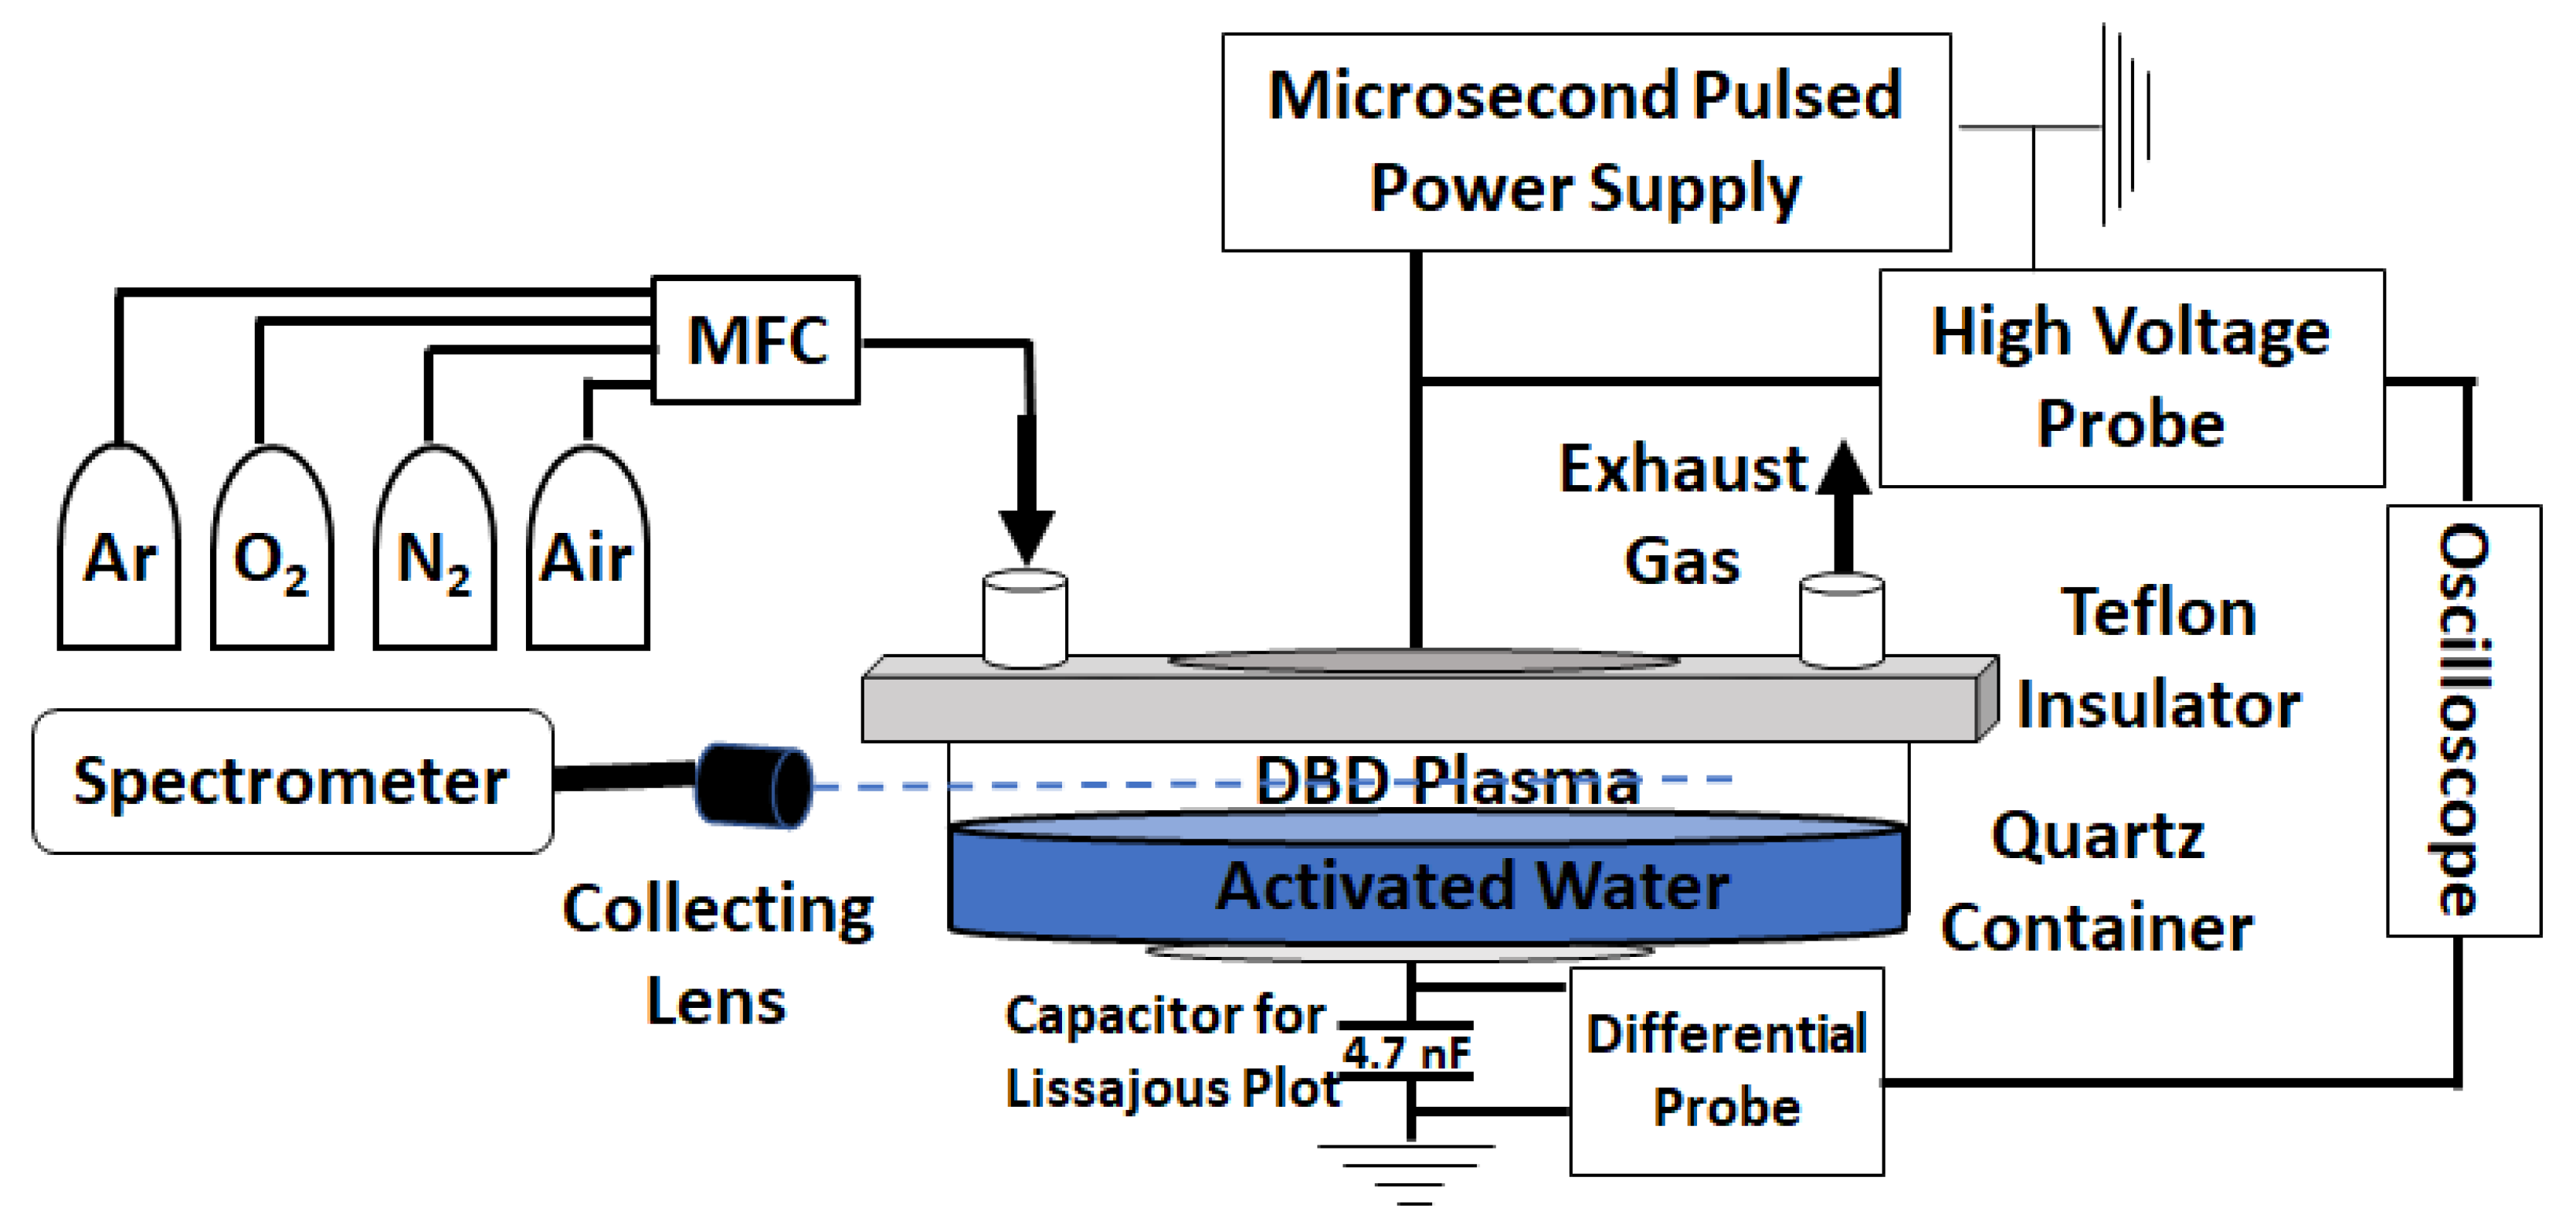
2.1. Experimental Setup

Figure 1 shows a schematic diagram of the experimental setup for a plasma-water system. A quartz container with an internal diameter of 139 mm and a height of 12 mm, including the distilled water with two parallel stainless electrodes (diameter of 90 mm) and a quartz plate (thickness of 1 mm) as a dielectric layer sustains a DBD over the water surface. A pulse DC power controller (SPIK 2000 A, Shenchang Electric Co. Ltd., Taipei, Taiwan) drives a bipolar waveform with a frequency of 20 kHz. Then the generated waveform goes up to the value of 12 kV using a high-voltage step-up transformer to produce DBDs over the water surface. By adjusting on-time and off-time, which were selected to be 5 µs and 20 µs, the duty cycle was 0.2. The container was filled with 80 mL of distilled water so that the gap distance between the water interface and the quartz plate was 2 mm. The Teflon insulator covered the upper electrode where two ports exist for the gas inlet and outlet. Air, nitrogen, oxygen, and argon as gas feedings were selected to be injected individually. The flow rate during the experiment was fixed to be 2 slm (standard liters per minute) using mass flow controller (MFC). The plasma treatment time was selected to be 2, 4, 6, 8, 10, and 12 min.

2.2. Electrical Characterization

The total voltage and the capacitor voltage associated with the electric charge estimation were measured using a high voltage probe (Rigol-RP1018H) and a differential voltage probe (Micsig, DP10013). Both voltage waveforms were recorded using an oscilloscope (Rigol, DS1054z, 50 MHz, 1 GS/s). The measured voltage by the differential probe across the capacitor (4.7 nF) is proportional to the electric charge passing through the electrode. The measured total voltage and electric charges values were plotted in a charge-voltage figure (Lissajous curve) as shown in the Figure 2.

2.3. Spectroscopic Characterization of the Gas Phase

As the most popular diagnostics, optical emission spectroscopy (OES) has been employed to measure the relative intensity of the generated reactive species by DBDs in the gas phase. The emission spectrum has been recorded using a commercial spectrometer (Avantes, AvaSpec-2048L) with a spectral range of 200–1100 nm and a spectral resolution of 1.4 nm. A fiber optics cable, including a collecting lens, has been used to capture the light emitted by DBDs. The integration time for recording the optical emission signals has been adjusted to be 100 ms.

2.4. Characterization of Plasma-Activated Water

The pH and ORP levels of the activated water were measured with the instrument (Hach 5465010 Sension 156 PH). The accuracy of pH and ORP meters were ±0.002 and 0.2 mV, respectively.
The reactive nitrogen species inside the activated water were characterized with nitrate and nitrite analysis. Measurements of nitrate and nitrite were conducted using an ion chromatography system (ICS, Dionex ICS-1500) with an AS4A-SC column. The standard of calibration in ICS was prepared to know the samples rely on the proper range.
The concentration of hydrogen peroxide inside PAW was determined by potassium permanganate titration. This method utilizes the reduction of potassium permanganate (KMnO4) by hydrogen peroxide in sulfuric acid according to the following reaction [21]:
5H2O2 + 2KMnO4 + 3H2SO4 → 2MnSO4 + K2SO4 + 8H2O + 5O2
Regarding each time point related to the treatment time, the data averaged over three runs. In addition, each time point was taken independently, without interruption, and not consecutively.

3. Results and Discussion

3.1. Electrical Characterization of DBD Plasmas over the Water Surface

The Lissajous curves were plotted for the DBD plasmas generated by four gas feedings mentioned previously, as shown in Figure 2. The applied voltage for air, nitrogen, and oxygen was adjusted to be 12 kV, whereas the applied voltage for argon was adjusted to be 6 kV to avoid arc discharge. The area of the curve determines the consumed energy per cycle time. The area of the curve was estimated for air, nitrogen, oxygen, and argon gas feedings to be 9.95 mJ, 9.82 mJ, 9.82 mJ, 4.64 mJ, respectively. By assuming the cycle time of 50 µs, the consumed power was obtained to be around 200 W for each cycle time with air, nitrogen, and oxygen plasmas, whereas in the case of argon plasma, it was 93 W for each cycle time. Therefore, considering the duty cycle that is 0.2, the consumed power of DBD during the discharge (averaged) for air, nitrogen, and oxygen gas feeding is 40 W. In contrast, this value for the argon DBD is estimated to be 18.6 W. The consumed energy and power for one cycle time and averaged for each DBD were presented in Table 1.
The Lissajous curve deviates (or rotates) a little bit with different gas feedings. This deviation indicates that using different gas feedings changes plasma conditions and thus affects the Lissajous curve. A similar deviation was observed in a DBD reactor with nitrogen and a mixture of nitrogen and oxygen species [20].

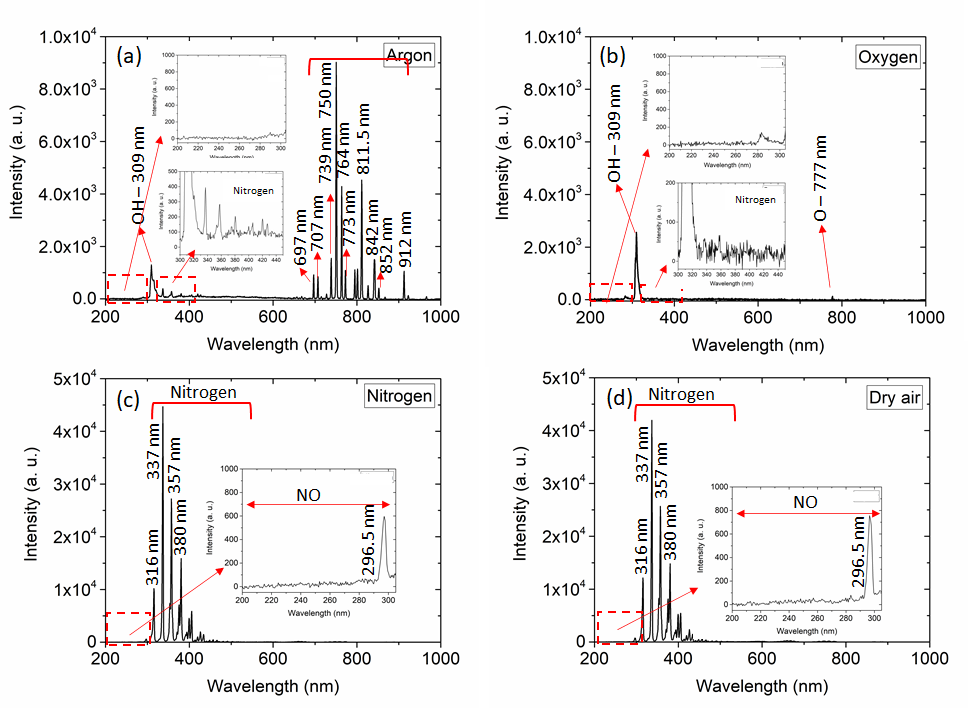
3.2. Spectroscopic Characterization of DBD Plasmas over the Water Surface

Figure 3 presents the OES results for DBDs with various gases in an interaction with the distilled water. Based on the OES results, in addition to argon and oxygen spectra, hydroxyl appears in argon and oxygen DBDs in interaction with water molecules. In contrast, the spectra for air and nitrogen DBDs provide mainly nitrogen species, and the spectra patterns are almost identical. Nevertheless, a weak signal of the nitrogen spectra is observed in the cases of argon and oxygen DBD plasmas (Figure 3a,b) due to the interaction with the ambient air. We take this advantage to estimate neutral gas and electron temperatures based on the second positive line of the nitrogen band.
Table 1 shows the neutral gas and electron temperatures, estimated by Specair software, in the gas phase. The calculation of Specair software is based on modeling, which describes the energy level of the included species. Two estimated parameters: electron temperature and rotational temperature, were determined by the respective Boltzmann population distributions of the internal energy levels [22]. The rotational temperature represents the neutral gas temperature at atmospheric pressure. The fitting, including the convolution of instrumental function of the spectrometer, was performed in the range of 370–384 nm (second positive of nitrogen band) to estimate the rotational temperature [23]. The fitting to evaluate the electron temperature was performed with the nitrogen peak wavelength of 337 nm. The gas temperature range was estimated between 0.03 to 0.09 eV, while the electron temperature range was 0.7 to 0.9 eV for all DBD plasmas. The electron temperature is much higher than the gas temperature for all DBD plasmas shown in Table 1. Therefore, the DBD plasmas are considered non-thermal plasmas for all gas feeding, although the gas temperature is relatively high for air and nitrogen plasmas. The energetic electrons, in this investigation, can make dissociation and ionization that is responsible for the generation of radicals and reactive species [24,25].

3.3. Possible Reactions in the Interaction of DBD Plasmas and Water Molecules

Despite the type of gas species used during the treatment with considering the electron temperature that is around 1 eV for all DBD plasmas, the collision of electrons with water molecules might provide the following reactions [26]:
e + H2O → OH• + H + e
e + H2O → H2O* + e
e + H2O* → H2O+ + 2e
H2O+ H2O+ → OH• + H3O+
In addition, the water molecule is dissociated by the following reaction:
H2O + M* → OH• + H + M
where M represents the excited species as shown in Reactions 9, 13, and 18.
In addition to the above reactions, in the case of argon DBD plasma, the excited atoms formed in the gas phase in interaction with water molecules generate hydroxyl radicals [27].
Ar + e → Ar+ + e + e
Ar + e → Ar* + e
Ar* + H2O → Ar + OH• + H
In the case of oxygen plasmas, produced excited oxygen species, and then in interaction with water molecule give the following reactions [28]:
O2 + e → O+ + O + 2e
O2 + e → O + O
O + O2 → O3
O + H2O → 2 OH•
O3 + OH → HO2 + O2
O3 + HO2 → OH• + O2 + O2
The following procedures occur in the gas phases of nitrogen DBD plasmas [28].
e + N2 → N+ N + e
e + N2 → N2* + e
N* + H2O → N + OH• + H
N* + H2O → OH• + NH
N2* + H2O → N2 + H + OH•
H2O + → OH• + H
In addition to Reactions 10–20, the following reactions in the gas phase of air DBD plasmas are also included:
e + N2 + O2 → 2N + 2O + e
N + O → NO•
N+ O2 → NO• + O
O + N2 → NO• + N
H2O + → OH• + H
Excited molecular nitrogen (N2*) in Reaction 17 as well as nitric oxide radical (NO) in Reactions 23–25 can be observed in the nitrogen and air spectra (Figure 3c,d) in the wavelength range of 280 to 450 nm. However, excited atomic nitrogen was not observed in the spectra as the wavelength range is less than 200 nm [29]. This range which relies on the vacuum ultraviolet (VUV), is out of the wavelength range of our spectrometer. As shown in the nitrogen and air spectra (Figure 3c,d), both DBD plasmas generate nitric oxide radicals. It is known that the air DBD generates nitric oxide radical because of Reactions 23–25. In the case of nitrogen DBD, after generating NH species by Reaction 19, nitric oxide radicals can be generated by the following reaction [28]:
NH + OH• → H2 + NO•
Besides, the hydroxyl radicals are quenched by interacting with active nitrogen species in the gas phase [30]. That is the reason the wavelength peak of hydroxyl radical is not observed in the nitrogen and air spectra (Figure 3c,d). Nevertheless, the hydroxyl radical might be produced in nitrogen and air DBD plasmas due to Reactions 18–20, and 26.

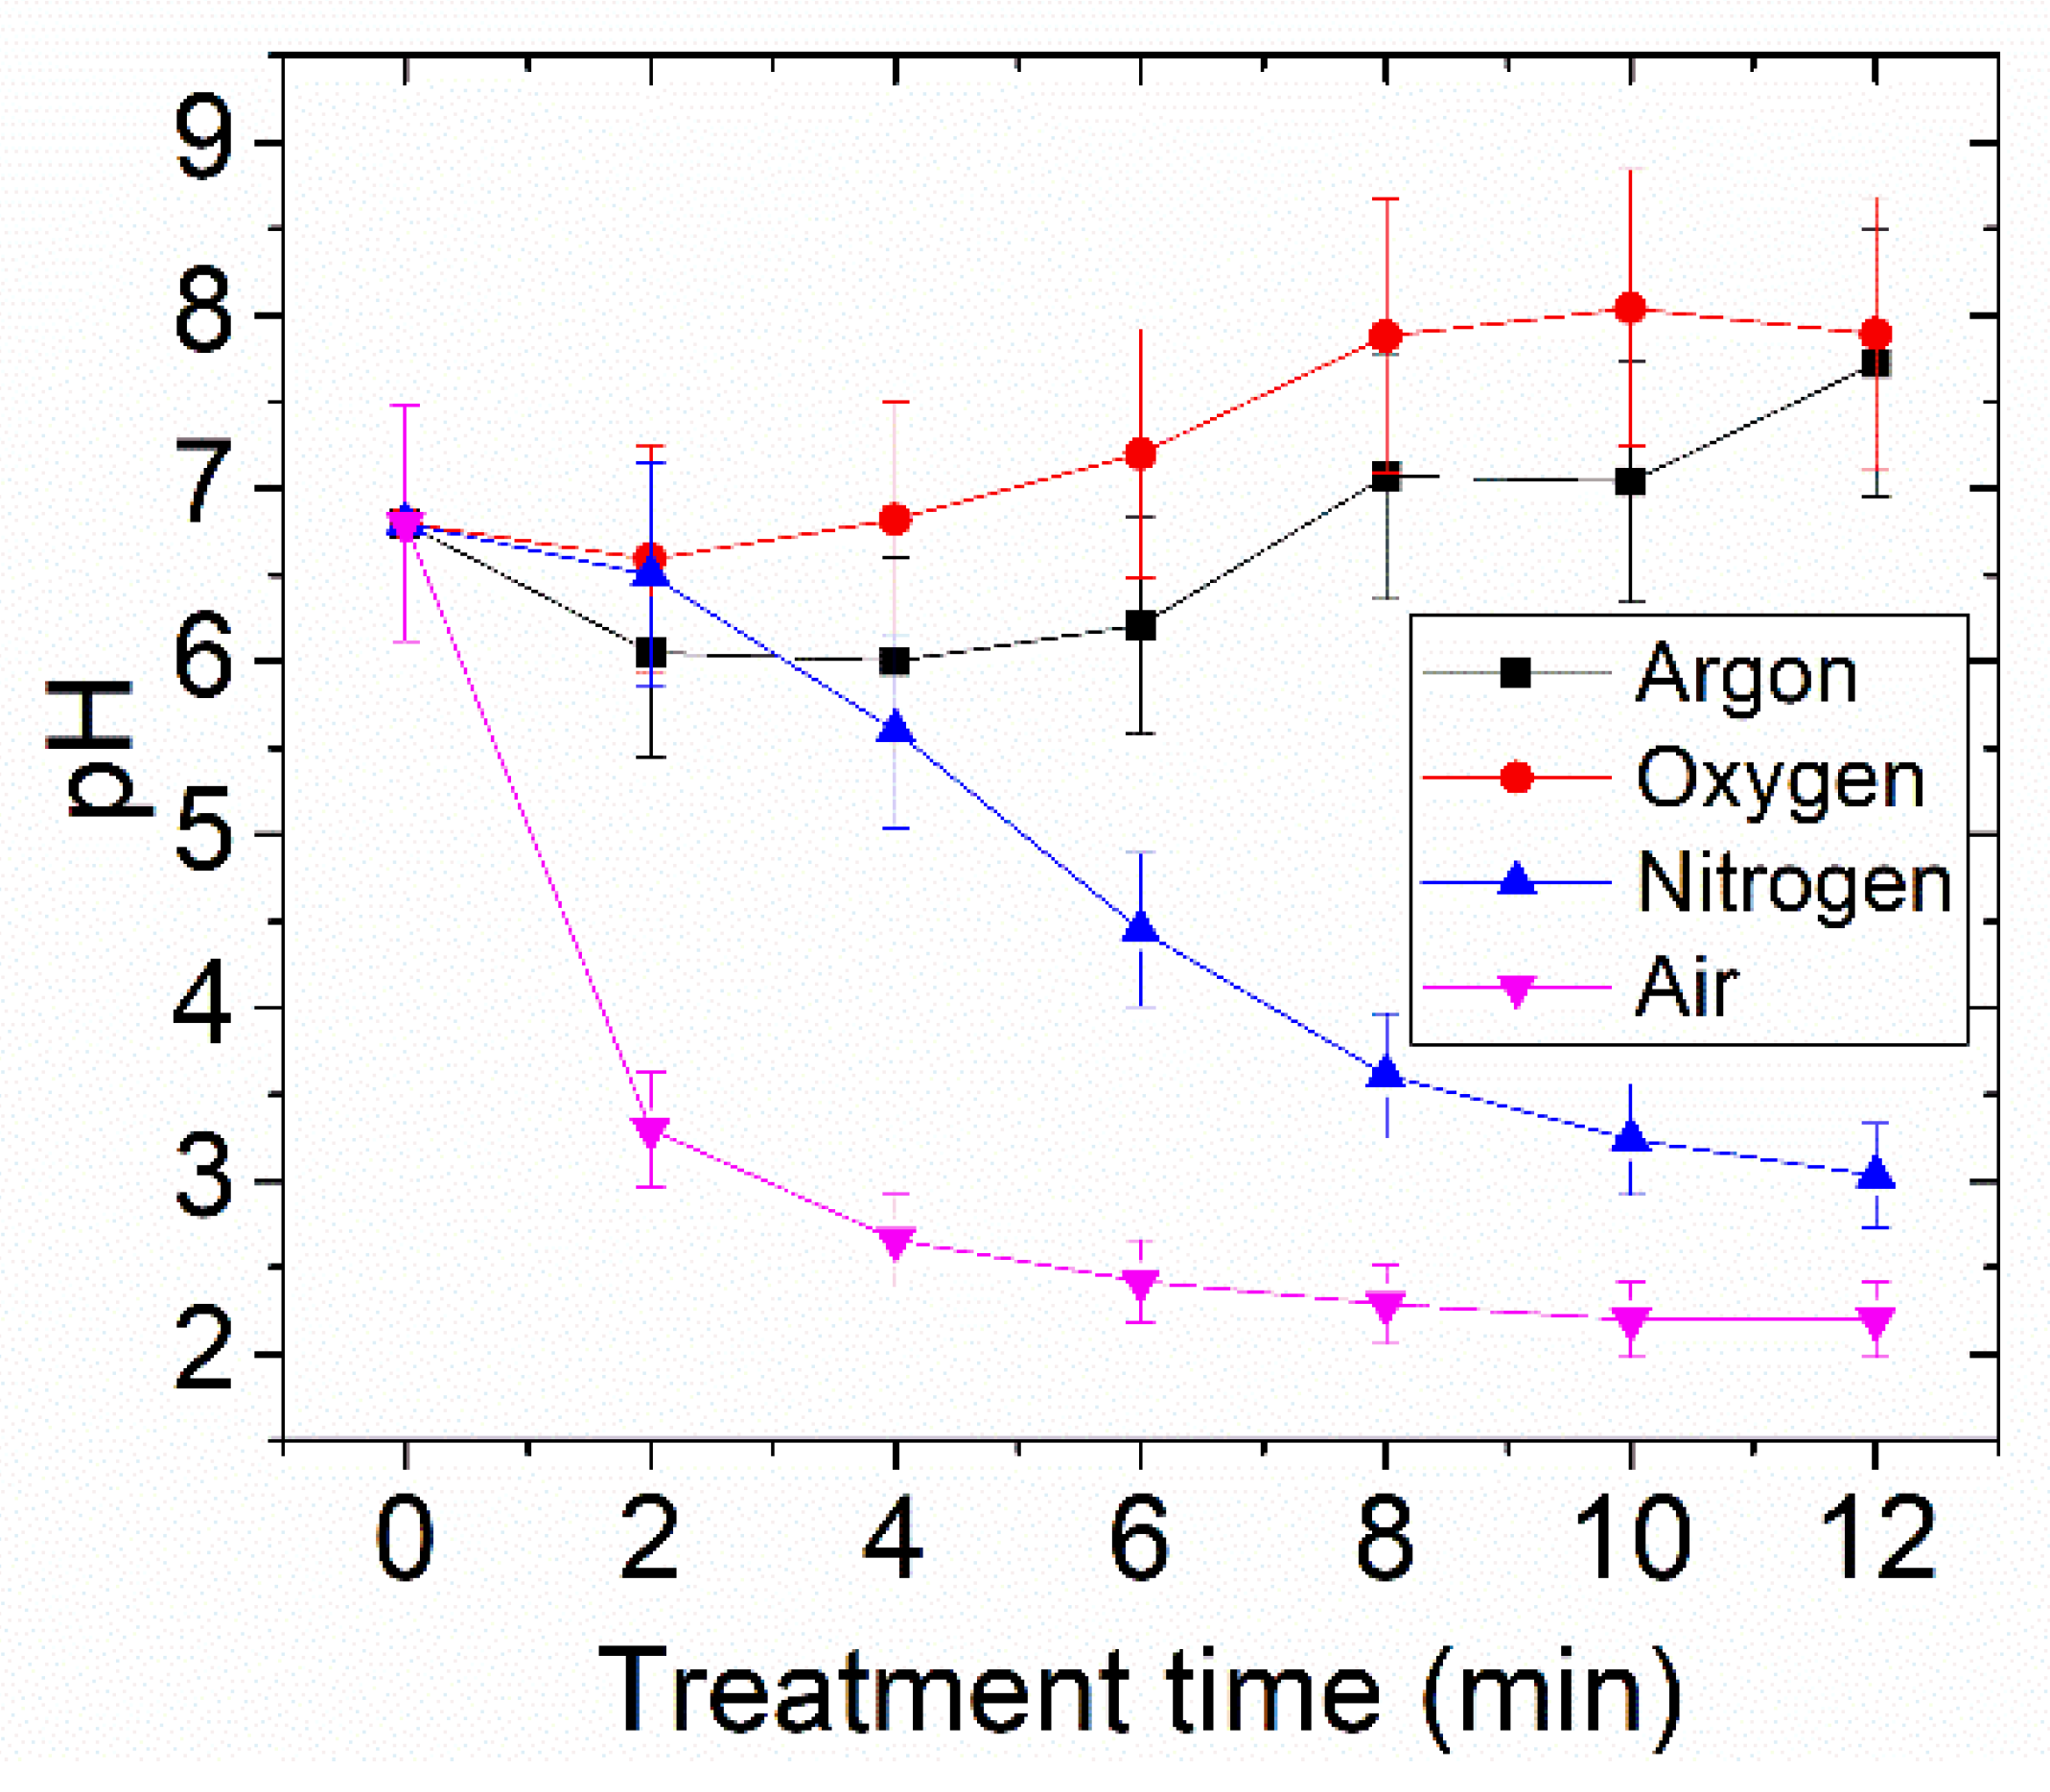
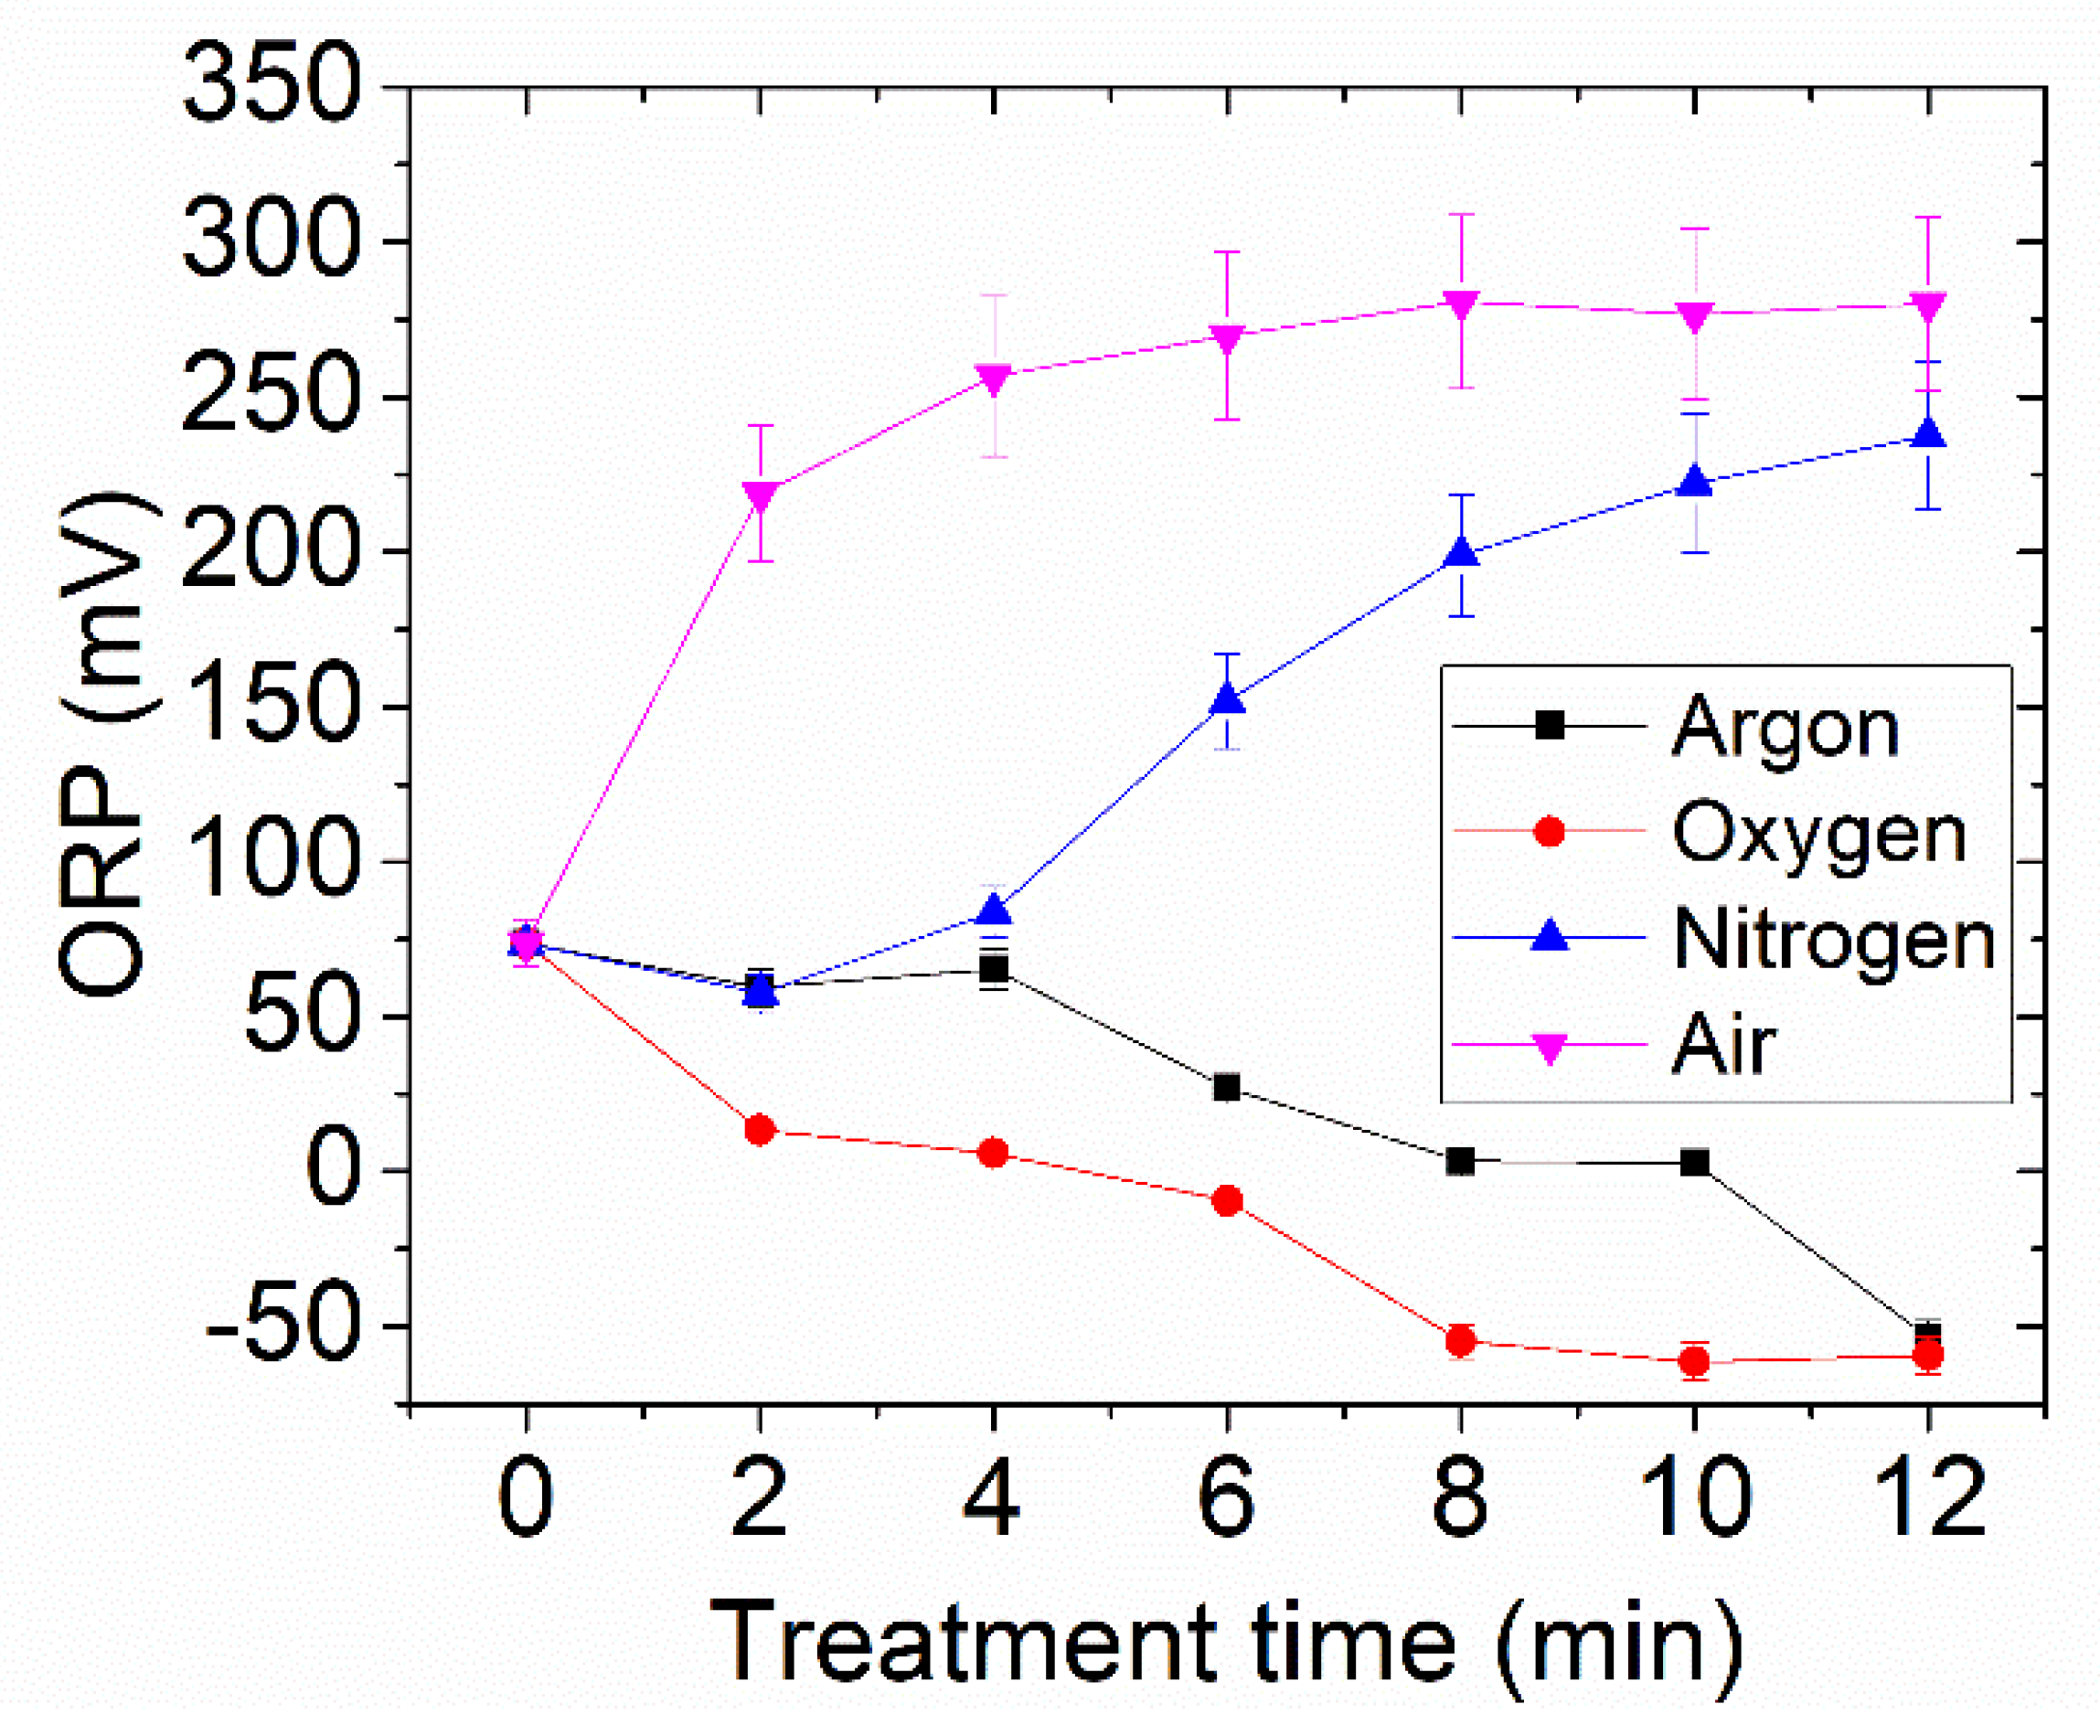
3.4. Measurements of pH and ORP Level

Figure 4 shows the pH level of the PAW versus treatment time for various gas feedings. There was a declining trend in the pH values, and thus the acidity level of distilled water raised using plasma treatment with air and nitrogen gas feedings. We may have nitrous acid because of nitric oxide radicals (Reactions 23–25) in the nitrogen and air DBD plasmas. Following the above reactions, some reactions may occur in both the gas and liquid phases [28,31]:
NO• + OH• → HNO2
OH• + HNO2 → H2O + NO2
OH• + NO2 → HNO3
It is known that nitrous acid is a weak and unstable acid in the liquid. During an oxidation process, nitrite reacts with hydrogen peroxide to generate nitrous acid [18,26,32].
OH• + OH• → H2O2
NO2 + H2O2 + OH• → HNO2 + H2O
The decomposition of nitrous acid inside the water leads to the generation of proxy-nitrous acid [33], which is a strong acid and thus provides an acidic medium.
HNO2 → HNO3 + 2NO + H2O
Nitrite (Reaction 32), generated inside water, originally comes from the dissolution of nitrogen oxides. For instance, nitric oxide can be oxidized to generate nitrogen dioxide (NO2) [34]. Then it is dissolved into water to generate nitrite and nitrate [18]. Therefore, a significant reduction of the pH value in water is due to nitrite’s presence and formation. In comparison, the pH level of treated water with argon and oxygen plasma treatments does not change significantly due to the lack of nitrogen species. In this case, the pH values remain between 6 to 8 during the plasma treatment. Due to the lack of nitrogen and limited interaction with ambient air, it leads to extremely small values of nitrite and nitrate inside the PAW, so the pH value does not decrease significantly.
Figure 5 shows the ORP values, which reflect electron transfer ability through chemical reaction strength in the PAW versus treatment time with different feeding gases. The figure depicts two main trends: the first corresponds to the argon and oxygen plasmas treatment, which tend to decline. The other corresponds to the nitrogen and air plasma treatment which has a rising trend. It means that nitrogen and air plasma oxidizing species generated inside the PAW are stronger than argon and oxygen plasmas, probably due to nitrous and proxy-nitrous acid in nitrogen and air DBD plasmas (Reactions 28, 30, 32, and 33). As a comparison of trends in pH (Figure 4) and ORP (Figure 5), high ORP and low pH values appeared with increasing treatment time in the cases of air and nitrogen DBD systems. A similar result was reported by C.Y. Hou et al. [35] and C.M. Lin et al. [36] in a PAW generated by an air plasma jet. Abuzairi et al. [37] presented a PAW using an air surface discharge. ORP and pH trends are the same as our air and nitrogen DBD systems, although they measured three timepoints merely. In addition, Hoeben et al. [38] measured ORP and pH values of a PAW in an arc discharge. ORP versus pH values have the same trend compared to our system, although the discharge regime is different from our air and nitrogen DBD systems. In contrast, the pH value of PAW generated by cold argon/oxygen plasma microjet reported by Tian et al. [20] does not change significantly, although the ORP level increases slightly.

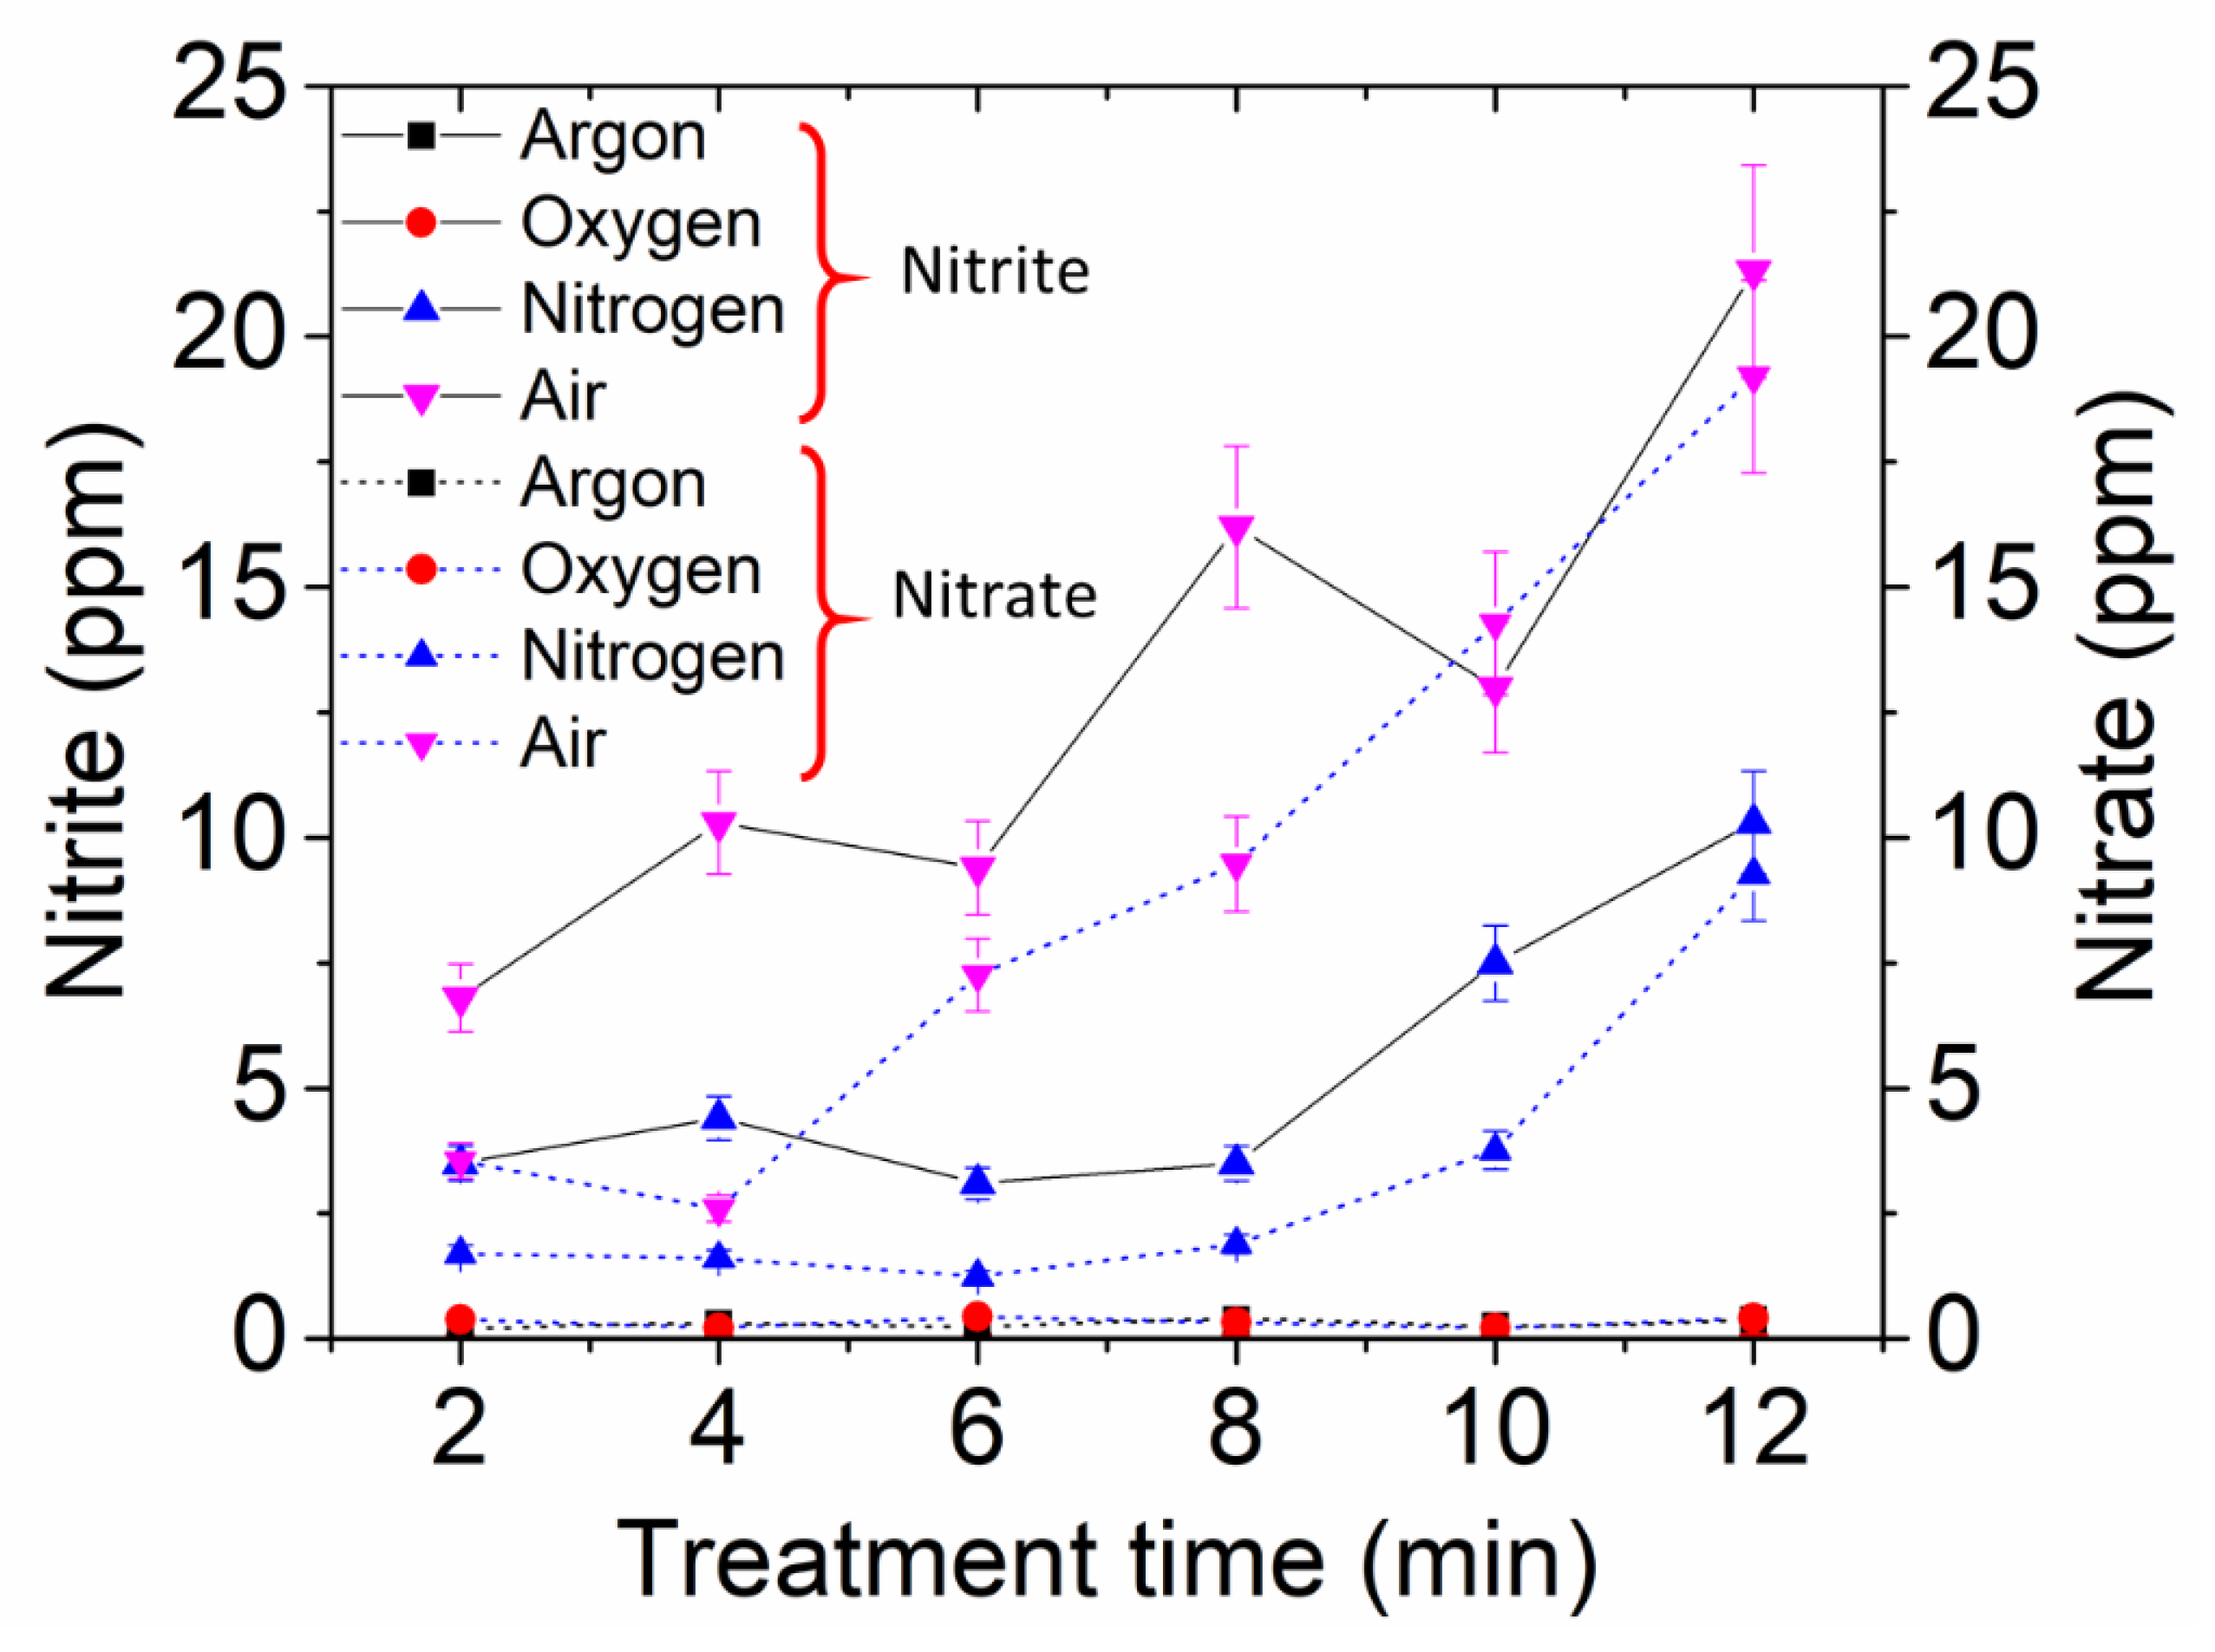
3.5. Measurements of Nitrite and Nitrate

Figure 6 shows the nitrite and nitrate concentrations as a function of treatment time. In the case of oxygen and argon plasmas, nitrite was not detected, and nitrate concentration was extremely low. Since both nitrogen and oxygen species are present in the air during the plasma process, nitrite and nitrate concentrations in the air plasma are higher than nitrogen plasmas, as shown in Figure 6. Similar results associated with the produced nitrite and nitrate were reported using a needle electrode with the mixture of nitrogen and oxygen [18]. Spark and glow discharges using a needle electrode are able to generate PAW with a high acidity level (low pH level) [39]. Nitrite and nitrate concentrations rise by increasing treatment time. As mentioned before, the presence of nitrite and nitrate as oxidizing agents results in reducing the pH value of PAW [30,40].

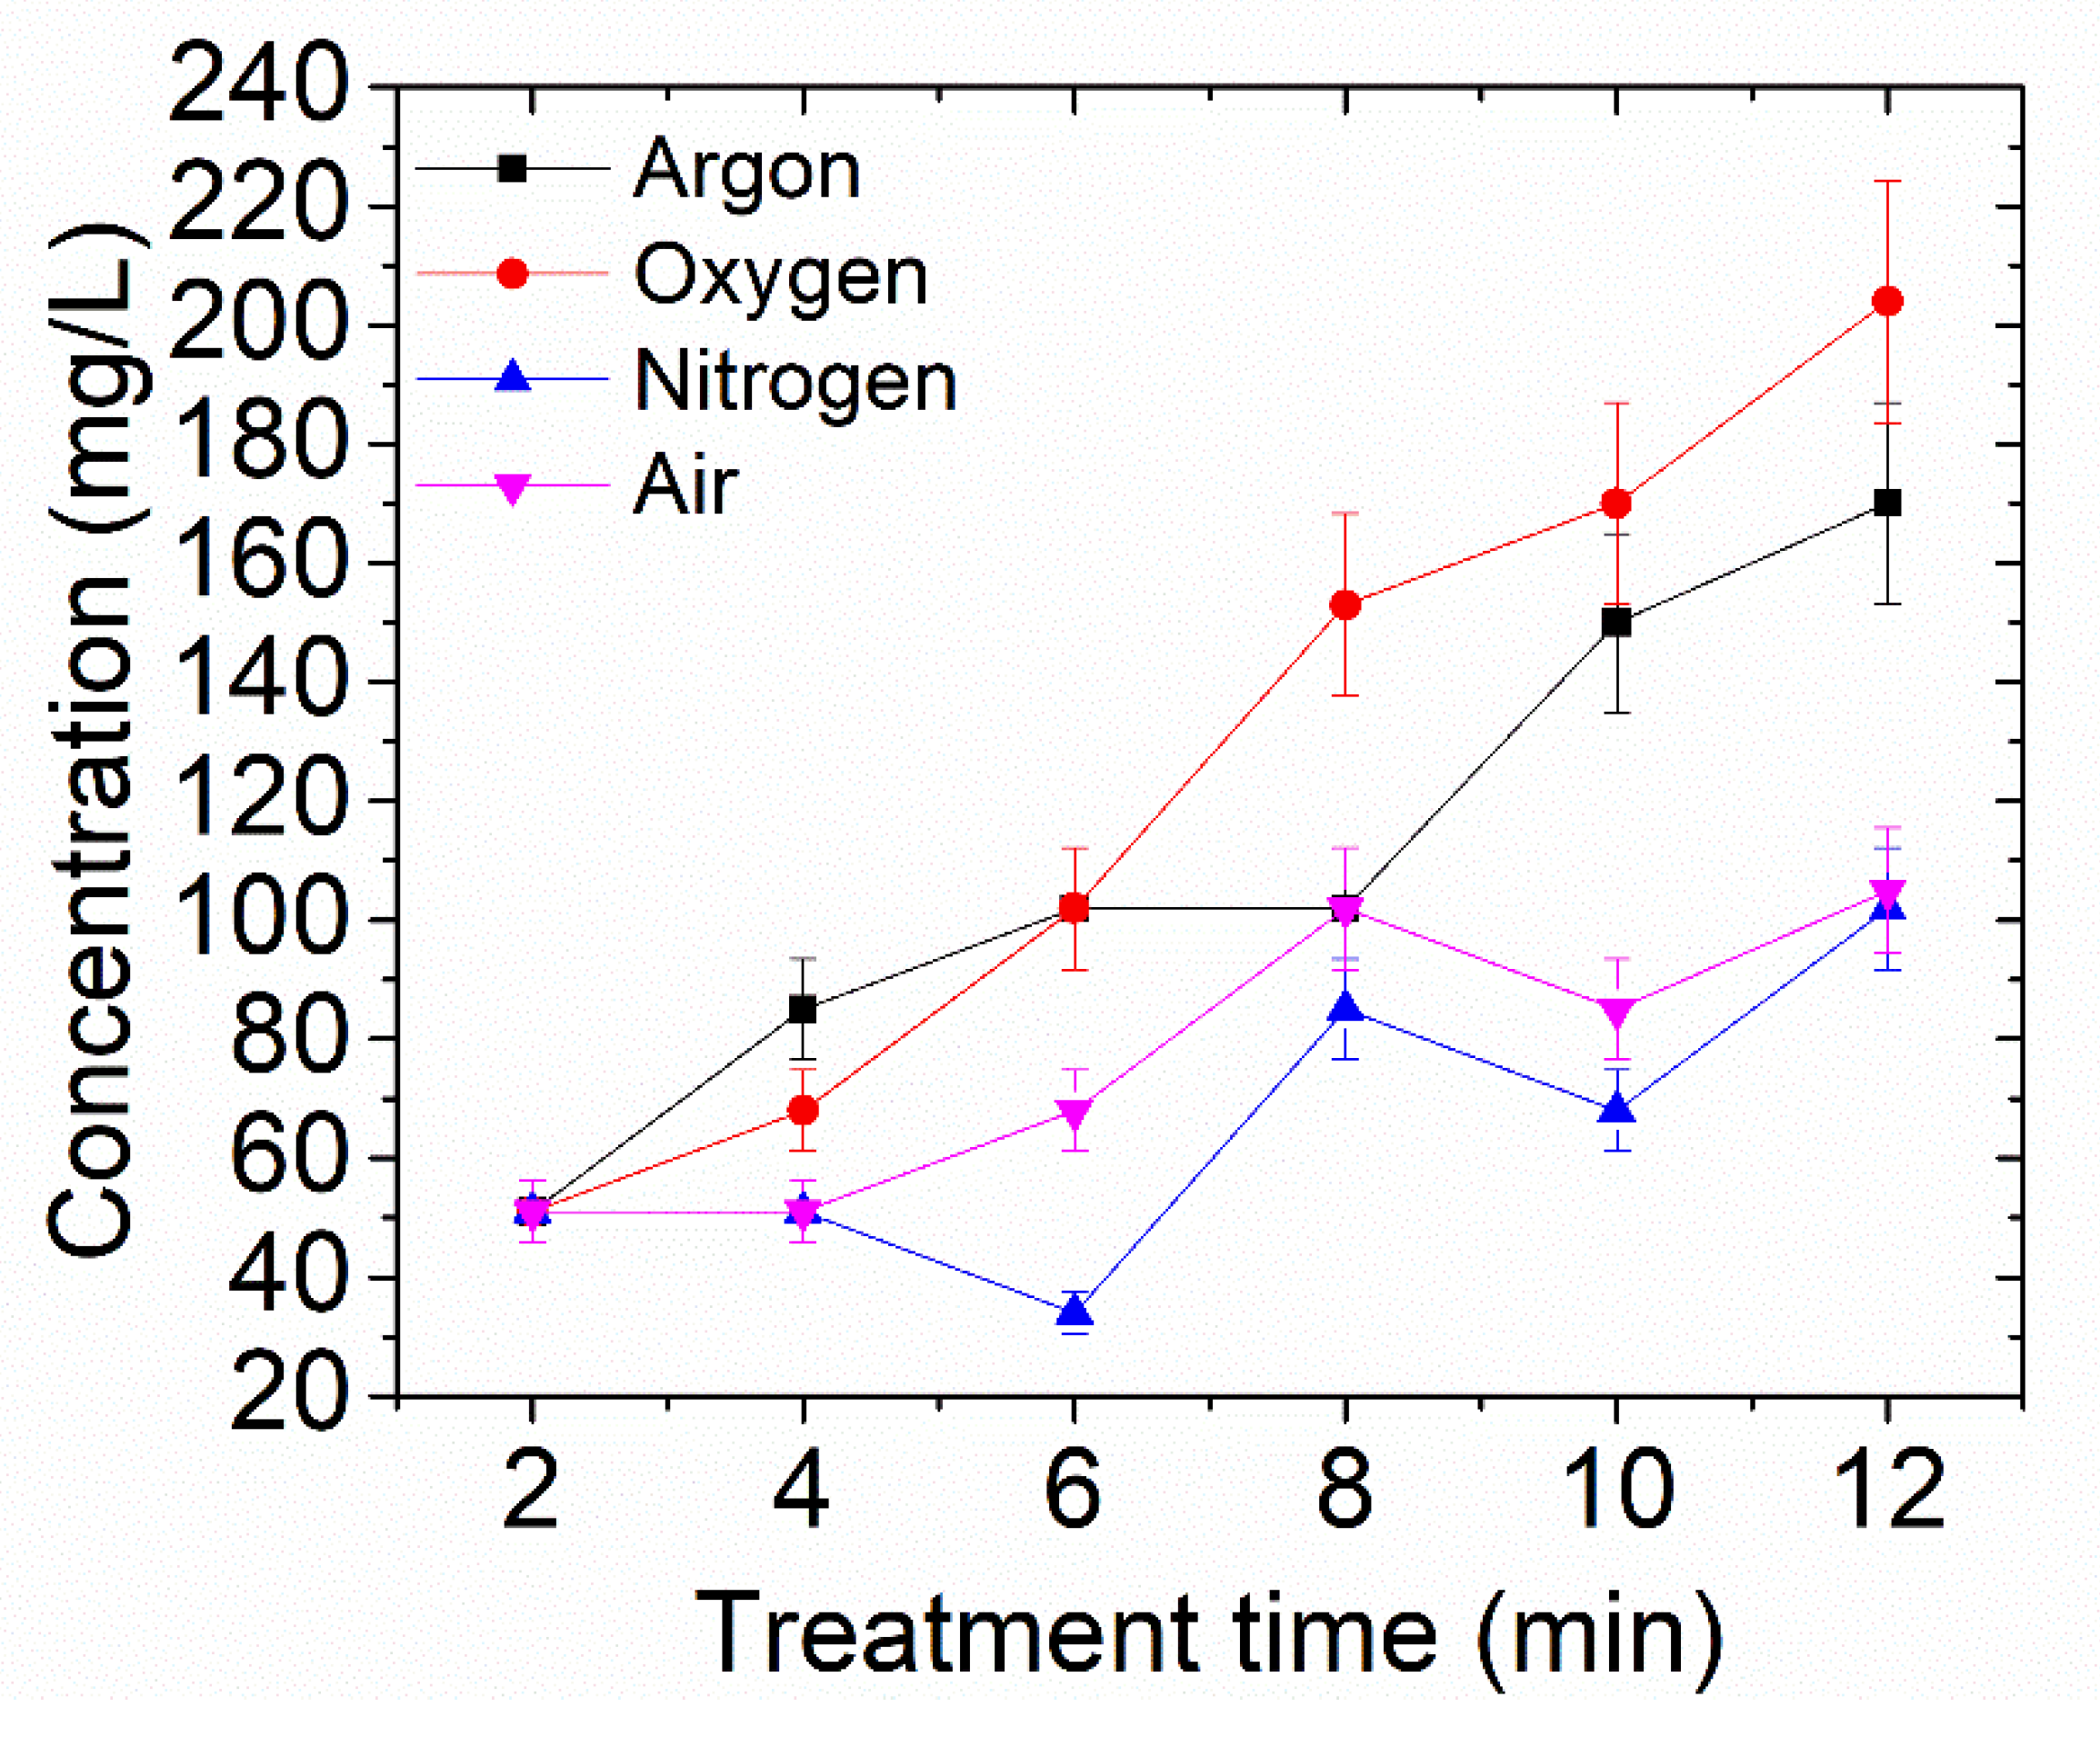
3.6. Measurement of Hydrogen Peroxide

Figure 7 shows the hydrogen peroxide concentration as a function of the treatment time. Although all gas feedings can provide the hydrogen peroxide content, the oxygen and argon plasmas are the best candidates to generate a high concentration of hydrogen peroxide. The ORP level of PAW generated by argon and oxygen plasmas is much lower than the other DBDs. On the other hand, the hydrogen peroxide concentration is at a higher level in both cases. As shown in OES data of Figure 3a,b, the hydroxyl peak can be observed clearly for both gas phases of oxygen and argon. The hydroxyl radicals are the primary source of hydrogen peroxide production [26]. According to Henry’s constant, the value of dissolved gas in water is proportional to the partial pressure above the water. It is known that the hydroxyl has a relatively high Henry’s constant [32,41,42]. Hence, the hydroxyl can be dissolved easily inside the treated water. It can be the main reason that the hydrogen peroxide concentration is high for the plasmas mentioned above. As shown in Figure 4, the pH value of the PAW generated by oxygen and argon plasmas does not decrease compared to the other DBD plasma systems. Therefore, the PAW generated by oxygen and argon might be a proper choice in our DBD system as a plasma treatment for biological tissue. Because they do not provide an acidic medium, and hydrogen peroxide is supplied as an antibacterial effect.
Generally, the developed DBD system reported in our investigation has an extremely limited interaction with ambient air, and that is an isolated system related to ambient air. On the other hand, many articles reported PAWs generated by various plasma sources interacting with ambient air, or the working gas is air, as mentioned before. Some reported PAWs generated by argon or oxygen interacting with ambient air, while the pH value of PAW is low, and the medium is acidic [43]. Thus, the varieties of reactive species generated in DBD systems might differ, specifically the generation of nitrite and nitrate responsible for the variation of pH and ORP levels compared to our DBD system. As a result, PAW properties’ values and trends might not be the same, and comparison might be difficult, as we already mentioned in the introduction. Nevertheless, we propose our developed DBD system to control pH value, nitrite, nitrate, and hydrogen peroxide contents using different gas feedings.

4. Conclusions

The effect of gas species was investigated by various DBD plasmas with air, nitrogen, oxygen, and argon gas feedings on PAW properties. Electrical and spectroscopic methods were employed to estimate the consumed energy and power as well as the neutral gas and electron temperatures. It was found that the air and nitrogen plasmas provide an acidic medium, whereas, in the cases of oxygen and argon, the pH does not change significantly. It can be explained that since various gas feedings provide different reactive species as we described them by the OES method, PAW properties can change by changing the gas feeding. Hydrogen peroxide level reaches a maximum level in PAW produced by oxygen plasma, while the pH level remains between six to eight. Since we are able to control reactive species such as hydrogen peroxide, nitrite, and nitrate inside the PAW with various gas feedings, this study takes a step toward the practical use of plasmas on various biological, food, and agriculture applications.

Author Contributions

Experiments, investigation, spectroscopic analysis, and writing N.B.; supervision, W.-H.K.; experiments, hydrogen peroxide and ICS measurements Y.-Y.H.; supervision and correspondence J.-H.H. All authors have read and agreed to the published version of the manuscript.

Funding

This research received no external funding.

Institutional Review Board Statement

Not applicable.

Informed Consent Statement

Not applicable.

Data Availability Statement

Not applicable.

Conflicts of Interest

The authors declare no conflict of interest.

References

  1. Thirumdas, R.; Kothakota, A.; Annapure, U.; Siliveru, K.; Blundell, R.; Gatt, R.; Valdramidis, V.P. Plasma activated water (PAW): Chemistry, physico-chemical properties, applications in food and agriculture. Trends Food Sci. Technol. 2018, 77, 21–31. [Google Scholar] [CrossRef]
  2. Zhou, R.; Zhou, R.; Wang, P.; Xian, Y.; Mai-Prochnow, A.; Lu, X.; Cullen, P.; Ostrikov, K.K.; Bazaka, K. Plasma-activated water: Generation, origin of reactive species and biological applications. J. Phys. D Appl. Phys. 2020, 53, 303001. [Google Scholar] [CrossRef]
  3. Traylor, M.J.; Pavlovich, M.J.; Karim, S.; Hait, P.; Sakiyama, Y.; Clark, D.S.; Graves, D.B. Long-term antibacterial efficacy of air plasma-activated water. J. Phys. D Appl. Phys. 2011, 44, 472001. [Google Scholar] [CrossRef] [Green Version]
  4. Xu, Y.; Tian, Y.; Ma, R.; Liu, Q.; Zhang, J. Effect of plasma activated water on the postharvest quality of button mushrooms, Agaricus bisporus. Food Chem. 2016, 197, 436–444. [Google Scholar] [CrossRef]
  5. Shaw, P.; Kumar, N.; Kwak, H.S.; Park, J.H.; Uhm, H.S.; Bogaerts, A.; Choi, E.H.; Attri, P. Bacterial inactivation by plasma treated water enhanced by reactive nitrogen species. Sci. Rep. 2018, 8, 1–10. [Google Scholar] [CrossRef] [Green Version]
  6. Bruggeman, P.; Leys, C. Non-thermal plasmas in and in contact with liquids. J. Phys. D Appl. Phys. 2009, 42, 053001. [Google Scholar] [CrossRef]
  7. Akiyama, H. Streamer discharges in liquids and their applications. IEEE Trans. Dielectr. Electr. Insul. 2000, 7, 646–653. [Google Scholar] [CrossRef]
  8. Takahashi, K.; Sasaki, Y.; Mukaigawa, S.; Takaki, K.; Fujiwara, T.; Satta, N. Purification of high-conductivity water using gas–liquid phase discharge reactor. IEEE Trans. Plasma Sci. 2010, 38, 2694–2700. [Google Scholar] [CrossRef]
  9. Prousek, J. Advanced oxidation processes for water treatment. Chem. Process Chem. Listy 1996, 90, 229–237. [Google Scholar]
  10. Kaushik, N.K.; Ghimire, B.; Li, Y.; Adhikari, M.; Veerana, M.; Kaushik, N.; Jha, N.; Adhikari, B.; Lee, S.-J.; Masur, K.; et al. Biological and medical applications of plasma-activated media, water and solutions. Biol. Chem. 2019, 400, 39–62. [Google Scholar] [CrossRef]
  11. Burlica, R.; Grim, R.; Shih, K.Y.; Balkwill, D.; Locke, B. Bacteria inactivation using low power pulsed gliding arc discharges with water spray. Plasma Process. Polym. 2010, 7, 640–649. [Google Scholar] [CrossRef]
  12. Ghimire, B.; Szili, E.J.; Patenall, B.L.; Lamichhane, P.; Gaur, N.; Robson, A.J.; Trivedi, D.; Thet, N.T.; Jenkins, A.T.A.; Choi, E.H. Enhancement of hydrogen peroxide production from an atmospheric pressure argon plasma jet and implications to the antibacterial activity of plasma activated water. Plasma Sources Sci. Technol. 2021, 30, 035009. [Google Scholar] [CrossRef]
  13. Ivannikov, A.; Lelevkin, V.; Tokarev, A.; Yudanov, V. Atmospheric-pressure glow discharge treatment of water. High Energy Chem. 2003, 37, 115–118. [Google Scholar] [CrossRef]
  14. Ouyang, J.-T.; Cao, J.; Miao, J.-S. Effect of Electrode Configuration on the Discharge Characteristics of Plasma Display Cell. J. Beijing Inst. Technol. 2005, S1. [Google Scholar]
  15. Uchida, G.; Takenaka, K.; Setsuhara, Y. Effects of discharge voltage waveform on the discharge characteristics in a helium atmospheric plasma jet. J. Appl. Phys. 2015, 117, 153301. [Google Scholar] [CrossRef]
  16. Wang, Y.S.; Ding, W.D.; Wang, Y.N.; Wang, J.C.; Li, F.; Fan, C. The effect of frequency on atmospheric pressure glow discharge in a pin-to-plate gap sustained by a resonant power supply. Phys. Plasmas 2016, 23, 063518. [Google Scholar] [CrossRef]
  17. Thagard, S.M.; Takashima, K.; Mizuno, A. Chemistry of the positive and negative electrical discharges formed in liquid water and above a gas–liquid surface. Plasma Chem. Plasma Process. 2009, 29, 455–473. [Google Scholar] [CrossRef]
  18. Ke, Z.; Thopan, P.; Fridman, G.; Miller, V.; Yu, L.; Fridman, A.; Huang, Q. Effect of N2/O2 composition on inactivation efficiency of Escherichia coli by discharge plasma at the gas-solution interface. Clin. Plasma Med. 2017, 7, 1–8. [Google Scholar] [CrossRef]
  19. Neretti, G.; Taglioli, M.; Colonna, G.; Borghi, C. Characterization of a dielectric barrier discharge in contact with liquid and producing a plasma activated water. Plasma Sources Sci. Technol. 2016, 26, 015013. [Google Scholar] [CrossRef]
  20. Tian, Y.; Ma, R.; Zhang, Q.; Feng, H.; Liang, Y.; Zhang, J.; Fang, J. Assessment of the physicochemical properties and biological effects of water activated by non-thermal plasma above and beneath the water surface. Plasma Process. Polym. 2015, 12, 439–449. [Google Scholar] [CrossRef]
  21. Reichert, J.; McNeight, S.; Rudel, H. Determination of hydrogen peroxide and some related peroxygen compounds. Ind. Eng. Chem. Anal. Ed. 1939, 11, 194–197. [Google Scholar] [CrossRef]
  22. Laux, C. Radiation and Nonequilibrium Collisional-Radiative Models, von Karman Institute Lecture Series 2002–07, Physico-Chemical Modeling of High Enthalpy and Plasma Flows; Fletcher, D., Charbon, J.M., Sarma, G., Magin, T., Eds.; Rhode-Saint-Genèse, Belgium, 2002; Available online: https://store.vki.ac.be/lecture-series-monographs.html?cat=4&mode=list&price=-100 (accessed on 1 July 2021).
  23. Koike, S.; Sakamoto, T.; Kobori, H.; Matsuura, H.; Akatsuka, H. Spectroscopic study on vibrational nonequilibrium of a microwave discharge nitrogen plasma. Jpn. J. Appl. Phys. 2004, 43, 5550. [Google Scholar] [CrossRef]
  24. Laux, C.O.; Spence, T.; Kruger, C.; Zare, R. Optical diagnostics of atmospheric pressure air plasmas. Plasma Sources Sci. Technol. 2003, 12, 125. [Google Scholar] [CrossRef]
  25. Bruggeman, P.J.; Iza, F.; Brandenburg, R. Foundations of atmospheric pressure non-equilibrium plasmas. Plasma Sources Sci. Technol. 2017, 26, 123002. [Google Scholar] [CrossRef] [Green Version]
  26. Bruggeman, P.; Schram, D.C. On OH production in water containing atmospheric pressure plasmas. Plasma Sources Sci. Technol. 2010, 19, 045025. [Google Scholar] [CrossRef]
  27. Lukes, P.; Locke, B.R. Plasmachemical oxidation processes in a hybrid gas–liquid electrical discharge reactor. J. Phys. D Appl. Phys. 2005, 38, 4074. [Google Scholar] [CrossRef]
  28. Teodoru, S.; Kusano, Y.; Bogaerts, A. The effect of O2 in a humid O2/N2/NOx gas mixture on NOx and N2O remediation by an atmospheric pressure dielectric barrier discharge. Plasma Process. Polym. 2012, 9, 652–689. [Google Scholar] [CrossRef]
  29. Fierro, A.; Laity, G.; Neuber, A. Optical emission spectroscopy study in the VUV–VIS regimes of a developing low-temperature plasma in nitrogen gas. J. Phys. D Appl. Phys. 2012, 45, 495202. [Google Scholar] [CrossRef]
  30. Shen, J.; Zhang, H.; Xu, Z.; Zhang, Z.; Cheng, C.; Ni, G.; Lan, Y.; Meng, Y.; Xia, W.; Chu, P.K. Preferential production of reactive species and bactericidal efficacy of gas-liquid plasma discharge. Chem. Eng. J. 2019, 362, 402–412. [Google Scholar] [CrossRef]
  31. Tang, X.; Wang, J.; Yi, H.; Zhao, S.; Gao, F. Nitrogen fixation and NO conversion using dielectric barrier discharge reactor: Identification and evolution of products. Plasma Chem. Plasma Process. 2018, 38, 485–501. [Google Scholar] [CrossRef]
  32. Yue, Y.F.; Mohades, S.; Laroussi, M.; Lu, X. Measurements of plasma-generated hydroxyl and hydrogen peroxide concentrations for plasma medicine applications. IEEE Trans. Plasma Sci. 2016, 44, 2754–2758. [Google Scholar] [CrossRef]
  33. Lewis, G.N.; Edgar, A. The Equilibrium between Nitric Acid, Nitrous Acid and Nitric Oxide. J. Am. Chem. Soc. 1911, 33, 292–299. [Google Scholar] [CrossRef]
  34. Malik, M.A. Nitric oxide production by high voltage electrical discharges for medical uses: A review. Plasma Chem. Plasma Process. 2016, 36, 737–766. [Google Scholar] [CrossRef]
  35. Hou, C.-Y.; Lai, Y.-C.; Hsiao, C.-P.; Chen, S.-Y.; Liu, C.-T.; Wu, J.-S.; Lin, C.-M. Antibacterial activity and the physicochemical characteristics of plasma activated water on tomato surfaces. LWT 2021, 149, 111879. [Google Scholar] [CrossRef]
  36. Lin, C.-M.; Hsiao, C.-P.; Lin, H.-S.; Liou, J.S.; Hsieh, C.-W.; Wu, J.-S.; Hou, C.-Y. The antibacterial efficacy and mechanism of plasma-activated water against salmonella enteritidis (ATCC 13076) on shell eggs. Foods 2020, 9, 1491. [Google Scholar] [CrossRef]
  37. Abuzairi, T.; Ramadhanty, S.; Puspohadiningrum, D.F.; Ratnasari, A.; Poespawati, N.R.; Purnamaningsih, R.W. Investigation on physicochemical properties of plasma-activated water for the application of medical device sterilization. In Proceedings of the AIP Conference Proceedings, Bali, Indonesia, 25–26 July 2018; p. 040017. [Google Scholar]
  38. Hoeben, W.; Van Ooij, P.; Schram, D.; Huiskamp, T.; Pemen, A.; Lukeš, P. On the possibilities of straightforward characterization of plasma activated water. Plasma Chem. Plasma Process. 2019, 39, 597–626. [Google Scholar] [CrossRef] [Green Version]
  39. Tsoukou, E.; Delit, M.; Treint, L.; Bourke, P.; Boehm, D. Distinct Chemistries Define the Diverse Biological Effects of Plasma Activated Water Generated with Spark and Glow Plasma Discharges. Appl. Sci. 2021, 11, 1178. [Google Scholar] [CrossRef]
  40. Machala, Z.; Tarabova, B.; Hensel, K.; Spetlikova, E.; Sikurova, L.; Lukes, P. Formation of ROS and RNS in Water Electro-S prayed through Transient Spark Discharge in Air and their Bactericidal Effects. Plasma Process. Polym. 2013, 10, 649–659. [Google Scholar] [CrossRef]
  41. Kurake, N.; Tanaka, H.; Ishikawa, K.; Takeda, K.; Hashizume, H.; Nakamura, K.; Kajiyama, H.; Kondo, T.; Kikkawa, F.; Mizuno, M. Effects of •OH and •NO radicals in the aqueous phase on H2O2 and generated in plasma-activated medium. J. Phys. D Appl. Phys. 2017, 50, 155202. [Google Scholar] [CrossRef]
  42. Sander, R. Compilation of Henry’s law constants (version 4.0) for water as solvent. Atmos. Chem. Phys. 2015, 15, 4399–4981. [Google Scholar] [CrossRef] [Green Version]
  43. Li, Y.; Pan, J.; Ye, G.; Zhang, Q.; Wang, J.; Zhang, J.; Fang, J. In vitro studies of the antimicrobial effect of non-thermal plasma-activated water as a novel mouthwash. Eur. J. Oral Sci. 2017, 125, 463–470. [Google Scholar] [CrossRef]
Figure 1. Schematic of the experimental setup of DBDs over water surface for plasma-activated water. The gases are injected individually via MFC.
Applsci 11 06158 g001
Figure 2. Lissajous plot for air, nitrogen, oxygen, and argon DBD plasmas to calculate the consumed energy and power.
Applsci 11 06158 g002
Figure 3. Optical emission spectroscopy for (a) argon, (b) oxygen, (c) nitrogen, and (d) dry air DBD plasmas in the gas phase.
Applsci 11 06158 g003
Figure 4. Variations of pH level for plasma-treated water as a function of time with four gas feedings: argon, oxygen, nitrogen, and air.
Applsci 11 06158 g004
Figure 5. Variations of ORP level for plasma-activated water as a function of time with four gas feedings: argon, oxygen, nitrogen, and air.
Applsci 11 06158 g005
Figure 6. Nitrite and nitrate measurements inside the plasma-activated water with four gas feedings: argon, oxygen, nitrogen, and air using an ion chromatography system.
Applsci 11 06158 g006
Figure 7. Measurement of the concentration of hydrogen peroxide as a function of treatment time with four gas feedings: argon, oxygen, nitrogen, and air.
Applsci 11 06158 g007
Table 1. Neutral gas and electronic temperatures are measured via OES in various gas species of DBD plasmas, including the consumed energy and power for one cycle time and the averaged consumed power during the discharge.
DBD Plasma (Gas Species)Consumed Energy—One
Cycle Time (mJ)
Consumed
Power-One Cycle Time (W)
Averaged
Consumed
Power
(W)
Neutral
Gas
Temperature
(eV)
Electron
Temperature
(eV)
Argon4.649318.60.03 ± 0.0040.7 ± 0.14
Oxygen9.82200400.05 ± 0.010.6 ± 0.12
Nitrogen9.82200400.09 ± 0.0180.9 ± 0.18
Air9.95200400.09 ± 0.0180.9 ± 0.18
Publisher’s Note: MDPI stays neutral with regard to jurisdictional claims in published maps and institutional affiliations.

