1. Introduction
The virtual environment (VE) is a new HCI interface. Applying virtual reality technology to create 3D scene images, users can interact with VE through input/output devices [
1]. Virtual reality technology has been introduced into an increasing number of fields, such as medical surgery [
2], operation training [
3], and flight simulation [
4].
The existing commonly used virtual reality visual output device is a head-mounted display (HMD), which can provide high immersion at a low/medium price [
5]. Supporting stereo vision, HMDs, such as Oculus Rift and HTC Vive, provide users with visual self-motion feedback based on head movement.
The interaction method in a VE is quite different from the traditional interaction method. The traditional “window, icon, menu, pointing device” (WIMP) paradigm of the graphical user interface (GUI) is mostly used in the interaction with the two-dimensional interface [
6]. A mouse and keyboard are widely used as input devices. The input side of the GUI of the WIMP paradigm supports accurate clicking with one pixel [
7]. However, this kind of interaction is not suitable for virtual interactive objects with three-dimensional coordinates in the VE. The perceived degrees of freedom provided by the VR HMD include the position of x-, y-, and z-axis coordinates. The increased dimension of the depth display is the most essential difference between the 3D and 2D displays [
8]. The interaction with the three-dimensional VE usually relies on bare-hand gesture recognition or the use of VR handle controllers [
9].
The related research on user experience shows that, compared with the handle controller, users are more inclined to choose the method of bare-hand interaction in virtual space [
10]. Using input hardware such as handle controllers in a VE may reduce the naturalness of interaction [
11] and increase the cognitive burden of users [
12], resulting in the decline of interaction performance and user experience. Poorly designed hand-held input devices can increase the difficulty of use and lead to awkward postures due to a non-intuitive design (poor cognitive mapping) and even increase risks for musculoskeletal discomfort during VR interactions [
13,
14]. A commonly used and maturely developed support device for bare-hand interaction is the Leap Motion Controller (LMC), which uses infrared technology for gesture recognition. LMC is a commonly used low-cost gesture capture device [
15], providing access to a skeleton model of a tracked hand to realize hand recognition and tracking. LMC can be attached to head-mounted display (HMD) devices to map the user’s hand to the virtual hand and achieve the real-time acquisition of the hand posture [
16,
17]. Comparing the performance of bare-hand interaction and handle selection interaction based on LMC devices in virtual space, Yu et al. (2018) reported that the handle required a longer time and produced a higher error rate [
18]. Commonly used bare hand interaction includes virtual hand technology and ray technology [
19]. Zhou et al. (2020) compared the interaction methods of bare-hand direct clicks and rays, and found that the movement time and click accuracy of using bare-hand gestures to directly click on targets are better than those found when using rays [
20].
Effective interactions demand, among other things, accurate space perception. However, unlike the relatively accurate space perception in the physical world, compression has been reported in the majority of studies of stereoscopic environments [
21,
22,
23]. Using direct interaction improves spatial judgment in stereoscopic displays and interaction performance [
24]. Therefore, direct click interaction with a bare hand applied to the virtual space of an HMD demonstrates higher usability.
The distribution position of the target object in the VE will affect the interactive performance. Studies have addressed the task of user selection of objects in different locations [
25,
26,
27]. However, these studies did not apply direct click interaction with bare hands or create a VE with HMD equipment. Therefore, the results cannot be applied to design guidelines for direct interaction in virtual spaces based on HMD equipment. Hofmann et al. (2013) conducted a direct click experiment in a VE based on using a data glove and an HMD as input and output devices, and reported that the interactive performance of clicking in the comfortable interactive area within the reach of finger clicks is better than that in the uncomfortable area [
28]. However, wearable devices may have an impact on interactive behavior and, thus, cannot guide research on bare-hand interaction.
This study focuses on the bare-hand interaction problem of direct clicks in the reachable domain by the user’s arm in a VE based on HMD devices. LMC is employed to support an experiment of direct clicks with bare hands in a virtual space. This research explored the effective and efficient interactive area in the VE based on HMD equipment, aiming to provide design suggestions for the layout of interactive components in the VE and improve the usability of virtual interactive components.
2. Materials and Methods
2.1. Participants
Twenty-one participants participated in this study (11 male and 10 female participants; mean age = 22.96, SD = 1.11). All were right-hand dominant with normal or corrected-to-normal vision. After entering the laboratory, participants were first required to adjust the head strap and its interpupillary distance to the most comfortable setting and then become familiar with the VE. They were then required to participate in operation training and keep practicing until they were completely proficient in the operation of freehand interaction.The task of the experiment was to click target objects directly with a bare hand in the VE. All participants received monetary rewards for their participation.
2.2. Apparatus
The prototype used for conducting the clicking task was implemented using the Unity engine and the C# programming language. The click task experiment used the HTC Vive Pro HMD with a binocular resolution of 2880 × 1600 px and a refresh rate of 90 Hz. The device supports stereoscopic to simulate the depth of the field of view (FoV). The HMD provides a field of view of 110°. The head tracking of HMD enables participants to adjust their gaze direction in a VE by turning their heads. LMC, with a sampling rate of 120 Hz, was mounted on the front of the HMD for recognizing the location and posture of hands. Participants can interact with virtual objects in the virtual scene without handheld devices.
2.3. Experimental Design
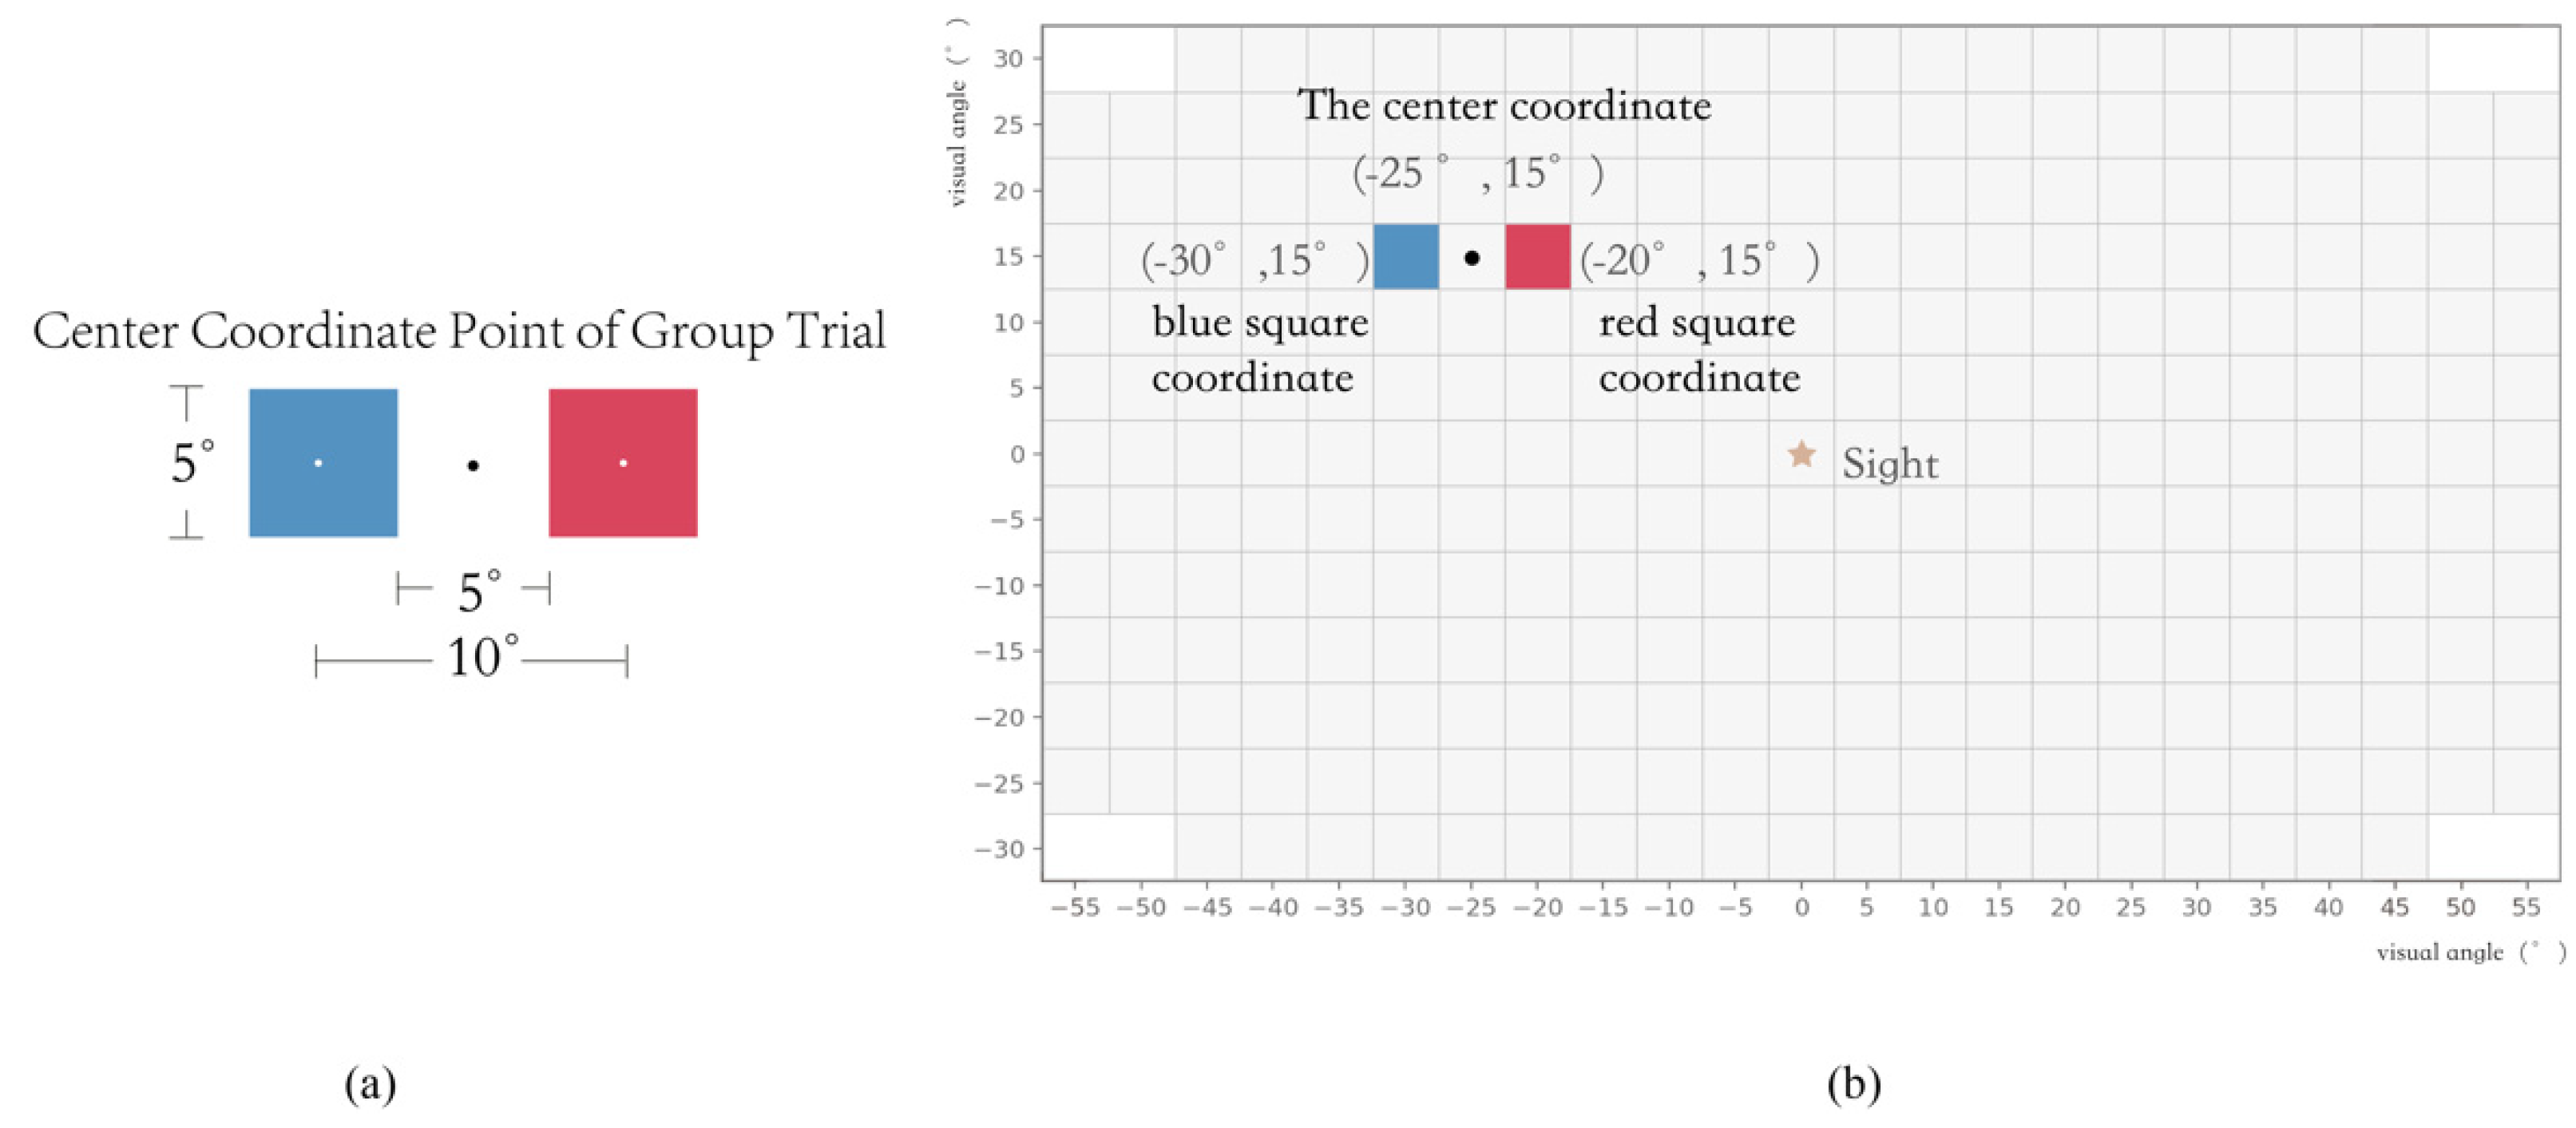
The main content of the experiment is the target click experiment in the VE. To ensure that the participants clicked targets with a comfortable posture during the experiment, they adjusted the depth position of the target before the formal experiment began. In order to guarantee that every participant saw targets of the same size, all the lengths and sizes used in the experiment were presented in a visual angle, the unit of which is the degree (°). The angle of view was the angle formed by the light drawn from the two ends (up and down, or left and right) of the object at the human eyes when observing an object.
The click target in the experiment is the blue and red squares appearing simultaneously as a trial group. The side length of the two squares is 5°, the spacing distance between the two squares is 5°, and the distance between the center points of the two squares is 10°, as shown in
Figure 1a.
The targets appear on the sphere centered on the participants’ head. The visual range of the HTC Vive HMD equipment is 11°, in the horizontal direction and 90°, in the vertical direction. Penumudi et al. (2020) studied and evaluated the influence of different target positions on musculoskeletal load and task execution in the VR interaction process and found that excessive target locations at 15° above and 30° below eye height should be avoided to reduce musculoskeletal discomfort and injury risks during VR interactions. Therefore, the vertical range of the target is between 30° above and 30° below the eye height according to that study, and the horizontal range is between 55° on the left side and 55° on the right side according to the device display limitation.
The appearance range of the target takes the visual center as the origin (0°, 0°), distributing at left of the origin from −55° to 0° and at right of the origin from 0° to 55° horizontally, and at above the origin from 0° to 30° and at below the origin from −30° to 0° vertically. The position where the target appears is controlled by the center coordinate of each trial group, and the center coordinate of each trial group appears on the coordinate position, which is multiplied by 5°.
Since the blue target and the red target are both 5° away from the center coordinates of the trial group in the horizontal direction, the center coordinates of the trial group are actually distributed in the range of −50° to 50°.
Figure 1b shows the range of an example of the emergence of a trial group. The whole group trial appears at (−25°, 15°), where the coordinates of the blue target are (−30°, 15°), and those of the red target are (−20°, 15°).
In the testing stage before the formal experiment, it was found that targets in the corners could not be seen due to the equipment limitation of the viewing field of the HMD when participants were facing straight ahead. Therefore, the target appearing at the corner positions were removed (the trial group coordinates were (±50°, ±30°) and (±45°, ±30°)).
In order to eliminate the influence of click order on click behavior, two modes of the trial group existed: 1. the blue square on the left and the red square on the right; 2. the red square on the left and the blue square on the right. Participants were asked to click on the blue square first, and then click on the red square after the blue square disappeared. If the participants click on the red square first, the red square would not disappear. After finishing the click task, the participants needed to align their heads with a sight mark and eliminate visual residue. In the experimental program, the pair of red and blue buttons only appeared after a certain time interval when the participant clicked the buttons in the correct way. Measured by the pre−test, the time interval was 1000 ms, which was longer than the time required for the participant’s homing motion.
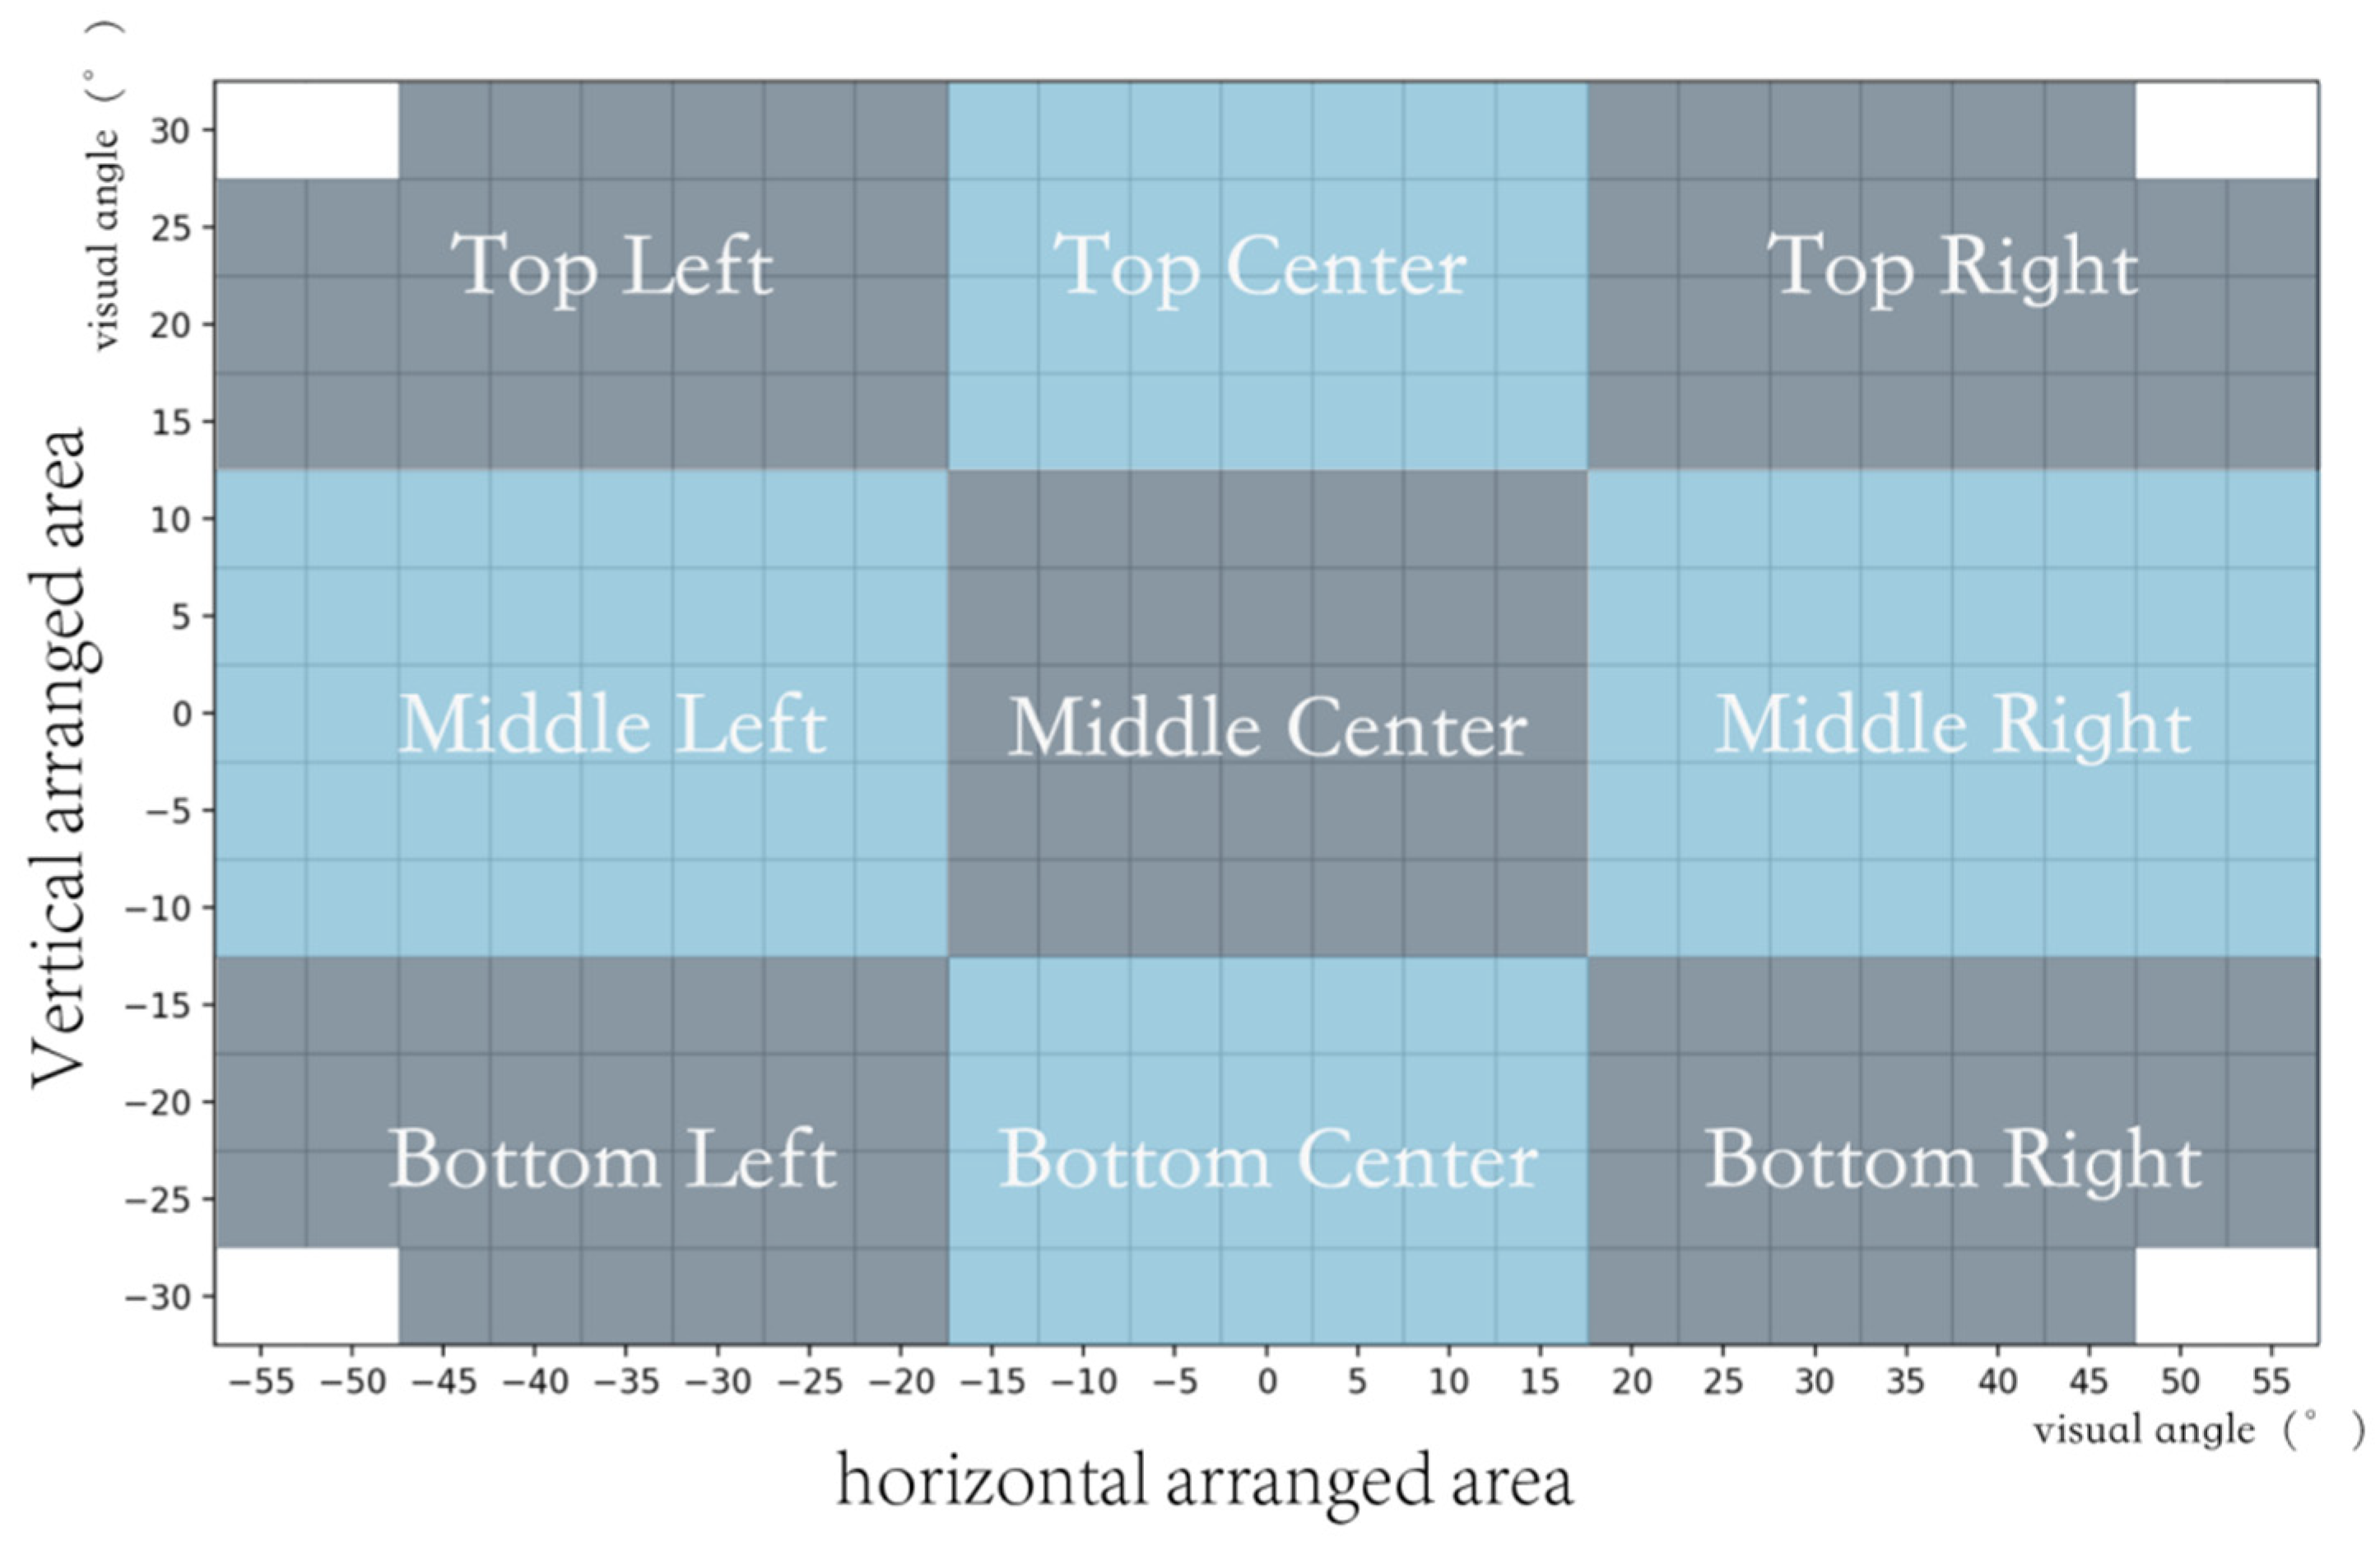
In order to analyze the impact of the target appearance area on click operation performance, the area was divided into 9 parts: Top Leaf (TL), Top Center (TC), Top Right (TR), Middle Left (ML), Middle Center (MC), Middle Right (MR), Bottom Left (BL), Bottom Center (BC), and Bottom Right (BR). The position of the target was distributed into 13 vertically arranged areas from top to bottom (vertical rows arranged from −30° to 30°) and 23 horizontally arranged areas from left to right (horizontal column arranged from −55° to 55°). Due to the limitation of the FoV of the HMD hardware, when the participant was facing straight ahead, the target at the corner positions could not be seen, so the eight areas appeared on the four corners were eliminated. The 9 areas, the vertical arranged areas, and the horizontal arranged areas are shown in
Figure 2.
2.4. Experimental Procedure
A fixed click depth in the VE cannot guarantee participants with different arm lengths to complete a click task with a comfortable posture. In order to make sure participants had the most natural interactive experience in the experiment, the participants needed to adjust a debugging board to the depth that they thought was most suitable for click operations before the experiment began, and then carried out training experiments. In the formal experiment, the depth of the target was consistent with the depth of the adjusted board.
The experimental task involved clicking targets in the VE, and the participants were asked to click the center position of the targets as quickly as they could after the target appeared. The formal experiment included 530 (265 trails emergence positions × 2 modes) trials. To reduce the participants’ residual fatigue, there were four breaks during the course of the experiment.
After the completion of the experimental task, 9 target appearance areas were presented to the participants, and they were asked to report subjective preference scores about their willingness to operate the HMD equipment after taking it off. The maximum score of subjective preference was 10 points. A higher score described a higher degree of subjective preference in this area.
3. Results
3.1. Movement Time
Movement time refers to the time from the appearance of the targets to the disappearance of the blue target after being clicked, which includes the time of the discovery of targets and the completion of a click action.
A one-way analysis of variance found that the movement time was significantly affected by the target distribution area (F(8282) = 22.349,
p < 0.001), the vertically arranged areas (F(12,278) = 6.987,
p < 0.001), and the horizontally arranged areas (F(22,268) = 11.714,
p < 0.01), summary of ANOVA results for movement time was listed in
Table 1.
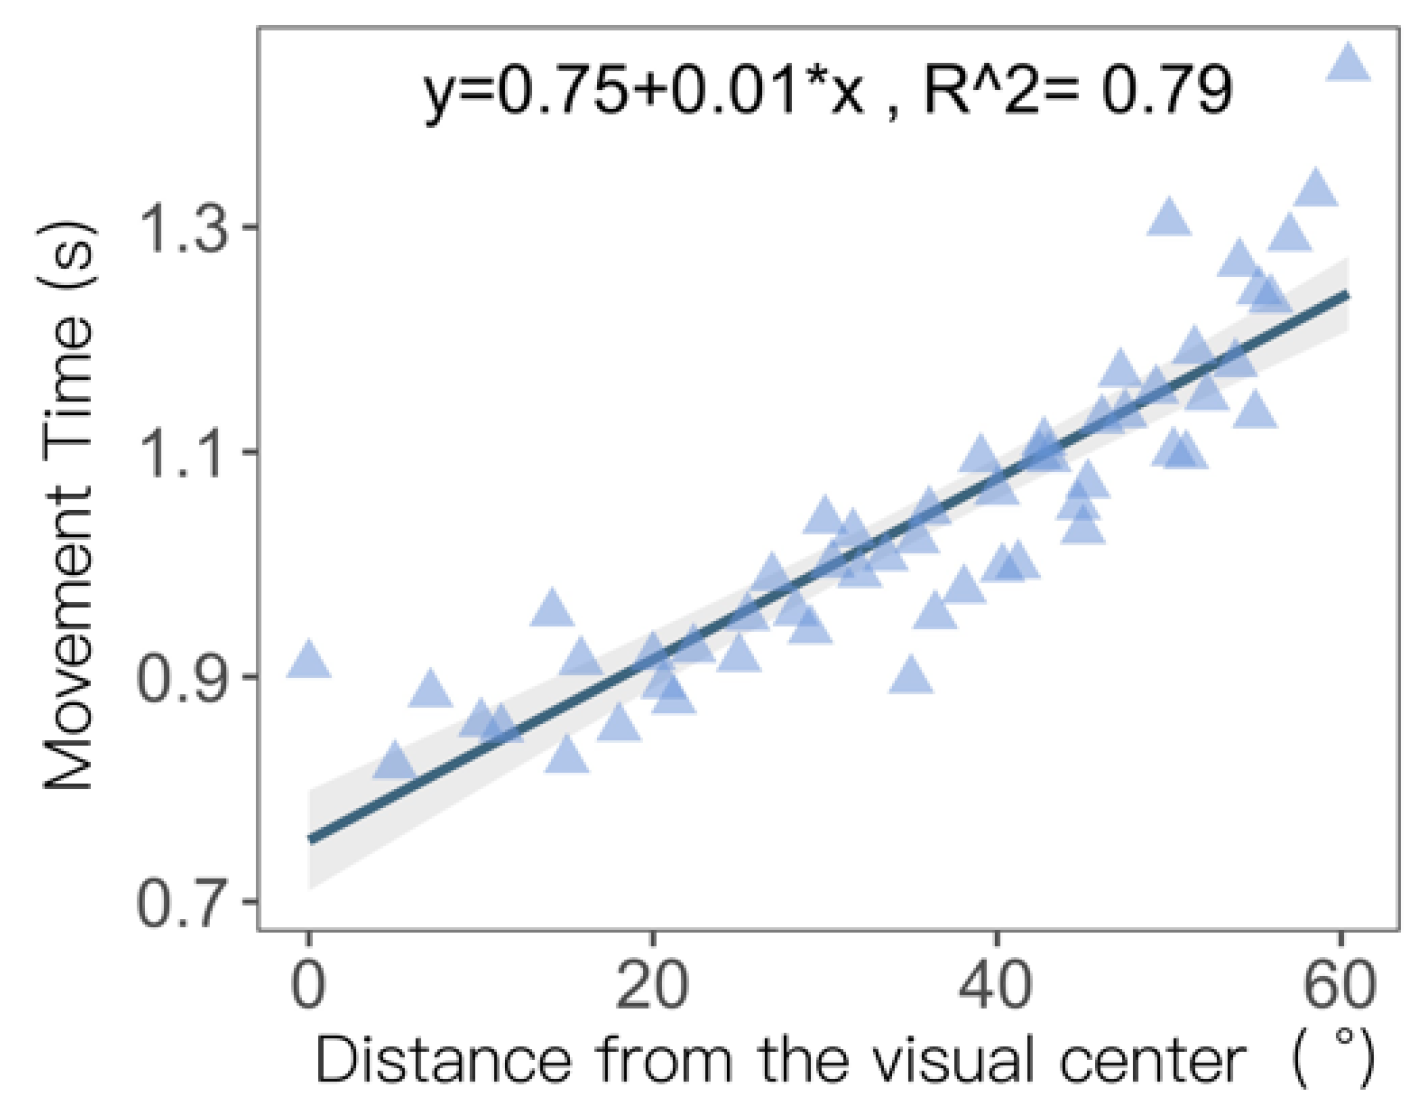
0° in the horizontal direction and 0° in the vertical direction was defined as the visual center. Correlation analysis was performed on the movement time and the distance between the target position and the visual center. The result was r = 0.889,
p = 0.000, reaching significant relevance at the 0.01 level, seen in
Figure 3. There was a significant positive correlation between movement time and the distance between the target and the visual center.
Noise filtering was performed on the value, and the cubic convolution method was applied to perform numerical interpolation to make a contour map of the movement time (
Figure 4). The cubic convolution interpolation kernel consists of a piecewise cubic polynomial defined on a unit subinterval between −2 and +2. The kernel is required to be symmetric and continuous and have a continuous first derivative to make the inner interpolation more accurate [
29]. According to the quartile value of exercise time, the contour and range are divided in
Figure 4. A lighter color in the area indicates a shorter movement time.
The figure shows that it takes a longer time to click targets when the target appears in the bottom right corner and the top left corner. Movement time includes the duration of visual search and target clicking. All subjects were right-hand dominant, so the targets could be blocked by the right arm to some extent when the target appeared in the bottom right corner. Although the target in the bottom right corner was located in the nearest area to the hand, the occlusion effect of the hand lengthened the visual search time for the targets. The target in the top left corner was located in the farthest area from the starting position of the arm movement, so the clicking time was longer. The overall distribution of the contour lines of movement time tended to be in the right area, indicating that the click time of the right half was shorter than that of the left half, which is related to the starting position of the right hand.
The contour line of movement time shows a rightward trend overall. The coordinates of the motion starting center point were taken as 5° in the horizontal direction and 0° in the vertical direction based on the boundary value of the first quartile contour line. The correlation analysis was performed on the movement time and the distance between target position and the motion starting center. The result was r = 0.922,
p = 0.000, which reached the correlation level at 0.01, seen in
Figure 5. There was a significantly positive correlation between movement time and the distance between the target and the motion starting center.
3.2. Continuous Click Time
The continuous click time refers to the time interval between clicking the blue target and clicking the red target, simulating the continuous click action in the actual interactive operation.
A one-way analysis of variance found that the continuous click time was significantly affected by the target distribution areas (F(8521) = 12,350, p < 0.001).
In order to explore the difference between left-to-right clicks (mode1) and right-to-left clicks (mode2) during continuous click operation, tindependent sample t-test was applied to analyze the continuous click time, the result was t = −1.785, p = 0.75 > 0.05, indicating that the continuous click direction had no significant effect on the continuous click time.
The continuous click time of the nine areas is shown in
Table 2. It can be seen that the continuous click time of the bottom area (0.407) is significantly higher than that of other vertical parts.
3.3. Click Accuracy
The participants were required to click on the center points of targets appearing in different positions in the experimental task, but the actual click endpoints deviated from the center points. The click accuracy of the second target might have been impacted because of the prospective effects of continuous click movement, so the definition of deviation value is the standard deviation of the distance between the click endpoints and the center of all endpoint at each position. This index is the scalar variance of the deviation of all participants at each click position, which reflects the system click accuracy at that position. The deviation value reflects the accuracy of the click on each position: the higher the deviation value, the lower the accuracy of the click.
The click deviation value was affected significantly by the target vertical arrangement areas (F(12,278) = 26.313, p < 0.001), but the horizontal arrangement areas (F(22,268) = 0.383, p = 0.995 > 0.05) had no significant impact on click accuracy.
The locations where targets appear are indicated in the grid diagram of the range in 110° × 90°, and each grid represents 5° × 5° space in the FoV. The offset at each location is indicated by color in the corresponding grid, with blue indicating a negative offset and red indicating a positive offset. A heat map was produced (
Figure 6) to analyze the click deviation value of the target appearing in different positions. The blue part represents a small click deviation value that is lower than the average value. The red part represents a larger click deviation value that is higher than the average value. The darker the red of the grid, the larger the deviation value at this position. The click deviation value of the target at the bottom position is obviously higher, while the click deviation value in the bottom right corner is obviously higher than that in the lower left corner. The click deviation value of the target at the top position is lower than that at the bottom position, and the click deviation value of the top left corner position is higher.
A contour map of click deviation value was produced as
Figure 7, and the area was divided according to click accuracy. The area with the deepest red appears in the bottom right area, indicating that this part of the area has the worst click accuracy.
3.4. Center Click Offset
The accuracy reflects the deviation degree of the click endpoint from the target center point, but it does not show the difference in the offset direction of the click position. The center click offset was applied to explore the click bias that is generated by clicking on targets at different positions. All the clicked endpoints were collected in scattered points on the target position, and it was found that the endpoints for each position roughly followed a bivariate Gaussian distribution [
30].
The center click offset is defined as the distance between the center of the endpoints and the center of the target in the horizontal and vertical directions.
3.4.1. Center Click Offset in the Horizontal Direction
Since the click-twice task caused the participant’s click position to move in the horizontal direction, the distance between the two target centers was 10°. Theoretically, the endpoints should fall on the center of the target, and the x-coordinates of the two clicked endpoints should be different by 10°. However, in the actual experiment, there was a deviation between the location of the endpoints and the center of the target. Therefore, the difference of the two endpoints in the horizontal direction was defined as the difference between the endpoint of the second click
Xred (red target) and the end point of the first click
Xblue (blue target). The horizontal offset was defined as the difference of the two endpoints in the horizontal direction and the distance between the two target centers, which was 10°. The horizontal offset in each position is calculated as follows:
By comparing the center of the endpoints with the center of the target in the horizontal direction, the click center offset in that direction, which reflects the click bias at every position, was obtained.
The horizontal offset was affected significantly by the horizontal arranged area (F (20,244) = 13.325,
p < 0.001). The offset at each location is indicated by color in the corresponding grid, with blue indicating a negative offset and red indicating a positive offset. The darker the color of the grid, the larger the target click offset at this position. A heat map shows the horizontal offset in
Figure 8.
A positive offset means that the endpoint of the second click fell on the right side of the first click, while a negative offset means that the endpoint of the second click fell on the left side of the first click.
The heat map shows that the offset within the range of −50° to 35° is generally positive, indicating that the click trend was generally rightward. The lowest row of the heat map represents the average offset of each column in the horizontal direction. The smallest average offset in the positive offset area appears in the 15° horizontal arranged area. The range of −50° to −35° shows large rightward deviations (0.68°, 0.72°, 0.74°, 0.71°). However, the range of 40° to 50° produces leftward deviations (−0.059°, −0.28°, −0.4°), which are opposite to the general offset trend.
3.4.2. Center Click Offset in the Vertical Direction
The vertical offset was obtained by the arithmetic average of the first click endpoint Yblue (blue target) and the second click endpoint Yred (red target), calculated as follows:
By comparing the center of the endpoints with the center of the target in the vertical direction, the click center offset in that direction, which reflects the click bias at every position, was obtained.
The vertical offset was affected significantly by the vertical arranged area (F(12,278) = 68.415,
p < 0.001). The offset at each location is indicated by color in the corresponding grid, with blue indicating a negative offset and red indicating a positive offset. The darker the color of the grid, the larger the target click offset at this position. A heat map shows the vertical offset is shown in
Figure 9.
A positive offset indicates that the user hit the upper side of the target center, while a negative offset indicates that the user hit the lower side of the target center. Red means a positive offset, and blue means a negative offset.
In the range above −20°, the offset in the vertical direction is generally negative, indicating that the click endpoints were lower than the target center. The left heat map represents the average offset of each row in the vertical direction. The average value of the smallest offset in the negative offset area appears at the −15° vertical arranged area. In the top area, the downward offset (−0.6°, −0.76°, −0.82°) in the area above 20° is obviously stronger than that in the middle area, which may be because the target in this area was too high to reach. The opposite offset trend occurs in the range below −20° (0.01°, 0.11°, 0.3°), which shows a positive offset.
3.5. Subjective Preference
After the experiment, the subjects were asked to score their willingness to perform clicking operations in the nine areas from 0 to 10 points. The participants’ scores for the nine areas were significantly different (F(8171) = 15,781,
p < 0.01). In order to reduce the difference in score distribution among individuals, the scores of the subjects were calculated in normalization.
Table 3 shows the normalizational average scores of subjective preference in the nine areas. The higher the score, the higher the satisfaction of the participants clicking in this area.
The highest level of satisfaction in the horizontal direction is the middle area (0.543), and the satisfaction level of the right area (0.429) is higher than that of the left area (0.357). In the vertical direction, the highest level of satisfaction occurs in the middle area (0.688), while the top area (0.395) shows a higher satisfaction than the lower area (0.245).
The satisfaction score in the bottom right area (0.164) is the lowest. Although the targets appearing in the bottom right area were located in the right area where the satisfaction is higher, the operability of targets in this area did not satisfy the participants. The low satisfaction observed in the bottom right area is consistent with the result that the targets in the bottom right area have a larger offset in both the horizontal and vertical directions in the analysis offset.
Correlation analysis was performed between subjective preference and the movement time of the nine areas, and it was found that r = −0.688, p = 0.000; correlation analysis was also performed between subjective preference and the click deviation value, and the result was r = −0.708, p = 0.000. These correlations both reach the significance level at 0.01, which shows that subjective preference can significantly affect movement time and the accuracy of clicking.
Subjective preference is negatively correlated with movement time, indicating that the higher the subjective preference, the shorter the movement time. Subjective preference and the click bias are negatively correlated. The higher the subjective preference, the smaller the click bias. The negative correlation of subjective preference with both movement time and click deviation value indicates that a higher subjective preference is consistent with a faster clicking movement and more accurate clicking, which represents a better interactive usability.
4. Discussion
The performance data of the click interaction in the VE reflects the difference in the click interaction in each area of the field of view. In this article, the performance data of the click interaction consisted of click accuracy and movement time. Moreover, the clicking offset from the target center reflects the directional tendency of the click deviation of each interactive area.
Click accuracy is reflected by the variance of the offset. The heat map of the offset shows that the click endpoints generated a rightward and downward deviation in general. A similar situation also appeared in the click experiment of the pad device [
31], which might indicate the clicking behavior of right-handed users. However, in this experiment, the phenomenon contrary to the clicking behavior occurred at the rightmost and bottommost edges of the operating range, which reveals a leftward and upward offset.
The horizontal angle of the target position determines the horizontal abduction or adduction degree of the arm when the user acquired the target. The abduction angle of the human arm is limited to about 40° [
32]. When the target was located outside the range, the participants needed to rotate their bodies and arms to get it. The adjustment of body posture may affect the accuracy of motion control. The target click endpoints coordinates in the range of −25° to −50° on the left side in the horizontal direction showed a large deviation to the right; in the area of 35°–50° on the right side in the horizontal direction, the click center offset of the target showed a leftward tendency. This shows that the participants had to click on the targets in these areas by spreading their arms outside of the body [
33]. As a result, the click endpoints in the boundary areas consequently fell on the side close to the human torso.
In the vertical direction, the click center endpoints in the area below −25° deviated upwards, which indicates that the targets were beyond the easy-to-operate area of hand clicking in this direction, resulting in more difficult clicking interactions. A higher position required users to lift their arms with larger amplitude, resulting in fatigue and jitter, which reduce their motion control accuracy. This conclusion is in good agreement with the results obtained by Penumudi (2020) [
34]. From the perspective of the offset in the vertical area, the smallest offset occurred in the area with a vertical height of −5°. The experiment conducted by Kölsch et al. (2003) [
33] also suggested that the interactive content should be placed in the area slightly below the horizontal line of sight.
The general trend of movement time contours show that the movement time in the bottom right corner was longer than expected based on moving distance, while the movement time in the right half side was shorter than that in the left half side. This is similar to that observed in a click experiment with mobile phone screens by Taeil Kim et al. (2014) [
35]. When the participants clicked on the mobile phone screen, the movement time of clicking on the target in the bottom right corner was longer than that in other areas, although the bottom right corner was closest to the thumb hovering position for clicking. Since the participants were all right-hand dominant, although the right hand was hovering near the bottom right area, the clicking operation may have been interrupted due to occlusion.
In an experiment on people’s visual field and attention bias [
36], participants were required to press a button immediately when finding the target to measure the time of searching for targets in the visual field. Woncheol Jang (2016) reported that the searching time of targets on the left side of the visual field was faster than that on the right side. In our study, the movement time started from the appearance of the targets to the completion of target of clicking. Therefore, movement time included not only the visual search time but also the time of the hand movement. Hand movement time is much longer than visual search time [
37]. The distance of hand movement was shorter when clicking on the right side because those targets were closer to the starting position of the right hand. As a result, the measured movement time of the targets in the right area was shorter than that of the left area.
Click performance was analyzed by movement time, continuous click time, and accuracy, which were found to be significantly affected by target appearance areas. Moreover, the areas with higher scores of subjective preferences acquired a better interactive performance, in terms of movement time and click accuracy This consistency shows the necessity of dividing efficient and interactive areas in a VE.
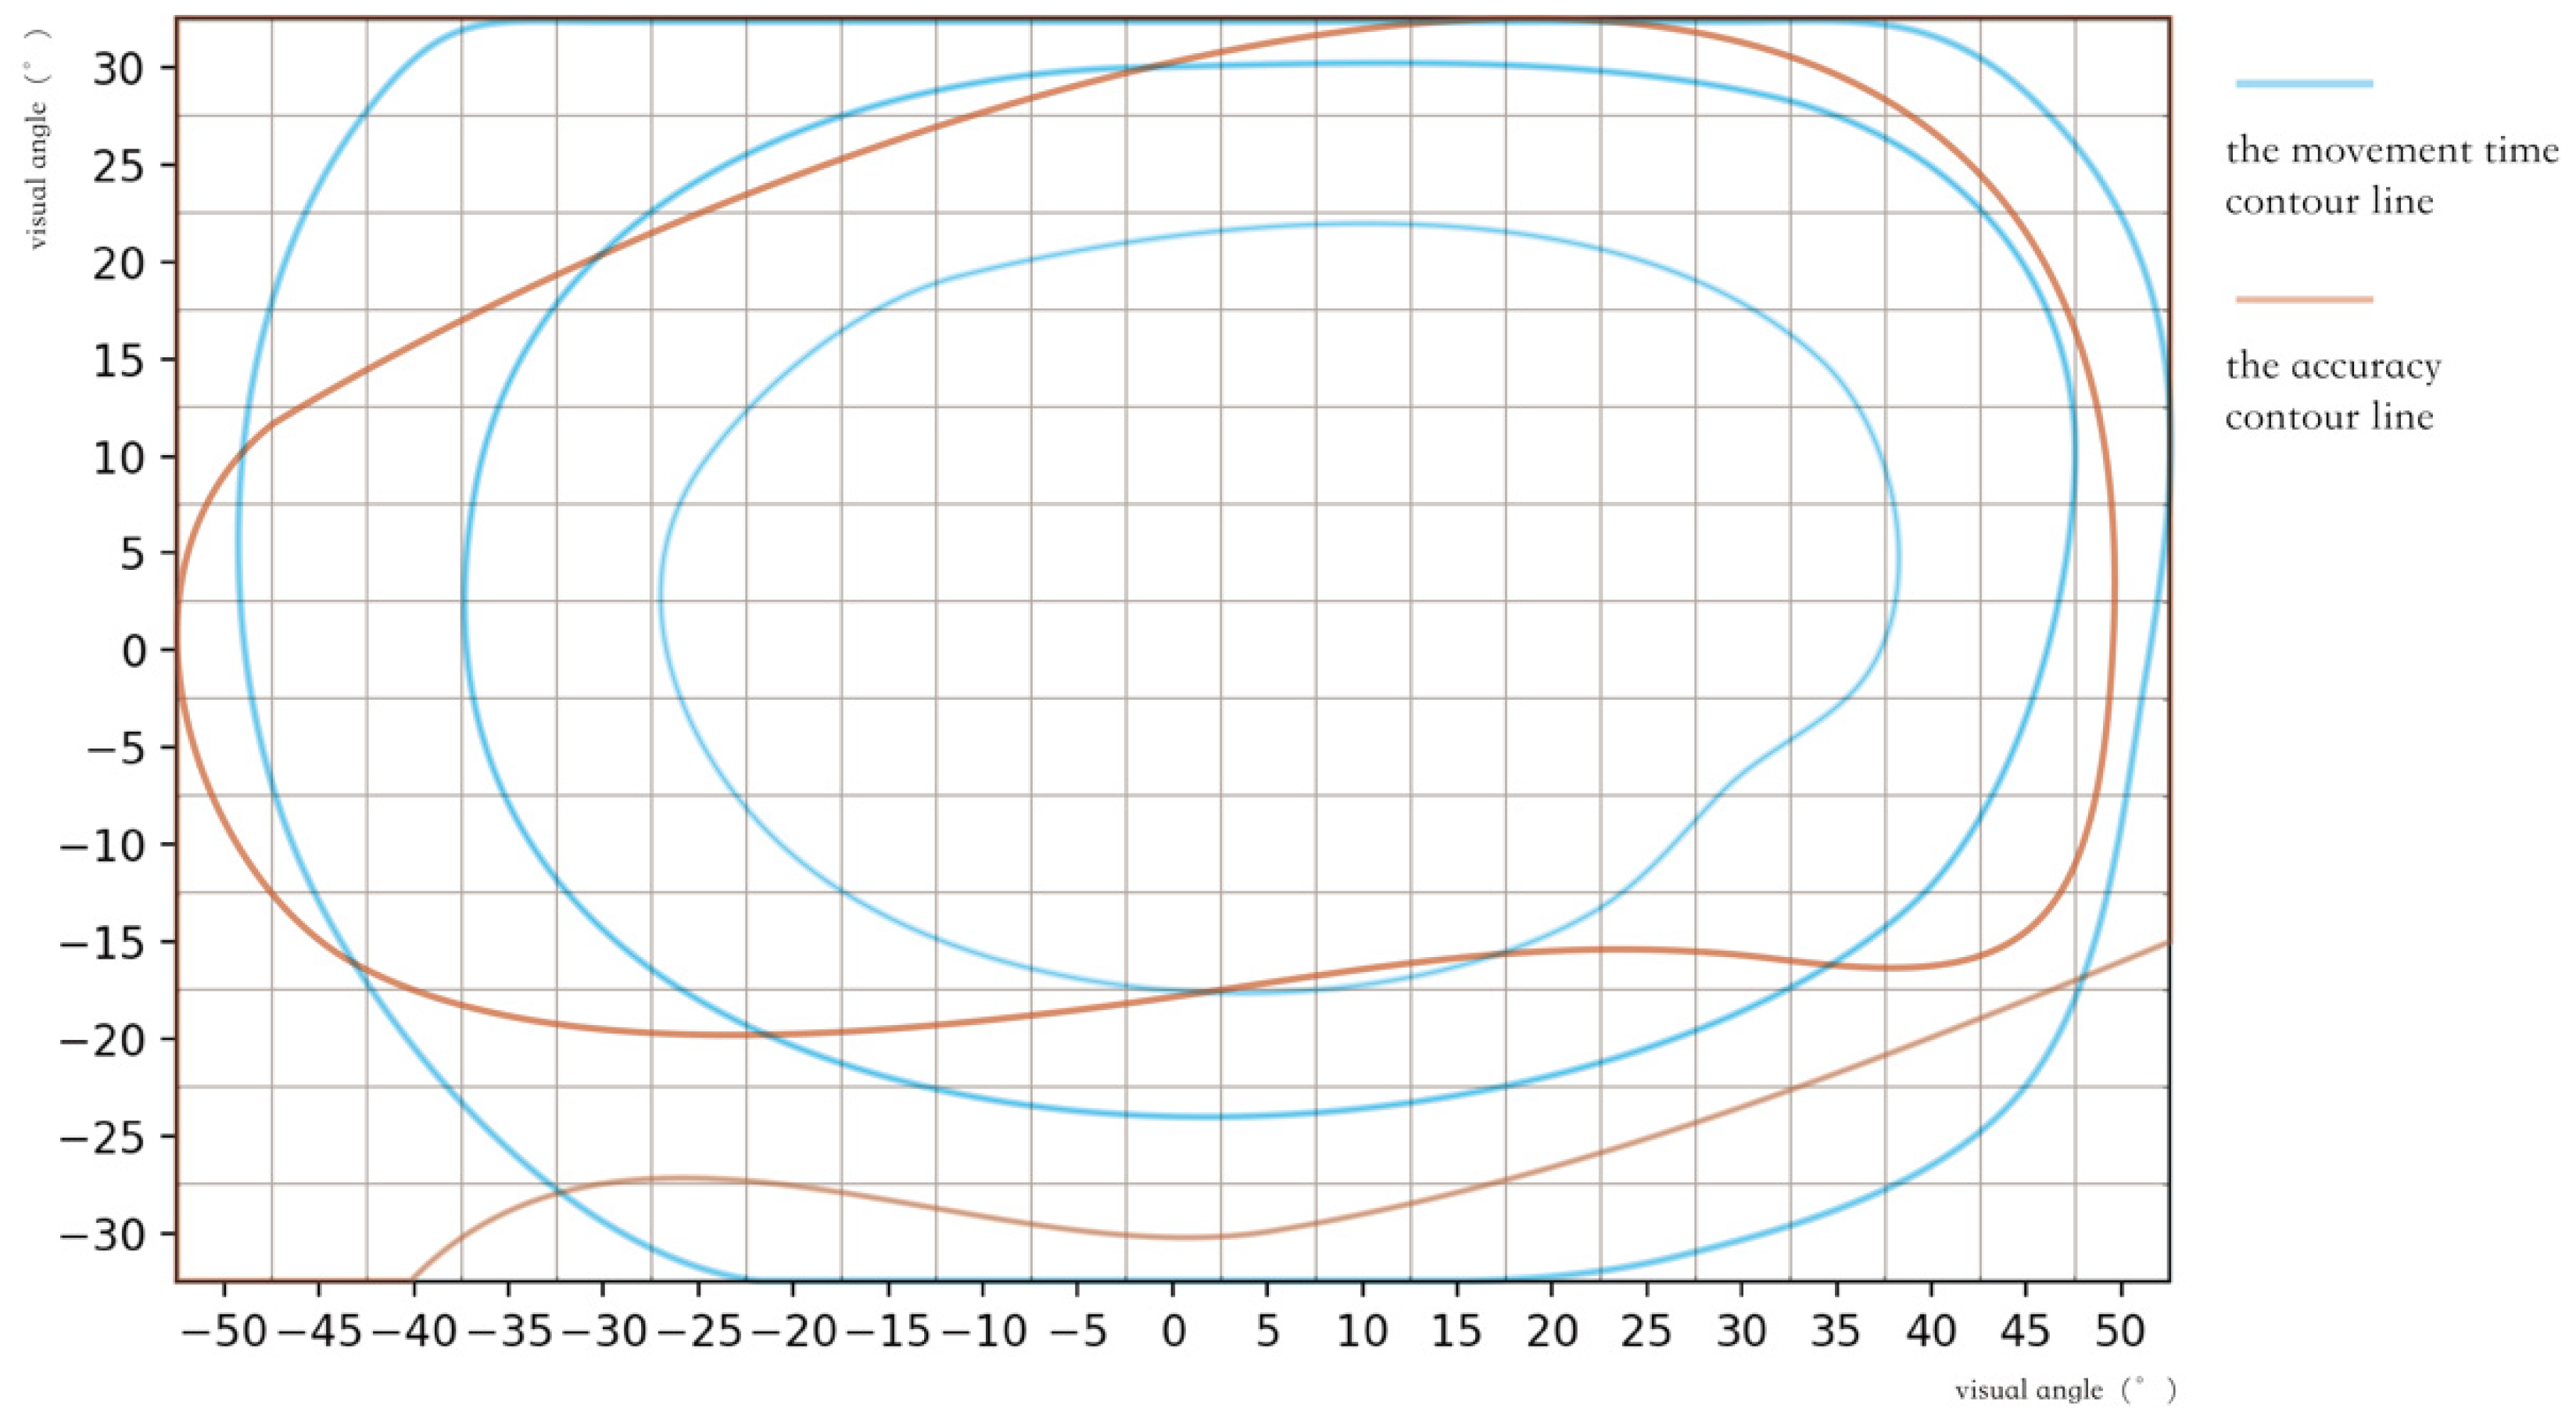
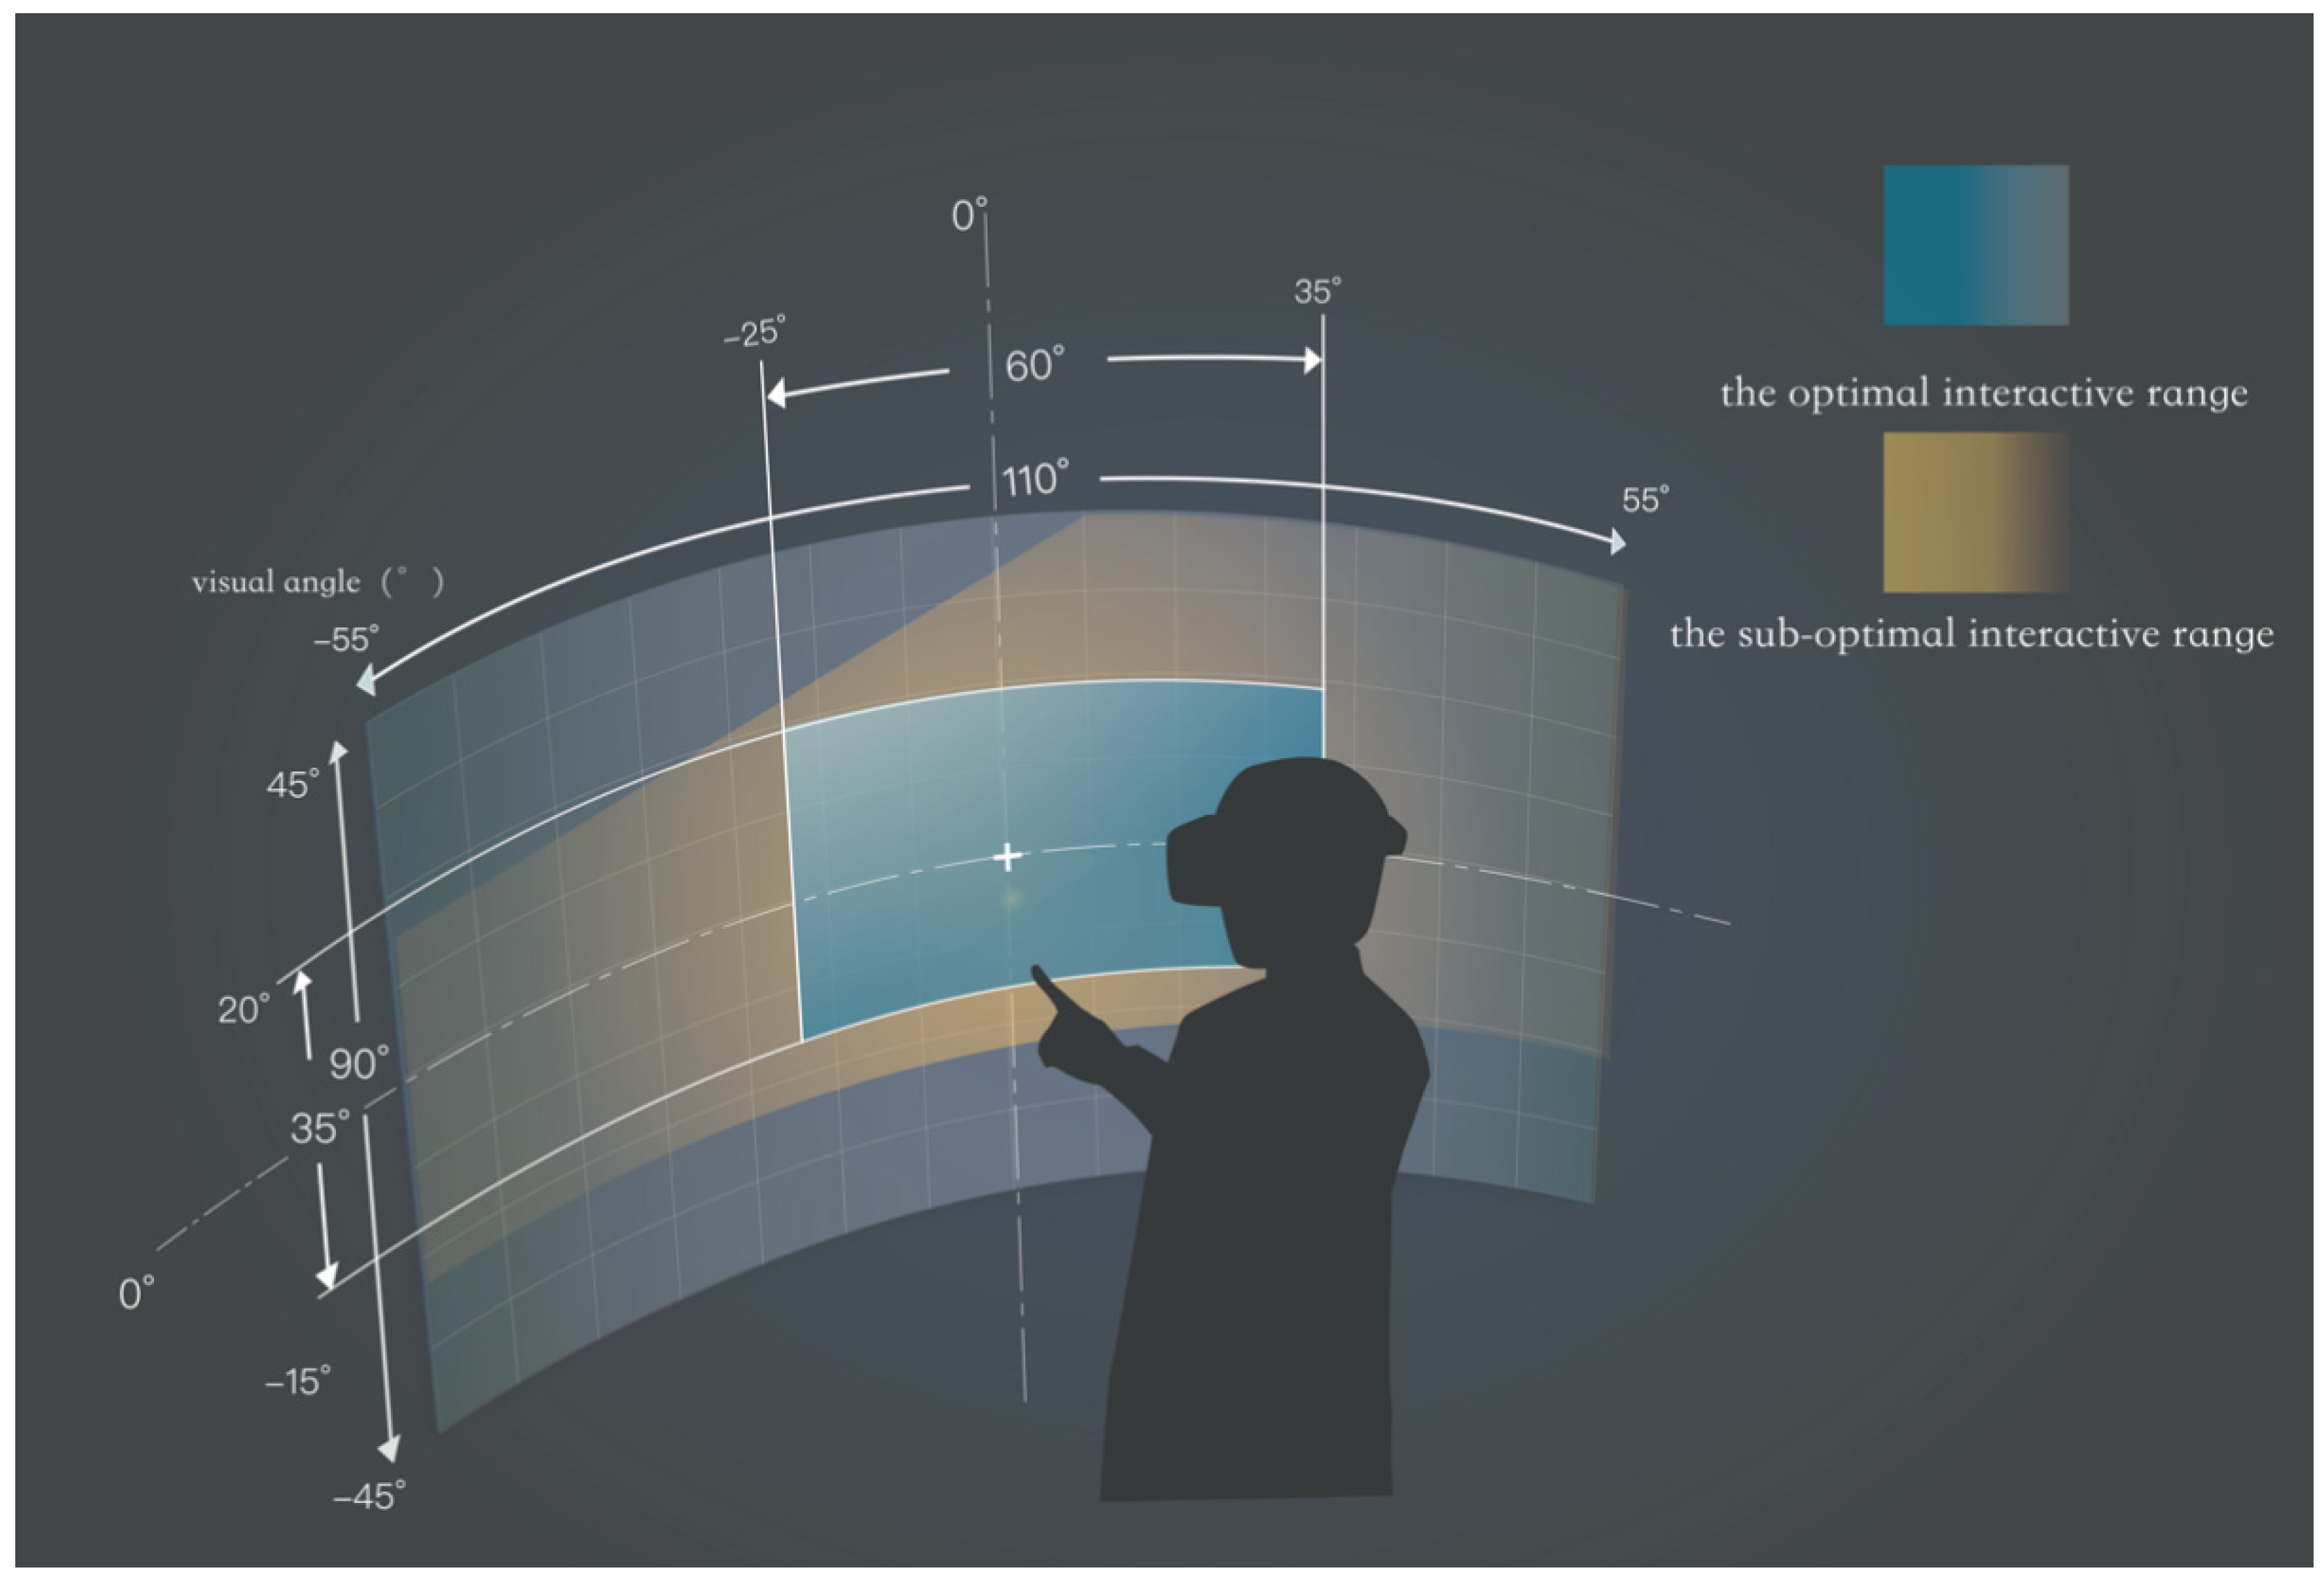
Combining the movement time and click accuracy contour maps, their overlapping area is the best operation area, defined by a high accuracy and a short reaction time. In this experiment, the optimal interactive range of direct clicks with bare hands in virtual space is from −25° on the left side to 35° on the right side horizontally and from −15° in the downward view to 20° in the upward view vertically, as shown in
Figure 10. The sub-optimal interaction area is the range above 20° in the vertical direction, except the top left corner. The remaining areas in the FoV supported by the HMD are areas of low click performance.
Interaction areas divided for bare-hand interactions in the VE are shown in
Figure 11, which includes the optimal interactive range, the sub-optimal interactive range, and the low interactive performance range.
According to the results, some design suggestions for the interactive click interface could be proposed as follows to help arrange the layout of interactive components in virtual reality.
Firstly, components that need to be clicked frequently and quickly (such as the confirm button and selection button) should be located in the center or slightly rightward area in the FoV. As shown in
Figure 4, this is because the movement time contour is partial to the right side and the targets in the right area enable users to produce efficient click behavior. Moreover, since the lower right corner area may be obscured by the arm, the smaller moving distance doesnot make a shorter total interaction time. Therefore, the lower right corner area was not suitable for components requiring quick clicking.
Moreover, components that require precise control (such as a keyboard) should be located slightly below the horizontal line of sight. It can be seen from the offset heat map (
Figure 8 and
Figure 9) that the offset in the horizontal and vertical directions is small in the area below the center of the field of view, where operation can reduce the occurrence of wrong clicks. Furthermore, the subjective preference scores of these areas were higher than others, which means a lower psychological load.
In addition, notification information (such as warning notification) that needs to attract the attention of users quickly should be placed in the left area, where users can respond quickly to the targets. On the other hand, the information interface component (such as indicators and progress bars) could be located in the marginal area to avoid squeezing the space of interactive components.
In VEs, visual target clicking occurs through visual and upper limb movements. As early as 1947, Fitts’ blind touch tests showed that click accuracy in the side area was lower than in the center in the horizontal direction, and that of the right side was higher than that on the left; in the vertical direction, the area below has the highest accuracy, and the middle area has a higher accuracy than that of the upper area [
38]. The results of this paper show that, with the addition of visual positioning, vision can largely improve the accuracy of motion behaviors, and the spatial distribution of accuracy showed a gradually decreasing trend from the visual center. In this paper, the best performance area is approximately 5
o downwards from the Frankfurt plane with the standard sitting posture in the vertical direction, and this is different from the blind positioning experiment, where the accuracy improves downward in the range of −45°–45° in the vertical direction. This difference is due to the addition of visual positioning in our experiments. The initial visual position was at the visual center of the eye level, and visual positioning was employed to correct the accuracy of the spatial position movement. Therefore, more visual attention was required during clicking motions in the middle and upper areas. However, this is difficult to claim based only on the results of behavioral performance. The subtle differences can be explored by neuroimaging technology in subsequent research. In a VR condition, the actual appearance is displayed on left and right monocular screens, and spatial perception is formed by the parallax with the two screens according to the HMD display principle. It is difficult to generate a similar spatial perception without environmental spatial clues to the physical real world. A study on fMRI has explored the neural differences between VR and physical reality when processing visual targets at different depths [
39]. In the VR condition, a large number of dorsal neural structures, such as upper and lower parietal lobes and central posterior gyrus, were activated when people interacted with visual objects rendered in further space, and more ventral side neural structures were activated when interacting in the closer space. In a physical reality condition, interacting with the closer objects will activate more in the dorsal pathways, while further objects activate more in the ventral pathways. A possible explanation is that the lack of depth cues in VR leads to different visual perceptions from the physical reality, and people tend to process spatial images without obstructive environmental depth cues when processing a plane image. This indicates that the motor system and the visual system are separated to a certain extent, and the brain processes visual images based in VR. At present, there is still no evidence of differences in neural processing in the conditions set out in this paper when interacting in different visual fields in close space in VR. Since optimization methods such as fMRI have significantly improved the resolution and reliability of neural imaging technology [
40], it has become feasible to explore the neural mechanism of hand–eye coordination in the central and peripheral areas in VR. More neuroscience evidence may provide more precise guidance for the layout of interfaces in a VE.


