Abstract
To prevent falls, it is important to measure periodically the balance ability of an individual using reliable clinical tests. As Red Green Blue Depth (RGBD) devices have been increasingly used for balance rehabilitation at home, they may also be used to assess objectively the balance ability and determine the effectiveness of a therapy. For this, we developed a system based on the Microsoft Kinect v2 for measuring the Functional Reach Test (FRT); one of the most used balance clinical tools to predict falls. Two experiments were conducted to compare the FRT measures computed by our system using the Microsoft Kinect v2 with those obtained by the standard method, i.e., manually. In terms of validity, we found a very strong correlation between the two methods (r = 0.97 and r = 0.99 (p < 0.05), for experiments 1 and 2, respectively). However, we needed to correct the measurements using a linear model to fit the data obtained by the Kinect system. Consequently, a linear regression model has been applied and examining the regression assumptions showed that the model works well for the data. Applying the paired t-test to the data after correction indicated that there is no statistically significant difference between the measurements obtained by both methods. As for the reliability of the test, we obtained good to excellent within repeatability of the FRT measurements tracked by Kinect (ICC = 0.86 and ICC = 0.99, for experiments 1 and 2, respectively). These results suggested that the Microsoft Kinect v2 device is reliable and adequate to calculate the standard FRT.
1. Introduction
Balance deterioration may increase the falling rate, given that balance and postural control deficit has been identified as one of the main factors of falls [1,2,3,4]. Being able to measure this decline helps identifying the individuals with higher risk of falls and taking subsequently the necessary preventive measures such as specific rehabilitation programs to minimize this risk. Moreover, assessing balance permits measuring the effects of the exercises proposed in a certain therapy. Various clinical tests have been developed to help assessing balance, gait, and postural control of subjects and predict therefore fall risks [5,6,7]. These tests include Tinetti Balance test [8,9,10], Berg Balance Scale [11,12,13,14], Timed Up and Go test [15,16,17,18], and Functional Reach test [19,20,21]. The latter was one of three tools having strong predictive validity to assess fall risk in a community setting beside the 5 min walk test and the five-step test [5]. The Functional Reach Test is also easy to administer and takes only few minutes to conduct. In fact, time is reported as one of the barriers considered by physicians for routinely assessing fall risks [22]. Thus, easy and simple tests must be provided for screening periodically balance and gait disorders. In addition, it is demonstrated that rehabilitation has more efficiency when done in a familiar environment like at the home of the patient [23]. This is now possible thanks to RGBD devices like Microsoft Kinect which can be used also for providing an easier and simpler way to conduct the test. RGBD devices are used in serious games to improve balance and postural control [24,25] and they could be used for balance assessment as well [26].
Several studies have examined the feasibility and validity of technology for measuring and parametrizing balance tests [27,28,29,30]. Regarding the FRT, some researchers opted for the use of inertial sensors. For instance, authors of [31] used InertiaCube3TM sensor to record kinematic variables of five stroke patients in order to analyze the reliability, sensitivity, and specificity of FRT. To do that, they placed two inertial sensors on the patient’s back while performing the FRT. Based on their findings, they concluded that inertial sensors are a reliable, specific tool to parametrize the FRT for stroke survivors. Likewise, Hasmann et al. [32] used wearable accelerometer data to differentiate participants with high risk for Parkinson’s disease (HRPD) from others since instrumenting FRT may improve diagnostic accuracy. In a cross sectional study, they extracted functional reach parameters that differed significantly between Parkison’s disease patients and controls, then included it into a model for differentiating HRPD and controls. The model results indicated that an instrumented FRT can contribute to defining HRPD individuals with fair accuracy, sensitivity, and specificity. Conversely, Moreno et al. [33] aimed to investigate to what degree inertial sensors can be replaced by depth cameras in the parametrization and kinematic analysis of Multi-Directional Reach Test (MDRT) beside the Timed Up and Go test. Consequently, inertial sensor data were used as a benchmark for evaluating the data acquired using PrimeSense depth camera. The measures obtained from twenty healthy young adults performing the tests revealed that the depth camera is a reliable instrument to parameterize both the MDRT and TUG test, though some issues were reported when employing depth cameras for the TUG test. In addition, with the increase of Microsoft Kinect popularity, Kinect Xbox 360 (Kinect v1) was used in the development of a standalone software to measure the FRT [34]. Concurrent validity of Kinect measures were assessed in comparison of measures obtained from a 3D motion-capture system. Implementation feasibility was also examined in a clinical setting where patients’ feedback was collected. Findings showed moderate to good agreement between FRT measures made by the two systems and the patients valued favorably the Kinect system, which resulted its validity for measuring the FRT and the possibility of using it with gaming platforms. Similarly, Clark et al. [35,36] assessed the concurrent validity and reliability of reach test among other tests for evaluating standing balance and postural control. Firstly they used Kinect v1 and compared the data with a marker-based three dimensional motion analysis (3DMA) system [35]. Then with the release of Kinect for Xbox One (Kinect v2), they updated the data with the Microsoft Kinect v2 measurements in comparison with data obtained by a multiple-camera 3D motion analysis as a benchmark [36]. In both studies, results from the Kinect and the benchmark system were comparable and findings suggested that Microsoft Kinect has the potential to be used as a balance assessment tool in the clinical setting.
In these previous studies, the use of RGBD devices was validated to instrument the FRT and use it as an assessment tool. However, there is a lack of clear intention to translate the validation of the test into homes, whether by the physiotherapist assistance, or autonomously by the patient, which is becoming more needed nowadays. With the arrival of the late pandemic, it became even more important the validation of the use of RGBD devices at homes for balance and postural control assessment of individuals suffering balance problems. Thus, in this study, we present an experimental system (ES) based on Kinect v2 for measuring the Functional Reach Test (FRT) of the user. Kinect v2 provides a natural user interface which enables the users to control and interact with the applications through their body gestures and movements. Therefore, the same interaction system used for rehabilitation can be also used for assessment, hence saving the individual the hurdle of learning new interaction mechanism. We aim the validation of its use with the support of a physiotherapist, and autonomously by the user on their own. This validation acts as an initial phase of further experiments. The two experiments that we conducted, though held in lab settings, are meant as a step forward to deploy the system at home.
2. Materials and Methods
In this section, we used a Microsoft Kinect v2 to measure the limits of stability of an individual through one of the most popular balance tests, namely the Functional Reach Test (FRT). For validation, we conducted two experiments.
2.1. Description of the Standard FRT
During the FRT, the subject is asked to stand next to a wall assuming a normal and relaxed stance. With the arm horizontally extended forward, the assessor records the placement of the end of the third metacarpal on a yardstick placed on the wall (starting position B in Figure 1). The individual is then asked to reach forward as far as they comfortably can without taking a step or losing balance. Again, the location of the third metacarpal is recorded (the final position C in Figure 1). The difference between the final and starting positions is the reach distance. The patient performs three trials, and the assessor notes the average of the last two [19]. In case the subject touches the wall or takes a step during the test, the trial is repeated. A final score of FRT that is less than 25 cm suggests a limitation in activities of daily living and risk of falls [37,38].
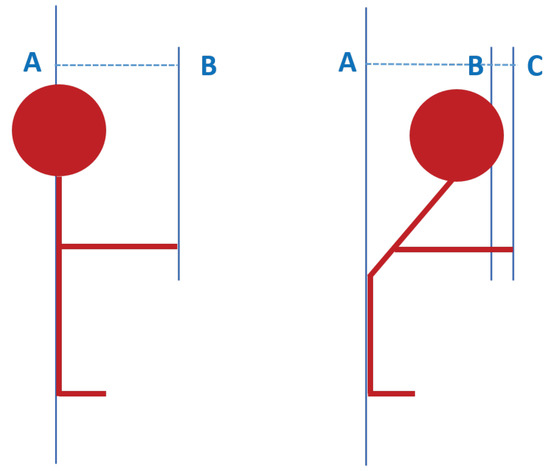
Figure 1.
Measurement of the Functional Reach Test (FRT) with A: the user’s position, B: the starting position of the hand, and C: the final position of the hand.
2.2. Automatic FRT
We implemented the FRT into our experimental system as an interaction mechanism so it can automatically measure an individual’s maximal forward reach. The system allows the calculation of the FRT in three steps as shown in Figure 2.
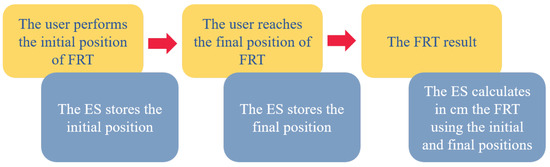
Figure 2.
Functioning sequence of the experimental system (ES).
We used an RGBD device namely Kinect v2 as an input method. For computing the reach distance, we used the data provided by Microsoft Kinect Software Development Kit (SDK) 2.0 and in particular the skeletal data. We were particularly interested in the hand joint to measure the distance travelled by the joint when performing the test. In concrete, we computed the Euclidean distance considering all the coordinates of the tracked hand joint. Finally, to ensure adequate feedback for the user, a text is displayed indicating whether the hand joint is tracked or not; if it is tracked, the color of the text is set to green, else it is red. In addition, “start” and “stop” instructions were shown on the screen to guide the user at the beginning and the end of the test. Furthermore, the user can see himself on the screen as it is demonstrated that mirror feedback provides motivation for the user [39]. In order to minimize distractions, we applied a background subtraction algorithm provided by RF-Solutions in the wrapper that we used to link between the Microsoft Kinect v2 and the game engine Unity [40].
2.3. Test Performance
Performing the test with the system follows the standard way of doing the FRT. The user stands sideways next to a wall facing the Microsoft Kinect v2 camera and a screen as if they are going to play a video game. Then, they raise their arm that is closer to the wall at 90 degrees of shoulder flexion (position AB in Figure 1). Here, the initial position is saved when indicated to the system. The user is then asked to reach forward as far as they can without losing balance (position AC in Figure 1), and the final position is recorded by the system when indicated. The system subsequently calculates the difference and gives the final result of the test as shown in Figure 3.
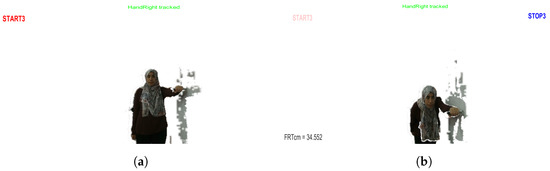
Figure 3.
Screenshot of the system during the FRT performance: (a) Initial position and (b) Last position.
2.4. Experiment 1: Assisted FRT Performance
In this experiment, the FRT measurements are done at the same time for the standard way (manually) and for the system using the Microsoft Kinect v2. This experiment follows the normal procedure of the FRT performance where the test is done under the supervision of a physiotherapist.
2.4.1. Participants
Nineteen healthy volunteers (9 men; aged between 18 and 37 years) participated in this experiment. None of them had cognitive and/or motor problems. All subjects signed an informed consent form before the experiment.
In order to perform an effect size study, we have made a power test analysis using the pwr package of R statistical package. The sample size of the experiment using a power test of 0.99 and a significance level of 0.05, was at least 12 participants to detect an absolute mean difference of 2.63 cm. So, with 19 participants recruited, the sample size condition is fulfilled.
2.4.2. Settings
In this experiment, the sensor was set at 1.5 m from the floor and 2.5 m away from the user. The manual measurement of FRT was performed against the wall as shown in Figure 4.
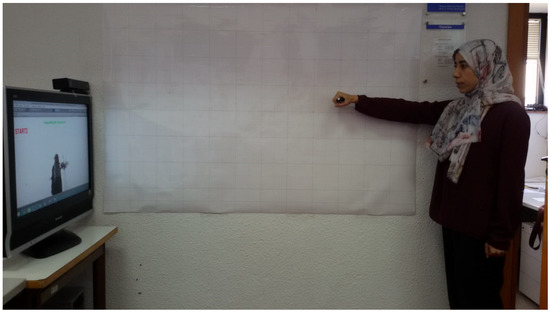
Figure 4.
Settings of the experiments.
All tests and experiments were conducted in laboratory settings using a Microsoft Kinect v2 and a desktop computer with the following features:
- IntelR CoreTM i5-4590 CPU @3.30 GHz (4 CPUs)
- 8 GB RAM
- Graphic card Intel(R) HD Graphics 4600
- Windows 8.1 Pro 64 bits
2.4.3. Process
Firstly, each participant was instructed how to perform the test. Next, they were asked to stand close to a wall facing both the sensor and the screen where their image was displayed. The physiotherapist was standing close to the participant to supervise the test performance as she may intervene to correct the posture. Then, the participant was asked to hold a marker pen and mark the first point on the board while saying “Go”. The physiotherapist validates the initial posture and one member of the research team hits the “G” key so the system can record the first position. After that, the participant is asked verbally to bend forward as maximum as they can. When he reaches the last position he notes on the board the last point with the pen saying “Stop”. Again, the physiotherapist validates the posture and the last position was saved by hitting the “S” key. Eventually, the differences between the last position and the first one that are marked on the board and taken by the system were all noted.
2.5. Experiment 2: Autonomous FRT Performance
There are cases when the physiotherapist cannot be physically present with the patient to assist her/him in measuring the FRT. In order to study the possibility of doing the test from home by the patient alone, we thought about doing another experiment where the user performs the test without any assistance from the physiotherapist. Plus, we believe that there could be a delay between marking the position on the board with a marker pen and indicating to someone else to press a key on the keyboard in order to save the position by the system after the physiotherapist’s validation.
2.5.1. Participants
The idea of this experiment is to validate the use of the sensor for different reach distances. For that reason, one member of the research team (female, age = 28 years) performed the test several times, each time starting from a different initial position and reaching to a different final position. The participant is familiarized with the test. We performed the same effect size study as in the other case, it suggests that we need at least 7 observations using a power test of 0.99 and a significance level of 0.05 for an absolute mean difference of 2.46 cm. So, the sample size condition is also fulfilled.
2.5.2. Settings
To ensure the autonomy of the test performance and the simultaneity of both methods (manually and using the Kinect), we opted for a controller device that allows the user to communicate with the system for saving the initial and final positions. The controller device consists of a pen mouse (a 2.4 G wireless optical mouse, and for this experiment, we attached to it a whiteboard marker for facilitating the manual measurement on the wall, hence marking the position on the wall and indicating the system to save the position at the same time. Besides, a poster was used to ease marking and computing the manual FRT. Settings of this experiment where the poster is hung on the wall are shown in Figure 4. The participant stood at a 2.5 m distance away from the camera; this distance was chosen based on results of another study [34].
2.5.3. Process
We firstly defined a set of points on the poster to be the initial and final positions of the test. The aim here is to simulate the behavior of different profiles of users with different heights and reaching capabilities. The experiment process is described in the following steps:
- Raise the arm with hand extended to a predetermined initial position while standing at a 2.5 m distance from the camera.
- Mark the initial position of the hand with the device on the poster so the manual FRT can be computed and clicking simultaneously on it so the system can save the position of the hand.
- From that initial position, reach to a final position. When reaching forward, the user naturally leans to a final position on the level of a starting position or he may reaches somewhat lower than that first position, hence:
- -
- The final position may lay on the same line of the initial position, making a distance ranging from 1s (5.9 cm) to 9s (53.1 cm) (s: square in the poster) as seen in Figure 5a.
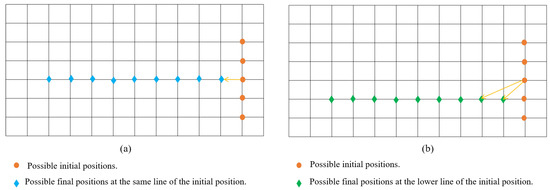 Figure 5. The initial and final positions at (a) Same line and (b) Different line.
 - -
- Or the final position may lay on the lower line of the initial position as seen in Figure 5b.
- For each final position chosen, repeat each trial 3 times starting from that initial position.
- Compute the difference between each first position and final position.
- Repeat the same process starting from another initial position laying on the same vertical line of the first one so the user is always standing away 2.5 m from the camera (see Figure 5).
In summary, the different steps of the protocol of experimentation in both experiments can be illustrated in the graphical diagram shown in Figure 6.
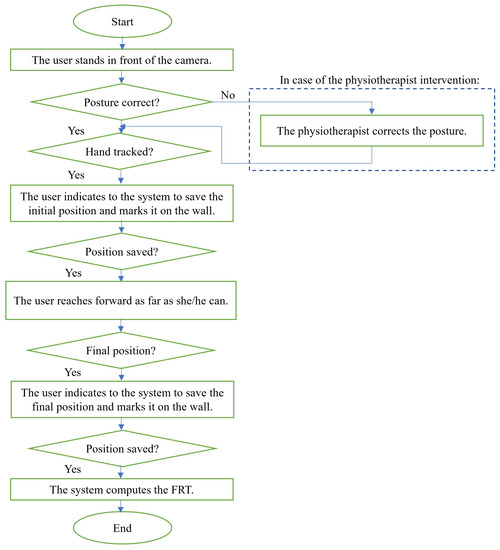
Figure 6.
Protocol of experimentation.
2.6. Measurements
For both experiments, the participants performed the test 3 times as indicated in the standard test. The distance between the initial position and the last one was computed by the system. In each experiment, we had the following measurements from both methods: manual FRT (M_FRT) for each trial, the mean of the three measurements for each user (), Kinect FRT (K_FRT) for each trial, and mean of the three measurements for each user ().
2.7. Statistical Analysis
The statistical analysis carried out consists of the following parts:
- We verified that there was a significant difference between the manual FRT methods (M_FRT) and the Kinect FRT (K_FRT) using the t-test of mean difference of paired samples. In order to carry out this test, we previously verified that the samples were distributed normally and that the size of the collected samples was adequate. For that reason, we applied Shapiro–Wilk normality test [41,42] to the data to check its distribution. Moreover, we conducted power analysis to determine the number of subjects required for the mean difference between the two sets of data obtained by both methods.
- As the previous conclusion contradicted previous works [26], we needed to correct the measurements using a linear model to fit the data from the K_FRT sample. We saw that the linear model is adequate to carry out this adjustment. Before doing that, we run Pearson correlation test to see if there is any association between the measures obtained from the different methods (manual and Kinect). This test is also known as the “product moment correlation coefficient” and it measures the strength and direction of association that exists between two continuous variables [43].
- Finally, carried out the t-test again for the adjusted data, checking that there were no significant differences between the two methods.
To analyze the reliability of the FRT, we assessed the variation of data measured by the Kinect system across the three trials of FRT using intraclass correlation coefficient (ICC, 2.1) [44]. Based on a 95% confidence interval, values of ICC less than 0.5, between 0.5 and 0.75, between 0.75 and 0.9, and greater than 0.90 indicate poor, moderate, good, and excellent reliability, respectively, [45]. The level of significance for all tests was set at . The statistical analysis tool R was used.
3. Results
The results of each experiment are presented apart in the following subsections.
3.1. Experiment 1: Assisted FRT Performance
3.1.1. Data Obtained
A summary of the measurements obtained during Experiment 1 are shown in Figure 7. Detailed measurements for each user can be found in Appendix A at Table A1.
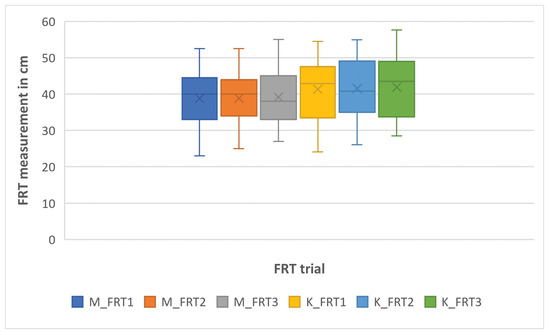
Figure 7.
Box plot of the FRT measurements by the experimental system (K_FRT) and manually (M_FRT) in Experiment 1.
3.1.2. Statistical Analysis
The outcomes of Shapiro–Wilk normality test (test statistic W and p-value) on the data obtained manually using the whiteboard (M_FRT) and by the system using Kinect (K_FRT) are shown in Table 1. The p-value of the data in both methods (M_FRT) and (K_FRT) is greater than 0.05 then the null hypothesis is maintained. Thus, we can assume that our data are approximately normally distributed.

Table 1.
Shapiro–Wilk normality test applied to data of Experiment 1.
Visual inspection using normal Q-Q plots indicates also that the data obtained by both methods are approximately normally distributed as it can be seen in Figure 8 where the dots are approximately distributed along the line because they are located in the 95% confidence bands for the empirical quantile plot [46].
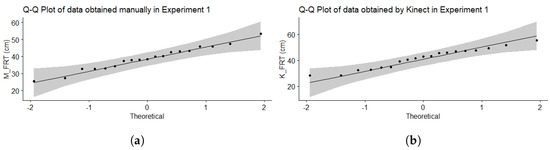
Figure 8.
Q-Q Plot of data of Experiment 1 (a) M_FRT and (b) K_FRT.
To see the difference between the means of the two sets of data, we used the paired t-test. As shown in Table 2, the p-value is much less than 0.05 so the null hypothesis is rejected and there is statistically significance difference in average means of the measures obtained by the two methods, which is not correct since we know from previous work [26] that there are no statistically significant differences in the average, so the measurements are valid but need to be corrected.
Table 2.
Results of paired t-test applied to data of Experiment 1.
The Pearson correlation coefficient obtained is equal to 0.97 with p-value less than the significance level 0.05 (p-value = ). Hence, we can conclude that FRT values obtained by the Microsoft Kinect v2 and those measured manually are significantly correlated. This can also be shown visually in Figure 9 where the scatter plot shows linear correlation between the data. Moreover, we found a good repeatability of the FRT measurements tracked by Kinect with an ICC = 0.861 (95% confidence interval, CI, 0.73–0.939).
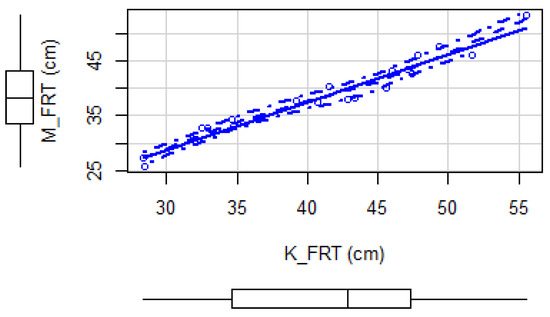
Figure 9.
Scatter plot of the data obtained by the experimental system and manually in Experiment 1.
Given that we demonstrated that the data is linearly correlated, we made a linear model to correct the K_FRT data. Regression results gave a slope coefficient of 0.934 and adjusted R-squared value of 0.99 which means that the regression model explains 99% of the variability in the observations. We also found that the residuals are normal by applying Shapiro–Wilk normality test (W = 0.90586, p-value = 0.06218). In order to inspect visually the linear regression assumptions, we examined the residual plots shown in Figure 10. The first is a constant variance plot, which checks for the homogeneity of the variance and the linear relation. There is no obvious pattern in this graph, then linearity assumption is met. The second plot in the graph is a Q-Q plot, which checks if residuals are normally distributed. The points fall on a line hence the normality assumption is also met. The third plot allows to detect heterogeneity of the variance while the fourth plot allows for the detection of points that have a large impact on the regression coefficients. Visual inspection to these plots show that the assumption of equal variance (homoscedasticity) is met and there is no influential cases. More concretely, in the graph of fitted values vs. residuals, we observe that the linearity of the model is verified since the red line is close to the dotted line and in the graph of standardized residuals vs. leverages and the graph of the square root of the standardized residuals vs. fitted values, we see that the standardized residuals do not increase or decrease with the leverage or with the fitted values, reinforcing the homoscedasticity of the residuals and the linearity of the model. We can then say that the model works well for the data.
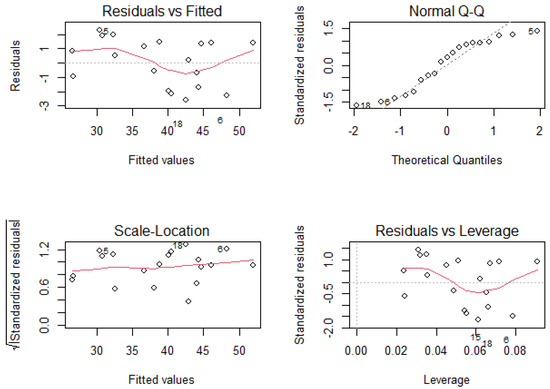
Figure 10.
Residual plots generated from the linear regression model in Experiment 1.
At the end, we re-applied the paired t-test using the corrected data and we found this time a p-value higher than the significance level 0.05 indicating that there are no statistical significant differences between the averages of measures obtained by both methods. Results of the t-test after data correction are shown in Table 3.
Table 3.
Results of paired t-test applied to data of Experiment 1 after correction.
Finally, in Figure 11, a Bland–Altman plot is shown for experiment 1. The agreement between the two methods is remarkable because there is no much difference between limits of agreement (≈ units). Moreover, the mean differences is , which means that there is no bias.
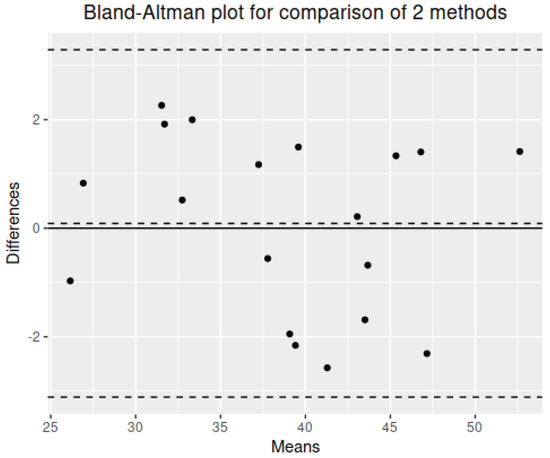
Figure 11.
Bland Altman plot for experiment 1.
3.2. Experiment 2: Autonomous FRT Performance
3.2.1. Data Obtained
The participant performed 195 reach trials, resulting in 65 final measurements of FRT as shown in Table A2. A summary of these measurements are depicted in Figure 12.
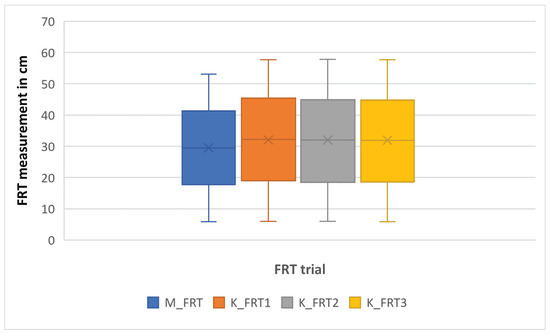
Figure 12.
Box plot of the FRT measurements by the experimental system (K_FRT) and manually (M_FRT) in Experiment 2.
3.2.2. Statistical Analysis
Table 4 shows the results of the paired t-test applied to the data obtained by the standard way using the poster and by the experimental system using the Microsoft Kinect v2. The p-value is less than 0.05 which indicated that there is statistical significant difference between the means of the two data sets, hence the measures obtained by the Microsoft Kinect v2 are valid but need to be corrected.
Table 4.
Results of paired t-test applied to the data of Experiment 2.
With regards to the Shapiro–Wilk normality test, as shown in Table 5, the p-value of the data is greater than 0.05 then the null hypothesis is maintained. Graphically, the Q-Q plots in Figure 13 showed that the data are within the 95% confidence interval suggesting that this sample data comes from a normal distribution.
Table 5.
Shapiro–Wilk normality test applied to data of Experiment 2.
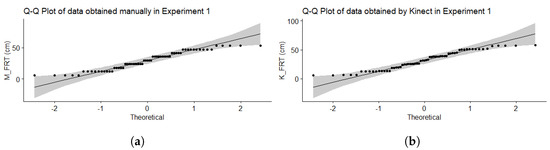
Figure 13.
Q-Q Plot of data of Experiment 2 (a) M_FRT and (b) K_FRT.
We obtained a Pearson correlation coefficient equals to 0.99 with p-value less than 0.05, which means that data acquired using the poster and the Microsoft Kinect v2 are strongly correlated. This result can also be noticed visually using a scatter plot as shown in Figure 14 where a linear relationship is obvious between the two data sets obtained by both methods. In addition, there was an excellent within session repeatability of Kinect measurements as indicated by the intraclass coefficient, ICC = 0.999 (95% confidence interval, CI, 0.998–0.999).
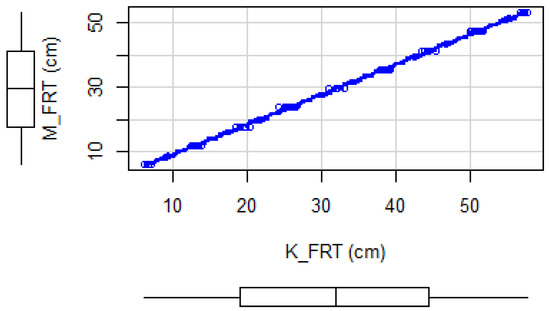
Figure 14.
Scatter plot of the data obtained by the experimental system and manually in Experiment 2.
As the data are linearly correlated, we applied a linear regression model without a constant intercept as in Experiment 1 to correct the data obtained by the Microsoft Kinect v2. Regression results gave a slope coefficient of 0.924 and adjusted R-squared value of 0.99, which is also statistically significant (p-value < ), indicating that the regression model explains almost all of the variability in the observations. In addition, the residuals are normal applying Shapiro–Wilk normality test (W = 0.98624, p-value = 0.6876). Visual inspection to the residual plots of Figure 15 indicates that the linear regression assumptions (linearity, homoscedasticity, independence, and normality) are met. In this figure, the values 22 and 25 shown by the graph of the residuals vs. fitted values and the square root of the standardized residuals vs. fitted values are the possible outliers of the model, that is, values that have an anomalous value of the dependent variable. The values 22, 25 and 33 shown by the graph of the standardized residuals vs. the theoretical quantiles are values that are above the “normality” line and if they were very far from this line, it would indicate a violation of the hypothesis of normality of the residuals. Finally, the values 8, 25 and 26 shown by the graph of the standardized residuals vs. leverage indicates the presence of influence values, that is, values that, if removed from the model, cause the model to change substantially.
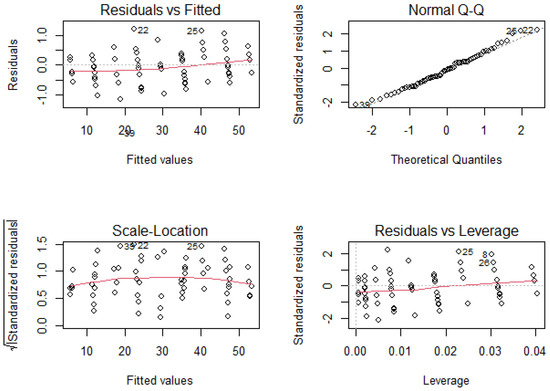
Figure 15.
Residual plots generated from the linear regression model in Experiment 2.
Finally, in Figure 16, a Bland–Altman plot is shown for experiment 2. The agreement between the two methods is also remarkable because there is no much difference between limits of agreement (≈ units). Moreover, the mean differences is , which means that there is also no bias.
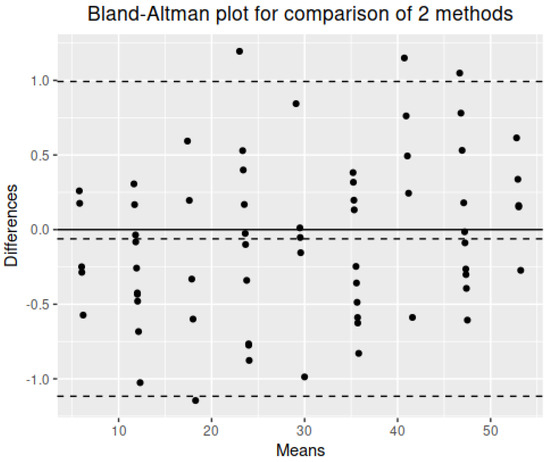
Figure 16.
Bland–Altman plot for experiment 2.
Applying paired t-test after correction, we found the results presented in Table 6. Findings indicated that there are no statistical difference in the average with a p-value much higher than 0.05.
Table 6.
Results of paired t-test applied to the data of Experiment 2 after correction.
4. Discussion
In our previous work [26], with the aim to validate the use of vision-based systems for measuring the Functional Reach Test (FRT), we compared FRT values obtained using Microsoft Kinect v1 with those measured manually. Participants performed the FRT interchangeably between the manual way and using the system. Results showed an average absolute difference of 2.84 cm and no statistical significant difference was found applying a paired t-student test to the data. These results suggested that Microsoft Kinect v1 can be used to measure the FRT. In this present work, two new experiments were conducted in order to improve and further validate the system using the Microsoft Kinect v2 for possible deployment at homes. Overall Kinect v2 outperforms Kinect v1 as it offers better robustness and accuracy when estimating joint positions except for the feet [47]. In fact, the Kinect v1 measures the depth with the Pattern Projection principle, where a known infrared pattern is projected into the scene and out of its distortion the depth is computed. The Kinect v2 contains a Time-of-Flight (ToF) camera and determines the depth by measuring the time emitted light takes from the camera to the object and back [48]. This time, measurements were extracted simultaneously by both methods. With the Microsoft Kinect v2, we found that the measurements obtained by the standard way and the experimental system in both experiments are linearly correlated and the absolute measurement error in both experiments was also less than the one obtained by Kinect v1. Applying paired t-test, we found that the data obtained was valid but needed to be corrected, hence a linear regression model was applied to correct the data acquired using the Microsoft Kinect v2. Examination of regression assumptions showed that the model explains well the data and applying the paired t-test to the data after correction indicated that there is no statistical significant difference between the measurements obtained by both methods.
In a similar study to ours, Galen et al. [34] sought the validity of an interactive Functional Reach Test. To achieve their aim, they used wrist joint data from Kinect v1 SDK with the camera set on the left of the user. They computed the reach distance and compared it with the outcomes obtained simultaneously by the Optotrak Certus 3D motion-capture system. They set the experiment with three different distances from the Kinect sensor: at 2 m, 2.5 m, and 3 m, with the best agreement was reported at 2.5 m. However, they noted that there was no optimal distance with minimal measurements errors. Even so, the mean measurement found at 2.5 m distance from the camera was 4.92 cm; a value that lays within the minimal detectable change values of the FRT in stroke and Parkison’s disease populations as reported by the authors. As for our experiments, we used the hand joint data provided by Kinect v2 to compute the FRT with the user facing the camera at 2.5 m distance; the user is best tracked while he is facing the sensor. As in [34], we compared the values returned by the system with those measured by the physiotherapist simultaneously. In both experiments, we found an average absolute difference smaller than found in the experiment of [34], though a larger sample is required to detect minor differences between the standard FRT and the experimental system. As for display interface, we used mirror feedback where the user can see herself/himself on the screen all time whereas in the work of Galen et al. [34] they employed a wireframe skeleton avatar. At the end, for the sake of deploying the research results at home, we added a pen controller that can help controlling the system in certain cases as the voice commands of Kinect sensor fails when there is noise in the environment.
Other studies have used RGBD sensors for the measurement of the FRT. Though having different gold standards and settings, our findings align with theirs in terms of validity of the test and its reliability. We had very strong correlation with manual FRT with values of (r = 0.97, p < 0.05) and (r = 0.99, p < 0.05) in the first and second experiments, respectively, where Hsiao et al. [49] also reported a strong correlation (r = 0.719, p < 0.001) of Kinect v2 results with traditional FRT. In their study, Clark et al. [36] computed the reach distance through trunk flexion measurements and concluded that Kinect could be used in instrumenting the reach test by providing excellent validity for trunk angle data (r = 0.93, p < 0.05). These findings maintain valid using PrimeSense camera as well, Moreno et al. [33] acquired kinematic data from both PrimeSense and inertial sensors intertiaCube3 TM as benchmark for the parametrization of MDRT, and comparisons revealed strong correlation in most of the evaluated variables of the test.
In terms of reliability, we obtained good to excellent within repeatability of the test using our system (ICC = 0.86 in Experiment 1 and ICC = 0.99 in Experiment 2). From their side, Hsiao et al. [49] found a good repeatability (ICC = 0.82) of the measurements of the second and third trials of forward reach obtained by Kinect v2. Moreover, Clark et al. [35] assessed inter-trial reliability of forward reach and reported comparable good Kinect reliability (ICC = 0.72) with 3DMA reliability (ICC = 0.81). This is consistent with the excellent intrarater reliability of the original test [50]. Furthermore, RGBD devices can be a great tool for fast screening for balance problems as they proved to be valid and reliable, they also provide user feedback which is reported important to improve adherence in rehabilitation. Furthermore, they have the advantage of capturing other parameters that might be of interest of therapists such as time and velocity of doing the test [33,49], differentiating the movement strategy [51], among others. These parameters can be used for better assessing the balance ability of people with balance deficiencies. The limitation of the study is that the system was tested in laboratory conditions. Further validations performed by different patient populations in real situations could generalize our findings. Nevertheless, different studies showed that FRT can be used as an index for fall prevention [52,53,54,55].
Finally, we want to remark that the proposed system can be considered transparent [56], because has the ability of simulatability (being simulated or thought about strictly by a human), decomposability (explaining each of the parts of the method), and algorithmic transparency (the user can understand the process followed by the method to produce any given output from its input data). This is especially critical in health, to trust the behavior of systems.
5. Conclusions
In this work, we presented an experimental system to assess the Functional Reach Test (FRT) with the Microsoft Kinect v2. We aimed to validate Microsoft Kinect v2 for balance and postural control assessment to use it with the support of a physiotherapist, and to use it autonomously by the user.
The system calculates the reach distance when indicated by the user or the physiotherapist. To validate the use of this RGBD device for measuring this balance test, we conducted two experiments where it has been proven that the measurements obtained using the standard method and using the experimental system are linearly correlated. Hence, a linear regression model was applied to correct the Microsoft Kinect v2 measurements and a paired t-test was applied to these corrected data where results indicated that there are no statistical differences between the measurements computed using the two methods. The two experiments that we conducted, though held in lab settings, are meant as a step forward to deploying the system at home. The strong correlation with manual FRT and the good results of within repeatability of the test obtained from experimentation suggest that the RGBD devices can be an alternative for measuring balance tests unsupervised, like the FRT at home.
However, this study presents some limitations that mainly consist of not recruiting patients in the experiments and conducting the tests in lab settings. For this reason, further studies are recommended for the actual deployment of the test using RGBD devices at home of recruited patients.
As a future work, we will continue to translate the system to home and validate Microsoft Kinect for measuring other balance clinical tests. Furthermore, we will design several experiments to check if the physical absence/ presence of the physical therapist affects fear of falls. Furthermore, we intend to translate the system to social/assistive robots to promote social interaction between the person and the social robot in order to evaluate the quality of life of the patient and prevent their physical impairment.
Author Contributions
Conceptualization: A.J.-i-C., I.A. and G.M.-A.; methodology: A.J.-i-C., I.A., G.M.-A., P.M.-B. and A.M.; software: I.A.; validation: A.J.-i-C., G.M.-A. and A.M.; formal analysis: A.M.; investigation: I.A. and P.M.-B.; resources: G.M.-A. and A.J.-i-C.; data curation: I.A.; writing—original draft preparation: I.A.; writing—review and editing: I.A., G.M.-A., A.J.-i-C., P.M.-B. and A.M.; visualization: I.A. and G.M.-A.; supervision: A.J.-i-C. and G.M.-A.; project administration: A.J.-i-C.; funding acquisition: A.J.-i-C. All authors have read and agreed to the published version of the manuscript.
Funding
This work was funded by project EXPLainable Artificial INtelligence systems for health and well-beING (EXPLAINING) (PID2019-104829RA-I00/AEI/10.13039/501100011033), and project TIN2016-81143-R (MINECO/AEI/ERDF, EU). Ines Ayed benefited from the fellowship FPI/2039/2017 from the Vicepresidència i Conselleria d’Innovació, Recerca i Turisme del Govern de les Illes Balears.
Institutional Review Board Statement
Not applicable.
Informed Consent Statement
All subjects signed an informed consent form before the experiment.
Conflicts of Interest
The authors declare no conflict of interest. The funders had no role in the design of the study; in the collection, analyses, or interpretation of data; in the writing of the manuscript, or in the decision to publish the results.
Abbreviations
The following abbreviations are used in this manuscript:
| FRT | Functional Reach Test |
| RGBD | Red Green Blue Depth |
| HRPD | High Risk for Parkinson’s Disease |
| ES | Experimental System |
| MDRT | Multi-Directional Reach Test |
| SDK | Software Development Kit |
Appendix A
We included raw data for the results, this way other researchers can compute their metrics for comparison purposes. For the sake of scientific progress, it would be beneficial for this topic of research if authors published their raw data.
Appendix A.1. Measurments of Experiment 1
Table A1.
FRT measurements obtained during Experiment 1 in cm.
Table A1.
FRT measurements obtained during Experiment 1 in cm.
| User | M_FRT1 | M_FRT2 | M_FRT3 | K_FRT1 | K_FRT2 | K_FRT3 | ||
|---|---|---|---|---|---|---|---|---|
| 1 | 48.5 | 47 | 47 | 47.5 | 49.5 | 49.3 | 49.2 | 49.33 |
| 2 | 42 | 47 | 49 | 46 | 47.3 | 46.9 | 49.2 | 47.8 |
| 3 | 34 | 36 | 33 | 34.33 | 33.7 | 35 | 35.1 | 34.6 |
| 4 | 40 | 40 | 41 | 40.33 | 41.5 | 40.8 | 42.4 | 41.56 |
| 5 | 33 | 35 | 30 | 32.66 | 29.1 | 35.5 | 33 | 32.53 |
| 6 | 48.5 | 43.5 | 46 | 46 | 54.5 | 49.2 | 51.4 | 51.7 |
| 7 | 40.5 | 38 | 35 | 37.83 | 42.9 | 39.9 | 34.9 | 39.23 |
| 8 | 23 | 26 | 28 | 25.66 | 24.1 | 29.7 | 31.7 | 28.5 |
| 9 | 30 | 25 | 27 | 27.33 | 30.5 | 26.1 | 28.5 | 28.36 |
| 10 | 46 | 45.5 | 38 | 43.16 | 48 | 48.6 | 41.3 | 45.96 |
| 11 | 32 | 35 | 32 | 33 | 33.4 | 37.4 | 33.5 | 34.76 |
| 12 | 52.5 | 52.5 | 55 | 53.33 | 54.2 | 54.9 | 57.6 | 55.56 |
| 13 | 41 | 44 | 45 | 43.33 | 45.3 | 50.1 | 45.9 | 47.1 |
| 14 | 44.5 | 32.5 | 37.3 | 38.1 | 45.9 | 39 | 43.7 | 42.86 |
| 15 | 36 | 41 | 38 | 38.33 | 42 | 44.5 | 43.5 | 43.33 |
| 16 | 42 | 43 | 43 | 42.66 | 47.6 | 49.1 | 45.7 | 47.46 |
| 17 | 33.5 | 34 | 45 | 37.5 | 40.6 | 32.6 | 49 | 40.73 |
| 18 | 38 | 40 | 42 | 40 | 43.8 | 46.5 | 46.4 | 45.56 |
| 19 | 32 | 33 | 33 | 32.66 | 30.7 | 34.3 | 33.7 | 32.9 |
Appendix A.2. Measurments of Experiment 2
Table A2.
FRT measurements obtained during Experiment 2 in cm.
Table A2.
FRT measurements obtained during Experiment 2 in cm.
| M_FRT | K_FRT1 | K_FRT2 | K_FRT3 | |
|---|---|---|---|---|
| 5.9 | 6.28 | 6.22 | 6.07 | 6.19 |
| 11.8 | 12.95 | 13.06 | 12.4 | 12.80 |
| 17.7 | 19.46 | 18.35 | 18.98 | 18.93 |
| 23.6 | 25.19 | 25.54 | 25.29 | 25.34 |
| 29.5 | 32.62 | 32.01 | 31.25 | 31.96 |
| 35.4 | 39.05 | 38.99 | 39.5 | 39.18 |
| 41.3 | 42.82 | 44.9 | 44.66 | 44.13 |
| 47.2 | 49.41 | 51.02 | 49.3 | 49.91 |
| 53.1 | 56.98 | 57.64 | 56.55 | 57.06 |
| 5.9 | 6.35 | 6.85 | 6.75 | 6.65 |
| 11.8 | 12.53 | 13.32 | 13.27 | 13.04 |
| 17.7 | 19.44 | 19.37 | 19.7 | 19.5 |
| 23.6 | 24.54 | 24.96 | 25.36 | 24.95 |
| 29.5 | 32.22 | 32.1 | 31.89 | 32.07 |
| 35.4 | 38.05 | 37.81 | 37.97 | 37.94 |
| 41.3 | 44.64 | 44.49 | 42.39 | 43.84 |
| 47.2 | 50.36 | 50.67 | 50.38 | 50.47 |
| 53.1 | 57.15 | 56.45 | 56.68 | 56.76 |
| 5.9 | 7.22 | 7.96 | 5.82 | 7 |
| 11.8 | 12.95 | 12.19 | 12.59 | 12.58 |
| 17.7 | 18.78 | 18.49 | 18.23 | 18.5 |
| 23.6 | 25.22 | 23.4 | 24.06 | 24.23 |
| 29.5 | 31.44 | 30.96 | 30.58 | 30.99 |
| 35.4 | 38.4 | 37.26 | 38.56 | 38.07 |
| 41.3 | 42.31 | 44.35 | 43.59 | 43.42 |
| 47.2 | 50.21 | 49.36 | 51.02 | 50.2 |
| 53.1 | 57.04 | 57.35 | 57.38 | 57.26 |
| 5.9 | 6.6 | 6.74 | 6.74 | 6.69 |
| 11.8 | 13.59 | 13.28 | 12.97 | 13.28 |
| 17.7 | 19.21 | 19.91 | 20.25 | 19.79 |
| 23.6 | 26.03 | 25.23 | 25.64 | 25.63 |
| 29.5 | 32.01 | 31.41 | 32.26 | 31.89 |
| 35.4 | 38.17 | 38 | 38.25 | 38.14 |
| 41.3 | 44.19 | 44.31 | 44.7 | 44.4 |
| 47.2 | 51.04 | 50.26 | 51.26 | 50.85 |
| 53.1 | 57.26 | 57.59 | 56.9 | 57.25 |
| 5.9 | 5.92 | 6.01 | 6.36 | 6.1 |
| 11.8 | 13.53 | 13.34 | 13.63 | 13.5 |
| 17.7 | 20.89 | 20.13 | 20.13 | 20.38 |
| 23.6 | 25.59 | 26.96 | 26.52 | 26.36 |
| 29.5 | 32.66 | 34.12 | 32.13 | 32.97 |
| 35.4 | 38.42 | 38.86 | 39.59 | 38.96 |
| 41.3 | 46.29 | 44.84 | 44.78 | 45.3 |
| 47.2 | 51.8 | 51.38 | 51.22 | 51.47 |
| 53.1 | 57.72 | 57.76 | 57.68 | 57.72 |
| 11.8 | 13.26 | 13.08 | 13.32 | 13.22 |
| 23.6 | 25.69 | 26.37 | 25.61 | 25.89 |
| 35.4 | 38.61 | 38.53 | 38.88 | 38.67 |
| 47.2 | 51.75 | 51.41 | 50.94 | 51.37 |
| 11.8 | 13.82 | 13.99 | 13.8 | 13.87 |
| 23.6 | 25.99 | 27.67 | 25.76 | 26.47 |
| 35.4 | 36.59 | 38.13 | 38.9 | 37.87 |
| 47.2 | 51.02 | 51.28 | 51.68 | 51.33 |
| 11.8 | 13.38 | 12.23 | 12.93 | 12.85 |
| 23.6 | 26.05 | 25.11 | 24.11 | 25.09 |
| 35.4 | 39.08 | 39.06 | 38.62 | 38.92 |
| 47.2 | 51.75 | 49.73 | 51.7 | 51.06 |
| 11.8 | 13.02 | 12.31 | 11.95 | 12.43 |
| 23.6 | 25.7 | 25.67 | 25.28 | 25.55 |
| 35.4 | 38.94 | 38.61 | 38.87 | 38.81 |
| 47.2 | 51.73 | 50.93 | 50.76 | 51.14 |
| 11.8 | 13.56 | 13.02 | 13.12 | 13.23 |
| 23.6 | 26.3 | 26.18 | 26.58 | 26.35 |
| 35.4 | 38.17 | 38.74 | 38.73 | 38.55 |
| 47.2 | 52.12 | 51.59 | 51.4 | 51.7 |
References
- Rubenstein, L.Z.; Josephson, K.R. Falls and their prevention in elderly people: What does the evidence show? Med. Clin. 2006, 90, 807–824. [Google Scholar] [CrossRef]
- Davis, J.C.; Dian, L.; Parmar, N.; Madden, K.; Khan, K.M.; Chan, W.; Cheung, W.; Rogers, J.; Liu-Ambrose, T. Geriatrician-led evidence-based Falls Prevention Clinic: A prospective 12-month feasibility and acceptability cohort study among older adults. BMJ Open 2018, 8, e020576. [Google Scholar] [CrossRef]
- Eagen, T.J.; Teshale, S.M.; Herrera-Venson, A.P.; Ordway, A.; Caldwell, J. Participation in two evidence-based falls prevention programs by adults aging with a long-term disability: Case-control study of reach and effectiveness. J. Aging Health 2019, 31, 39S–67S. [Google Scholar] [CrossRef] [PubMed]
- Ezenwa, K. Reducing Falls among the Elderly: A Comprehensive Evidence Based Fall Prevention Strategy. Ph.D. Thesis, Brandman University, Irvine, CA, USA, 2020. [Google Scholar]
- Scott, V.; Votova, K.; Scanlan, A.; Close, J. Multifactorial and functional mobility assessment tools for fall risk among older adults in community, home-support, long-term and acute care settings. Age Ageing 2007, 36, 130–139. [Google Scholar] [CrossRef] [PubMed]
- Moreira, A.C.S.D.S.; Mazo, G.Z.; Hauser, E.; Paiva, P.B.D.; Menezes, E.; Cardoso, F.L. Do functional mobility tests predict the risk of falls in community-dwelling elderly? Man. Ther. Posturology Rehabil. J. 2018, 14. [Google Scholar] [CrossRef]
- Valenzuela, P.L.; Maffiuletti, N.A.; Saner, H.; Schütz, N.; Rudin, B.; Nef, T.; Urwyler, P. Isometric strength vs. functional mobility and their relationship with risk of falls in community-dwelling older adults: A prospective study. Europe PCM 2019. [Google Scholar] [CrossRef]
- Tinetti, M.E.; Baker, D.I.; McAvay, G.; Claus, E.B.; Garrett, P.; Gottschalk, M.; Koch, M.L.; Trainor, K.; Horwitz, R.I. A multifactorial intervention to reduce the risk of falling among elderly people living in the community. N. Engl. J. Med. 1994, 331, 821–827. [Google Scholar] [CrossRef]
- Mitchell, S.; Skelton, D. Does Tinetti score influence onward exercise referral on completion of a falls prevention programme for older adults? Physiotherapy 2017, 103, e65. [Google Scholar] [CrossRef]
- Hong, J.; Kong, H.J.; Yoon, H.J. Web-based telepresence exercise program for community-dwelling elderly women with a high risk of falling: Randomized controlled trial. JMIR mHealth uHealth 2018, 6, e132. [Google Scholar] [CrossRef]
- Berg, K.O.; Wood-Dauphinee, S.L.; Williams, J.I.; Maki, B. Measuring balance in the elderly: Validation of an instrument. Can. J. Public Health Rev. Can. Sante Publique 1992, 83, S7–S11. [Google Scholar]
- Bogle Thorbahn, L.D.; Newton, R.A. Use of the Berg Balance Test to predict falls in elderly persons. Phys. Ther. 1996, 76, 576–583. [Google Scholar] [CrossRef]
- Lee, Y.H.; Jang, S.J.; Kang, G.B.; Choi, Y.S.; Hwang, Y.I. Correlations between Foot Sensory Impairment, Timed Up and Go Test and Berg Balance Scale, and Mental Activities for Prevention of Falling in Elderly People. Korean Soc. Phys. Med. 2019, 14, 9–17. [Google Scholar] [CrossRef]
- Lee, L.S.; Choo, L.A. Test-Retest Reliability Of The Berg Balance Scale For Elderly Adult. Balance 2019. [Google Scholar]
- Podsiadlo, D.; Richardson, S. The timed “Up & Go”: A test of basic functional mobility for frail elderly persons. J. Am. Geriatr. Soc. 1991, 39, 142–148. [Google Scholar]
- Seo, J.; Kim, T.; Lee, J.; Kim, J.; Choi, J.; Tack, G. Fall prediction of the elderly with a logistic regression model based on instrumented timed up & go. J. Mech. Sci. Technol. 2019, 33, 3813–3818. [Google Scholar]
- Kang, L.; Han, P.; Wang, J.; Ma, Y.; Jia, L.; Fu, L.; Yu, H.; Chen, X.; Niu, K.; Guo, Q. Timed Up and Go Test can predict recurrent falls: A longitudinal study of the community-dwelling elderly in China. Clin. Interv. Aging 2017, 12, 2009. [Google Scholar] [CrossRef]
- Ibrahim, A.; Singh, D.K.A.; Shahar, S.; Omar, M.A. Timed up and go test combined with self-rated multifactorial questionnaire on falls risk and sociodemographic factors predicts falls among community-dwelling older adults better than the timed up and go test on its own. J. Multidiscip. Healthc. 2017, 10, 409. [Google Scholar] [CrossRef]
- Duncan, P.W.; Weiner, D.K.; Chandler, J.; Studenski, S. Functional reach: A new clinical measure of balance. J. Gerontol. 1990, 45, M192–M197. [Google Scholar] [CrossRef] [PubMed]
- Rosa, M.V.; Perracini, M.R.; Ricci, N.A. Usefulness, assessment and normative data of the Functional Reach Test in older adults: A systematic review and meta-analysis. Arch. Gerontol. Geriatr. 2019, 81, 149–170. [Google Scholar] [CrossRef] [PubMed]
- Williams, B.; Allen, B.; Hu, Z.; True, H.; Cho, J.; Harris, A.; Fell, N.; Sartipi, M. Real-time fall risk assessment using functional reach test. Int. J. Telemed. Appl. 2017, 2017. [Google Scholar] [CrossRef]
- Chou, W.C.; Tinetti, M.E.; King, M.B.; Irwin, K.; Fortinsky, R.H. Perceptions of physicians on the barriers and facilitators to integrating fall risk evaluation and management into practice. J. Gen. Intern. Med. 2006, 21, 117–122. [Google Scholar] [CrossRef]
- Arthur, H.M.; Smith, K.M.; Kodis, J.; McKelvie, R. A controlled trial of hospital versus home-based exercise in cardiac patients. Med. Sci. Sport. Exerc. 2002, 34, 1544–1550. [Google Scholar] [CrossRef] [PubMed]
- Ayed, I.; Ghazel, A.; Jaume-i Capo, A.; Moya-Alcover, G.; Varona, J.; Martinez-Bueso, P. Feasibility of Kinect-based games for balance rehabilitation: A case study. J. Healthc. Eng. 2018, 2018. [Google Scholar] [CrossRef] [PubMed]
- Ayed, I.; Ghazel, A.; Jaume-i Capó, A.; Moyà-Alcover, G.; Varona, J.; Martínez-Bueso, P. Vision-based serious games and virtual reality systems for motor rehabilitation: A review geared toward a research methodology. Int. J. Med. Inform. 2019, 131, 103909. [Google Scholar] [CrossRef] [PubMed]
- Ayed, I.; Alcover, B.M.; Bueso, P.M.; Varona, J.; Ghazel, A.; i Capó, A.J. Validación de dispositivos RGBD para medir terapéuticamente el equilibrio: El test de alcance funcional con Microsoft Kinect [RGBD device validation to measure balance therapeutically: The Functional Reach Test with Microsoft Kinect]. Rev. Iberoam. Automática Informática Ind. 2017, 14, 115–120. [Google Scholar] [CrossRef]
- Sprint, G.; Cook, D.J.; Weeks, D.L. Toward automating clinical assessments: A survey of the timed up and go. IEEE Rev. Biomed. Eng. 2015, 8, 64–77. [Google Scholar] [CrossRef] [PubMed]
- Eltoukhy, M.A.; Kuenze, C.; Oh, J.; Signorile, J.F. Validation of static and dynamic balance assessment using Microsoft Kinect for young and elderly populations. IEEE J. Biomed. Health Inform. 2017, 22, 147–153. [Google Scholar] [CrossRef]
- Clark, R.A.; Mentiplay, B.F.; Hough, E.; Pua, Y.H. Three-dimensional cameras and skeleton pose tracking for physical function assessment: A review of uses, validity, current developments and Kinect alternatives. Gait Posture 2019, 68, 193–200. [Google Scholar] [CrossRef]
- Trinidad-Fernández, M.; Beckwée, D.; Cuesta-Vargas, A.; González-Sánchez, M.; Moreno, F.A.; González-Jiménez, J.; Joos, E.; Vaes, P. Validation, Reliability, and Responsiveness Outcomes Of Kinematic Assessment With An RGB-D Camera To Analyze Movement In Subacute Furthermore, Chronic Low Back Pain. Sensors 2020, 20, 689. [Google Scholar] [CrossRef]
- Merchán-Baeza, J.A.; González-Sánchez, M.; Cuesta-Vargas, A.I. Reliability in the parameterization of the functional reach test in elderly stroke patients: A pilot study. BioMed Res. Int. 2014, 2014. [Google Scholar] [CrossRef]
- Hasmann, S.E.; Berg, D.; Hobert, M.A.; Weiss, D.; Lindemann, U.; Streffer, J.; Liepelt-Scarfone, I.; Maetzler, W. Instrumented functional reach test differentiates individuals at high risk for Parkinson’s disease from controls. Front. Aging Neurosci. 2014, 6, 286. [Google Scholar] [CrossRef]
- Moreno, F.Á.; Merchán-Baeza, J.; González-Sánchez, M.; González-Jiménez, J.; Cuesta-Vargas, A. Experimental validation of depth cameras for the parameterization of functional balance of patients in clinical tests. Sensors 2017, 17, 424. [Google Scholar] [CrossRef]
- Galen, S.S.; Pardo, V.; Wyatt, D.; Diamond, A.; Brodith, V.; Pavlov, A. Validity of an interactive functional reach test. Games Health J. 2015, 4, 278–284. [Google Scholar] [CrossRef]
- Clark, R.A.; Pua, Y.H.; Fortin, K.; Ritchie, C.; Webster, K.E.; Denehy, L.; Bryant, A.L. Validity of the Microsoft Kinect for assessment of postural control. Gait Posture 2012, 36, 372–377. [Google Scholar] [CrossRef]
- Clark, R.A.; Pua, Y.H.; Oliveira, C.C.; Bower, K.J.; Thilarajah, S.; McGaw, R.; Hasanki, K.; Mentiplay, B.F. Reliability and concurrent validity of the Microsoft Xbox One Kinect for assessment of standing balance and postural control. Gait Posture 2015, 42, 210–213. [Google Scholar] [CrossRef] [PubMed]
- Riolo, L. Attention contributes to functional reach test scores in older adults with history of falling. Phys. Occup. Ther. Geriatr. 2004, 22, 15–28. [Google Scholar] [CrossRef]
- Lovallo, C.; Rolandi, S.; Rossetti, A.M.; Lusignani, M. Accidental falls in hospital inpatients: Evaluation of sensitivity and specificity of two risk assessment tools. J. Adv. Nurs. 2010, 66, 690–696. [Google Scholar] [CrossRef]
- Jaume-i Capó, A.; Martínez-Bueso, P.; Moyà-Alcover, B.; Varona, J. Improving vision-based motor rehabilitation interactive systems for users with disabilities using mirror feedback. Sci. World J. 2014, 2014. [Google Scholar] [CrossRef]
- Kinect v2 Examples with MS-SDK and Nuitrack SDK. Available online: https://assetstore.unity.com/packages/3d/characters/kinect-v2-examples-with-ms-sdk-and-nuitrack-sdk-18708 (accessed on 25 April 2019).
- Shapiro, S.S.; Wilk, M.B. An analysis of variance test for normality (complete samples). Biometrika 1965, 52, 591–611. [Google Scholar] [CrossRef]
- Razali, N.M.; Wah, Y.B. Power comparisons of shapiro-wilk, kolmogorov-smirnov, lilliefors and anderson-darling tests. J. Stat. Model. Anal. 2011, 2, 21–33. [Google Scholar]
- Mukaka, M.M. A guide to appropriate use of correlation coefficient in medical research. Malawi Med. J. 2012, 24, 69–71. [Google Scholar] [PubMed]
- Shrout, P.E.; Fleiss, J.L. Intraclass correlations: Uses in assessing rater reliability. Psychol. Bull. 1979, 86, 420. [Google Scholar] [CrossRef] [PubMed]
- Koo, T.K.; Li, M.Y. A guideline of selecting and reporting intraclass correlation coefficients for reliability research. J. Chiropr. Med. 2016, 15, 155–163. [Google Scholar] [CrossRef]
- Venables, W.N.; Ripley, B.D. Modern Applied Statistics with S; Springer: Berlin/Heidelberg, Germany, 2002. [Google Scholar]
- Wang, Q.; Kurillo, G.; Ofli, F.; Bajcsy, R. Evaluation of pose tracking accuracy in the first and second generations of microsoft kinect. In Proceedings of the 2015 International Conference on Healthcare Informatics, Dallas, TX, USA, 21–23 October 2015; pp. 380–389. [Google Scholar]
- Wasenmüller, O.; Stricker, D. Comparison of kinect v1 and v2 depth images in terms of accuracy and precision. In Asian Conference on Computer Vision; Springer: Berlin/Heidelberg, Germany, 2016; pp. 34–45. [Google Scholar]
- Hsiao, M.Y.; Li, C.M.; Lu, I.S.; Lin, Y.H.; Wang, T.G.; Han, D.S. An investigation of the use of the Kinect system as a measure of dynamic balance and forward reach in the elderly. Clin. Rehabil. 2018, 32, 473–482. [Google Scholar] [CrossRef] [PubMed]
- Bennie, S.; Bruner, K.; Dizon, A.; Fritz, H.; Goodman, B.; Peterson, S. Measurements of balance: Comparison of the Timed” Up and Go” test and Functional Reach test with the Berg Balance Scale. J. Phys. Ther. Sci. 2003, 15, 93–97. [Google Scholar] [CrossRef]
- Tanaka, R.; Ishikawa, Y.; Yamasaki, T.; Diez, A. Accuracy of classifying the movement strategy in the functional reach test using a markerless motion capture system. J. Med. Eng. Technol. 2019, 43, 133–138. [Google Scholar] [CrossRef] [PubMed]
- Tedla, J.S.; Asiri, F.; Alshahrani, M.S.; Sangadala, D.R.; Gular, K.; Rengaramanujam, K.; Mukherjee, D. Reference values of functional and lateral reach test among the young Saudi population: Their psychometric properties and correlation with anthropometric parameters. Med. Sci. Monit. Int. Med. J. Exp. Clin. Res. 2019, 25, 5683. [Google Scholar] [CrossRef] [PubMed]
- de Waroquier-Leroy, L.; Bleuse, S.; Serafi, R.; Watelain, E.; Pardessus, V.; Tiffreau, A.V.; Thevenon, A. The Functional Reach Test: Strategies, performance and the influence of age. Ann. Phys. Rehabil. Med. 2014, 57, 452–464. [Google Scholar] [CrossRef]
- Tantisuwat, A.; Chamonchant, D.; Boonyong, S. Multi-directional reach test: An investigation of the limits of stability of people aged between 20 and 79 years. J. Phys. Ther. Sci. 2014, 26, 877–880. [Google Scholar] [CrossRef] [PubMed]
- Kage, H.; Okuda, M.; Nakamura, I.; Kunitsugu, I.; Sugiyama, S.; Hobara, T. Comparison of the one-arm and two-arm functional reach test in young adults. J. Phys. Ther. Sci. 2009, 21, 207–212. [Google Scholar] [CrossRef]
- Arrieta, A.B.; Díaz-Rodríguez, N.; Del Ser, J.; Bennetot, A.; Tabik, S.; Barbado, A.; García, S.; Gil-López, S.; Molina, D.; Benjamins, R.; et al. Explainable Artificial Intelligence (XAI): Concepts, taxonomies, opportunities and challenges toward responsible AI. Inf. Fusion 2020, 58, 82–115. [Google Scholar] [CrossRef]
Publisher’s Note: MDPI stays neutral with regard to jurisdictional claims in published maps and institutional affiliations. |
© 2021 by the authors. Licensee MDPI, Basel, Switzerland. This article is an open access article distributed under the terms and conditions of the Creative Commons Attribution (CC BY) license (https://creativecommons.org/licenses/by/4.0/).