Abstract
The linings of tunnels in cold regions with long service lives usually have cracks, with parts of the structure peeling and falling off, which seriously threatens the tunnel safety and operation. The unsaturated freeze–thaw cycle of concrete, which is the main cause of structural deterioration, has not received much research attention. During the service life of tunnels in cold regions, unsaturated freeze–thaw cycles deteriorate the quality of the concrete, and its degree presents a gradual distribution in the circumferential and longitudinal directions. An experiment system was adopted to simulate the distribution of the progressive deterioration of tunnel lining concrete. The test results of the temperature field of the model show the distribution law of freeze–thaw cycles, and the gradual deterioration of the lining concrete was realized. Then, the bearing capacity of the model was tested after the progressive deterioration. The results show that the ultimate load of the model decreases with an increase in the number of freeze–thaw cycles. Finally, a numerical simulation was carried out to discuss the influence of the gradual deterioration of the lining. The gradual deterioration of lining concrete will encourage the gradual development of cracks, leading to serious cracking of the lining structure and even block spalling. Through this study, we hope to provide useful information for the prevention and control of tunnel frost damage in cold regions.
1. Introduction
In recent years, more and more tunnels in high-altitude and high-latitude areas have been constructed in China, thus the problem of frost damage in old tunnels in cold regions is becoming more and more prominent [1]. Apart from icing problems, several tunnels with a service life of more than 10 years have demonstrated the phenomena of serious cracking of the lining, brittle lining, partial peeling, and falling off near the portal [2]. In contrast to the problem of icing in tunnels, the deterioration of the lining concrete affects the bearing structure, which will seriously threaten the safety of the tunnel structure. Additionally, the problem of the lining blocks falling off will have an even more serious impact on traffic safety than will the falling of ice. Therefore, it is very important to research the rules and influence of tunnel lining material deterioration in cold areas to increase our knowledge of maintenance and operation safety.
At present, research on the frost damage of tunnels in cold regions mainly focuses on the temperature field of the tunnel and the influence of frost damage. The analytical calculation method, model experiments, and in situ tests are the main methods used in these studies. A series of analytical solutions considering different boundary conditions, different parameters, and different models were carried out to study the frost heaving force in cold-region tunnels. Based on the initial elastic state of the surrounding rock, a semi-analytical method to calculate the stress in the plastic was proposed [3]. Then, the entire surrounding rock was divided into four zones: the unfrozen elastic zone, the frozen elastic zone, the frozen plastic zone, and the support zone. In addition, a more complicated elastoplastic calculation model for the surrounding rock in cold-region tunnels was established [4]. Meanwhile, based on the stochastic analysis model and the stochastic finite element method, the stochastic mechanical characteristics of tunnels in cold regions were investigated [5]. Furthermore, an analytical elastoplastic solution for frost heaving force was recently proposed, in which an anisotropic frost heave coefficient, k, was introduced to consider transversely isotropic frost heaving [6]. Then, a novel noncircular solution for frost heaving force was established and verified using the example of the Zhegu Mountain tunnel [7]. Additionally, aiming at the prediction of crack initiation and propagation in brittle materials, an efficient parameter estimation framework was proposed, involving a step-wise Bayesian inversion framework for ductile fractures to provide accurate knowledge regarding the effective mechanical parameters [8,9]. These numerical calculation methods for the frost heaving force of tunnels include comprehensive explanations and support for the topic of freezing damage and prevention in cold-region tunnels.
On the other hand, the analytical calculation and model test were carried out to study the distribution laws and factors of the tunnel temperature field. Based on the analytical results of the temperature field in the cross-section and the longitudinal direction of tunnels [10,11], a three-dimensional analytical model of the temperature field was proposed [12]. The result show that the freezing length reduced from 143 m to 70 m and the maximum radial freezing depth at the entrance is also shortened from 4.7 m to 2.4 m due to a 5 cm insulation layer. The analytical calculation of the temperature field in the tunnel has achieved a comprehensive research result. However, their analytical calculation models took the temperature function over a period of one year as the boundary condition, but the influence of daily periodic temperature change on freezing length and freezing depth was ignored. As a result, the deterioration of lining structure subjected to daily freeze–thaw cycles was ignored. Additionally, model tests to evaluate the reliability of a 5 cm-thick insulation layer were developed [13], and a mathematical optimization model of the insulation layer’s parameters was constructed by taking the Daban mountain tunnel as an example [14]. This extends the distribution laws and factors of the tunnel temperature field of tunnels with insulation layers.
Further, the temperature distribution of some cold-region tunnels was measured by advanced equipment and methods in 104 tunnels located in Gangwon Province of Korea [15] and the Hongfu tunnel [16], the Zuomutai tunnel [17], and the Wushaoling tunnel [18] in China. Their test results were in agreement that the air temperature in the tunnel changes periodically in the form of an approximate trigonometric function from the annual perspective. The temperature of the tunnel portal section is affected by the outside of the tunnel, and the influence of the middle section is small, which shows that the temperature fluctuation of the portal section is large and the temperature fluctuation of the middle section is small. The temperature changes in the sections at the two sides of the tunnel are different, and the temperature distributions are asymmetrical along the tunnel length. The test results of the temperature field distribution provide practical verification and theoretical support for the further understanding of the mechanism and reasonable design of tunnel frost damage. Lately, the distribution laws of daily freeze–thaw cycles in tunnels were studied [19], and it was revealed that unsaturated freeze–thaw cycles will also damage the strength and durability of concrete cube. This again draws researchers’ attention to the deterioration of the lining structure. However, the influence of concrete deterioration on the stress and crack of lining structure has not been studied further in cold region tunnels.
In this paper, based on the analysis of the service environment and distribution of freeze–thaw cycles in cold-region tunnels, the rule of the gradual deterioration of the lining structure was proposed. An experimental system was established to simulate the deterioration of the lining structure of cold-region tunnels; it was composed of a circular tunnel models, a cold air circulation system, and a temperature test system. The initial deterioration of the lining concrete was realized after 100 unsaturated freeze–thaw cycles took place, and the temperature field of the experimental model was tested during the freeze–thaw cycles. The bearing capacity and strain of the lining models were tested. Lastly, the influence of the deterioration of the lining structure on the service tunnels was discussed in the hope of providing support for the maintenance and design of tunnels in cold regions.
2. Influence of Freeze–Thaw Cycle on Tunnels
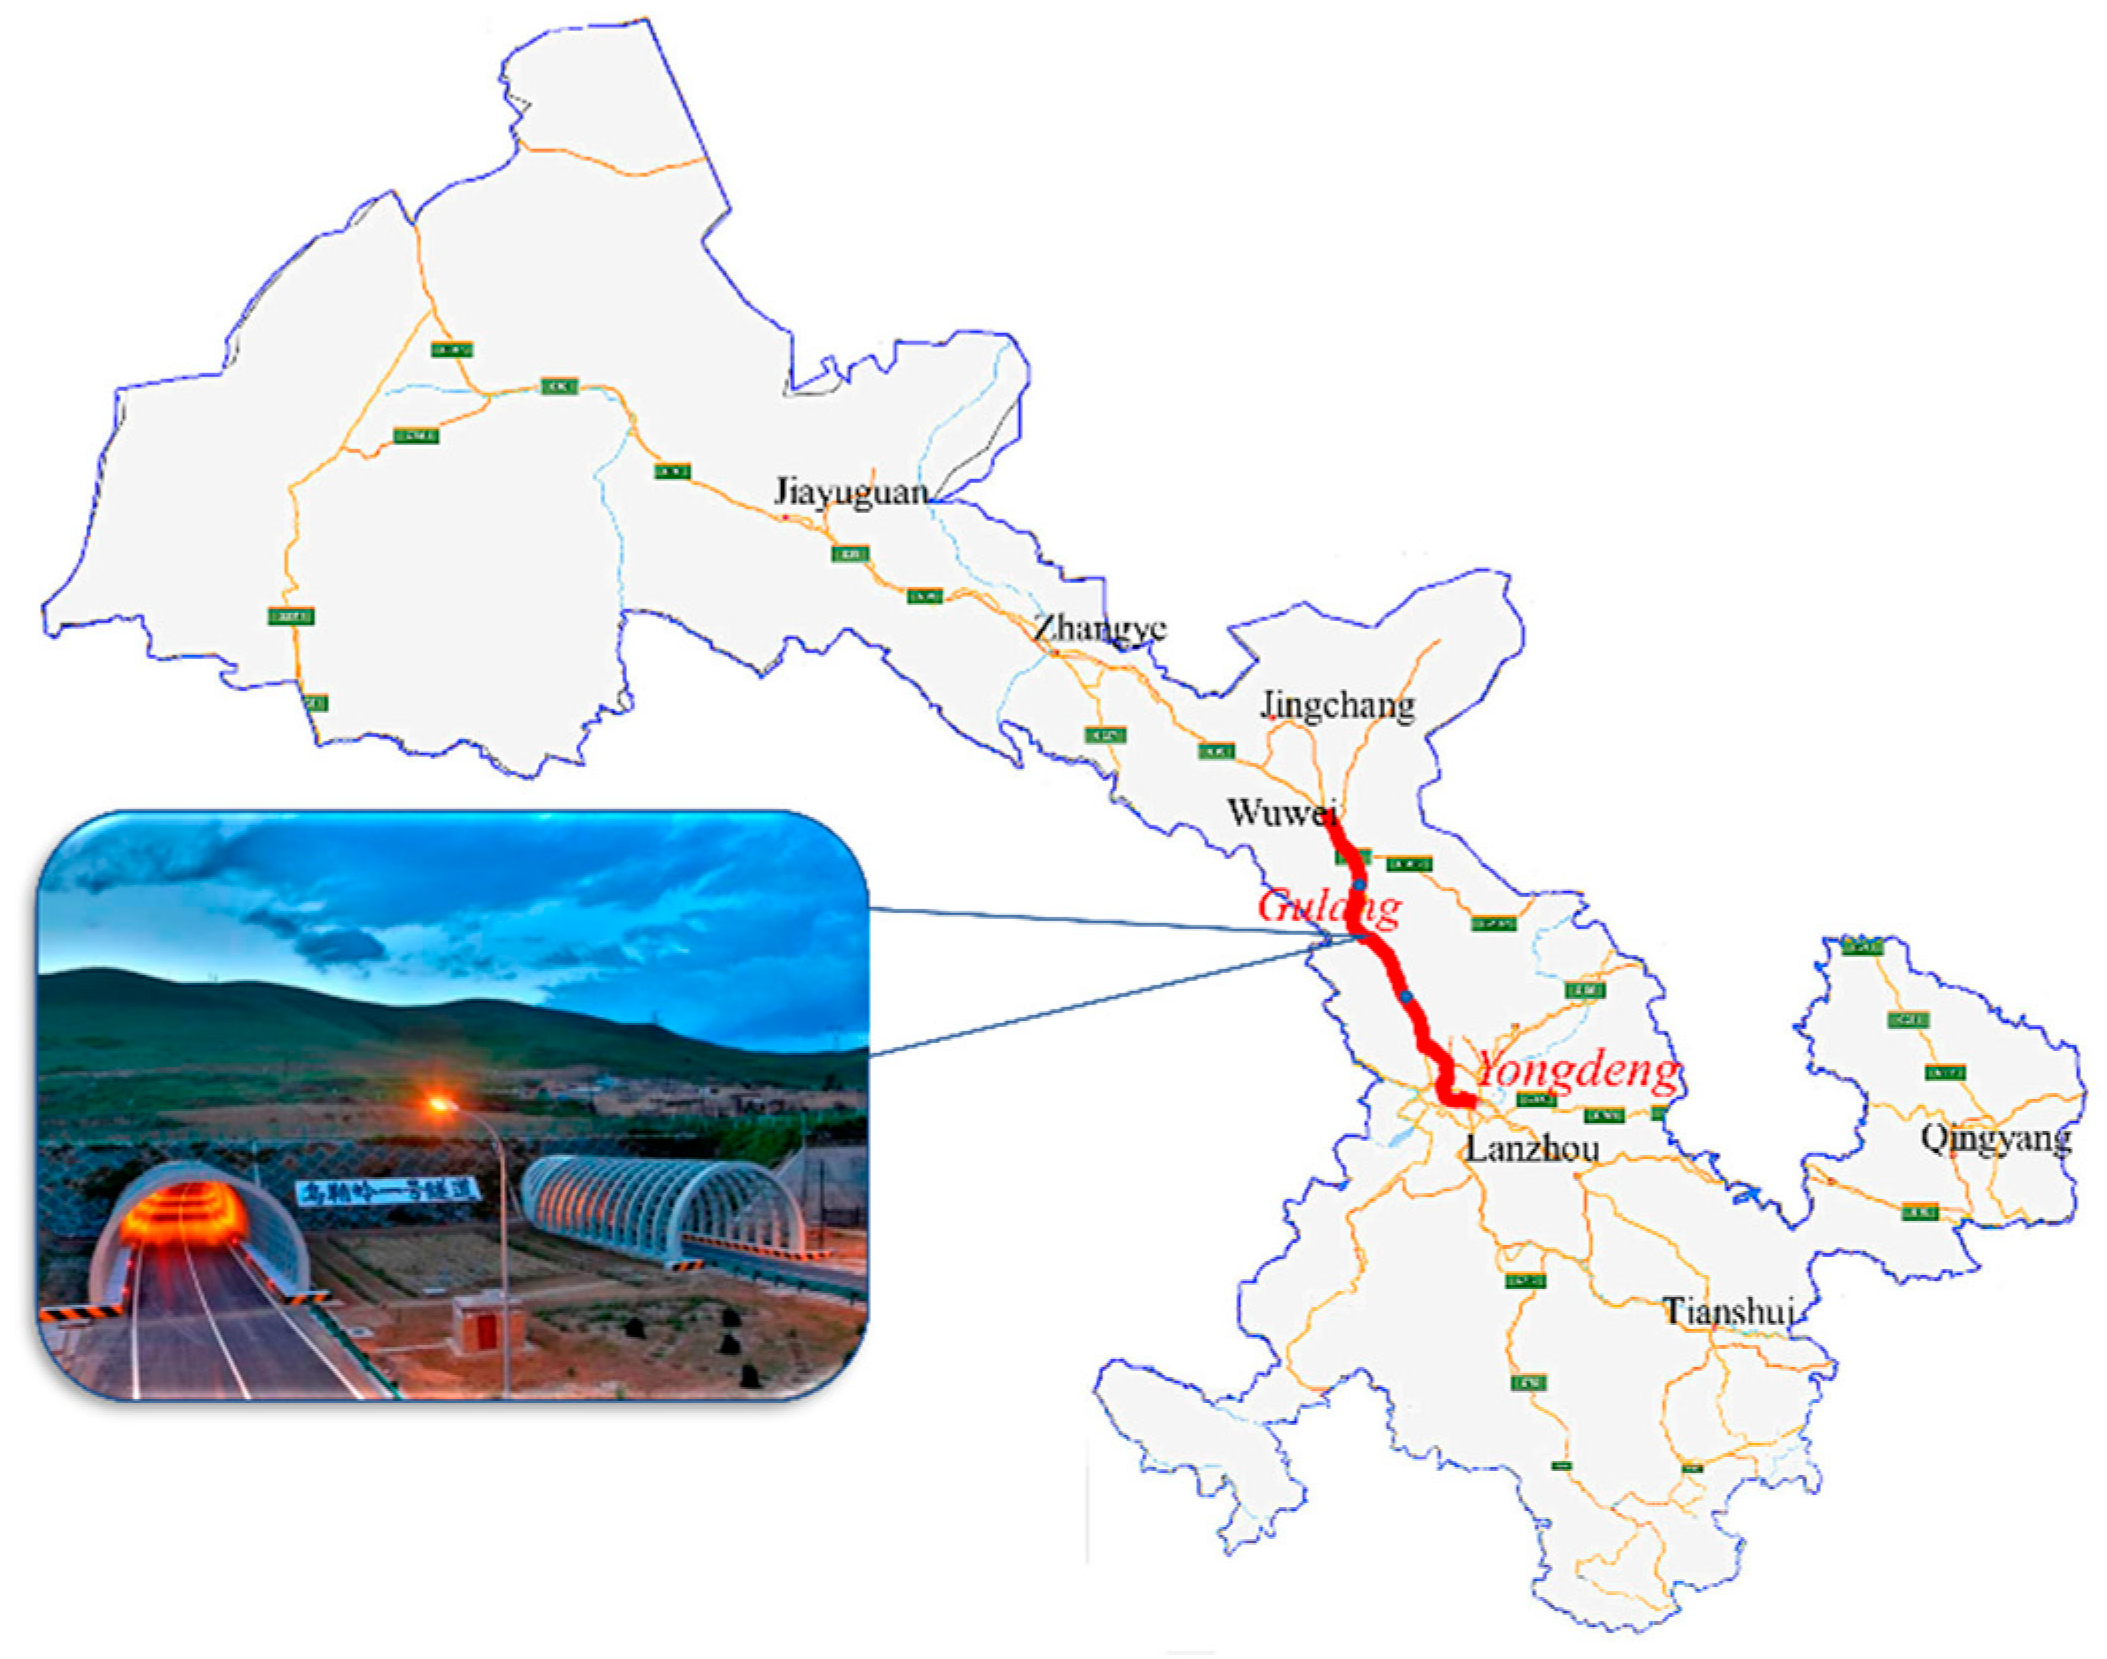
The tunnel temperature field test was carried out on the Wushaoling Tunnel Group in Yongdeng on the Gulang expressway (G30). The tunnel group is located in the north branch of Qilian Mountain, at an altitude of 2085–3050 m. The annual minimum temperature in this area is −24 °C, and the icing period is from November to March. The location of the tunnel group is shown in Figure 1. The Wushaoling Tunnel Group uses the construction standard of two-way separated tunnels and a design speed of 60 km/h. The tunnel group is composed of five tunnels, and three tunnels with different lengths were selected for evaluation in this study. Tunnel No. 1 is 4905 m long, tunnel No. 3 is 875 m long, and tunnel No. 5 is 2936 m long. An intelligent temperature recorder was used to test the temperature field of the tunnel. The layout of the test section is shown in Figure 2. The sensor of the recorder was tightly attached to the lining surface, about 2.5 m from the arch foot, usually on the sidewall on the right side of the driving direction. The sampling interval of the test was 1 h. Through the temperature field test, we obtained the longitudinal distribution of the freeze–thaw cycles in the tunnels.
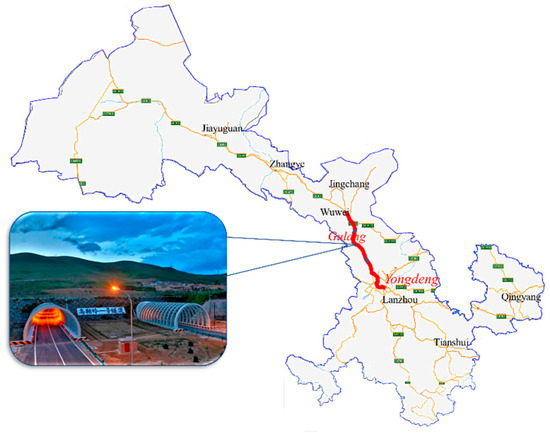
Figure 1.
The location of the Wushaoling tunnel groups.
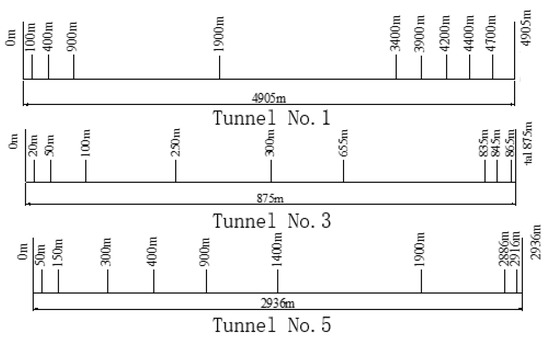
Figure 2.
Layout of the test section.
2.1. Distribution Law of Freeze–Thaw Cycle in the Longitudinal Direction of the Tunnel
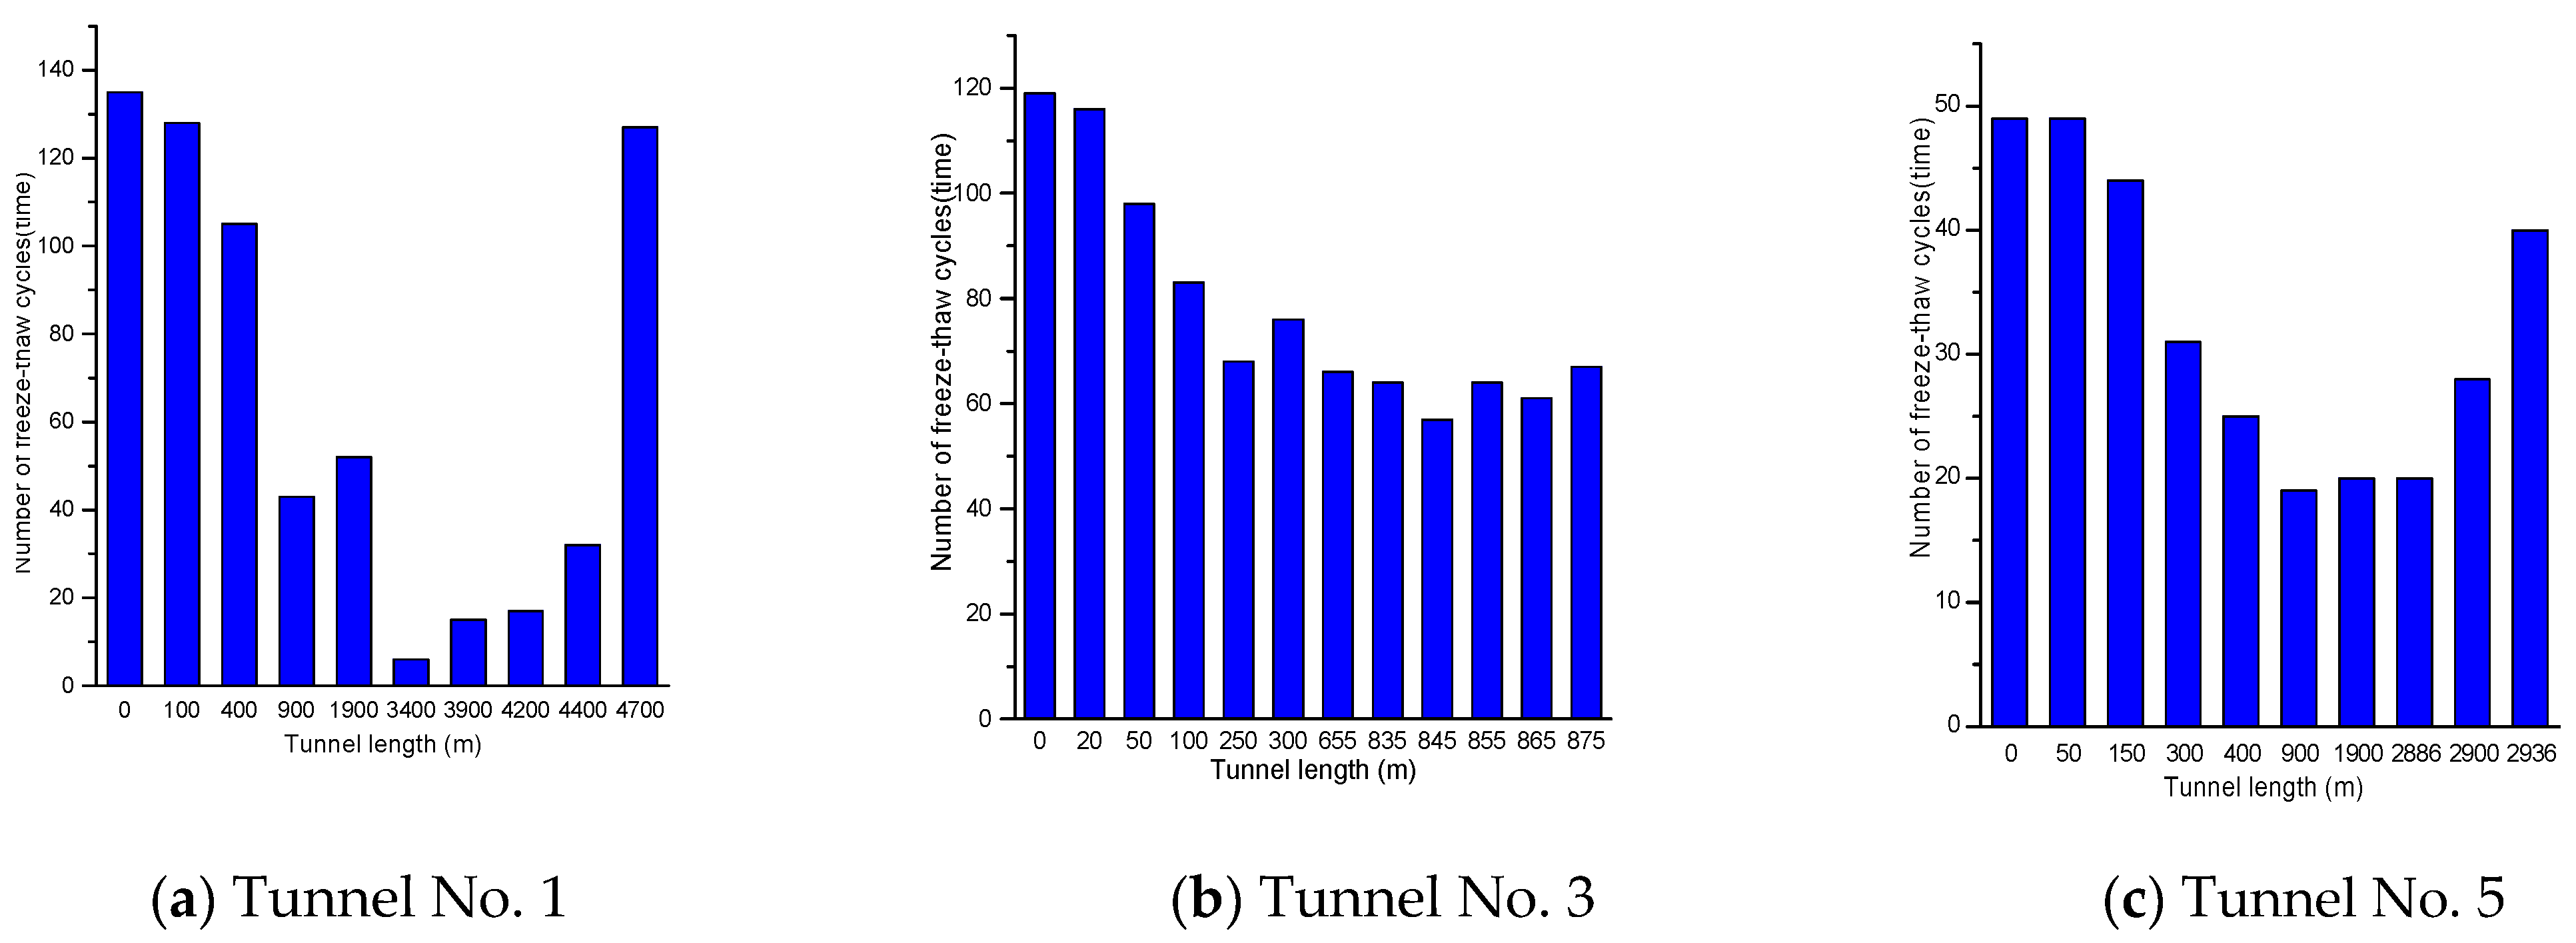
The results show that freeze–thaw cycles occurred uniformly in medium-length highway tunnels. Additionally, there were obvious differences in the number of freeze–thaw cycles taking place in extra-long tunnels, which could occur hundreds of times at the tunnel entrance and only six times in the middle of the tunnel. The number of freeze–thaw processes occurring on the surface of the lining is shown in Figure 3. For tunnel No. 1, which is longer than 4500 m, freeze–thaw cycles occurred six times at 3400 m, which was one twentieth of the amount of cycles occurring at the entrance. For tunnel No. 3, which is no more than 1000 m, the numbers did not change much with the increase in length. Most parts are subjected to around 60 freeze–thaw cycles; this is a relatively stable stage. For tunnel No. 5, the freeze–thaw cycles gradually declined to a low level and then climbed to the previous level. Overall, we found that the lining near the portal section could experience thousands or even tens of thousands of freeze–thaw cycles in its design life. The damage caused by undergoing a large number of freeze–thaw cycles cannot be ignored.
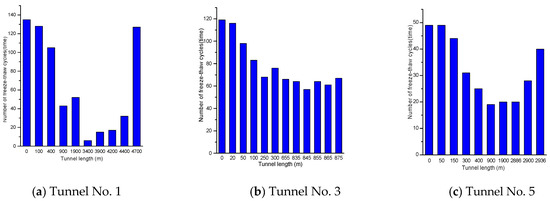
Figure 3.
The number of daily freeze–thaw cycles in tunnels.
2.2. Distribution Law of Freeze–Thaw Cycle in Cross-Section
The continuous measurement results of the temperature field show that the daily period temperature fluctuation caused by day–night alternation is very significant and widespread. The distribution law of the freeze–thaw cycles in the tunnel cross-section was initially studied by numerical simulation; the model is shown in Figure 4a. A composite equation with annual and daily periodic temperature variations was adopted as the temperature load on the lining surface, as shown in Formula (1) [18].
where t is time, by the hour; Tb is the daily amplitude of temperature (°C); T1 is the annual period of temperature change, which is recommended to be 8640 h; T2 is a daily period of temperature change; is the annual initial phase; and is the daily initial phase. The numerical simulation result showed that the number of freeze–thaw cycles taking place at different radial depths of the tunnel secondary lining are different, as shown in Figure 4b. It decreases rapidly with the increase in radial depth. When the number of freeze–thaw cycles on the tunnel lining surface reaches 140, the number of freeze–thaw cycles at the radial depth of 5 cm can reach 80, and it can reach 50 at the radial depth of 10 cm. The tunnel lining concrete suffers different freeze–thaw cycles at different radial depths, which also inevitably leads to the different deterioration of the concrete strength at different radial depths.
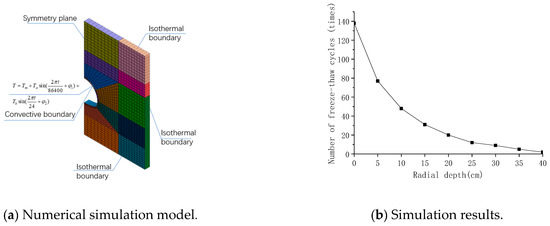
Figure 4.
Freeze–thaw cycles of the lining.
2.3. Deterioration of Tunnel Lining Concrete
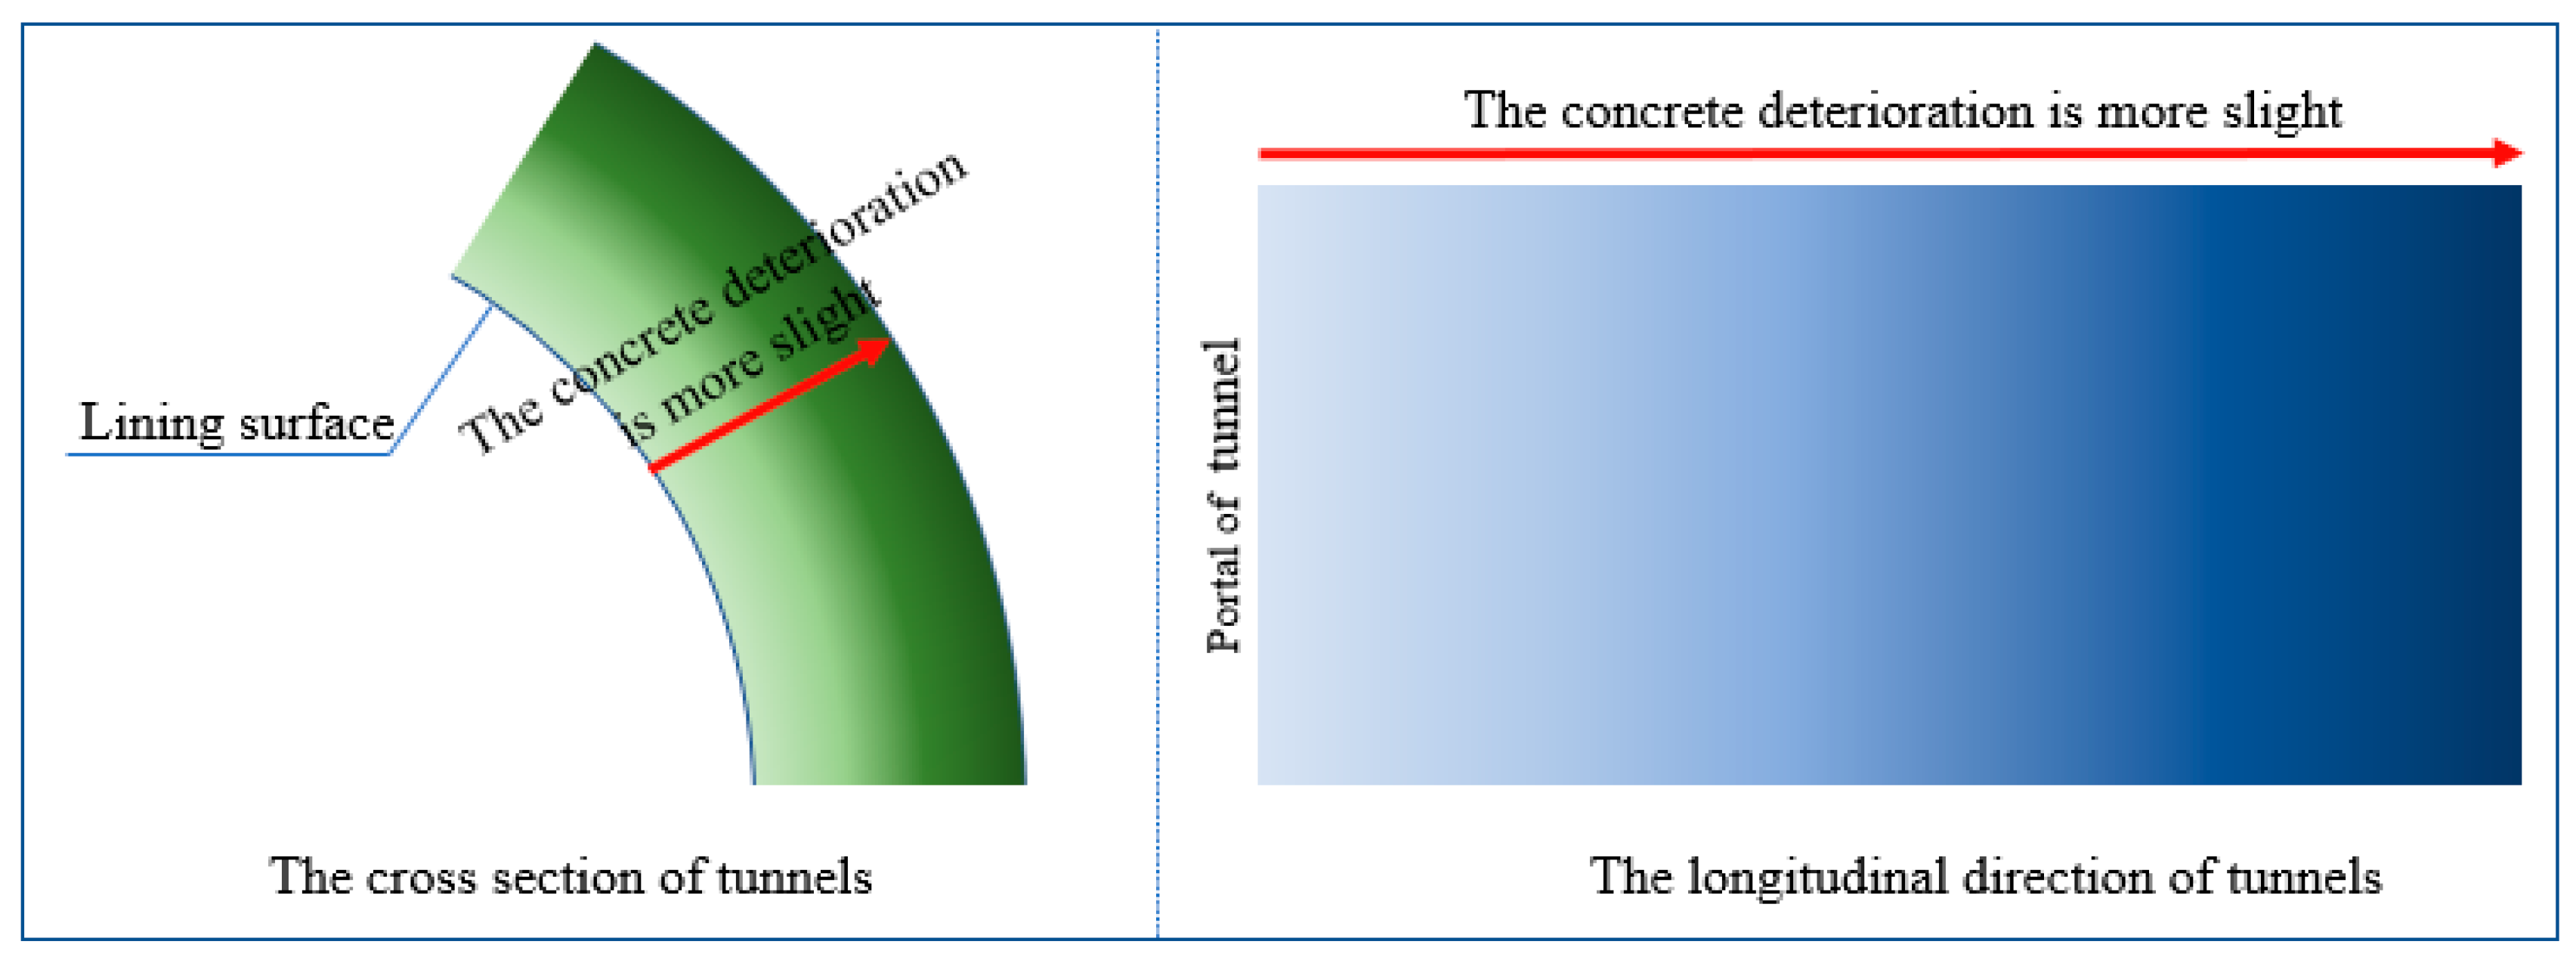
In fact, tunnel lining concrete is in an unsaturated state in service, and concrete would be subjected to tens of thousands of unsaturated freeze–thaw cycles, which inevitably leads to the deterioration of the lining concrete material [19]. The number of unsaturated freeze–thaw cycles varies gradually in the longitudinal direction, and in the cross-section of the tunnel, which leads to the deterioration of concrete, showing a gradual distribution related to the number of freeze–thaw cycles taking place. A schematic diagram of the progressive deterioration of tunnel lining concrete in cold regions is shown in Figure 5.
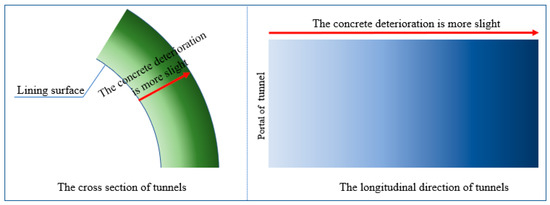
Figure 5.
Deterioration rules of tunnel lining concrete.
In the cross-section of the tunnel, the number of unsaturated freeze–thaw cycles experienced by the lining surface is the greatest, and the deterioration degree is most serious. With the increase in radial depth, the number of freeze–thaw cycles decreases and the deterioration degree of the lining is more slight. Similarly, the number of freeze–thaw cycles decreases in the longitudinal direction of the tunnel from the tunnel portal, with the degree of deterioration of the lining becoming gradually lighter from the tunnel portal. What kind of influence will this have on the lining structure? In the following section, we will study this through a model test.
3. Experiment Method and System
3.1. Experiment Mothed and Model
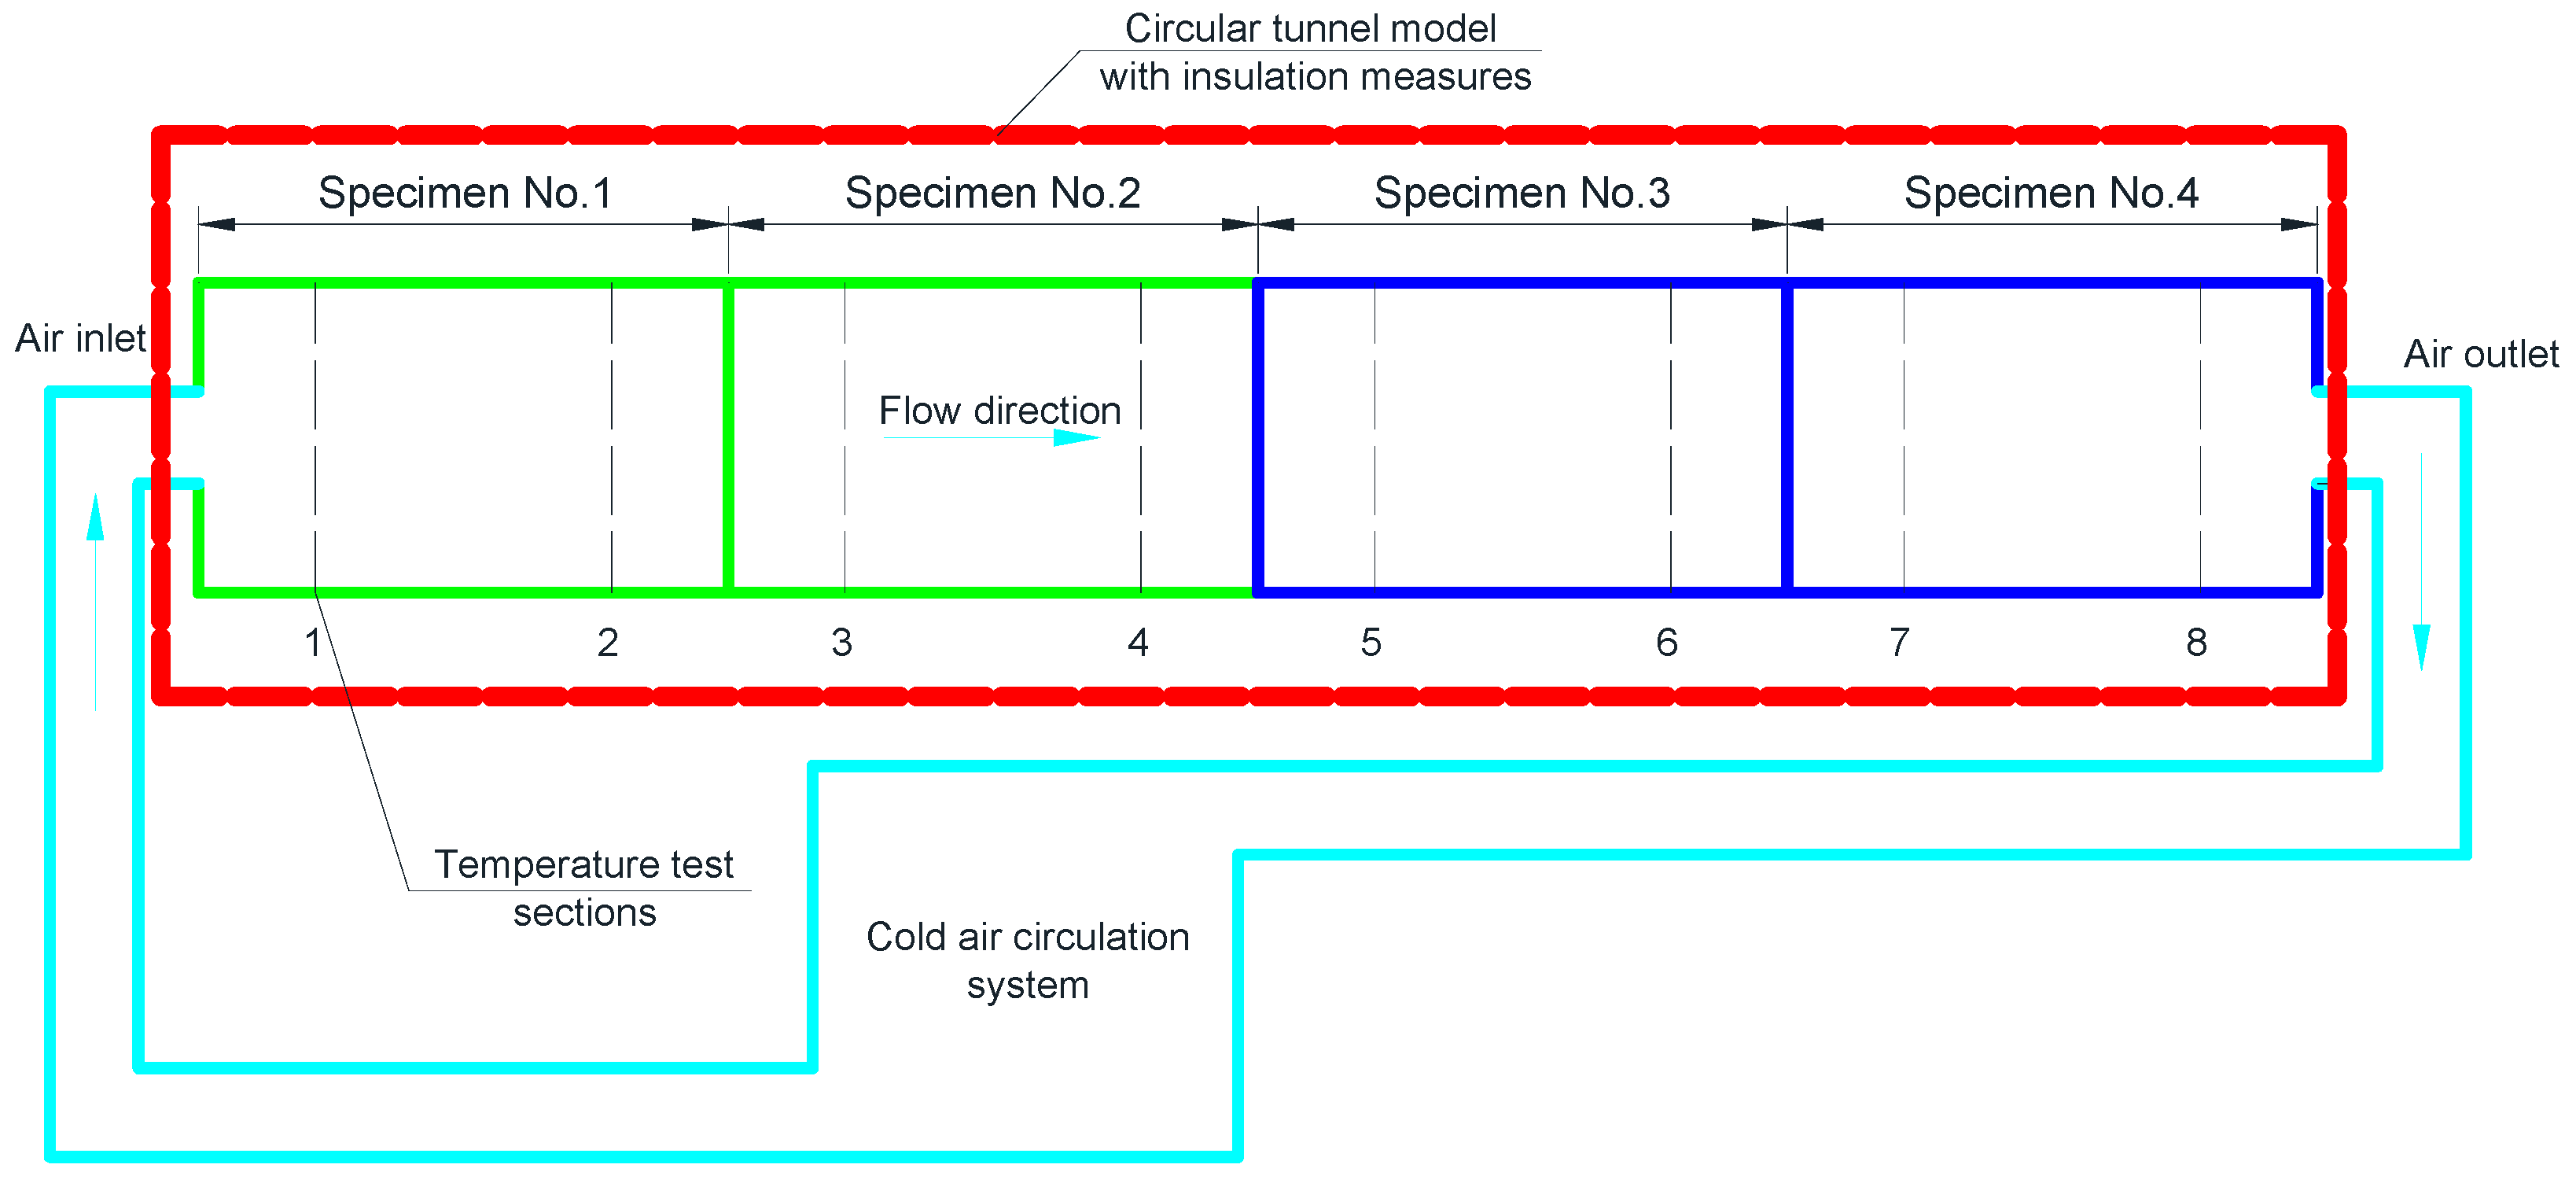
The purpose of this test is firstly to deteriorate tunnel lining concrete in a freeze–thaw system. By applying air with alternating positive and negative temperatures on the inner surface of the concrete lining specimen, the specimen will suffer different numbers of freeze–thaw cycles in the cross-section and longitudinal direction. The bearing capacity of the weakened specimen will then be tested to study the effect of the progressive deterioration of the structure. The freeze–thaw system is composed of circular tunnel specimens, a cold air circulation system, and a temperature test system, as shown in Figure 6.
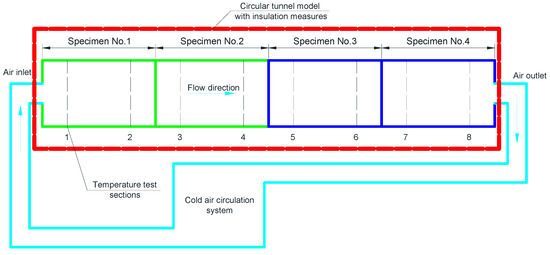
Figure 6.
The experiment system.
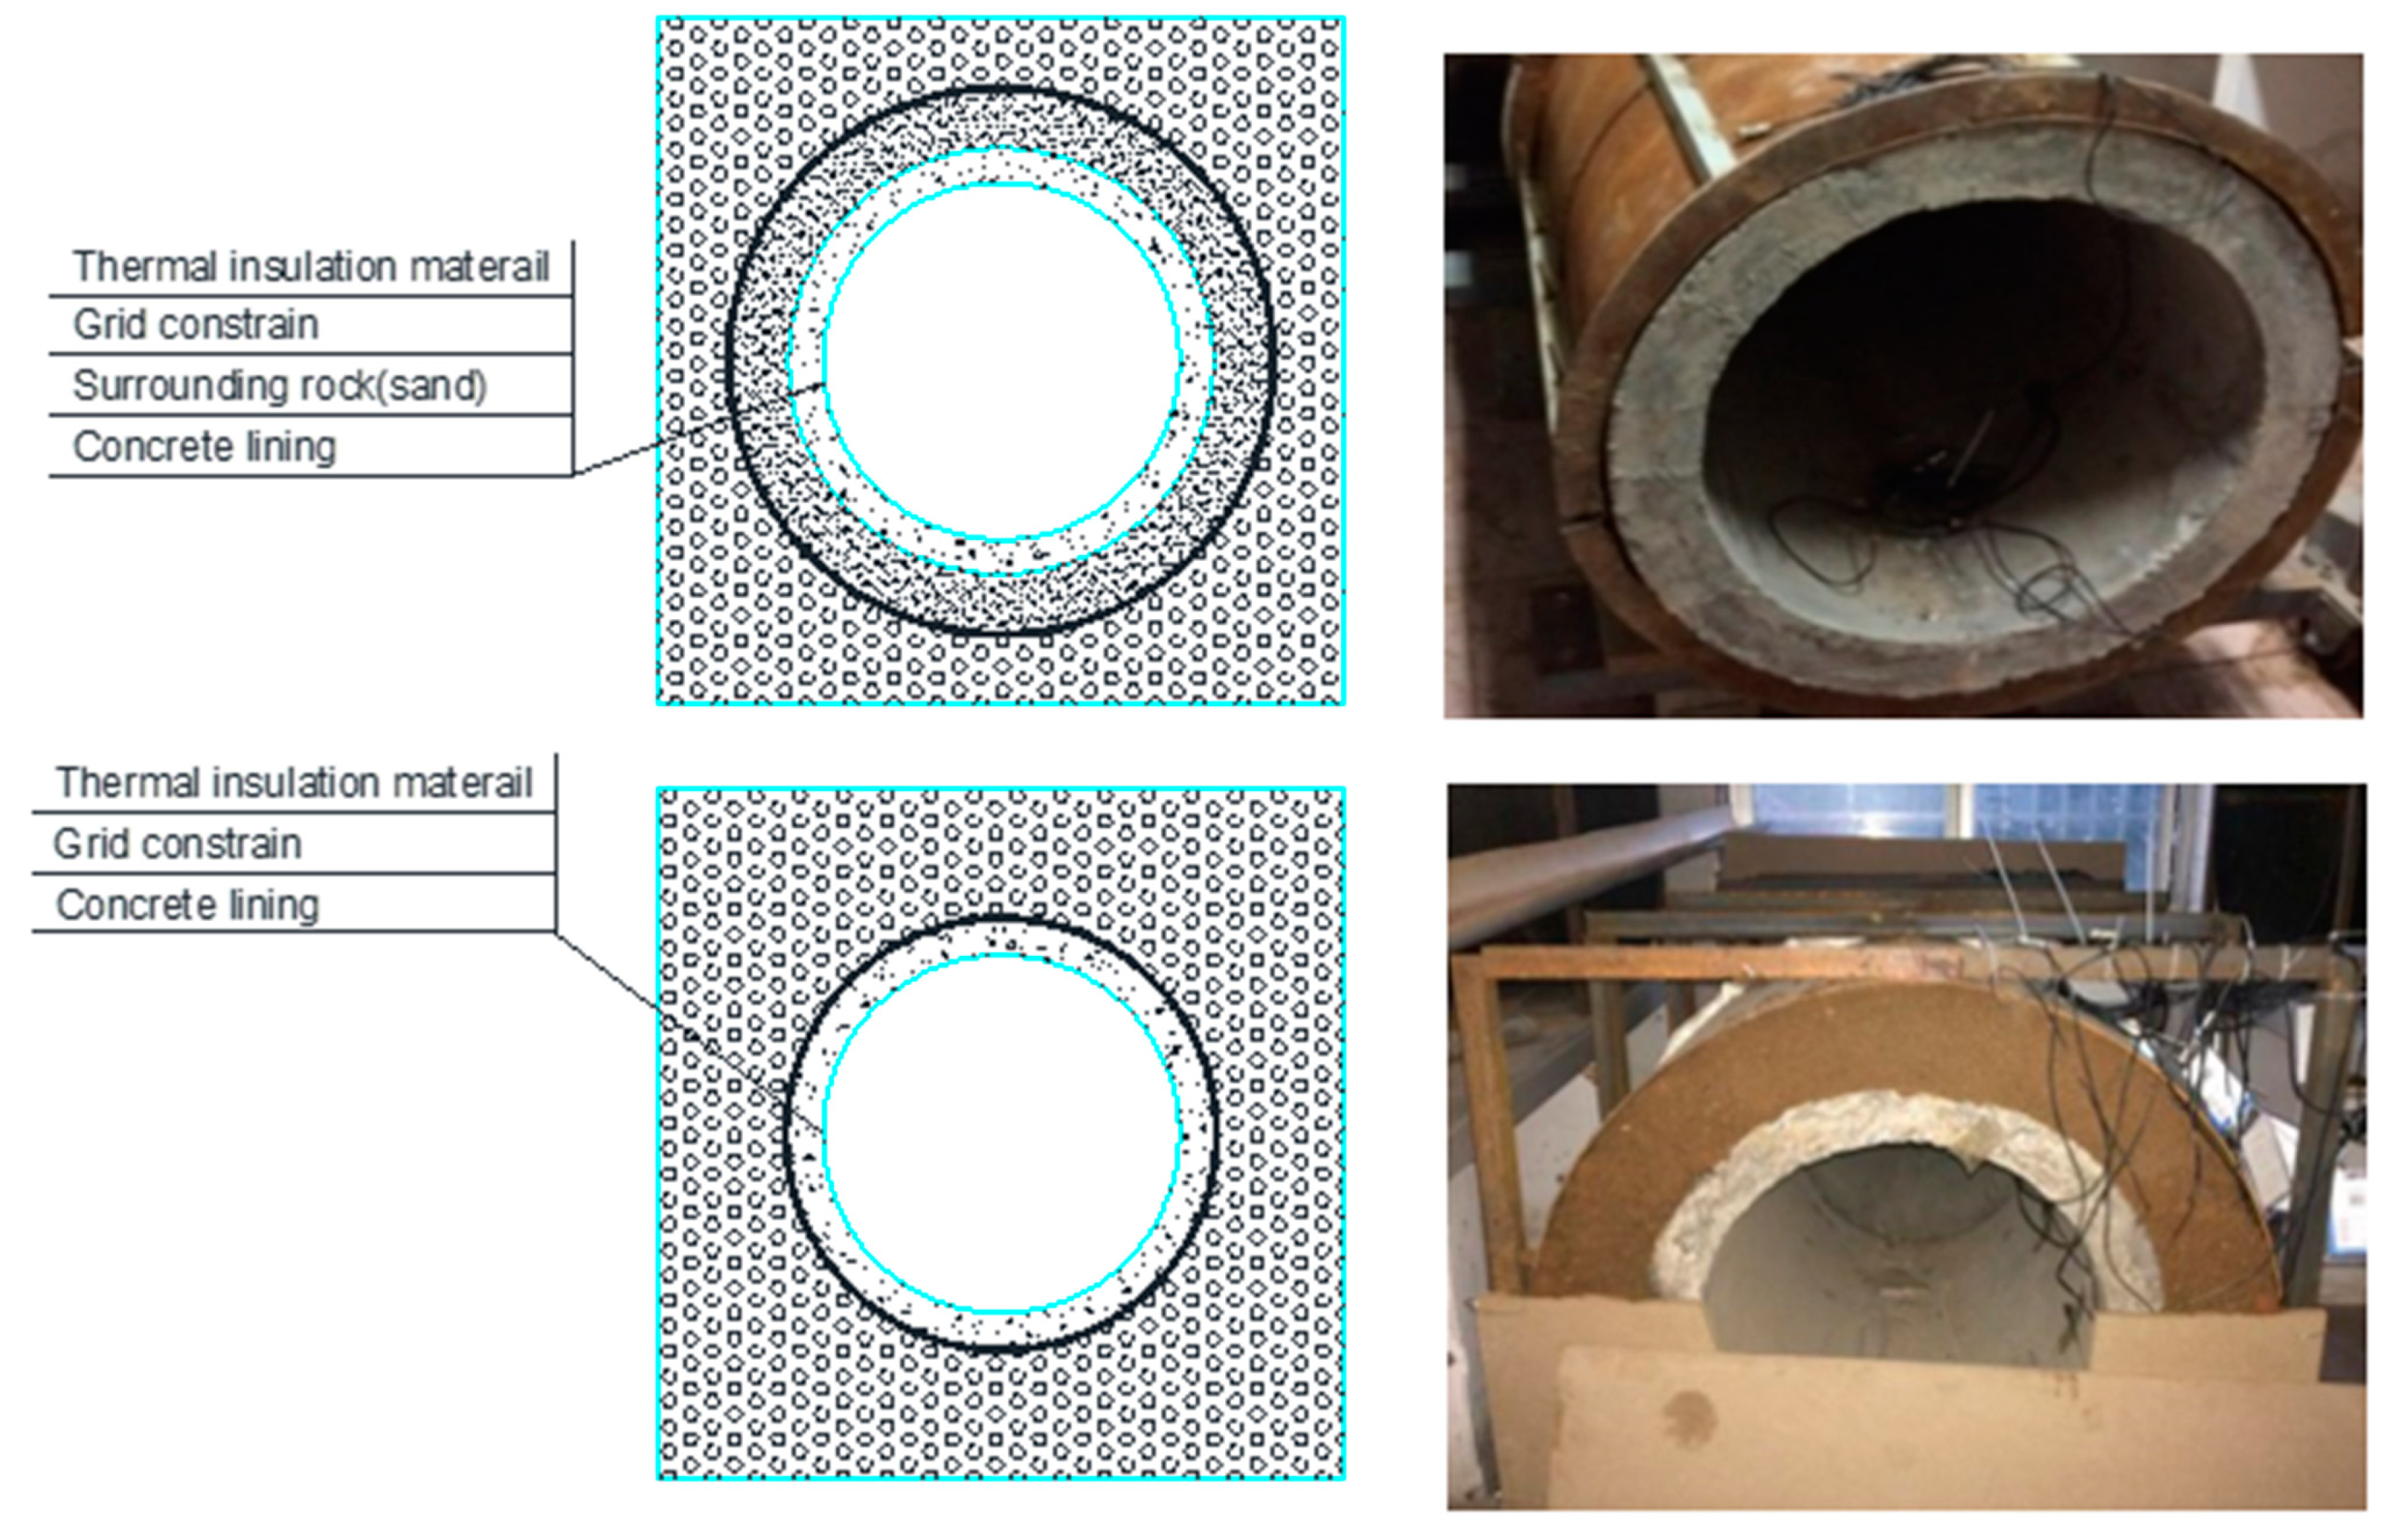
Four concrete specimens were connected in series, and cold air was flowed through them in turn. The two specimens close to the air inlet (Specimens No. 1 and No. 2) were similar to the tunnel lining near the portal, while the two specimens close to the air outlet (Specimens No. 3 and No. 4) were similar to the tunnel lining in the middle section. Additionally, another two pieces of the concrete model that did not undergo freeze–thaw cycles were taken as a control group. The two specimens close to the air inlet were constrained by a steel drum; the steel drum was wrapped in thermal insulation material. The two specimens close to the air outlet were surrounded by dense fine sand; the sand was restrained by steel drums, and the steel drum was wrapped in the same thermal insulation material (Figure 7). The specimen was 1 m long, 0.075 m thick, and 1 m in outer diameter. The cement used to make the specimen was PO 42.5 river sand with a fineness modulus of 2.3 and gravel particles sizes ranging from 5 to 20 mm. The water–binder (W/B) ratio was 0.36, and the proportion of cement, sand, and gravel was 1:2.56:3.85.
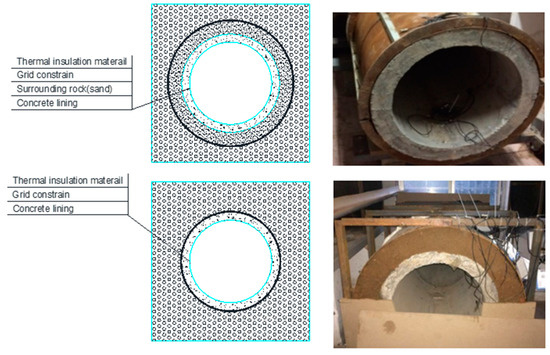
Figure 7.
Constraint conditions of the lining of the simulation experiment.
3.2. Cold Air Circulation System
The cold air circulation system included an intelligent temperature control system. To closely simulate the working environment of tunnel lining concrete, the freeze–thaw cycle experiment used 11 h as a single cycle. Firstly, the temperature in the circulatory system was reduced to −20 °C over 1 h, then this was maintained for 7 h. Secondly, the temperature in the system was increased to 30 °C over 1 h, then the temperature was maintained there for 2 h. Then the temperature in the circulatory system was reduced to −20 °C over 1 h again.
3.3. Temperature Test System
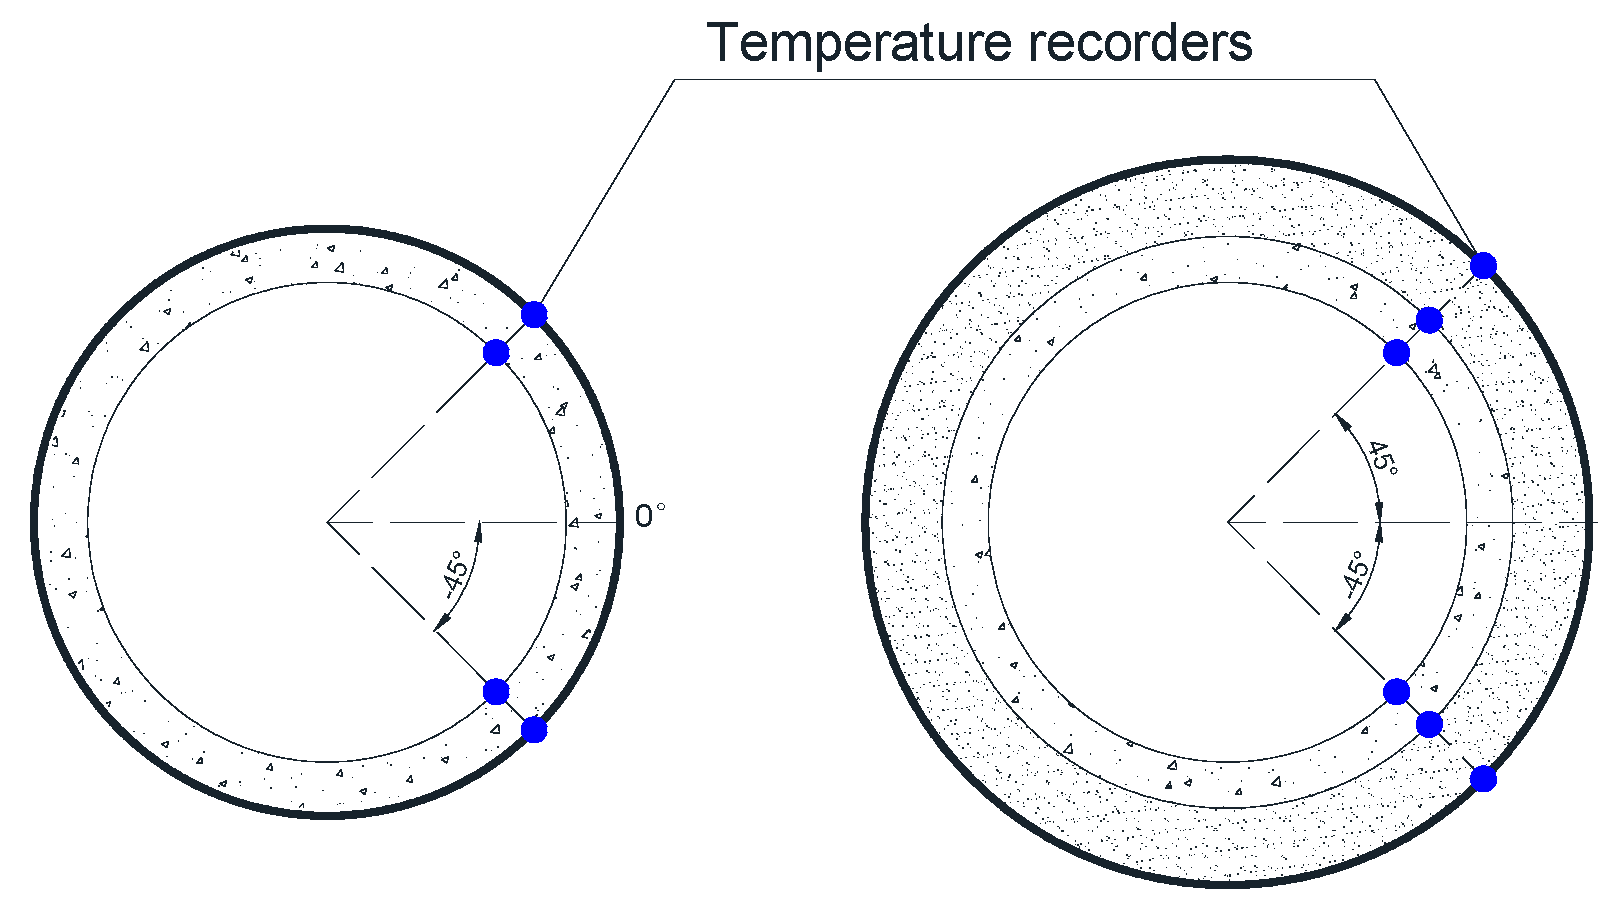
In the temperature monitoring system, we used a low-temperature intelligent automatic recorder [16]. The recorder’s sampling interval was 1 h and its measurement accuracy was 0.1 °C. High performance lithium batteries were set inside, which guaranteed that the recorder would work for 5 months. Eight test sections were arranged in the model test (Figure 6). Four records were set on the lining surface of the model and on the same position behind the lining in Sections 1–4; one pair was placed at the waist of the arch and another was placed at the foot of the arch. In total, there were six records in Sections 5–8, all placed on the lining surface of the model, in the same position behind the lining, and in the surrounding rock. In the experiment, the temperature data were measured every 10 min. The layout of the temperature recorder is shown in Figure 8.
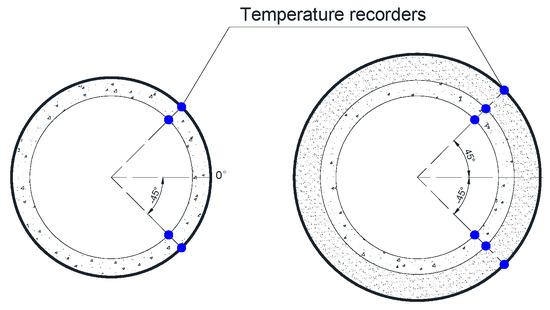
Figure 8.
Layout of the temperature recorder.
3.4. Bearing Capacity and Strain Test
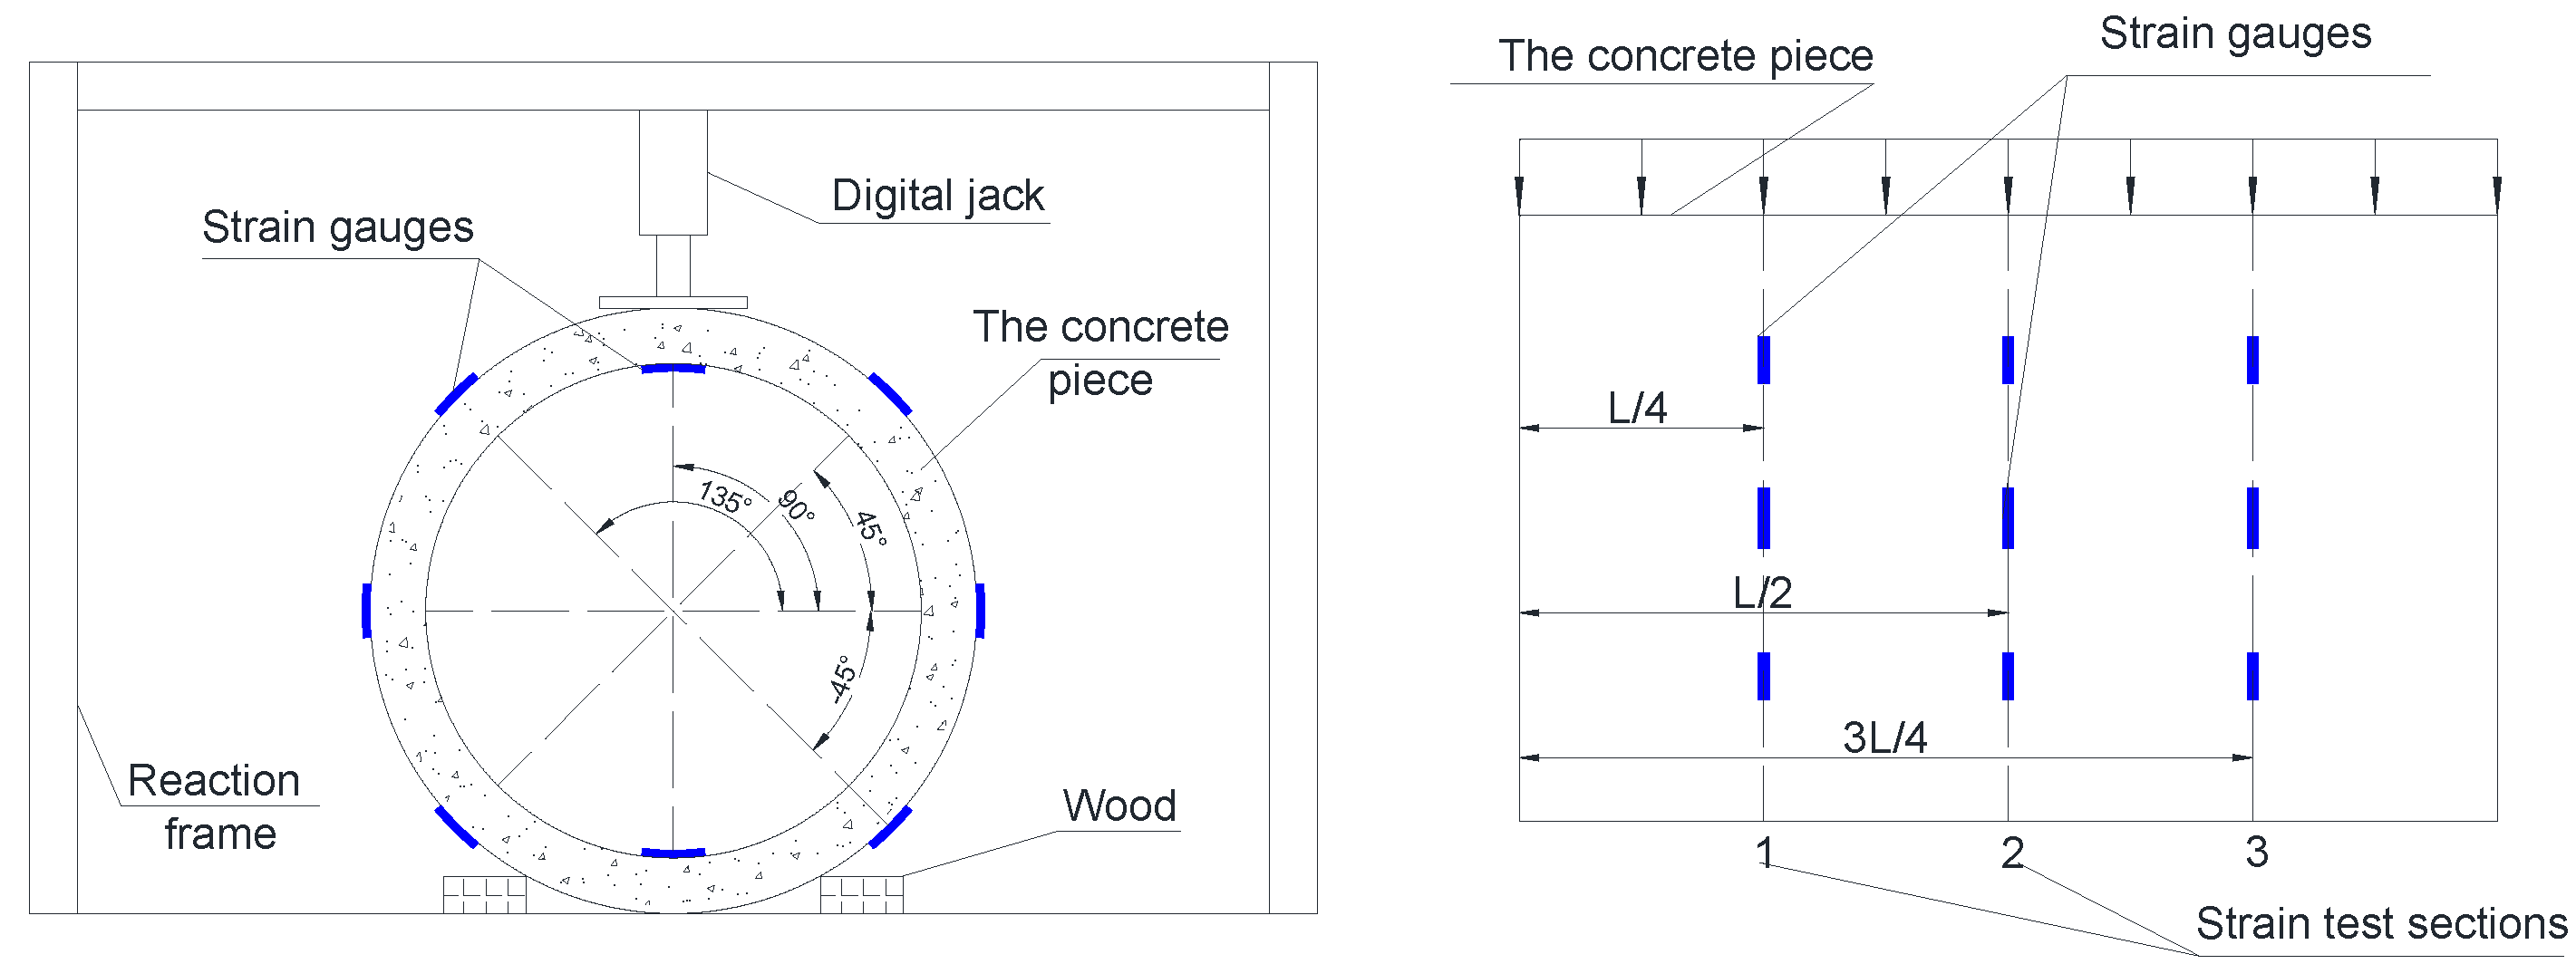
After 100 occurrences of unsaturated freeze–thaw cycles, the bearing capacity and strain of the lining models were tested. The loading method and measurement systems are shown in Figure 9.
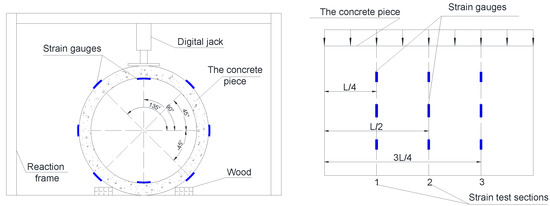
Figure 9.
The test loading method.
The Bx120-100aa-type strain gauge was selected, which has a length more than five times the particle size of coarse aggregate. A 3-axis 45° strain rosette was adopted, and the two vertical axes of the strain rosettes were in the same direction as the longitudinal and transverse directions of the specimens. The positions of the strain rosettes are shown in Figure 9. Three sections, which were 1/4, 1/2, and 3/4 of the length of the specimen, were set for the measurement of strains. Additionally, the rosette gauge was attached to the inner surface of the vault and the bottom and outer face at 0°, 45°, 135°, 180°, 225°, and 315° in the cross-section. The test pieces were loaded with 10 kN for each stage and kept there for 10 min until the load was more than 30 kN. Then, the test piece was loaded with 5 kN for each stage until failure. Using the 1/4 bridge method, the strain of each strain gauge was recorded after temperature compensation.
4. Distribution of Temperature Field of the Model
4.1. Longitudinal Distribution of Temperature Field
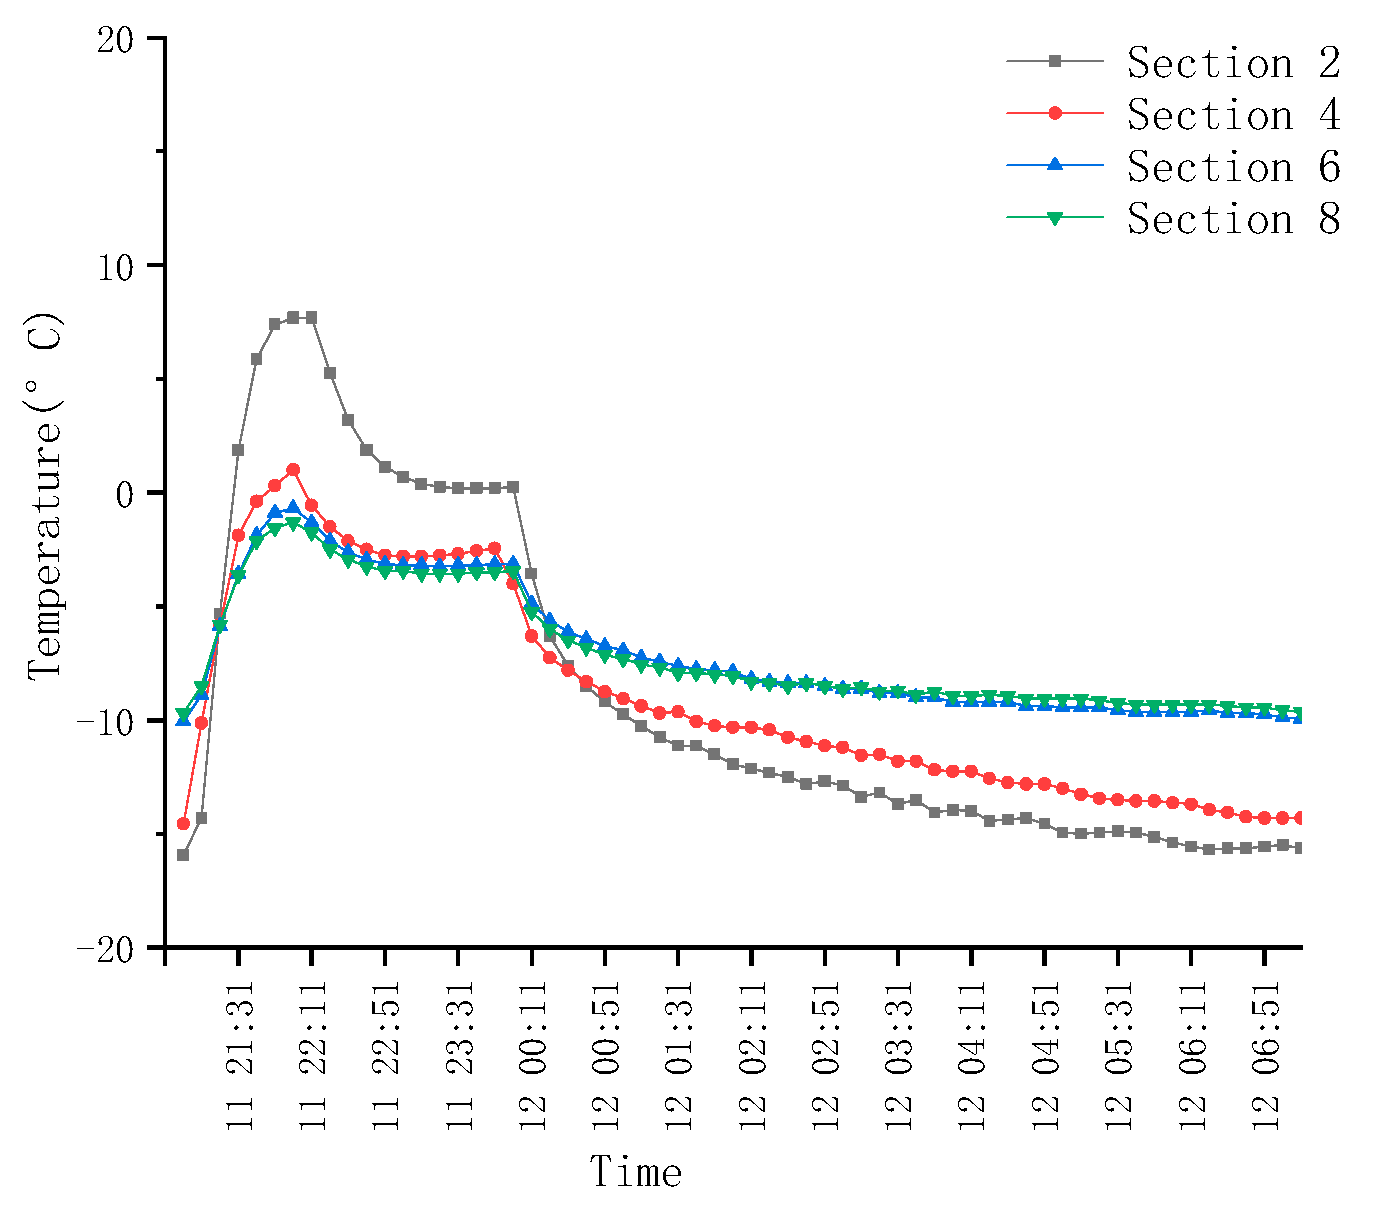
In the process of the simulation experiment, the temperature field of the model was obtained. The lining surface temperatures of Sections 2, 4, 6 and 8 are shown in Figure 10.
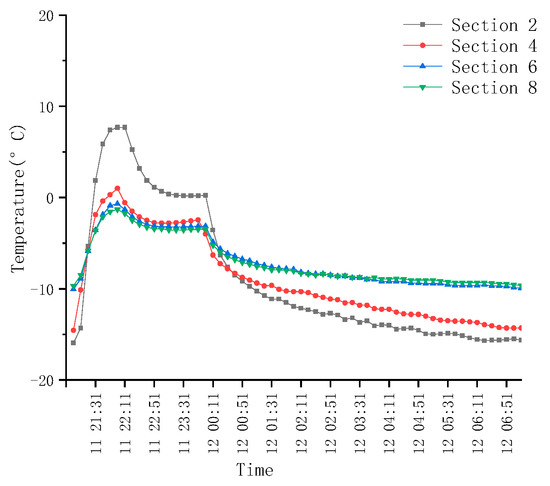
Figure 10.
Temperature of model surface.
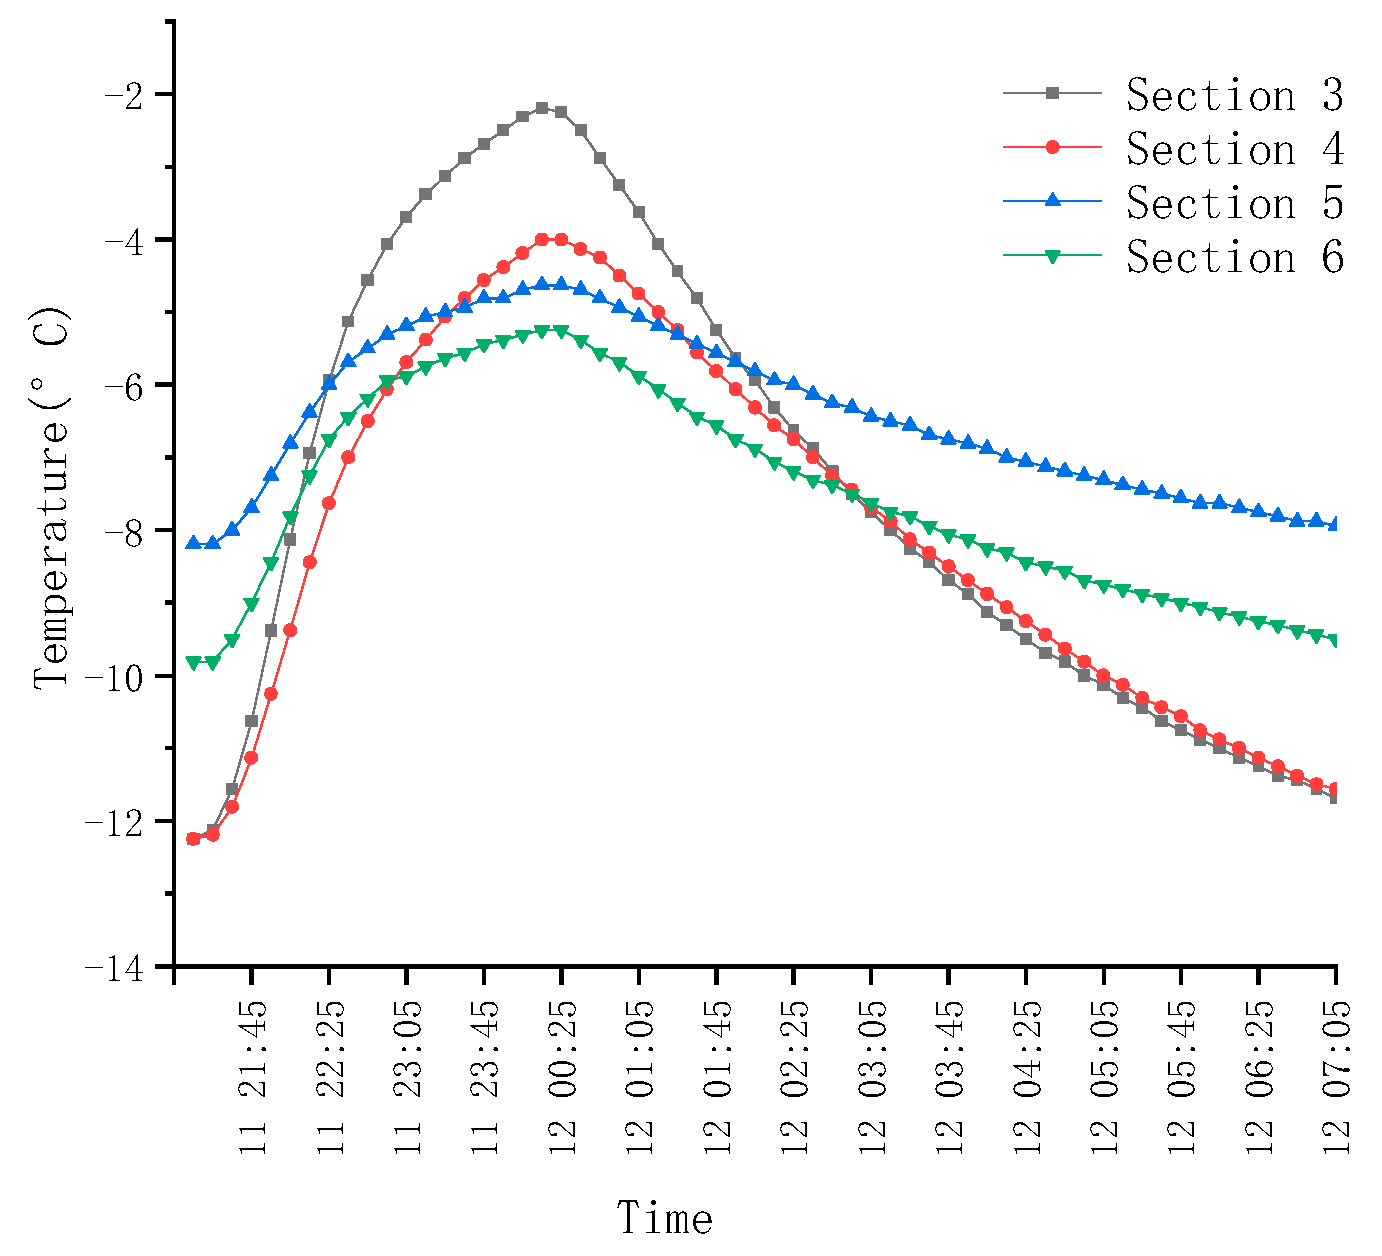
The temperature of the four sections changed regularly and periodically. With the increase in the distance from the air inlet increasing, the fluctuation range decreases. On the other hand, the temperature data behind the lining in Sections 3–6 is presented in Figure 11. The fluctuation of the temperature of each section was synchronous and reached an extreme value at the same time.
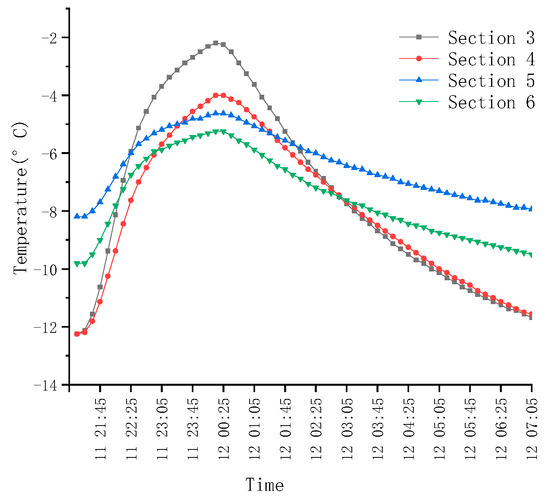
Figure 11.
Temperature behind the lining.
4.2. Cross-Section Temperature Distribution
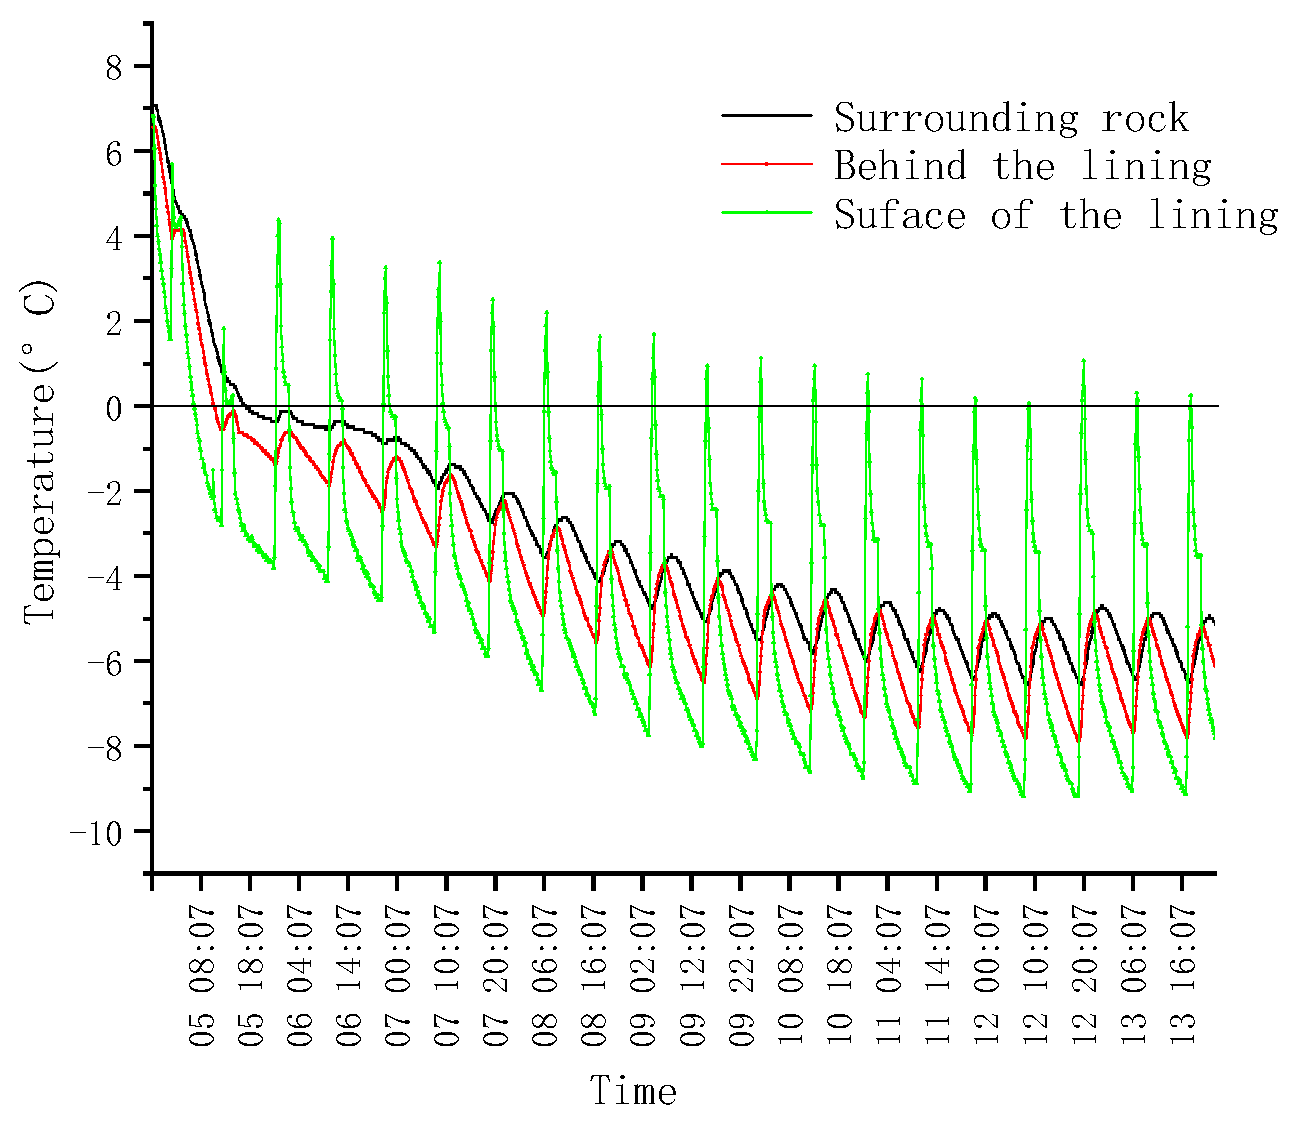
The temperature fluctuation of the surrounding rock, lining back, and lining surface is shown in Figure 12.
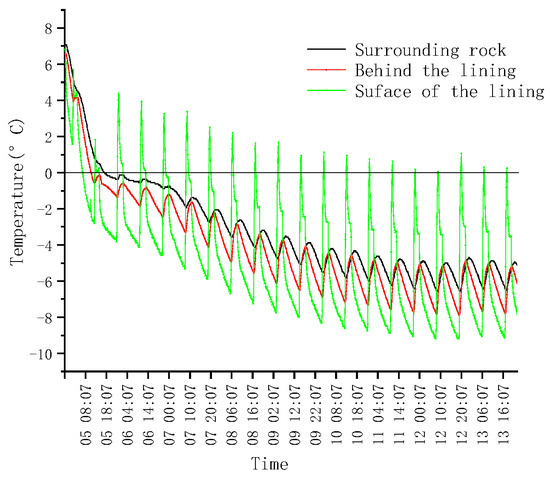
Figure 12.
Temperature distribution of the cross-section.
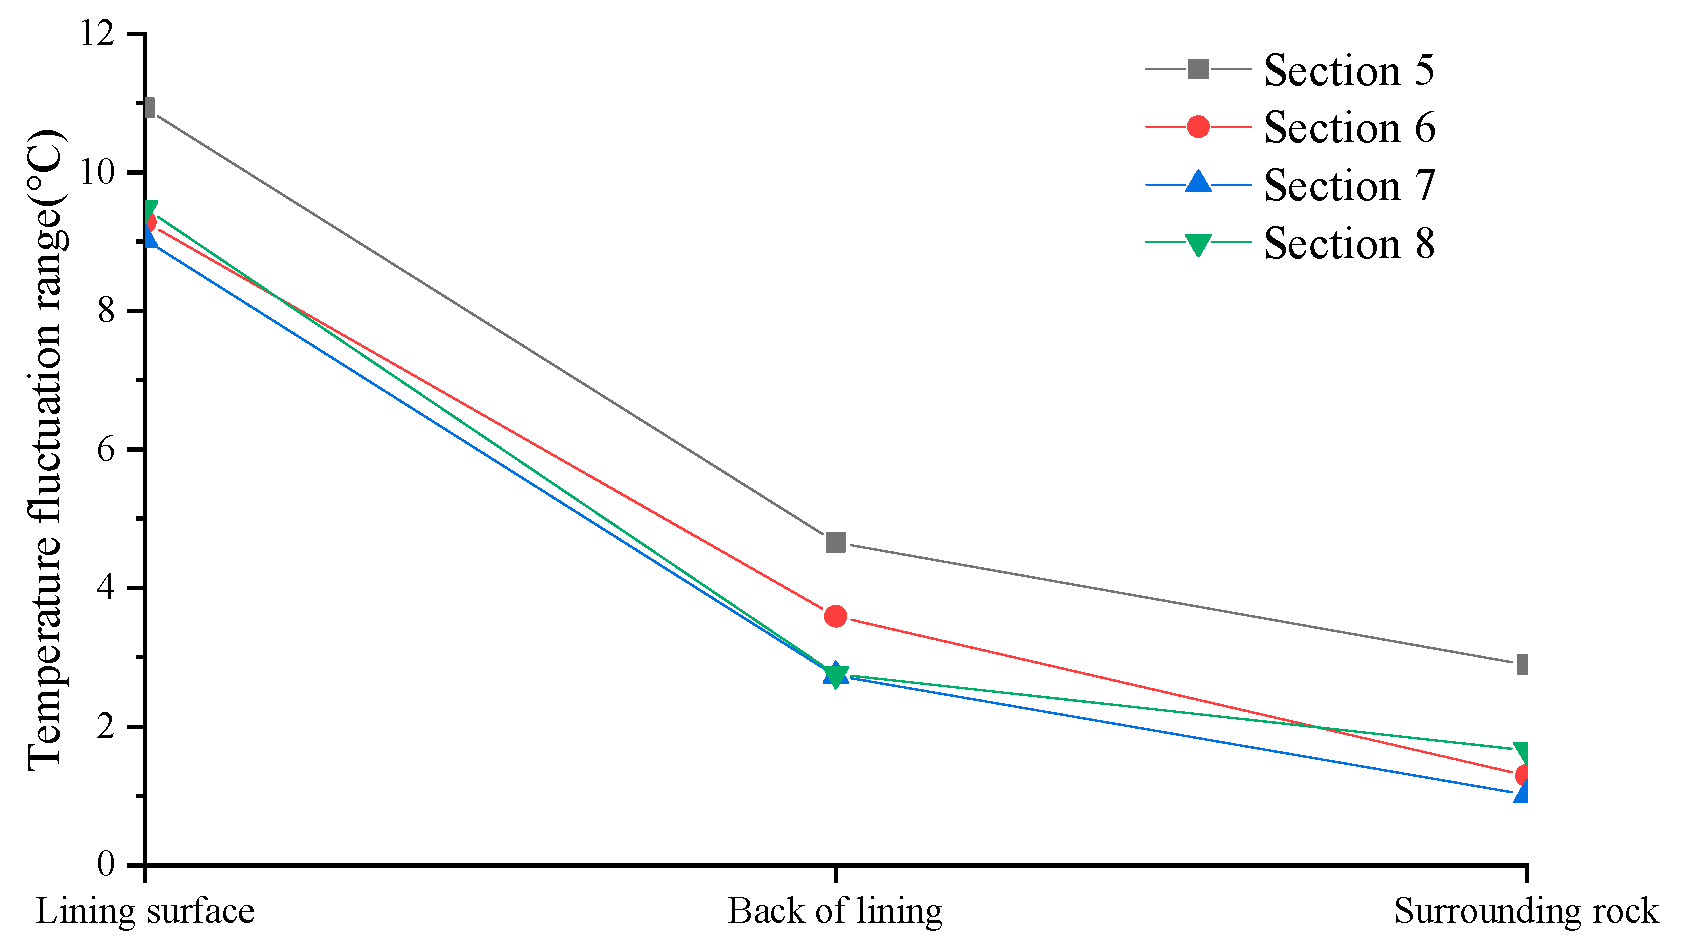
The fluctuation amplitude of the surface temperature of the model is significantly larger than that behind the model, and the fluctuation amplitude of the temperature behind the model is significantly larger than that in the surrounding rock. The fluctuation amplitude of each section is shown in Figure 13. The amplitude of fluctuation decreases from the surface to the inside of the surrounding rock, which is consistent with the law of temperature fluctuation measured by the research group in the Wushaoling tunnel groups and Hongfu tunnel, indicating that the model test simulates the characteristics of the thermal conduction of the tunnel lining and surrounding rock.
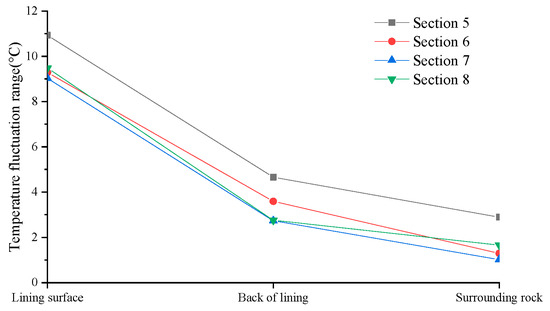
Figure 13.
Temperature amplitude.
4.3. Distribution of Freeze–Thaw Cycles
The number of freeze–thaw cycles in Sections 2–8 was calculated within 100 cycles, and the results are shown in Table 1.

Table 1.
The number of freeze–thaw cycles of sections 2–8.
The number of freeze–thaw cycles of the inner-face sections showed a declining trend from the inlet, which is consistent with the distribution law of freeze–thaw cycles of tunnels in cold regions measured in the field [18,19]. Additionally, this indicates that the experiment realized the progressive deterioration of tunnel lining concrete in the longitudinal direction, just like the one on the right in Figure 4. Additionally, according to the number of freeze–thaw cycles in Sections 2 and 3, the number of freeze–thaw cycles in the lining surface was 95 and 78, while the number of freeze–thaw cycles behind the lining was 9 and 3. This reveals that the number of freeze–thaw cycles from the lining surface to the back is gradually reduced. It can be inferred that the experiment also realized the gradual deterioration of the tunnel lining concrete on the cross-section, just like the one on the right in Figure 4. Next, the bearing characteristics of those concrete pieces that have gradually weakened need to be tested.
5. Bearing Characteristics of the Model
5.1. Failure Mode of Model
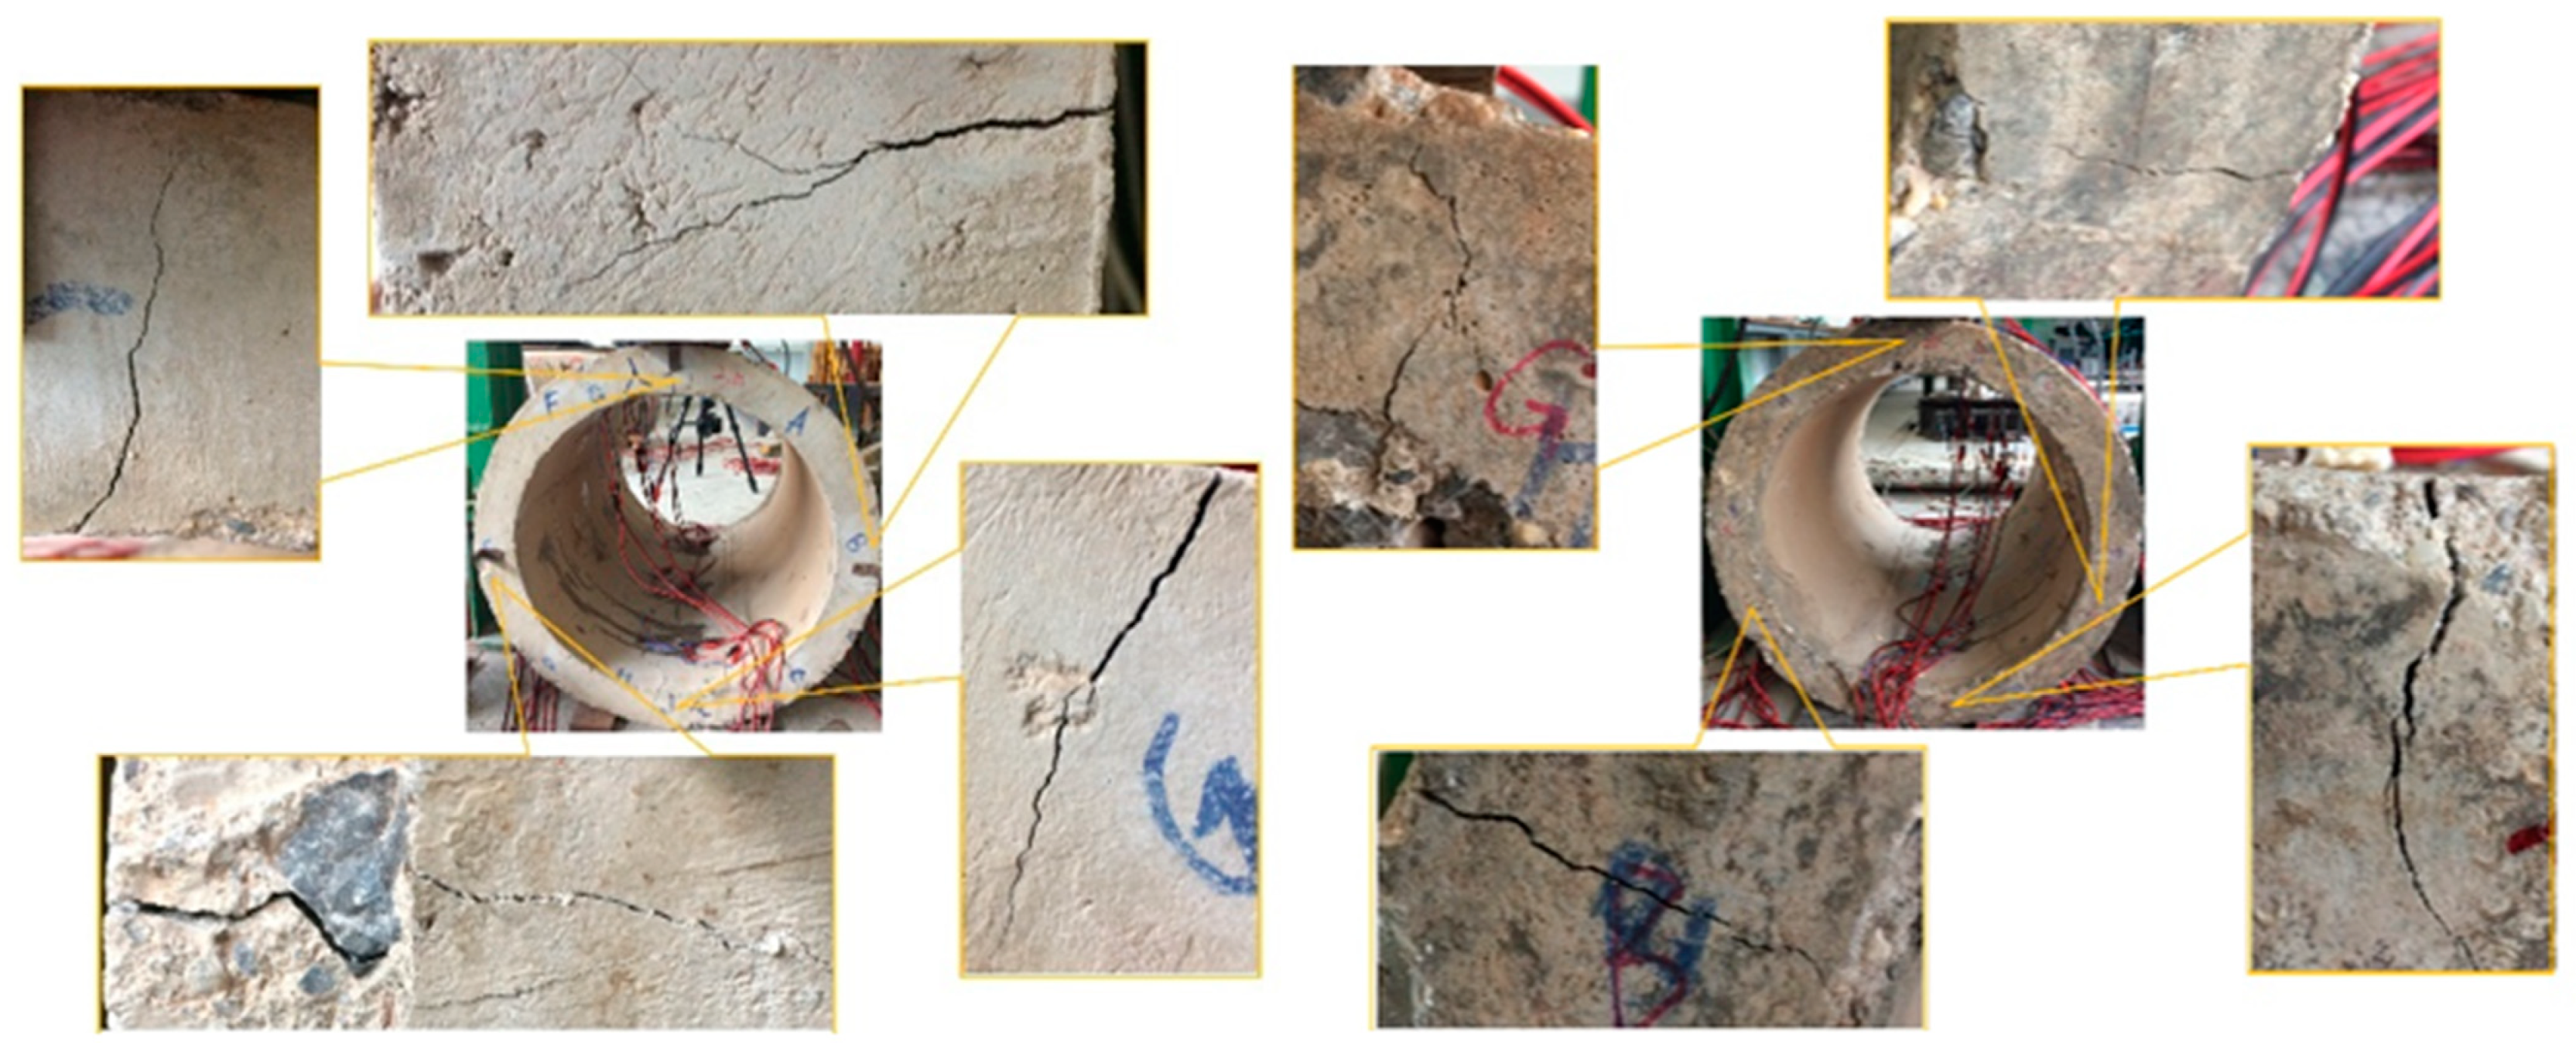
In the process of loading, there are obvious brittle failure characteristics. In the case of no macro cracks, the creaking sound of concrete crushing can first be heard. With the increase in load, longitudinal cracks appear on the outer surfaces of both sides and the inner surface of the crown and bottom of the model. Then, the concrete model suddenly breaks and the structure loses bearing capacity, as shown in Figure 14.
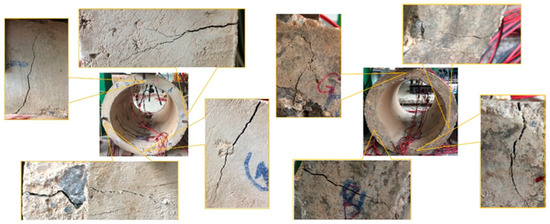
Figure 14.
Crack distribution at the end of test piece No. 3.
The cracks are distributed near the positions where the strain gauges are pasted onto the cross-section. The cracks at the top and bottom first appear from the inner surface and then gradually develop to the back of the lining, while the cracks on the left and right sides first appear from the back of the lining and then gradually develop to the lining surface. The location of the crack occurrence and development is the location of the tensile zone under load. The cracks are distributed longitudinally, as shown in Figure 15.
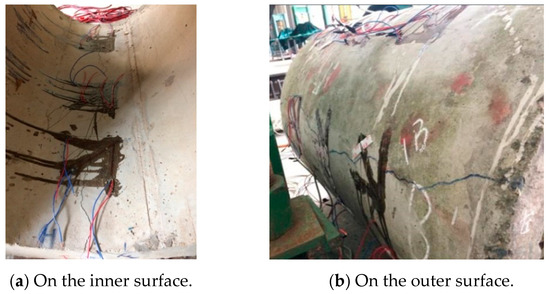
Figure 15.
Longitudinal crack of the test piece.
5.2. Results of Strain
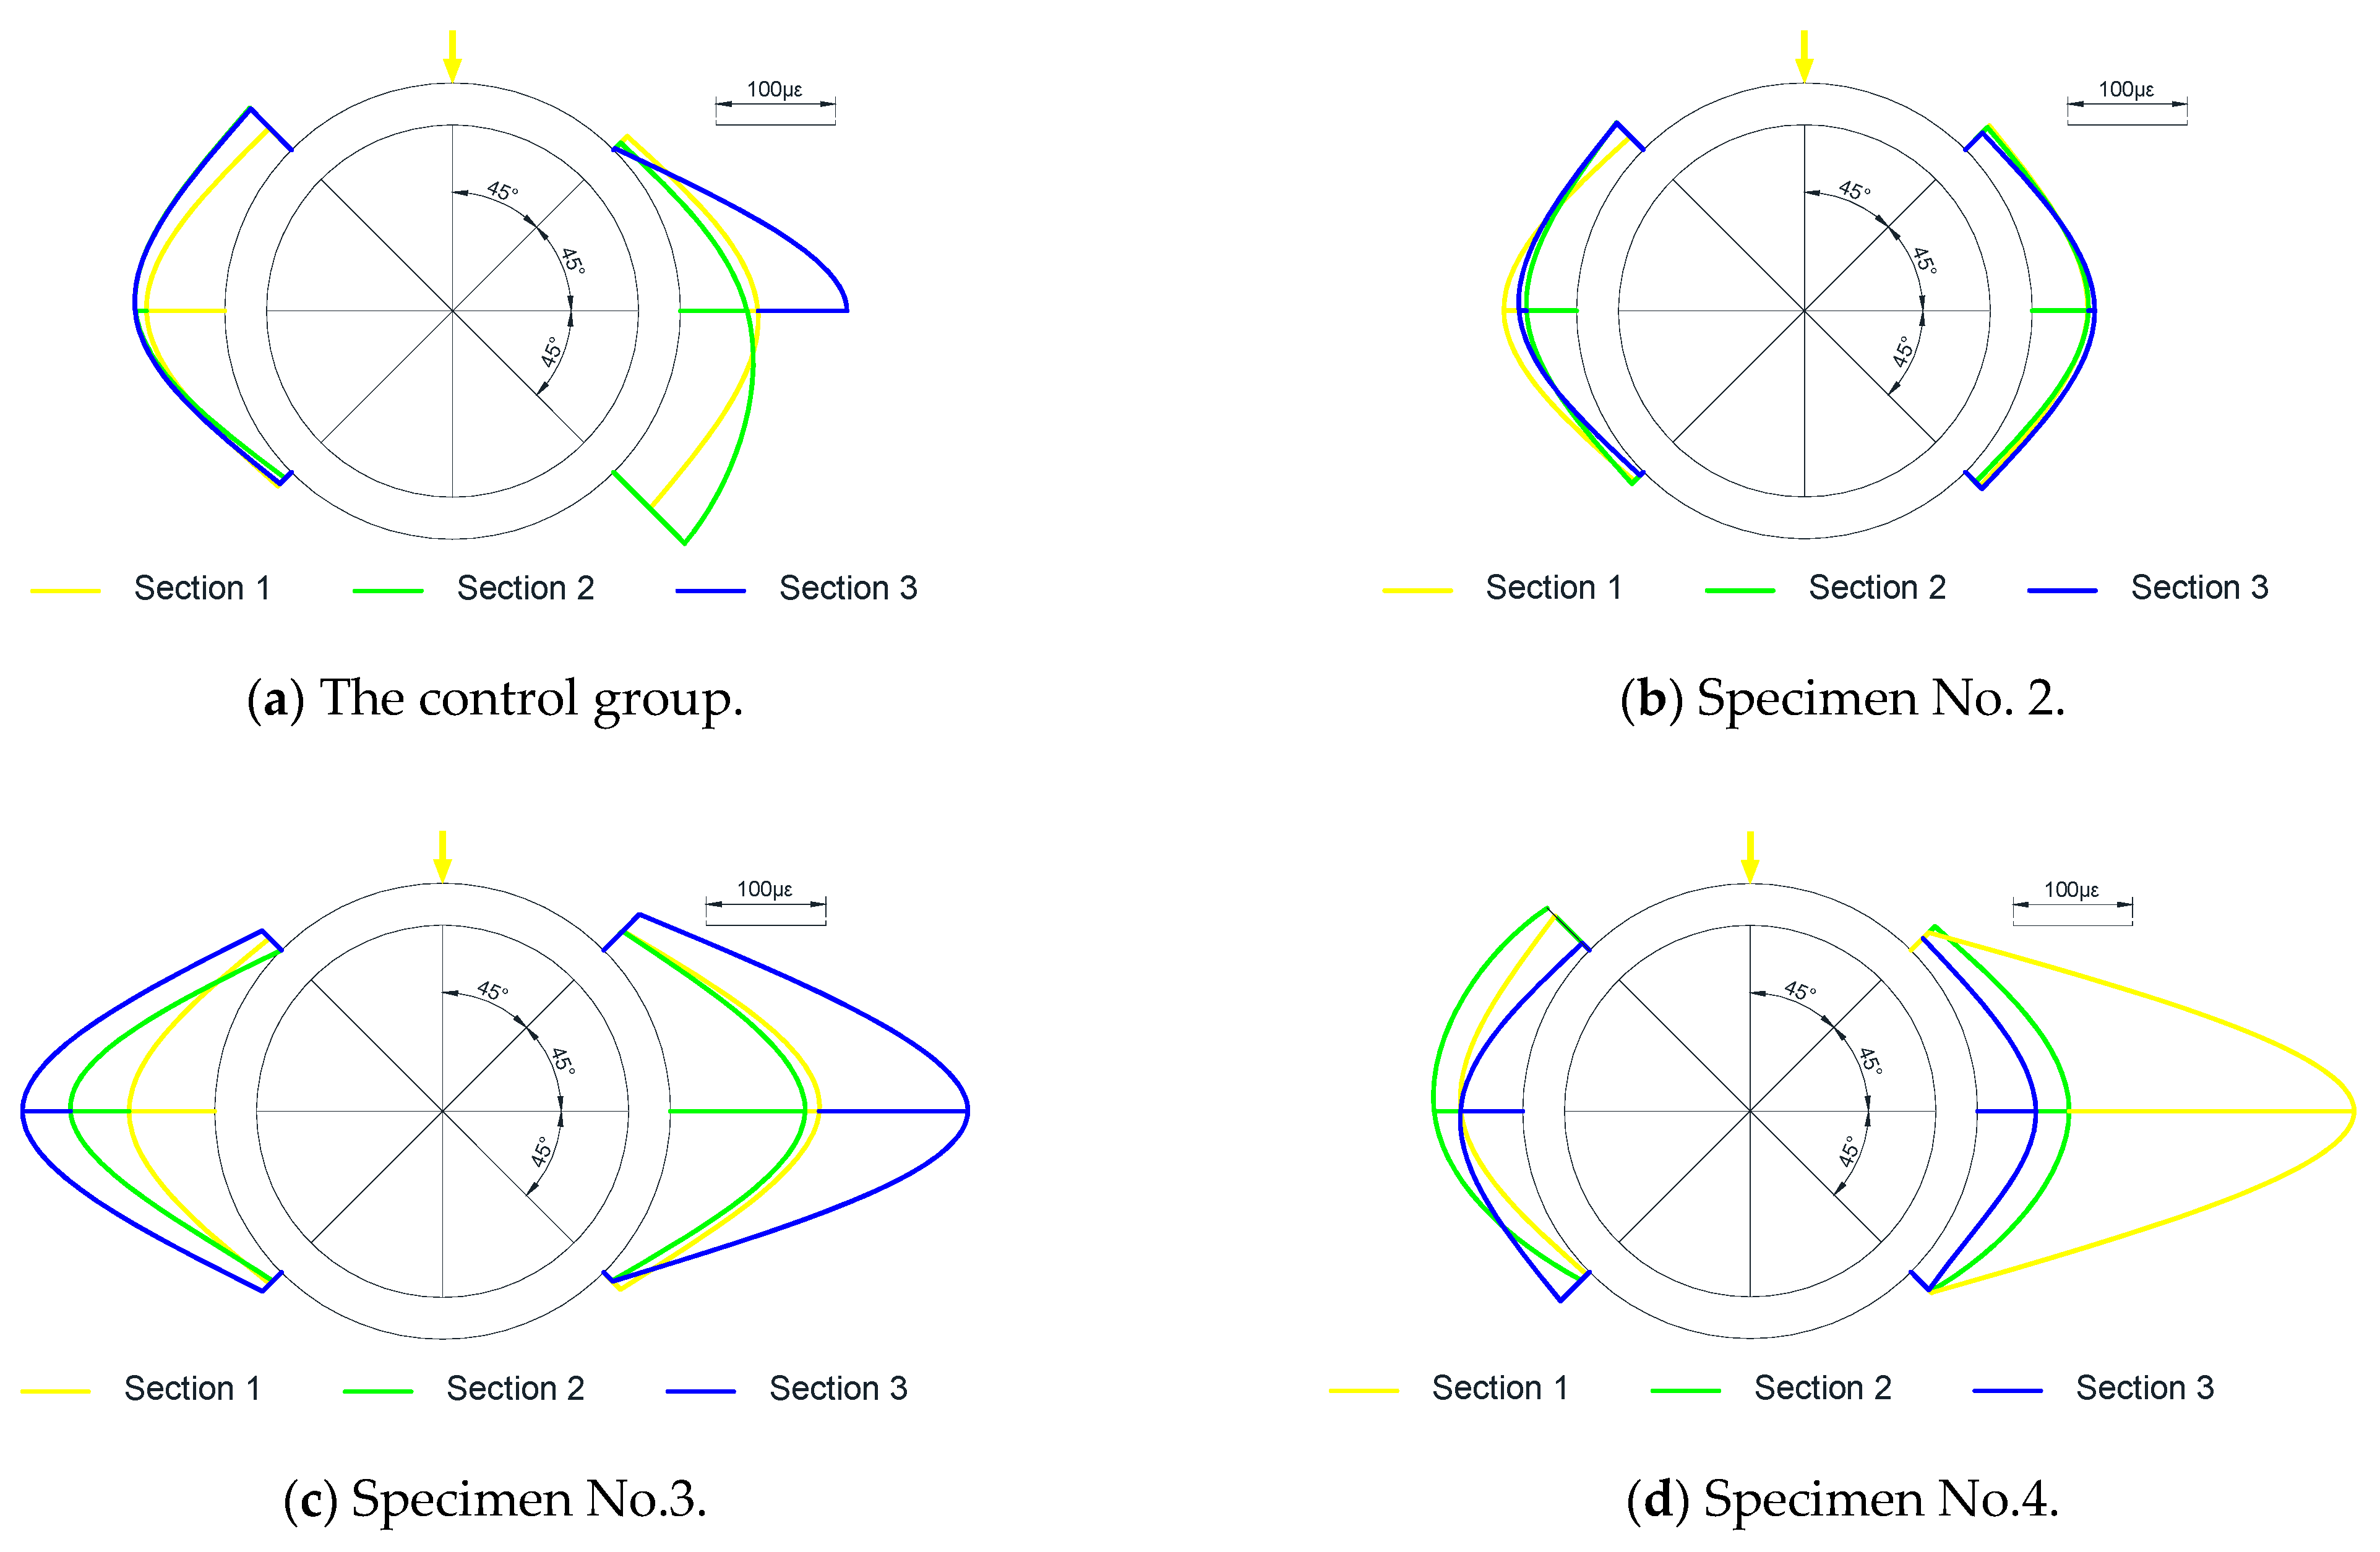
Data from the strain gauge at each point of each load stage before structural failure occurred were obtained. The strain of each section of test pieces under a load of 40 kN is shown in Figure 16.
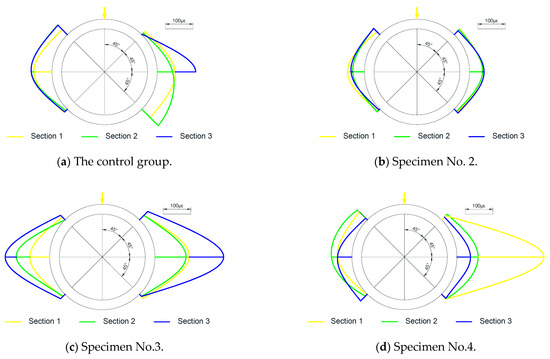
Figure 16.
The strain of the pieces.
It can be seen from Figure 16 that the strain of the control group, No. 2 and No. 3, is symmetrical. The strain of specimen No. 4 at 0° position is the smallest. This is also the piece that suffered the minimum number of freeze–thaw cycles, but it was still more than that of the control group. The strain of pieces No. 3 and No. 4, which suffered tens of freeze–thaw cycles, is obviously larger than that of piece No. 5. In a word, the strain of each specimen basically reflects the influence of the different number of freeze–thaw cycles on the structural strain. Next, we examine how the bearing capacity of the structure reacts under the influence of freeze–thaw cycles.
5.3. Ultimate Bearing Capacity
The ultimate load of each specimen is shown in Table 2.
Table 2.
Ultimate load value of test piece.
The average ultimate bearing capacity of the specimens under the three conditions is obviously related to the number of freeze–thaw cycles that occurred. The average ultimate bearing capacity of the control group, which did not go through freeze–thaw cycles, is the largest. Specimens No. 3 and No. 4 are far away from the air inlet, and their number of freeze–thaw cycles is smaller than that of Specimens No. 1 and No. 2; the bearing capacity is 43.7 kN. The ultimate bearing capacity of Specimens No. 1 and No. 2, with more freeze–thaw cycles, is the smallest, at only 40.15 kN. Overall, the bearing capacity test of the specimen preliminarily reflects the influence of the freeze–thaw cycle on the bearing capacity of the structure. The bearing capacity of the model subjected to a freeze–thaw cycle is significantly smaller than that of a model not subjected to a freeze–thaw cycle.
6. Discussion
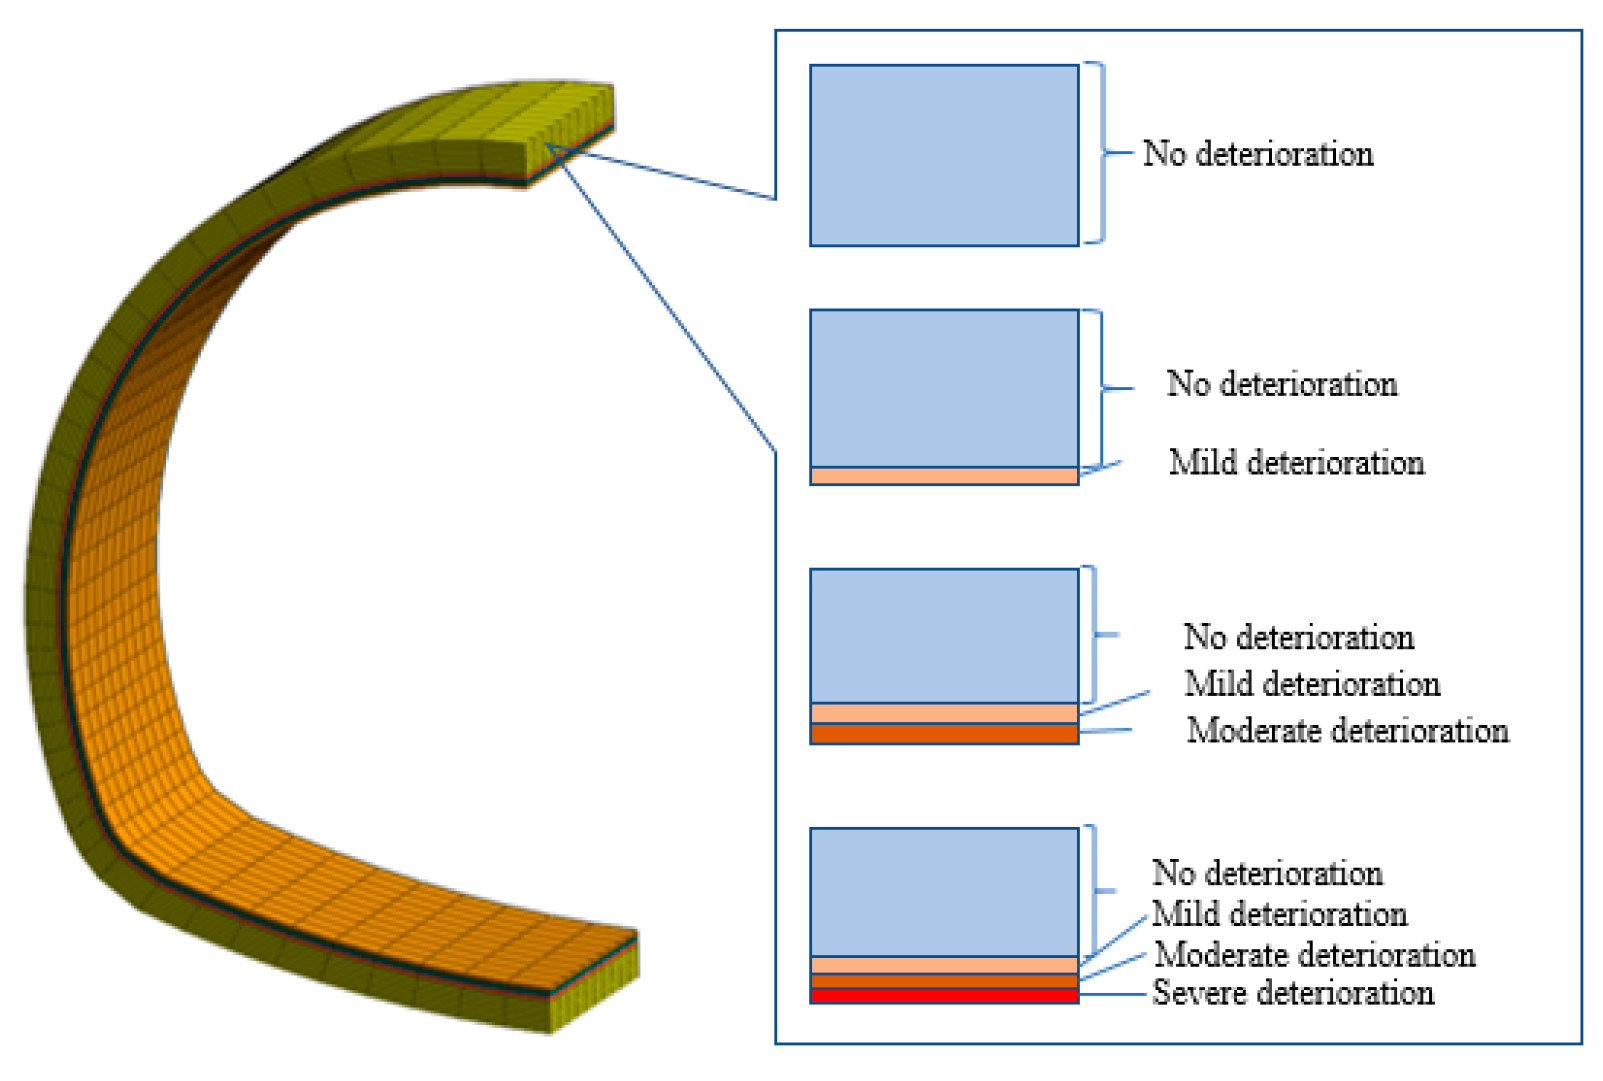
The phenomenon of the falling off or peeling off of lining concrete usually occurs in cold-region tunnels after lining material degradation. Based on the loading structure method, numerical simulation was used to study the influence of lining material gradual degradation on the lining structure with ANSYS. According to the test, about 100 unsaturated freeze–thaw cycles per year occur in the lining surface in Section 1. Four working conditions were selected, as shown in Figure 17. We found the following: (1) There is no deterioration of the lining structure in the initial stage of tunnel construction. (2) After 10 years of operation, the lining surface within 5 cm suffered 1000 unsaturated freeze–thaw cycles, showing a slight deterioration. (3) After 20 years of operation, the lining surface within 5 cm suffered 2000 unsaturated freeze–thaw cycles, showing a moderate deterioration and a mild deterioration within 5–10 cm of the lining surface. (4) After 30 years of operation, 3000 unsaturated freeze–thaw cycles occurred within 5 cm of the lining surface, showing severe deterioration and moderate deterioration within 5–10 cm of the lining surface and mild deterioration within 10–15 cm of the lining surface. The physical and mechanical properties and parameters are shown in Table 3. A numerical simulation was carried out for the general cross-section of highway tunnels.

Figure 17.
Calculation model of lining degradation.
Table 3.
Parameters of concrete in the simulation [20,21].
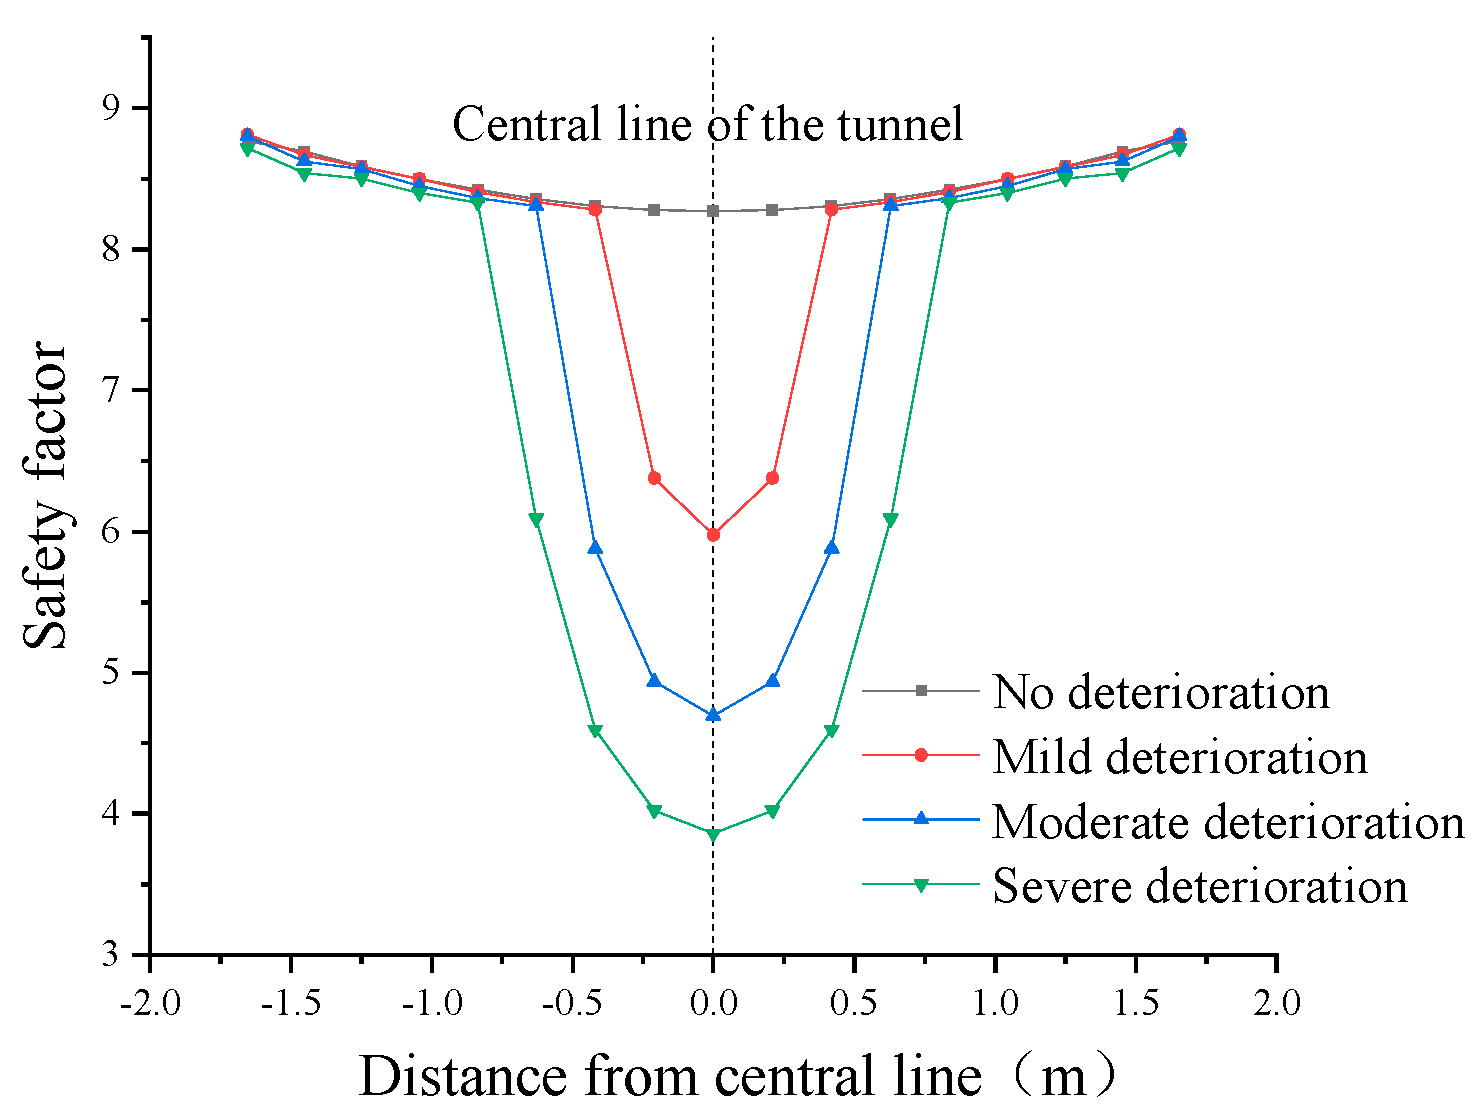
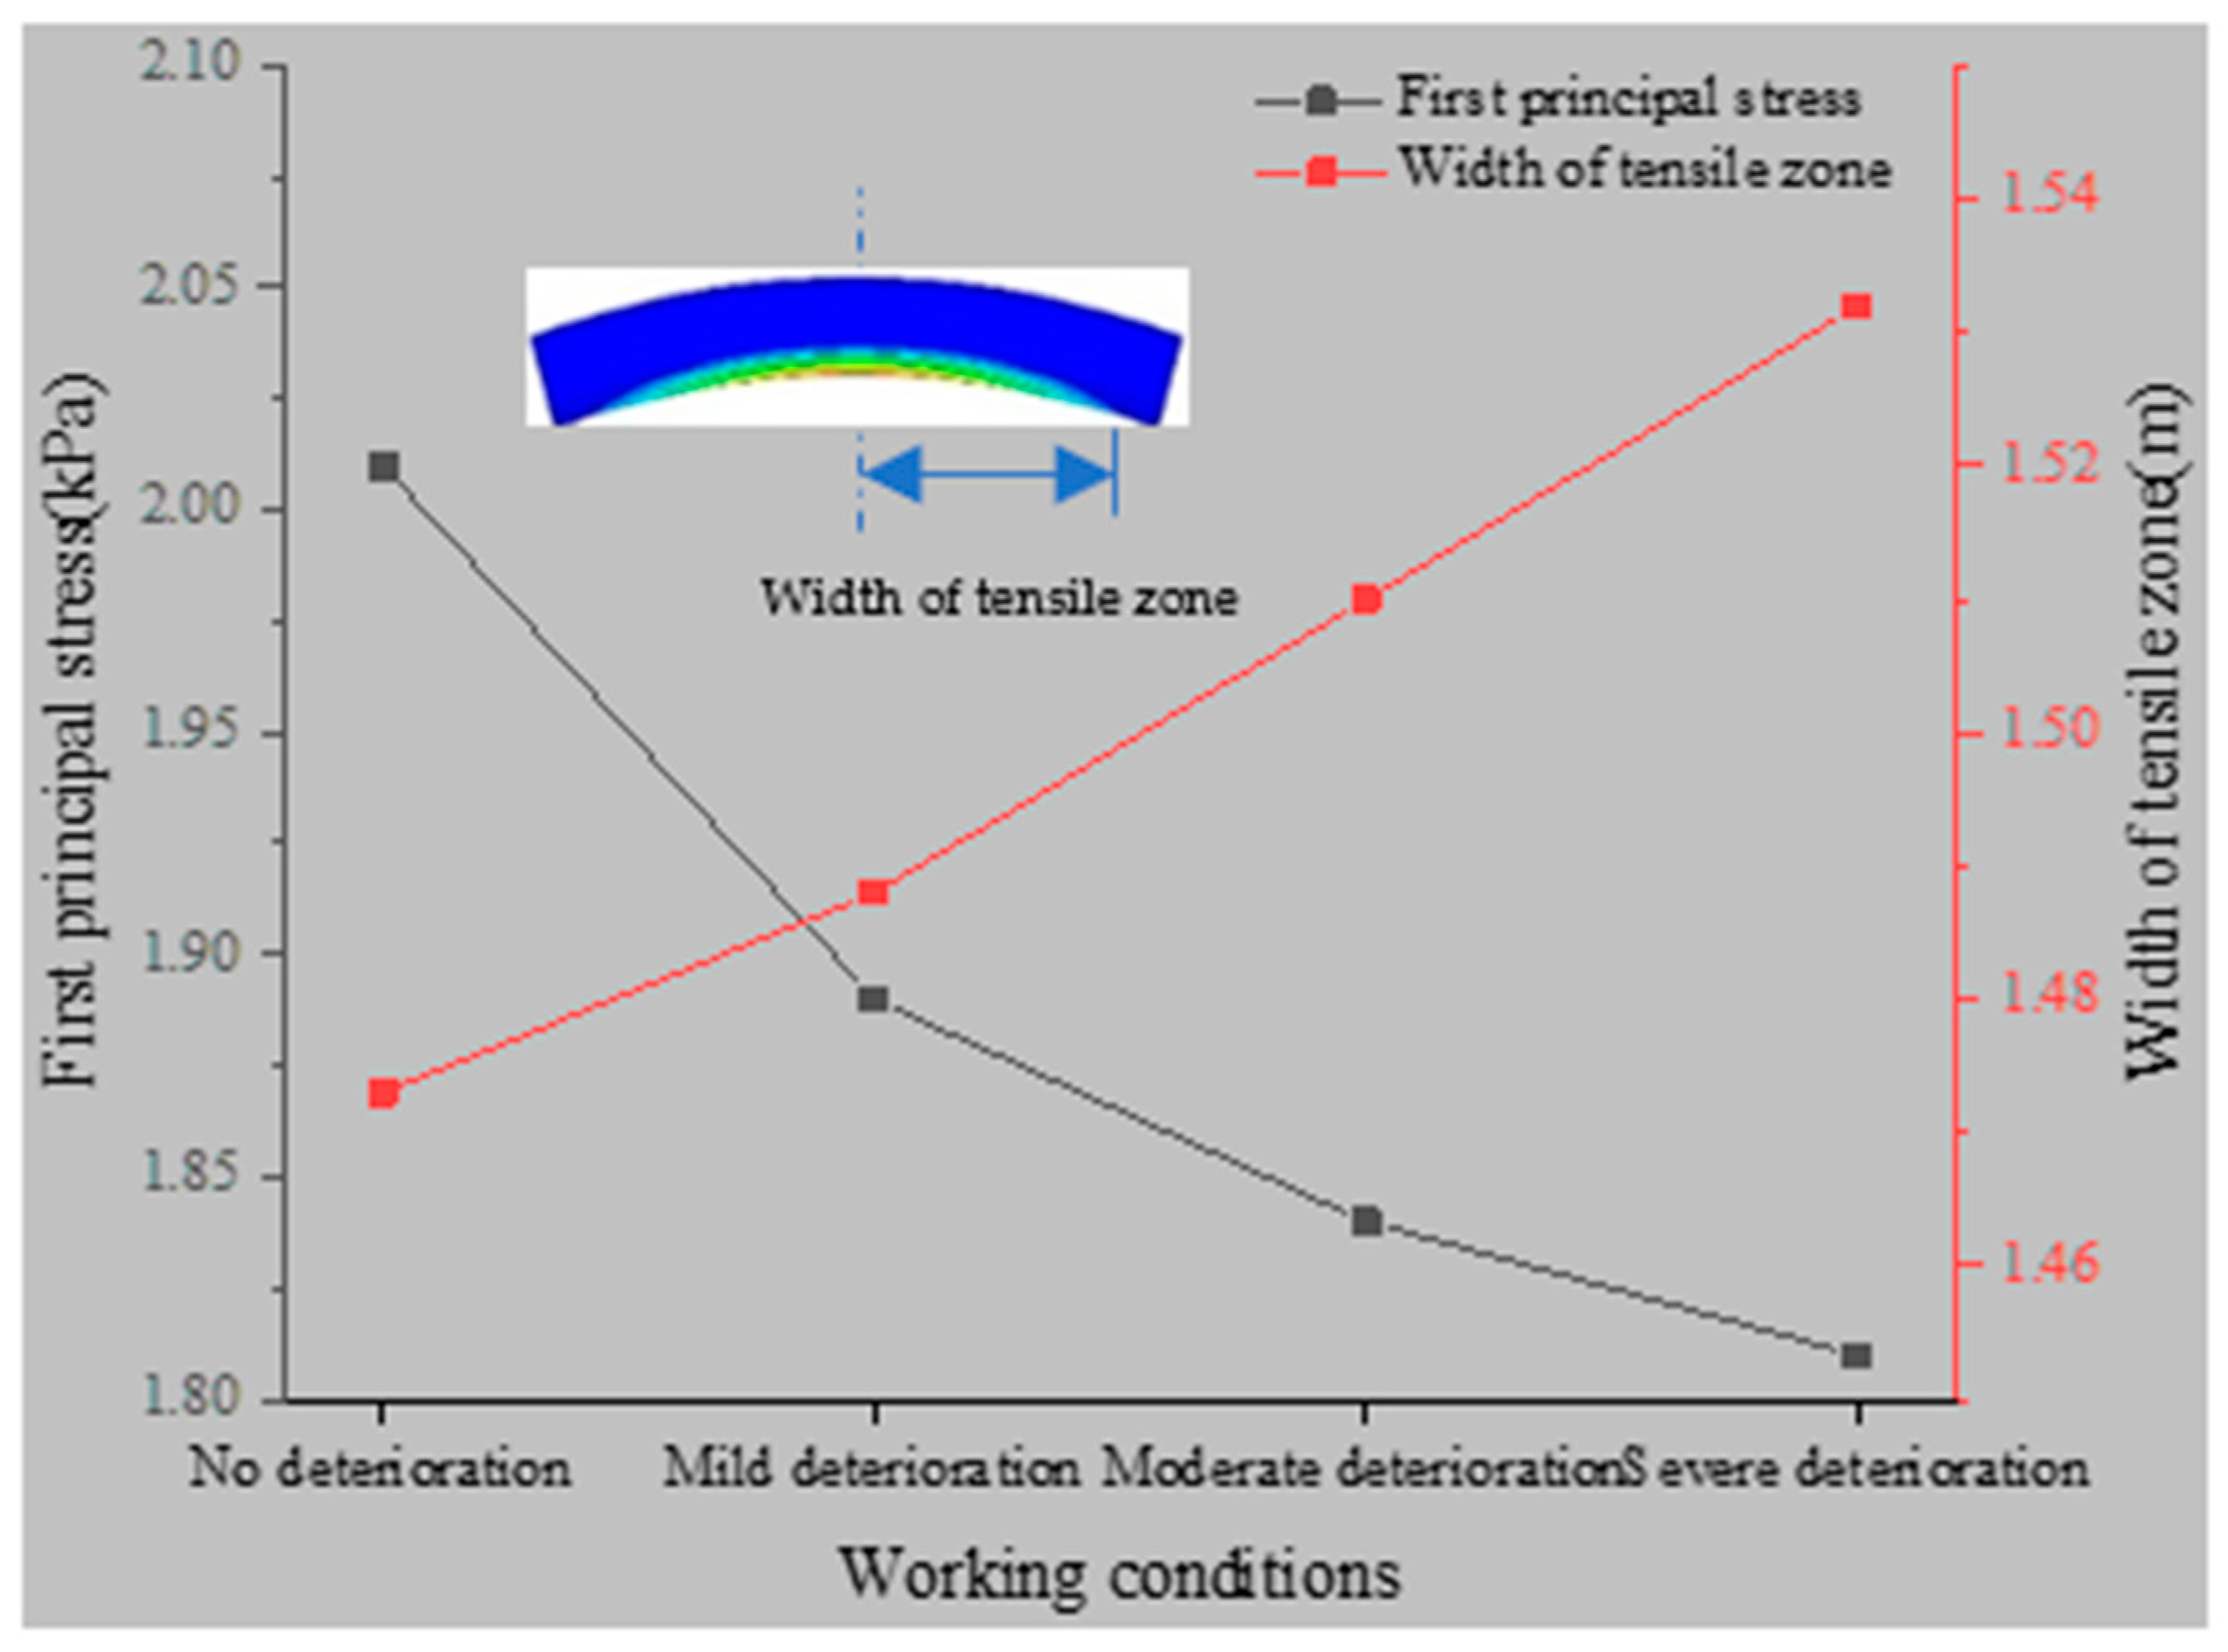
The simulation results show that the gradual deterioration of the lining concrete changes the stress state of the lining structure in the vault of the tunnel. Under the condition of no deterioration of the lining taking place, the section eccentricity, e0, is less than 0.2 times the height of the boundary section, and the safety of the section is controlled by the compressive strength of the concrete. With the increase in the tunnel’s operation years, the gradual deterioration of concrete leads to the upward displacement of eccentricity, and the safety of the section is controlled by the tensile strength of the concrete. The safety factor of the central section of the arch tunnel is reduced from 8.3 to 6.0 and, finally, to 3.9, as shown in Figure 18. It can be seen that, with the increase in operation life, the safety state of the tunnel vault gradually worsens. After 30 years of operation, the concrete on the lining surface of the arch roof lining is now close to the ultimate tensile state as shown in Figure 19. If a certain number of temperature cracks occur in the construction of the tunnel lining, with the gradual deterioration of the lining concrete these cracks will develop gradually, leading to serious cracking of the lining structure and even the peeling off and falling of blocks.
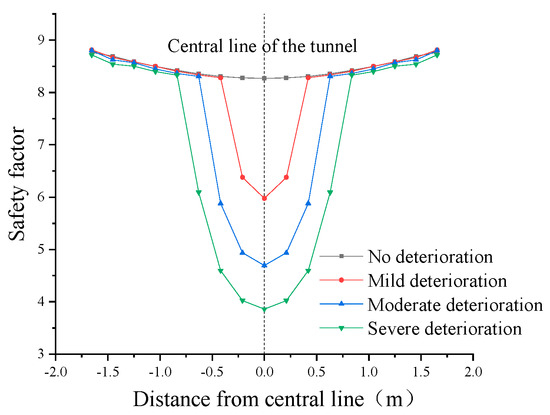
Figure 18.
Safety factor of degraded lining.

Figure 19.
Stress and width of tensile zone after deterioration.
In this paper, we have used a linear analysis model to analyze the influence of the deterioration of lining concrete on the structure, and predicted the lining cracks. In actual engineering, concrete is a nonlinear material, and the results of a linear model will deviate from the actual situation. At present, there are many nonlinear simulation models and crack prediction models. In subsequent research, we will carry out nonlinear analysis on the influence of lining deterioration, and try to obtain more results.
7. Conclusions
During the service life of tunnels in cold regions, the lining structure will experience different numbers of unsaturated freeze–thaw cycles in the circumferential and longitudinal directions. The damage caused by freeze–thaw cycles deteriorates the quality of the concrete. We have proposed that the deterioration degree of lining concrete presents a gradual distribution in the circumferential and longitudinal directions in tunnels in cold regions. In the cross-section of the tunnel, the deterioration degree of the lining surface is the most serious; in the longitudinal direction of the tunnel, the degree of deterioration of the lining becoming gradually lighter from the tunnel portal. Further, a simulation experiment was adopted to realize the gradual deterioration of concrete specimens. The load test results of the specimens show that the ultimate load of the model decreases with the increase in the number of freeze–thaw cycles taking place. Finally, a numerical simulation was carried out to investigate the influence of the gradual deterioration of the lining. The gradual deterioration of lining concrete will encourage the gradual development of cracks, leading to serious cracking of the lining structure and even block spalling. Through this research, we hope to provide useful information for the prevention and control of tunnel frost damage in cold regions.
Author Contributions
Conceptualization, Y.W.; methodology, Y.W.; software, P.X.; validation, Y.W., P.X. and L.H.; formal analysis, P.X.; investigation, L.H.; resources, L.H.; data curation, L.H.; writing—original draft preparation, P.X.; writing—review and editing, P.X.; visualization, K.Z.; supervision, K.Z.; project administration, K.Z.; funding acquisition, Y.W. All authors have read and agreed to the published version of the manuscript.
Funding
This research was funded by the Natural Science Foundation of China, grant number 51478473 and the Science and Technology Research Project of the China Railway Corporation, grant number K2018G019.
Data Availability Statement
The data presented in this study are available on request from the corresponding author. The data are not publicly available due to privacy.
Acknowledgments
The authors would like to thank the editor and anonymous referees very much for their work on this paper.
Conflicts of Interest
The authors declare that they have no known competing financial interests or personal relationships that could have influenced the work reported in this paper.
References
- Ye, F.; Qin, N.; Liang, X.; Ouyang, A.; Qin, Z.; Su, E. Analyses of the defects in highway tunnels in China. Tunn. Undergr. Space Technol. 2021, 107, 103658. [Google Scholar]
- Xu, G.; He, C.; Yang, Q.; Wang, B. Progressive failure process of secondary lining of a tunnel under creep effect of surrounding rock. Tunn. Undergr. Space Technol. 2019, 90, 76–98. [Google Scholar] [CrossRef]
- Gao, G.; Chen, Q.S.; Zhang, Q.S.; Chen, G.Q. Analytical elasto-plastic solution for stress and plastic zone of surrounding rock in cold region tunnels. Cold Reg. Sci. Technol. 2012, 72, 50–57. [Google Scholar] [CrossRef]
- Feng, Q.; Jiang, B.; Zhang, Q.; Wang, L. Analytical elasto-plastic solution for stress and deformation of surrounding rock in cold region tunnels. Cold Reg. Sci. Technol. 2014, 108, 59–68. [Google Scholar] [CrossRef]
- Wang, T.; Zhou, G.; Wang, J.; Yin, L. Stochastic analysis of uncertainty mechanical characteristics for surrounding rock and lining in cold region tunnels. Cold Reg. Sci. Technol. 2018, 145, 160–168. [Google Scholar] [CrossRef]
- Lv, Z.; Xia, C.; Wang, Y.; Luo, J. Analytical elasto-plastic solution of frost heaving force in cold region tunnels considering transversely isotropic frost heave of surrounding rock. Cold Reg. Sci. Technol. 2019, 163, 87–97. [Google Scholar] [CrossRef]
- Zhu, Y.; Li, Y.; Hao, Z.; Luo, L.; Luo, J.; Wang, L. An analytical solution for the frost heaving force and displacement of a noncircular tunnel. Comput. Geotech. 2021, 133, 104022. [Google Scholar] [CrossRef]
- Khodadadian, A.; Noii, N.; Parvizi, M.; Abbaszadeh, M.; Wick, T.; Heitzinger, C. A Bayesian estimation method for variational phase-field fracture problems. Comput. Mech. 2020, 66, 827–849. [Google Scholar] [CrossRef] [PubMed]
- Noii, N.; Khodadadian, A.; Ulloa, J.; Aldakheel, F.; Wick, T.; Francois, S.; Wriggers, P. Bayesian inversion for unified ductile phase-field fracture. arXiv 2021, arXiv:2104.11114. [Google Scholar]
- Tan, X.; Chen, W.; Yang, D.; Dai, Y.; Wu, G.; Yang, J.; Yu, H.; Tian, H.; Zhao, W. Study on the influence of airflow on the temperature of the surrounding rock in a cold region tunnel and its application to insulation layer design. Appl. Therm. Eng. 2014, 67, 320–334. [Google Scholar] [CrossRef]
- Wang, T.; Zhou, G.; Wang, J.; Zhao, X. Stochastic analysis for the uncertain temperature field of tunnel in cold regions. Tunn. Undergr. Space Technol. 2016, 59, 7–15. [Google Scholar] [CrossRef]
- Liu, W.; Feng, Q.; Wang, C.; Lu, C.; Xu, Z.; Li, W. Analytical solution for three-dimensional radial heat transfer in a cold-region tunnel. Cold Reg. Sci. Technol. 2019, 164, 102787. [Google Scholar] [CrossRef]
- Feng, Q.; Jiang, B.; Zhang, Q.; Wang, G. Reliability research on the 5-cm-thick insulation layer used in the Yuximolegai tunnel based on a physical model test. Cold Reg. Sci. Technol. 2016, 124, 54–66. [Google Scholar] [CrossRef]
- Zhou, Y.; Zhang, X.; Deng, J. A mathematical optimization model of insulation layer’s parameters in seasonally frozen tunnel engineering. Cold Reg. Sci. Technol. 2014, 101, 73–80. [Google Scholar] [CrossRef]
- Jun, K.; Hwang, Y.; Yune, C. Field measurement of temperature inside tunnel in winter in Gangwon, Korea. Cold Reg. Sci. Technol. 2017, 143, 32–42. [Google Scholar] [CrossRef]
- Li, W.; Wu, Y.; Fu, H.; Zhang, Q. Freezing-Thawing Process and Frost-Heaving’s Numerical Simulation of Tunnel with Monitored Temperature as Boundary Condition. J. Comput. Theor. Nanosci. 2016, 13, 4670–4678. [Google Scholar] [CrossRef]
- Zhao, P.; Chen, J.; Luo, Y.; Li, Y.; Chen, L.; Wang, C.; Hu, T. Field measurement of air temperature in a cold region tunnel in northeast China. Cold Reg. Sci. Technol. 2020, 171, 102957. [Google Scholar] [CrossRef]
- Peng, X.; Yimin, W.; Zijian, W.; Le, H. Distribution laws of freeze–thaw cycles and unsaturated concrete experiments in cold-region tunnels. Cold Reg. Sci. Technol. 2020, 172, 102985. [Google Scholar] [CrossRef]
- Wu, Y.; Xu, P.; Li, W.; Wang, Z.; Cai, Z.; Shao, S. Distribution rules and key features for the lining surface temperature of road tunnels in cold regions. Cold Reg. Sci. Technol. 2020, 172, 102979. [Google Scholar] [CrossRef]
- Ministry of Transport of China. Code for Design of Highway Tunnels, JTG 3370.1-2018; China Communications Press: Beijing, China, 2018.
- Kaiyun, W.; Siyue, H.; Hang, H.; Ningquan, C.; Jinxin, L. Test of temperature field and orthogonal test of influencing factors in cold region. Chin. J. Highw. 2018, 63, 317–323. [Google Scholar]


Publisher’s Note: MDPI stays neutral with regard to jurisdictional claims in published maps and institutional affiliations. |
© 2021 by the authors. Licensee MDPI, Basel, Switzerland. This article is an open access article distributed under the terms and conditions of the Creative Commons Attribution (CC BY) license (https://creativecommons.org/licenses/by/4.0/).