Abstract
The use of GPR data multipath summation on data acquired over parallel study lines is presented here within the framework of a study on the effects of natural hazards on cultural heritage areas in order to image weak zones within carbonates, such as fractures and caverns. This study was realized at the archeological site of Xochicalco in Mexico, where fractures and caverns are potential sources of the degradation of the archeological remains. Dense parallel GPR study lines spaced every 0.25 m were surveyed using a 400 MHz monostatic antenna with the aim to image possible weak zones in three dimensions. We used a 2D imaging approach, namely, the method of multipath summation, which efficiently focused the scattered energy within the GPR sections. The study revealed, at depths of 1.6m and 1.8m, several linear events attributed to fractures, leading to the preliminary conclusion of this on-going project that cracks on the walls of the Quetzalcoatl Temple after a large earthquake in 2017 are prone to instability of carbonates rocks.
1. Introduction
The ground-penetrating radar (GPR) method provides high-resolution, non-destructive imaging of shallow subsurface and, among other applications, has proved to be a valuable tool for the delineation of the internal geometry of fractures, discontinuities, and voids in rock bodies [1,2,3,4,5,6,7]. This method has been applied by several researchers over limestone, a common base-rock, which is characterized by the generation of cavities and fractures due to inner water movement resulting in a calcium carbonate dissolution process. Even though several techniques have been used to improve the detectability and detailed imaging of the GPR method of sections, such as texture attributes [8] or signal polarization studies [9], diffraction imaging is the most common technique [2].
Grasmueck et al. and Sava et al. [10,11] agree that diffracted energy needs to be focused to arrive at laterally resolved GPR images. Diffraction focusing collapses the diffractions to their apices, enhancing, in this way, the coherency and linearity of the fracture planes. Parallel GPR study lines can provide 3D GPR data imaging, which, if not densely sampled in the off-line direction (assuming a minimum requirement of a quarter-wavelength spatial sampling), is spatially aliased and requires spatial interpolation for an efficient 3D migration process. An extensive study on this drawback was carried out by Grasmueck et al. [10]. Decimation of spatial sampling in the in-line direction to avoid aliasing, or high-cut filtering as is commonly used in seismic, also decimates the diffraction information, while on the contrary, dense parallel study lines increase the acquisition time and may lead to a problematic 3D migration scheme due to the large amount of data. These are the main reasons why researchers and engineers mainly use grids with a study line spacing of 0.25 m or, in exceptional cases, down to 0.1 m, mainly when using multi-antenna equipment.
This has led to the commonly employed 2D migration schemes, free of diffraction focusing in the off-line direction, which have been proven to provide a weighted result between acquisition and processing time on the one hand and efficient 3D imaging on the other. What is common in both 2D and 3D migration processes and is unfortunately taken for granted in all of the above references is the need for an efficiently detailed velocity model of the subsurface. Velocity models for sufficient migration outputs may be extracted by multi-offset GPR data, which require time-consuming acquisition and are also characterized by the use of the conventional processing approach used in seismic reflection methods [12,13]. As the most commonly used data acquisition method is the common-offset technique, adequate velocity models cannot be extracted, even though several approaches such as average velocity values based on ground truth [14,15] or hyperbola fitting over diffractions [16] have been reported.
An efficient migration velocity model for diffraction focusing is the multipath summation process, which involves the stacking of constant velocity migrated sections [17,18]. Still, this approach requires subjective picking in its last stages. Multipath summation was negatively evaluated as a direct imaging method by Merzlikin and Fomel [17], because of the increased blurriness of the constant velocity-migrated stacked images. Economou et al. [19] presented a diffraction focusing strategy to circumvent the picking subjectivity and degraded GPR sections due to both frequency-dependent attenuation effects and the decrease of the dominant frequency, consisting, in the summation, of constant-velocity migrated images. This 2D imaging strategy does not require to explicitly build EM migration velocity models and involves, except for conventional processing steps, the weighted stacking of sequentially constant velocity migrated sections over a range of EM velocity values and time-varying spectral whitening, with the aim to enhance both the lateral and vertical resolution.
GPR has been extensively used for the study of cultural heritage sites [20,21,22]. Herein, we present the use of GPR data multipath summation on data acquired over parallel study lines, within the framework of a study on the effects of natural hazards on cultural heritage areas in order to image weak zones within carbonates, such as fractures and caverns. This study was realized at the archeological site of Xochicalco in Mexico, where fractures and caverns are potential sources of degradation of the archeological remains. First, we present the site description and describe the geology of the area, followed by the geophysical acquisition and data processing details. Then, we present the proposed GPR imaging results of the methodology, further commented on in the discussion section, and, lastly, the conclusions of this work.
2. Site Description and Geological Setting
The archaeological site of Xochicalco, whose name means “Place of the House of flowers” in Nahuatl [23], is a fortified site from the Epiclassic period (650–900 BCE) that was built primarily as a regional ceremonial and administrative center [24]. It was declared a World Heritage Site by UNESCO in 1999.The site is located in the western part of the Mexican state of Morelos at a latitude of 18°48′14.02″ N and a longitude 99°17′47.69″ W; it is at 1354 m a.s.l., approximately 123 km by road from Mexico City. The site is on top of a low calcareous mountain group in the western valley of the state of Morelos, 60 km southwest of Mexico City. Xochicalco is located in one of the poorest agricultural regions of the state, covered by thin and rocky soils (Leptosols) with little retention of humidity. From a climatic point of view, the region is classified as warm sub-humid with rains in summer [25], with a cumulative annual precipitation of 1054.96 mm and an average annual temperature of 22.87 °C, with a maxima of >30 °C in April and May and a minima of 18 °C in December.
Geologically, the substrate is formed by pelagic limestones (calcilutites, calcilimolites, calcarenites, and flint nodules) and breccias of Xochicalco Formation [26], of Mesozoic age (Middle Cretaceous: Barreniano-Aptiano) [27]. By their nature, carbonate rocks are subject to hydrochemical erosion (dissolution and cavern formation) (Figure 1a). For example, at the Xochicalco site, there are two caverns with anthropic modifications evidenced by an artificial hole or “chimney” from the cave to the ground above for astronomical observations (Figure 1b).
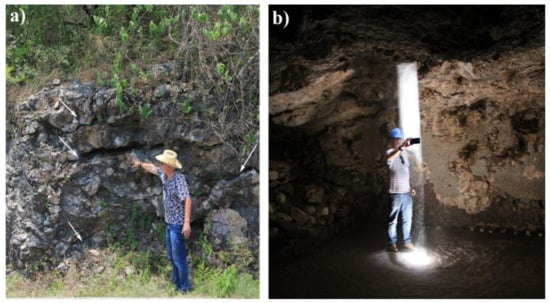
Figure 1.
(a) Stratification planes, joints, and fractures enlarged by the hydrochemical dissolution process; (b) cave with anthropic modifications in the ceiling for astronomical observation.
An earthquake in 2017 revealed cracks on the remaining walls of the Quetzalcoatl Temple, despite the absence of visible faults in the area. The aim of this geophysical research was to image weak zones within carbonates rocks, such as fractures and caverns, in the area where the archaeological site of Xochicalco is located, since these features are potential sources of instability for archaeological buildings.
3. Acquisition and Processing of GPR Data
For the geophysical measurement acquisition, the GSSI GPR system SIR-3000 with a 400 MHz monostatic shielded antenna was employed (Figure 2). The GPR measurements were conducted in front of Quetzalcoatl Temple covering a surface of 34 × 20 m. For 3D acquisition, 34 m-long parallel study lines were surveyed along a south–north orientation with lines spaced every 0.25 m. The trace interval and time window were 0.02 m and 100 ns, respectively.
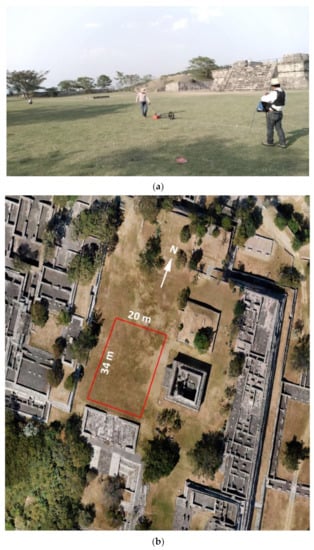
Figure 2.
In front of Quetzalcoatl Temple, 81 profiles spaced 0.25 m apart were acquired with a 400 MHz antenna. The orientation of the profiles is S–N (a). Aerial view of the Xochicalco archaeological site showing the surveyed area in front of Quetzalcoatl Temple, where 81 profiles spaced 0.25 m apart were acquired with a 400 MHz antenna; the orientation of the profiles is S–N (b).
For the initial processing of the GPR data, the software package of Radlab (written in MATLAB) developed at the Institut Terre et Environnement de Strasbourg and dedicated in-house MATLABcodes developed at the Applied Geophysics Lab. of the Technical University of Crete were utilized. The processing sequence involved time-zero shift, low-frequency removal or DC filtering (dewow), a background filter of 200 traces, band-pass filtering of 200–600 MHz, and, finally, amplitude gain (linear and/or exponential). We determined an average electromagnetic (EM) wave velocity of 0.095 m/ns by analyzing different diffraction hyperbolas, which indicated a soil with moderate humidity. For the three-dimensional (3D) presentation of GPR data, we used ReflexW software.
The initially processed GPR sections’ data were input into a multipath summation sequence approach, as described by Economou et al. [19], and involved the following processing steps for each of the GPR sections: (1) Application of constant-velocity F-K migrations; (2) estimation and assignment of a weighting factor for each migrated section, with which it contributes to the final stack; (3) weighted stacking of the time migrated sections; and (4) post-multipath summation time-varying spectral whitening of the stacked section.
The velocity range of the constant velocity migrations for the first processing step was set to 0.04–0.24 m/ns. The constant velocity value utilized for each migration was altered every 0.005 m/ns, which concluded with 33 constant velocity sections. Each constant-velocity migrated section was evaluated regarding the focusing of the diffractions. This was implemented by the estimation of the local slopes using the local plane-wave equation [28].
where P is the wave field, x and t are the space and time variables, and σ denotes the local slope. Sections with unfocused diffractions were expected to have higher standard deviation (std) values of the local slope distribution in comparison to the efficiently migrated sections, as the former included much more local slope values that are far from zero due to the diffraction branches energy not gathered to the apices. Let the reciprocal value of the std of the local slope distribution, si, be si′. If s′ and Gu are vectors containing all values of si′ and Gui, then Gu can be estimated by (Step 2):
The function Gu, based on Equation (2), is considered the vector containing the weights, one for each velocity value, with which each constant velocity migrated section contributes to the final stack implemented by:
where Ax,t,u is the migrated GPR section using a constant velocity value, u. Economou et al. [19] observed that the Gu function has a Gaussian-like shape, but it is still not a Gaussian. This means that after a minimum weight value at low-velocity values, followed by a maximum, a minimum occurs again as the weights become very low. After this second minimum, the weights start gaining higher values again. This is because over-migration, after a point, tends to transform the local slopes closer to zero, thus decreasing the std values. Therefore, an assessment of the weights must take place before multipath summation in order to choose the optimum velocity range, avoiding, at the same time, the use of all of the velocity values utilized, which would somewhat blur the result. An example for this is given below in the description of Figure 3. Within the weighted multipath summation section, Bw,x,t, the moving hyperbola branches, are expected to introduce lower energy in comparison to the apices. This concludes on processing Step 3. The final processing step involves time-varying amplitude spectral shaping, which is implemented in the t-f domain, using S-transform [29,30]. The main idea is to construct a reference amplitude spectrum, based on which the spectral shaping transforms the trace time-gated spectra to higher dominant frequency harmonics.
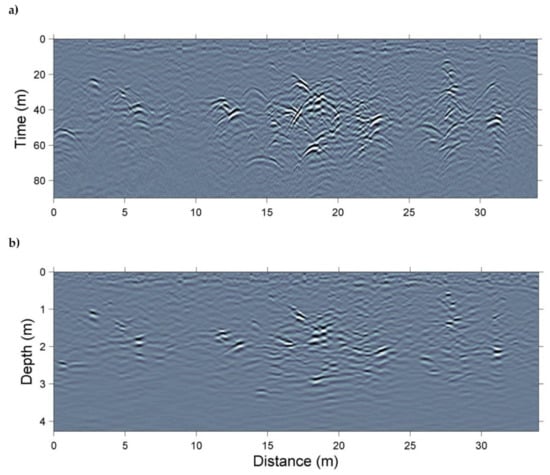
Figure 3.
A representative GPR section after initial processing (a). The data of this section after multipath summation and depth conversion with V = 0.095 m/ns (b).
More details on the implementation of the multipath summation methodology can be retrieved from [19].
4. GPR Imaging Results
A representative GPR section after the initial processing steps over a study line at the center of the grid is depicted in Figure 3a. By applying constant-velocity migration using all of the velocity values as depicted in the horizontal axis of Figure 4a, namely, from 0.04 to 0.24 m/ns, with a 0.005 m/ns step, the std of the local slopes of the migrated sections were calculated (Figure 4a). After linear detrending, the normalized inverse std values of the local slope distribution of each constant-velocity migrated section are shown in Figure 4b, using Equation (2). By assigning the specific weights of Figure 4b to each one of the constant-velocity migrated sections before stacking them, the stacking procedure for a range of velocities from 0.04 to 0.155 m/ns (Equation (3)) resulted in well-focused diffractions (comparison of Figure 3a,b), while on the contrary, blurriness from both the migration and the stacking procedure is evident. This can be circumvented by time-varying spectral whitening (Figure 5). The spectral whitening algorithm balances the amplitude spectrum in time gates of 1.5 times the duration of each trace in such away to achieve a dominant frequency up to 1.5 times its initial dominant frequency [23].
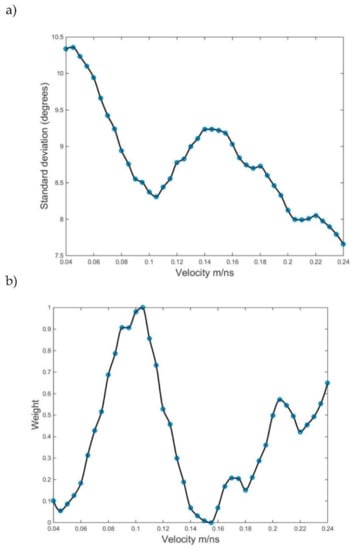
Figure 4.
The local slopes’ std values for each constant velocity migrated section (a) and the corresponding weights, evaluated using equation (2) after linear detrend, with which these sections contribute to the final stack of Figure 3b (b).
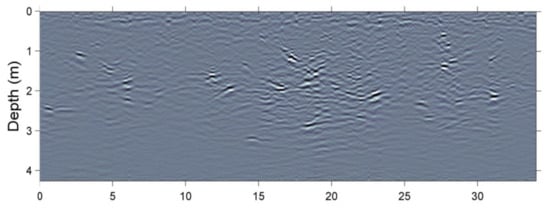
Figure 5.
The multipath summation depth section depicted in Figure 3b after time-varying spectral whitening.
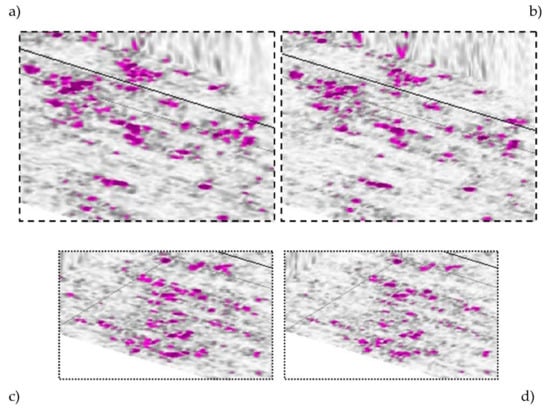
Each GPR section of the grid underwent the aforementioned procedure and the result of the proposed methodology is highlighted by selected envelope depth slices. Considering a mean velocity of 0.95 m/ns, we imaged depth slices at a depth of approximately 1.6 m (Figure 6) and 1.8 m (Figure 7). The depth slice at a depth of 1.6 m, shows the focused energy of the diffractions, indicating the linear response of fractures at this depth (Figure 6a). The blurriness that was introduced by the migration and the stacking procedure was avoided by time-varying spectral whitening, which increased the resolution of the multipath summation depth slice, delineating, in this way, limestone fractures in more detail (Figure 6b). A similar response was imaged at a depth of 1.8m by the proposed methodology (Figure 7a), with time-varying spectral whitening increasing the resolution in a similar and sufficient way. Figure 8 depicts the details of Figure 7. Time-varying spectral whitening, by increasing the temporal resolution, focused the signal’s strength in terms of time and depth, which resulted in the suppression of the relatively lower dominant frequency contribution, increasing, in this way, the linearity of the events of interest.
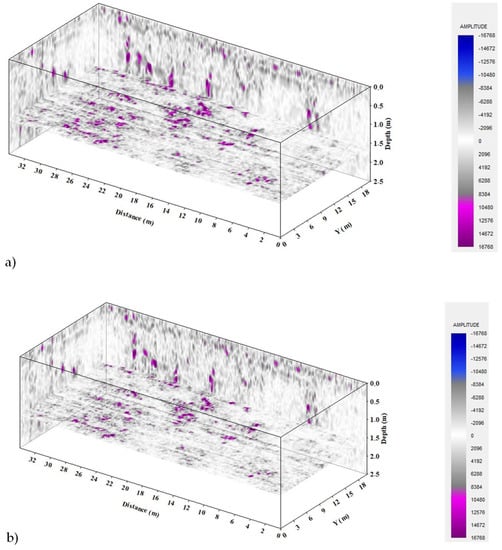
Figure 6.
Horizontal depth slices depicting the envelope at a depth of 1.6 m after multipath summation (a) and after time-varying spectral whitening (b).
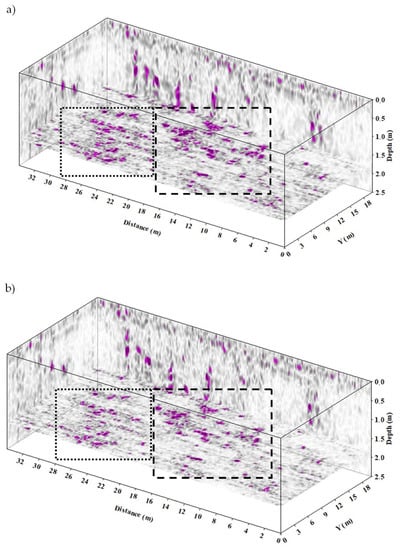
Figure 7.
Horizontal depth slices depicting the envelope at a depth of 1.8 m after multipath summation (a) and after time-varying spectral whitening (b). Color scale is the same as in Figure 6.
Even if the results of this methodology did not correspond to a specific velocity value, the desired diffraction focusing was implemented for almost all of the section. Moreover, this method avoids the drawback of the accidental involvement of diffraction multiples by the user, as it does not estimate migration velocities, but instead examines the degree of focusing.
We avoided a 3D migration approach because of the large computational time needed and the aliasing that may arise due to insufficient interval of the study lines. Thus, our 2D migration approach does not deal with out-of-plane diffraction energy. It is in our future plans, though, to create a similar methodology that considers diffraction as a 3D phenomenon.
5. Discussion
A multipath summation GPR imaging strategy was presented by Economou et al. [19], with the aim to focus the GPR sections with a large amount of scattered energy. We followed this methodology and applied it with a 3D imaging objective for data acquired in dense parallel study lines. We demonstrated the efficiency and applicability of this methodology for dense GPR data, as one of its main characteristics is the avoidance of a user-applied velocity analysis and a migration velocity model building, which was unfeasible for a large amount of data. With the aim of enhancing both the lateral and the temporal resolution of GPR sections, we applied this methodology, which focused the diffractions without the need to involve the estimation of a velocity model. Furthermore, it whitened the data to restore the signal’s attenuated high-frequency harmonics. The estimation of an efficient contribution of each constant velocity migrated section to a final stack is useful in a 3D imaging approach, as presented here, because the method automatically estimates the appropriate summation weights, leaving for the user the choice of the optimum velocity range in which stacking will occur for the whole data cube. Herein, for example, the velocity range of 0.04–0.155 m/ns was set the same for all sections, but with automatically estimated different weights for each velocity value and for each section.
Finally, automation is needed at two distinct points to reach a fully adaptive methodology. Namely, at the stage where the user chooses the optimum range of weights to be used for stacking, as mentioned above, and at the spectral whitening stage, where the user should interfere, among other parameters, in the desired shape of the results’ amplitude spectrum. For the former, a procedure is needed that avoids unnecessary migrations and reaches the optimum weight range adaptively, while for the latter, adaptive spectral scaling approaches should be involved.
The scope of this field work was to identify weak zones in the carbonate rocks above which the Quetzalcoatl Temple was built. Using a 2D imaging strategy, effort was made to image possible fractures and their form in three dimensions. The detected linear anomalies are attributed to possible fractures that may have affected, or may further affect in the future, the stability of the remains on the surface. Further geophysical and geotechnical research should be applied in order to fully assess the stability of the base rock and the possible effects on the remains themselves.
6. Conclusions
The objective herein was to image weak zones within the base rock at the archeological site of Xochicalco in Mexico, which are potential sources of the degradation of archeological remains. The GPR method imaged linear events attributed to possible fractures in the carbonate rocks in front of the Quetzalcoatl Temple. Parallel study lines were surveyed on a grid of 34 × 20 m. We demonstrated the use of an imaging strategy for diffraction focusing of 2D zero-offset GPR data without the need to explicitly build either several 2D models or one 3D model with migration velocity values, in order to image fracture anomalies in three dimensions. Despite having a high degree of adaptiveness, it requires the user’s interference for both the choice of the multipath summation stacking weights and the spectral whitening parameters. The last processing acts as the final step for deblurring the migration and stacking effects. The utilized method efficiently focused the scattered energy and enhanced the lateral continuity of events, aiding, in this way, the establishment of preliminary conclusions for this ongoing project. At depths of 1.6 m and 1.8 m, several linear events attributed to fractures were imaged. Together with a lack of visible faults in the area, they initially indicate that cracks on the remaining walls of the Quetzalcoatl Temple, after a large earthquake in 2017, are possibly prone to the instability of carbonate rocks, which denotes the need for further geophysical and geotechnical investigation.
Author Contributions
Methodology N.E., M.B., and J.O.-R.; software, N.E. and M.B.; validation, N.E., M.B., and J.O.-R.; data curation, M.B. and J.O.-R.; writing—original draft preparation, N.E., M.B., and J.O.-R.; writing—review and editing, N.E., M.B., and J.O.-R.; visualization, N.E. and M.B.; supervision, M.B.; project administration, J.O.-R.; funding acquisition, J.O.-R. All authors have read and agreed to the published version of the manuscript.
Funding
This research received no external funding.
Institutional Review Board Statement
Not applicable.
Informed Consent Statement
Not applicable.
Data Availability Statement
Data are available from the authors upon request.
Acknowledgments
The authors thank those responsible for the Xochicalco site during our survey, Arqlgo. José Cuauhtli Alejandro Medina Romero and the Director of Centro INAH Morelos, †Maria Isabel Campos Goenaga. The third author (José Ortega) thanks the Centre National de la Recherche Scientifique (CNRS/ITES UMR 7063) and EOST/Strasbourg University for the financial support to visit the ITES laboratory several times.
Conflicts of Interest
The authors declare no conflict of interest. They do not know of any competing financial interests or personal relationships that could have appeared to influence the work reported in this paper.
References
- Annan, A.P.; Davis, J.L.; Gendzwill, D. Radar soundingin potash mines, Saskatchewan, Canada. Geophysics 1998, 53, 1556–1564. [Google Scholar] [CrossRef]
- Grasmueck, M.; Coll, M.; Eberli, G.P.; Pomar, K. Diffraction Imaging of Vertical Frac-tures and Karst with Full-resolution 3D GPR, Cassis Quarry, France. In Proceedings of the 72nd EAGE Conference and Exhibition Incorporating SPE EUROPEC 2010, Barcelona, Spain, 14–17 June 2010. [Google Scholar]
- Pipan, M.; Forte, E.; Guangyou, F.; Finetti, I. High resolution GPR imaging and joint characterization in limestone. Near Surf. Geophys. 2003, 1, 39–55. [Google Scholar] [CrossRef]
- Longoni, L.; Arosio, D.; Scaioni, M.; Papini, M.; Zanzi, L.; Roncella, R.; Brambilla, D. Surface and subsurface non-invasive investigations to improve the characterizationof a fractured rock mass. J. Geophys. Eng. 2012, 9, 461–472. [Google Scholar] [CrossRef]
- Heincke, B.; Green, A.G.; van derKruk, N.J.; Horstmeyer, H. Acquisition and process-ing strategies for 3D georadar surveying a region characterized by rugged topography. Geophysics 2005, 70, K53–K61. [Google Scholar] [CrossRef] [Green Version]
- Arosio, D.; Munda, S.; Zanzi, L. Quality control of stone blocks during quarrying ac-tivities. In Proceedings of the 2012 14th International Conference on Ground Penetrating Radar (GPR), Shanghai, China, 4–8 June 2012; pp. 822–826. [Google Scholar]
- Deparis, J.; Garambois, S. On the use of dispersive APVO GPR curves for thin-bedproperties estimation: Theory and application to fracture characterization. Geophysics 2009, 74, J1–J12. [Google Scholar] [CrossRef]
- McClymont, A.F.; Green, A.G.; Villamor, P.; Horstmeyer, H.; Grass, C.; Nobes, D.C. Characterization of the shallow structures of active fault zones using 3-D GPR data. J. Geophys. Res. 2008, 113, B10315. [Google Scholar] [CrossRef]
- Tsoflias, G.P.; Hoch, A. Investigating multi-polarization GPR wave transmission through thin layers: Implications for vertical fracture characterization. Geophys. Res. Lett. 2006, 33. [Google Scholar] [CrossRef] [Green Version]
- Grasmueck, M.; Weger, R.; Horstmayer, H. Full-resolution 3D GPR imaging. Geophysics 2005, 70, K12–K19. [Google Scholar] [CrossRef]
- Sava, C.; Biondi, B.; Etgen, J. Wave-equation migration velocity analysis by focusing diffractions and reflections. Geophysics 2005, 70, U19–U27. [Google Scholar] [CrossRef]
- Bradford, J.H. Measuring water content heterogeneity using multi-fold GPR with reflection tomography. Vadose Zone J. 2008, 7, 184–193. [Google Scholar] [CrossRef]
- Forte, E.; Pipan, M. Review of multi-offset GPR applications: Data acquisition, processing and analysis. Signal Process. 2017, 132, 210–220. [Google Scholar] [CrossRef]
- Özdemir, C.; Demirci, F.; Yilit, E.; Yilmaz, B. A review on migration methods in B-Scan Ground penetrating radar imaging. Hindawi Publ. Corp. Math. Probl. Eng. 2014, 2014, 1–16. [Google Scholar] [CrossRef] [Green Version]
- Smitha, N.; Ullas Bharadwaj, D.R.; Abilash, S.; Sridhara, S.; Singh, V. Kirchhoff and F-K migration to focus ground penetrating radar images. Geo-Engineering 2016, 7, 4. [Google Scholar] [CrossRef] [Green Version]
- Dou, Q.; Wei, L.; Magee, D.R.; Cohn, A.G. Real-Time Hyperbola Recognition and Fitting in GPR Data. IEEE Trans. Geosci. Remote Sens. 2017, 55, 51–62. [Google Scholar] [CrossRef] [Green Version]
- Merzlikin, D.; Fomel, S. Analytical path-summation imaging of seismic diffractions. Geophysics 2017, 82, S51–S59. [Google Scholar] [CrossRef]
- St Clair, J.; Holbrook, W.S. Measuring snow water equivalent from common-offset GPR records through mi-gration velocity analysis. Cryosphere 2017, 11, 2997–3009. [Google Scholar] [CrossRef] [Green Version]
- Economou, N.; Vafidis, A.; Bano, M.; Hamdan, H.; Ortega-Ramirez, J. Ground-penetrating radar data diffraction focusing without a velocity model. Geophysics 2020, 85, 1–12. [Google Scholar] [CrossRef]
- Ortega-Ramírez, J.; Bano, M.; Cordero-Arce, M.T.; Villa-Alvarado, L.A.; Chavez Fraga, C. Application of non-invasive geophysical methods (GPR and ERT) to locate the ancient foundations of the first cathedral of Puebla, Mexico: A case study. J. Appl. Geophys. 2020, 174, 103958. [Google Scholar] [CrossRef]
- Diz-Mellado, E.; Mascort-Albea, E.J.; Romero-Hernández, R.; Galan-Marin, C.; Rivera-Gomez, C.; Ruiz-Jaramillo, J.; Jaramillo-Morilla, A. Non-destructive testing and Finite Element Method integrated procedure for heritage diagnosis: The Seville Cathedral case study. J. Build. Eng. 2021, 37, 102134. [Google Scholar] [CrossRef]
- Lampropoulos, K.C.; Moropoulou, A.; Korres, M. Ground penetrating radar prospection of the construction phases of the Holy Aedicula of the Holy Sepulchre in correlation with architectural analysis. Constr. Build. Mater. 2017, 155, 307–322. [Google Scholar] [CrossRef]
- Nagao, D. An Interconnected World? Evidence of Interaction in the Arts of EpiclassicCacaxtla and Xochicalco, Mexico. Ph.D. Thesis, Columbia University, New York, NY, USA, 2014; 535p. [Google Scholar]
- Hirth, K. Xochicalco: Urban Growth ans State Formation in Central Mexico. Science 1984, 225, 579–586. [Google Scholar] [CrossRef] [PubMed]
- García, E. Modificaciones al Sistema de Clasificación Climática de Köeppen; Instituto de Geografía, UNAM: Mexico City, Mexico, 2004; 96p., ISBN 970-32-1010-4. [Google Scholar]
- Ruiz-Violante, A.; Basañez-Loyola, M.A. La Formacion Xochicalco, unidad estratigráfica del Albiano-Cenomanianoenlos Estados de Morelos, Guerrero y México. In Proceedings of the XII Convención Geológica Nacional, Sociedad Geológica Mexicana, Toluca, México, 1994; pp. 161–162. [Google Scholar]
- Fries, C., Jr. Geología del Estado de Morelos y de partes adyacentes de México y Guerrero, Región central Meridional de México. Boletín Inst. Geol. 1960, 60, 236. [Google Scholar]
- Claerbout, J.F. Earth Soundings Analysis: Processing Versus Inversion; Blackwell Scientific Publications: Stanford, CA, USA, 2004. [Google Scholar]
- Economou, N.; Vafidis, A. Spectral balancing of GPR data using time-variant bandwidth in t-f domain. Geophysics 2010, 75, J19–J27. [Google Scholar] [CrossRef]
- Economou, N.; Vafidis, A. GPR data time varying deconvolution by kurtosis maximization. J. Appl. Geophys. 2012, 81, 117–121. [Google Scholar] [CrossRef]
Publisher’s Note: MDPI stays neutral with regard to jurisdictional claims in published maps and institutional affiliations. |
© 2021 by the authors. Licensee MDPI, Basel, Switzerland. This article is an open access article distributed under the terms and conditions of the Creative Commons Attribution (CC BY) license (https://creativecommons.org/licenses/by/4.0/).