1. Introduction
The interpretation of Ground Penetrating Radar (GPR) data collected from archaeological surveys using the common-offset systems is often a challenging task that requires time, experience, and skill. The collected GPR data from such environments are complex. Two-dimensional reflection profiles called B-scans are collected. These are tomographic images exhibiting reflections from the near-surface layers that can be highly inhomogeneous and disturbed by multiple anthropogenic activities that took place during different historical periods [
1]. As a result, B-scans are complex and non-intuitive to interpret, making it difficult to identify the reflections related to the archaeological context. Further, the archaeological surveys with GPR follow more or less the same approach that is now established as a standard. The latter involves processing the collected survey grids by applying standard methods and techniques at the collected GPR B-scans to remove noise while enhancing reflections from the subsurface [
2,
3]. Then, a pseudo 3D or 2.5D approach is followed to extract amplitude maps of the subsurface called C-scans. Details on the process of producing C-scans are given in [
4]. The next step is to browse the resulted C-scans studying the presented reflections and interpreting the reflectors. What can follow is to apply image rendering techniques such as the iso-amplitude surface to generate 3D models of the recorded amplitude values [
4,
5] using software such as VOXLER, which might provide a better understanding of the distribution of the reflections in the space. In the next step, selected C-scans that describe the subsurface are imported into a Geographic Information System (GIS), where the important reflections can be digitized manually. The latter allows the production of 2D maps to visualize the most important findings. The above-mentioned process can produce useful insights on each GPR survey applied. However, several drawbacks and pitfalls exist that might have a negative impact on data interpretation.
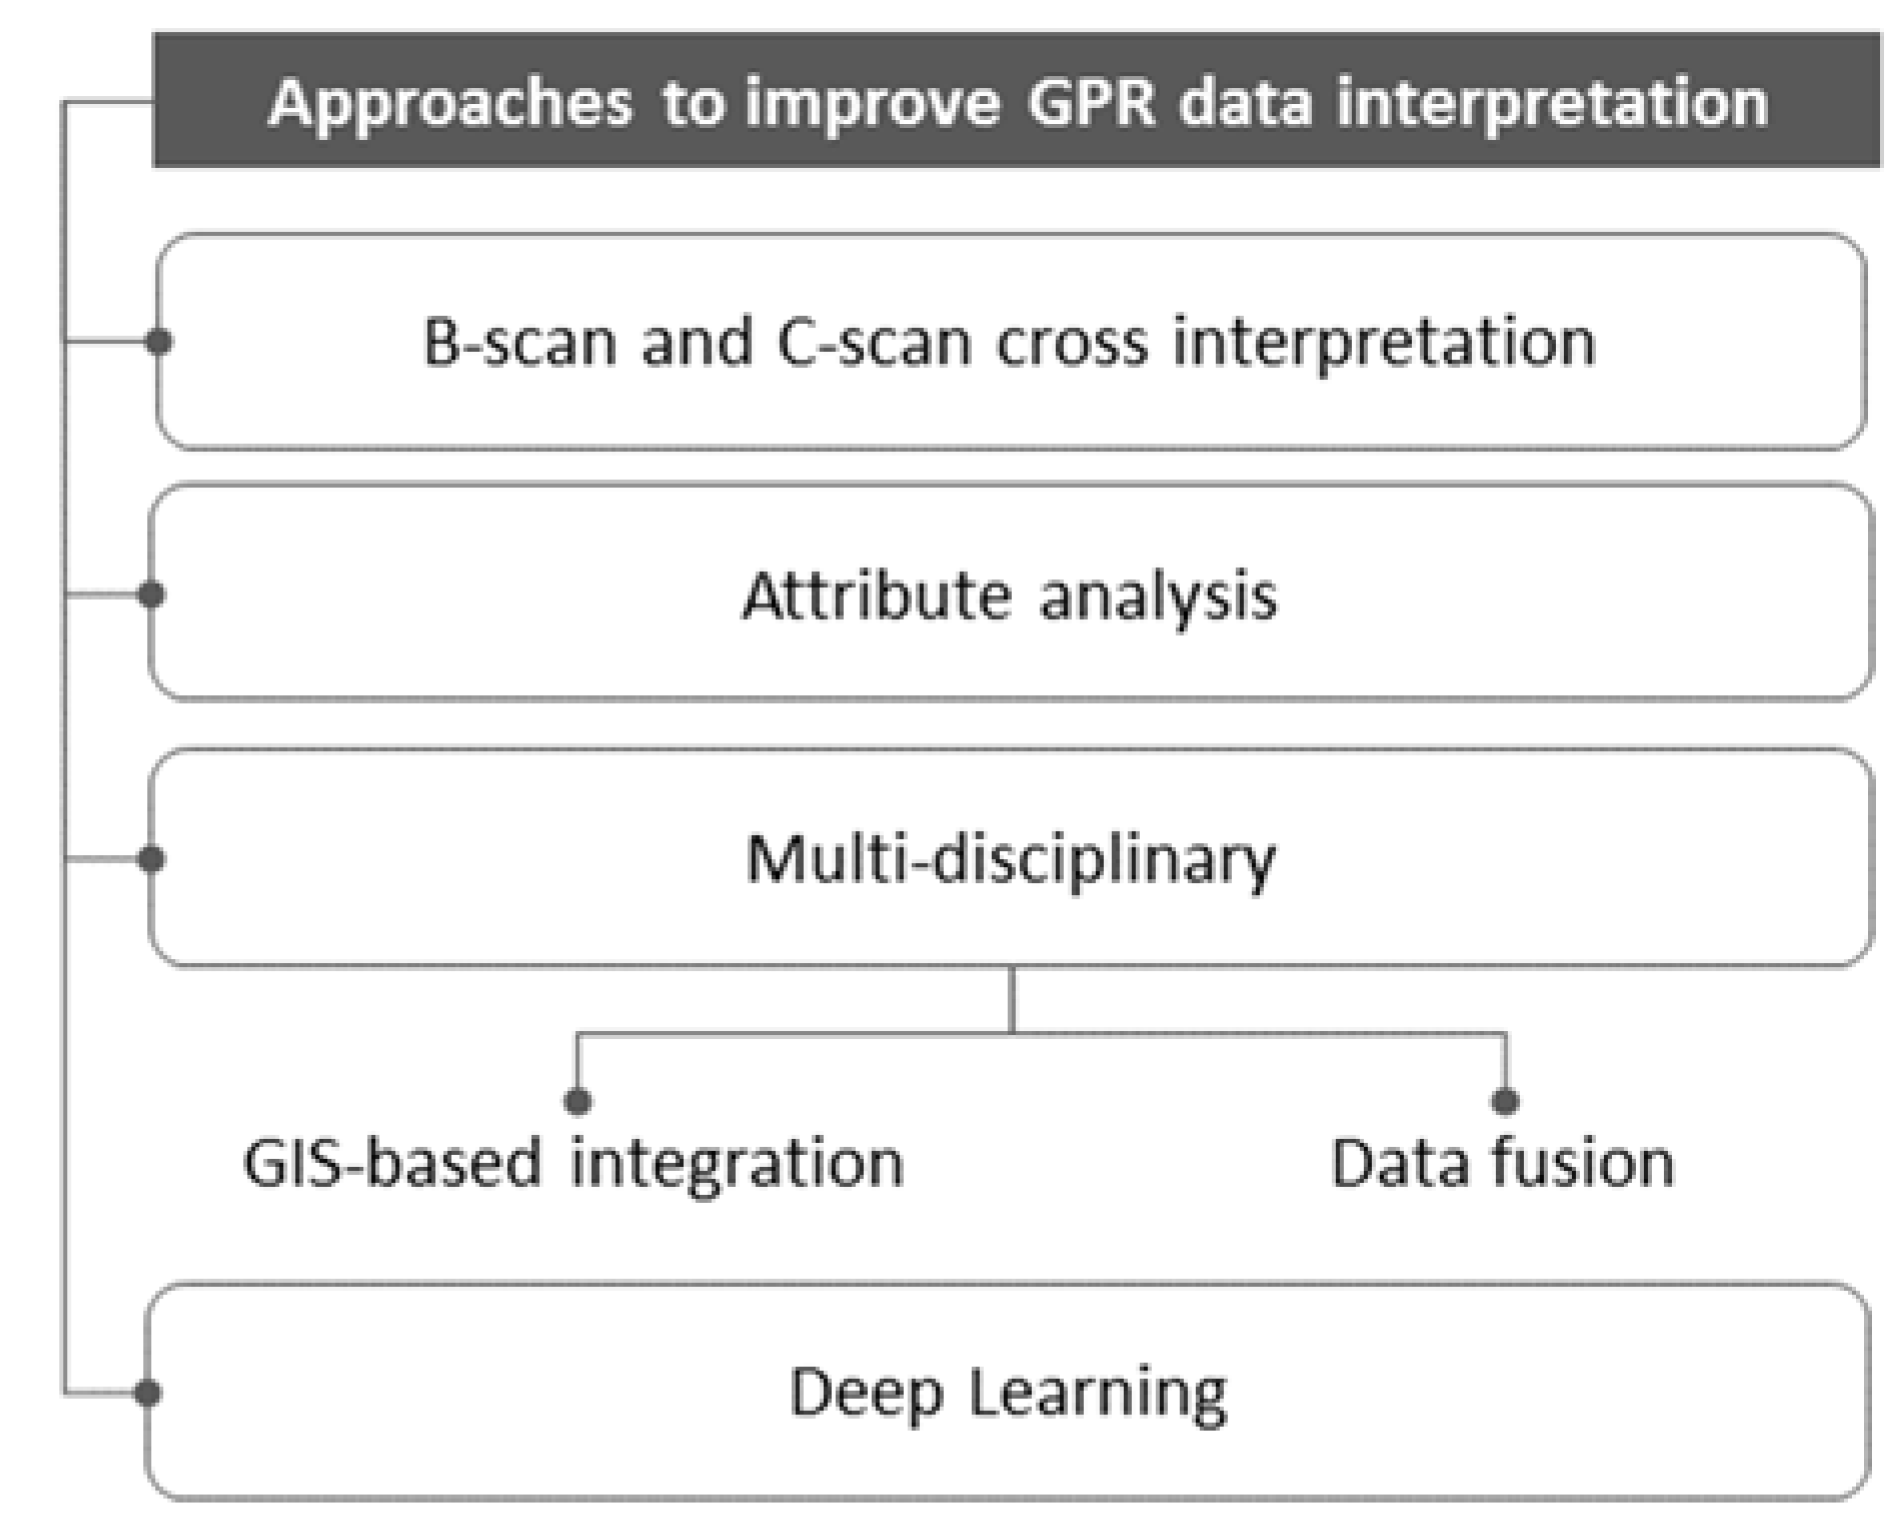
One pitfall is related to the fact that B-scans are often bypassed during interpretation. This may lead to losing information that cannot be projected in the plan view of the final images. Another pitfall is that the standard processes applied on GPR data focus only on the amplitudes of the reflection. Hence, the interpretation is limited only to information that can be described by the reflected signal’s amplitude, which cannot entirely describe the complexity of the GPR data. An additional issue to consider is that the targets might be invisible to the GPR instrumentation, meaning that the contrast of their physical properties compared to the ones of the surrounding media is not detectable by the GPR method. With the downsides mentioned earlier in mind, this article reviews approaches that help improve the data interpretability, overcoming limitations of the conventional interpretation approach. An overview of the approaches is presented in
Figure 1. Last, the automatic data interpretation with Deep Learning (DL) is discussed as an approach to assist GPR data interpretation and an example of Convolutional Neural Networks’ (CNNs) application to classify GPR C-scans collected from two archaeological sites is presented.
2. GPR Data Cross Interpretation
A downside discussed in Reference [
6] when following the standard process is that the interpretation focuses on the C-scans, often ignoring B-scans entirely, which for some archaeological case studies might lead to losing important information related to the targets’ properties (e.g., actual size). The C-scans only show projections of the recorded reflections along the horizontal plane. So, in the case of dipping layers, the target may be either lost or misplaced. Hence, an integrated interpretation using topographically corrected B-scans along with the C-scans is mandatory to understand the true nature of the recorded reflections. Further, B-scans can provide information regarding the polarity changes of the waveforms, which is useful in identifying voids or tombs [
6,
7,
8]. Further, B-scans can provide information regarding the conservation state of the buried structures, with wall erosion appearing as non-reflective events in the data [
6]. This non-reflective event is caused by depolarization of EM waves on the surface, and when it happens, targets such as walls will more likely be invisible if the standard approach for processing and interpretation is followed [
9]. Other examples that show the importance of integrating B-scans, C-scans, and iso-surface amplitudes for data interpretation are presented in Reference [
10].
3. Attribute Analysis
Attribute analysis was initially performed in seismic data to enhance target detection and improve their interpretability. Although it has not yet fully been incorporated in GPR data processing routines from archaeological prospection, examples found in the literature show a promising lead in improving data imaging. The main concept is to calculate specific attributes aside from the conventional instantaneous amplitude, to highlight archaeological targets that are less sensitive to amplitude changes and might end up being invisible. This analysis is target-directed, meaning that more effort is required to find the most appropriate ones. A few examples found in the related literature are presented in the following paragraphs.
Several attributes are calculated and studied in Reference [
11] aiming to improve interpretation on complex datasets that exhibit archaeological remains of the Roman period buried at different depths. This approach calculates the attributes under investigation in the volumetric GPR data after applying denoising and other processing techniques to improve the signal-to-noise ratio. Namely, the tested attributes are the instantaneous amplitude, the cosine of instantaneous phase, edge detection attributes, the dominant frequency, the similarity and the energy. Their results showed that each attribute highlights specific information. Hence, performing a target-oriented and multi-attribute approach along with the standard process is suggested. In a similar study, RMS amplitude, average peak amplitude, instantaneous phase, and maximum peak time are extracted and compared to characterize an ancient wall, a kiln, and a tomb [
12]. Again, the results indicate that attribute selection should be target-oriented.
In another study, the energy, coherency, and similarity attributes are calculated to interpret data collected with a 3D radar system at two medieval chapels [
13]. The results show that coherency and similarity can improve the interpretability of the data and target detection as information invisible to the standard amplitude maps was visualized, revealing more details on detected tombs and burial chambers along with their conservation state. Energy and similarity also helped improve the data interpretability of Roman structural remains found at deeper levels and under complex subsurface layers [
13]. Excavations that followed were in agreement with the resulted GPR interpretation. Additionally, small targets of a prehistoric period settlement were also enhanced by an integrated multi-attribute approach of instantaneous amplitude, energy, and similarity, which were visualized using iso-surfaces [
14]. Excavations that followed validated the GPR interpretation. In another example, the coherence attribute and the conventional instantaneous amplitude are compared and fused into a single image, enhancing the interpretation of data collected with a 3D GPR system from three Scandinavian Iron age sites exhibiting trenches, pitfalls, and postholes [
15]. Some of the sites are multiphased exhibiting archaeological remains that are either Roman or Medieval. The authors used a simple normal blending method and contrast normalization to fuse the images. Finally, an integrated instantaneous attribute approach is performed in Reference [
16], highlighting patterns of an ancient road.
A different set of attributes utilizing image texture analysis is extracted from GPR data collected in three archaeological sites in Italy to characterize targets of different historical periods [
17]. These are textural attributes based on the gray-level co-occurrence matrix, namely contrast, homogeneity, energy, and entropy. This approach improved pattern discrimination of the observed targets as well as interpretability of the complex environment when combined displays of the calculated attributes are employed.
4. Multi-Disciplinary Approach
In this section, integrated approaches applied in archaeological prospection are reviewed. In these approaches, the conventionally processed GPR data are combined with information acquired from data collected on the same area by different sensors and methods. This multi-disciplinary approach can affect the GPR interpretation in three ways. First, it adds information invisible to the GPR system. Second, the added information increases the understanding of the observed reflections, and third, this information (e.g., ground control points from excavations) can be used for ground truth. The fusion of the various types of data and information is performed in two different ways that are described in the following paragraphs. The first is using a platform such as GIS to project and visualize the various data holistically at a common positioning system. The second embeds the useful information by applying certain methods and techniques to create space that can be an image or a model.
4.1. GIS-Based Integration
The multi-disciplinary approach is gaining increasing popularity in archaeological prospection as it helps the understanding of the complex buried past. Several studies exist in the recent literature showing improvements in GPR data interpretability by identifying some targets that are difficult to detect solely when following the conventional approach described in the introduction of this article. An example is the identification of ancient roads at the archeological site of Naxos in Sicily that were imprinted as linear fragments in the resulted GPR C-scans [
18]. Their interpretation was only possible when the corresponding C-scans were superimposed in the ancient city’s reconstructed plan and aerial photo. Another similar example is related to the identification of anomalies as part of a Roman villa when superimposed to an older aerial photo [
19]. Additionally, several anomalies observed with data collected from a GPR survey at the necropolis in Lecce were easier to interpret when the C-scans were georeferenced and superimposed in the ancient city map [
8]. GPR interpretation of a structural complex was also enhanced by superimposing the data collected at the Ancient Mantineia to an old excavation map [
20]. In another example, GPR and Terrestrial Light Detection and Ranging (T-LiDAR) techniques were employed, combining in this way information ”visible” from the surface and the ”invisible” one, in order to visualize the buried Roman structures detected from GPR [
21].
In the studies mentioned above, the GPR data were combined with spatial information on the surface as well as archaeological information obtained from surface investigations, ancient sources, and excavations. Other studies employed manifold geophysics, a prospection approach that uses multiple geophysical methods to survey the area under investigation [
22]. The effectiveness of using several geophysical methods is shown in Reference [
23], where magnetics, EM, and GPR were employed to survey a Neolithic settlement. GPR could map better houses but it could not spot ditches or burned areas revealed by magnetics, while EM gave information that helped understand settlement limits. This information was extracted by superimposing and comparing georeferenced images of each method that were imported into GIS. More examples of this approach showing the contribution and limitations of each sensor involved in similar Neolithic settlements are presented and discussed in references [
24,
25]. Other studies included geochemical methods to understand better and characterize the archaeological remains [
26,
27]. Further, the integration of multiple sensors and hence their information can lead to creating a holistic 3D model, being more immersive in reconstructing the past [
28,
29].
4.2. Data Fusion
Data fusion in archaeological prospection is an alternative approach for combining quantitative information acquired from different sensors employed in geophysical methods and remote sensing techniques. This is performed by mainly applying statistical methods and transforms to project the different information of each sensor in the same space. The main challenge of this approach is to find effective methods in transforming the various data into combinable representations. An early attempt shows improvements in visualizing the depth, location, and geometry of archaeological targets measured by GPR, magnetic and dipole-dipole geoelectric methods, where the integration of normalized data were performed into a shared space [
30]. Other methods, commonly applied in image analysis and computer vision, are explored in Reference [
31] to describe more complex targets measured by GPR, magnetic gradiometry, electrical resistivity, magnetic susceptibility, soil conductivity, and aerial thermography. The results revealed the limitations and benefits of each method while showing the potential to improve data interpretation. Similar studies, where integration methods are compared, are conducted using synthetic data [
32], real data measured by multiple geophysical methods from different sites [
33], or both synthetic and real data [
34]. Other attempts involved developing a methodology that integrates GPR data with multispectral satellite images to enhance the interpretability of detected archaeological targets in the near-surface layers [
35,
36]. The developed methodology is based on a regression model aiming to correlate GPR and ground spectroradiometer data using the vegetation indices that are subsequently projected on high resolution image of the area of interest. The proposed methodology is tested using data collected from a Neolithic tell in eastern Hungary. Linear regression [
35] and Bayesian Neural Networks (BNNs) [
36] are examined with the former showing more potential. Further, the potential of 3D data fusion following a multi-disciplinary approach is discussed in Reference [
37].
5. Deep Learning Algorithms to Interpret GPR Data
The automatic interpretation of GPR data from archaeological prospection is rather an unexplored but emerging research topic due to the recent developments of Deep Learning (DL) algorithms. Especially, the Convolutional Neural Networks (CNNs) are effective in performing various computer vision tasks like classification, object detection, and image segmentation [
38]. These tasks can be useful in the GPR data interpretation process to identify targets faster and help to discriminate complex patterns that characterize the GPR images. CNNs are based on representation learning [
39], where important information, called features, is extracted automatically from the data. The latter is the main difference over traditional Machine Learning (ML) algorithms, where the features are handcrafted and extracted manually. A semi-automatic approach following the traditional ML methods is given in Reference [
40], where the geometry of the interpreted anomalies is extracted and visualized in 3D. However, this method is found to be sensitive to noise and requires preprocessing steps, including manual interpretation.
Few studies exist in the literature exploring the automatic GPR data feature extraction capability of DL algorithms. An example utilizes a modification of CNNs, known as Fully Convolutional Networks (FCNs), that performs image segmentation through the U-net architecture [
41]. In this study, the trained model takes as an input a GPR C-scan and outputs the linear features in segments that are attributed to structures. The results show high potential in detecting linear features compared to the manual interpretation performed in GIS. However, the authors mention limitations related to challenging training network processes and requiring a large amount of data.
Even though similar studies for archeological prospection are currently lacking, there are some interesting examples that use GPR data derived from civil engineering applications, which show that DL is a promising direction worth investigating. In some of these examples, classification of cavities, pipes, manholes, and subsoil background from urban streets is performed, using as CNNs’ training data both B-scans and C-scans [
42], a combined representation of B-scans and C-scans [
43], and 3D data [
44]. Other approaches use object detection algorithms based on CNNs to locate rebars in concrete [
45], pavement distress [
46], and internal defects in tunnel lining [
47]. The above-mentioned examples give an insight into the capabilities of the various CNN-based algorithms and must be adapted to GPR data from archaeological prospection.
6. CNN Application to GPR Data
In this example, the application of CNNs using AlexNet architecture [
48] is presented and evaluated as a tool that provides useful insights, contributes to data interpretation, and classifies ancient, buried structures from GPR C-scans.
6.1. Dataset Construction
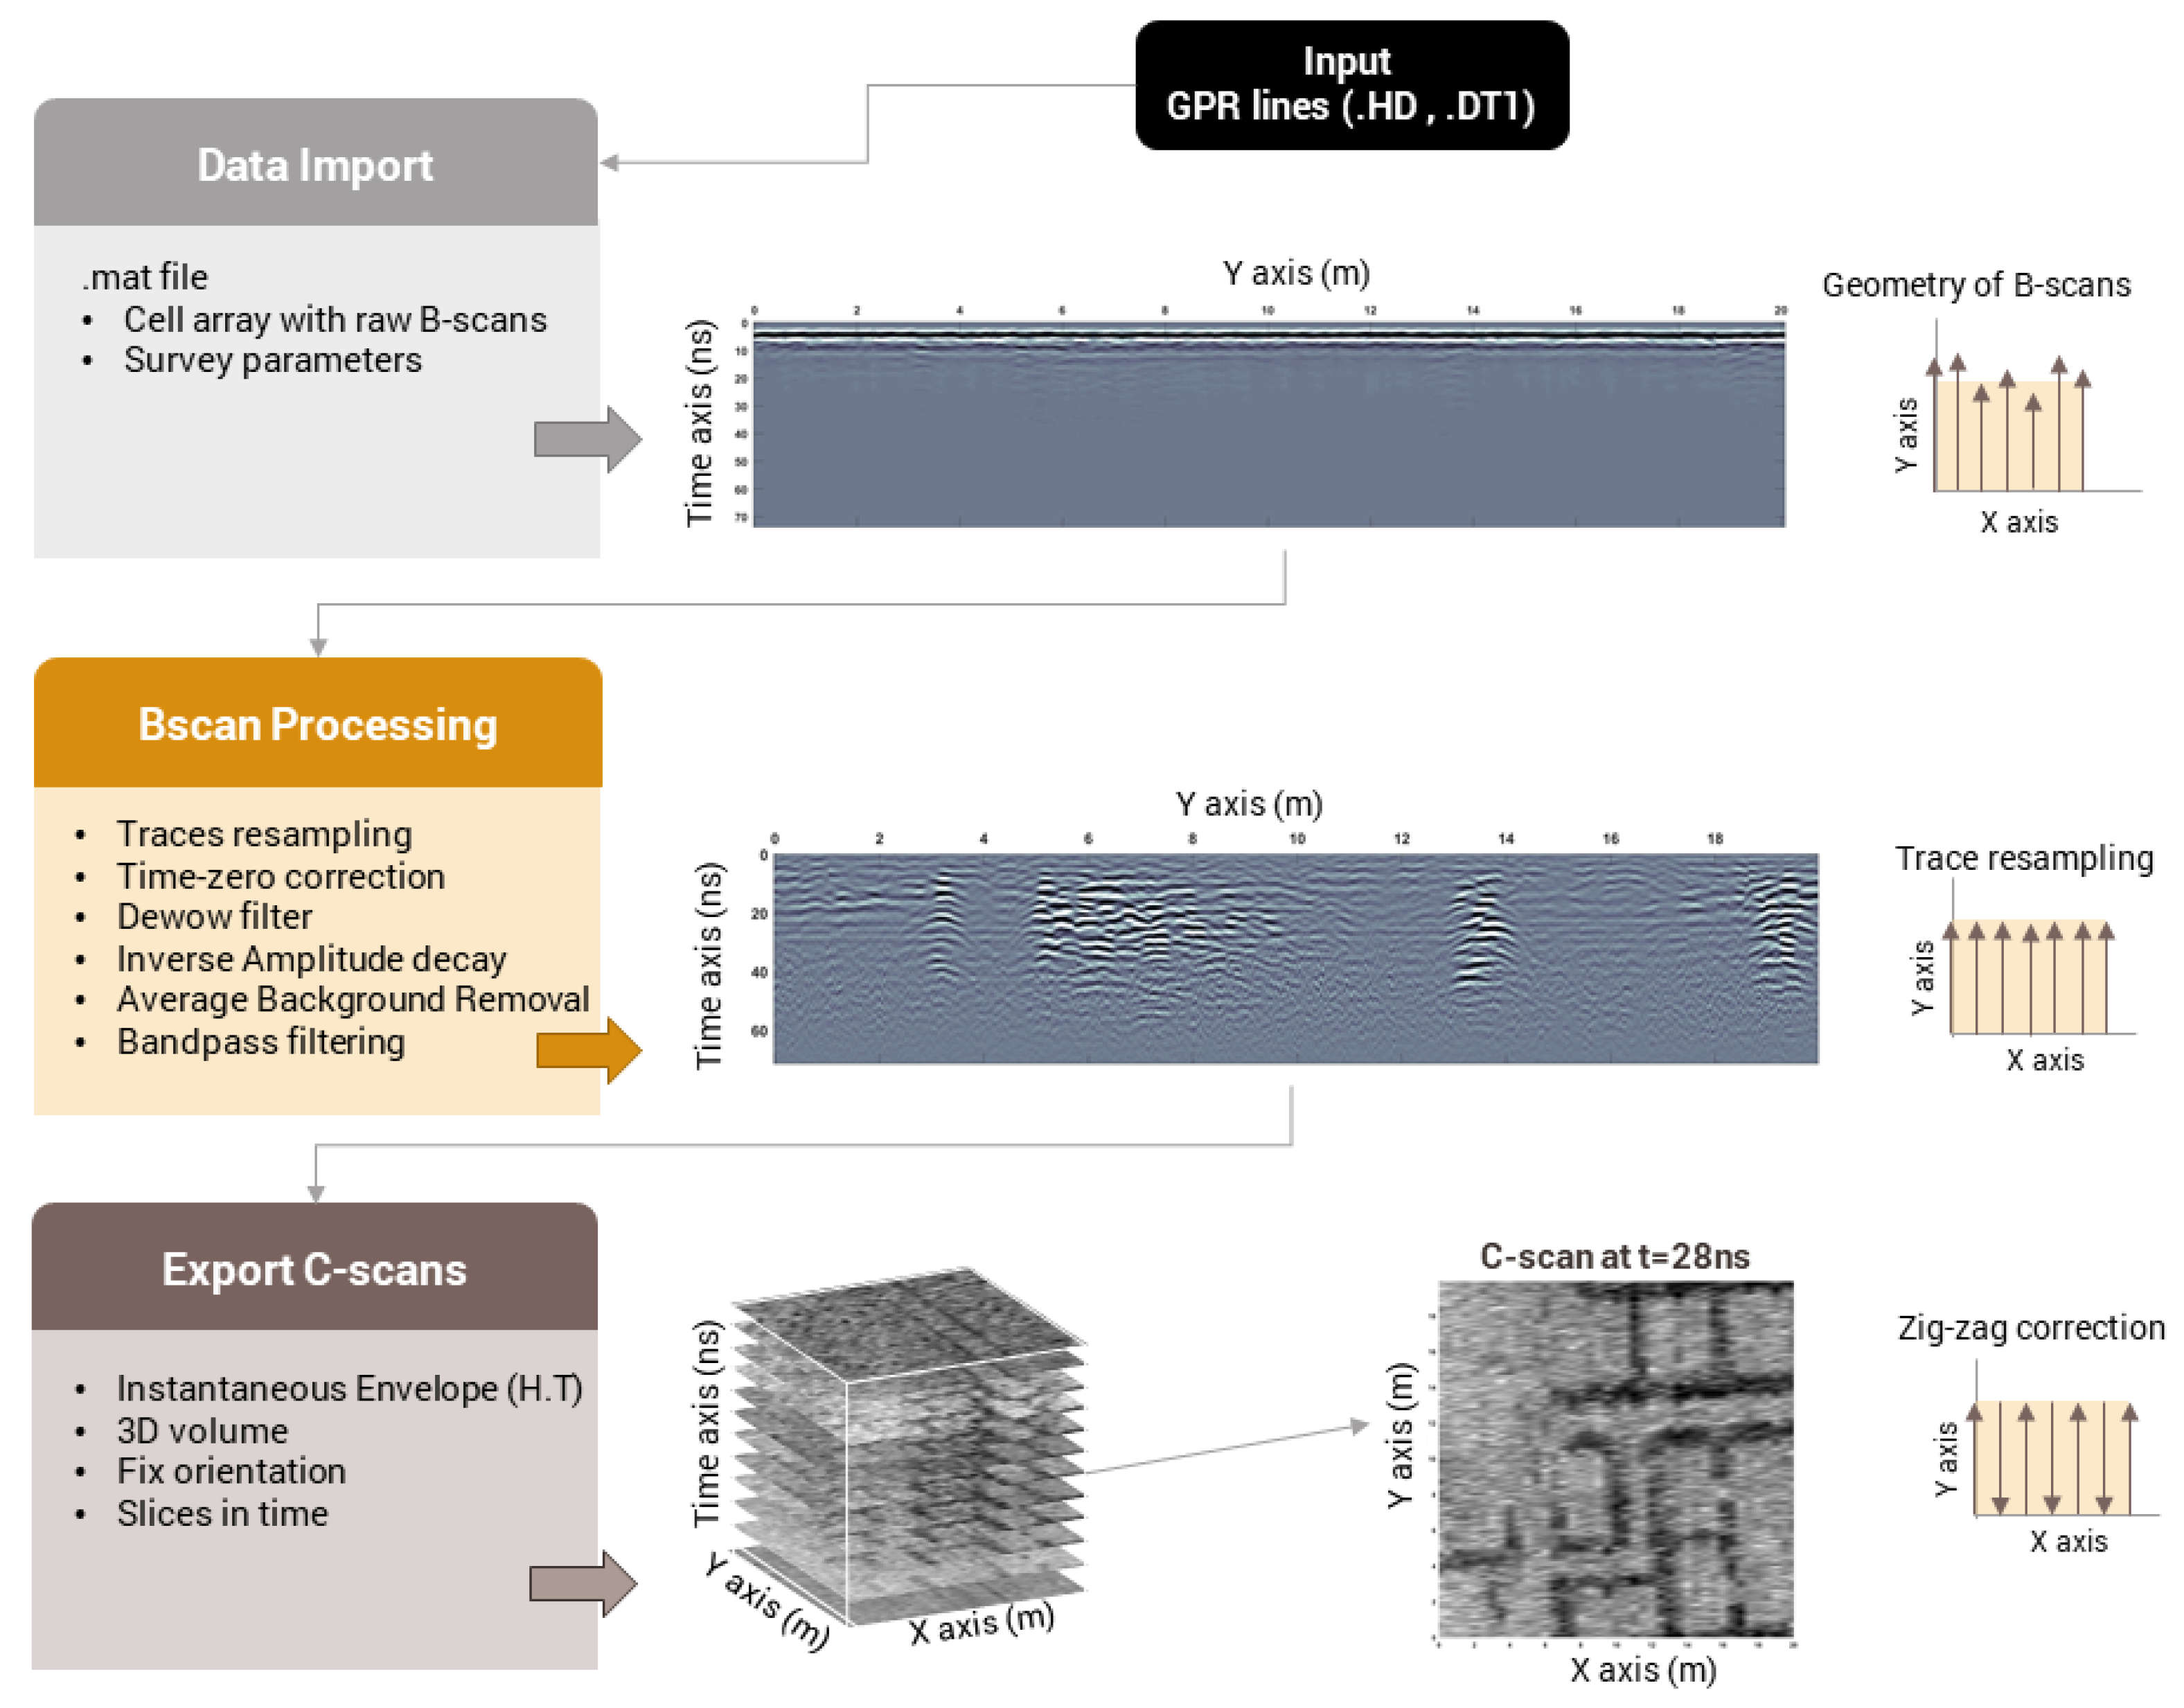
The training datasets were constructed from scratch using data collected from several archaeological sites, 50 of them being located in Greece, 1 in Cyprus, and 1 in Naxos, Sicily. Data collection was conducted under the framework of research projects of the Laboratory of Geophysical-Satellite Remote Sensing and Archaeo-environment (GeoSatReSeArch Lab), Institute for Mediterranean Studies - Foundation for Research and Technology Hellas (IMS-FORTH), Rethymno, Greece. All data were collected using the Noggin smart cart system, equipped with a 250 MHz antenna. The data were processed in MATLAB following standard methods and techniques, and C-scans were extracted (
Figure 2). A preprocessing step was then followed by applying an overlapping sliding window to crop square subregions of selected C-scans. This step was mandatory in order to increase the number of images used for training. For the classification, three classes were defined based on dominant features observed in the data: unidentified geophysical anomalies, structures, and noise in stripe form. In total, 18,375 examples were selected manually, 6125 per class. One question raised was how to split the selected examples into a training and test set. For this reason, two datasets (A and B) were defined, each following a different splitting approach to examine which one leads to better generalization. For dataset A, the test set examples were derived exclusively from a single archaeological site, while for dataset B, the examples were split into training and test sets randomly.
6.2. Training AlexNet and Testing the Generalization
The AlexNet implementation and training were performed in Python using the Tensorflow library and Keras API. For training, the Stochastic Gradient Descent (SGD) with momentum was used. In order to improve performance, Batch Normalization (BN) [
49] was applied after each convolutional layer. Dropout [
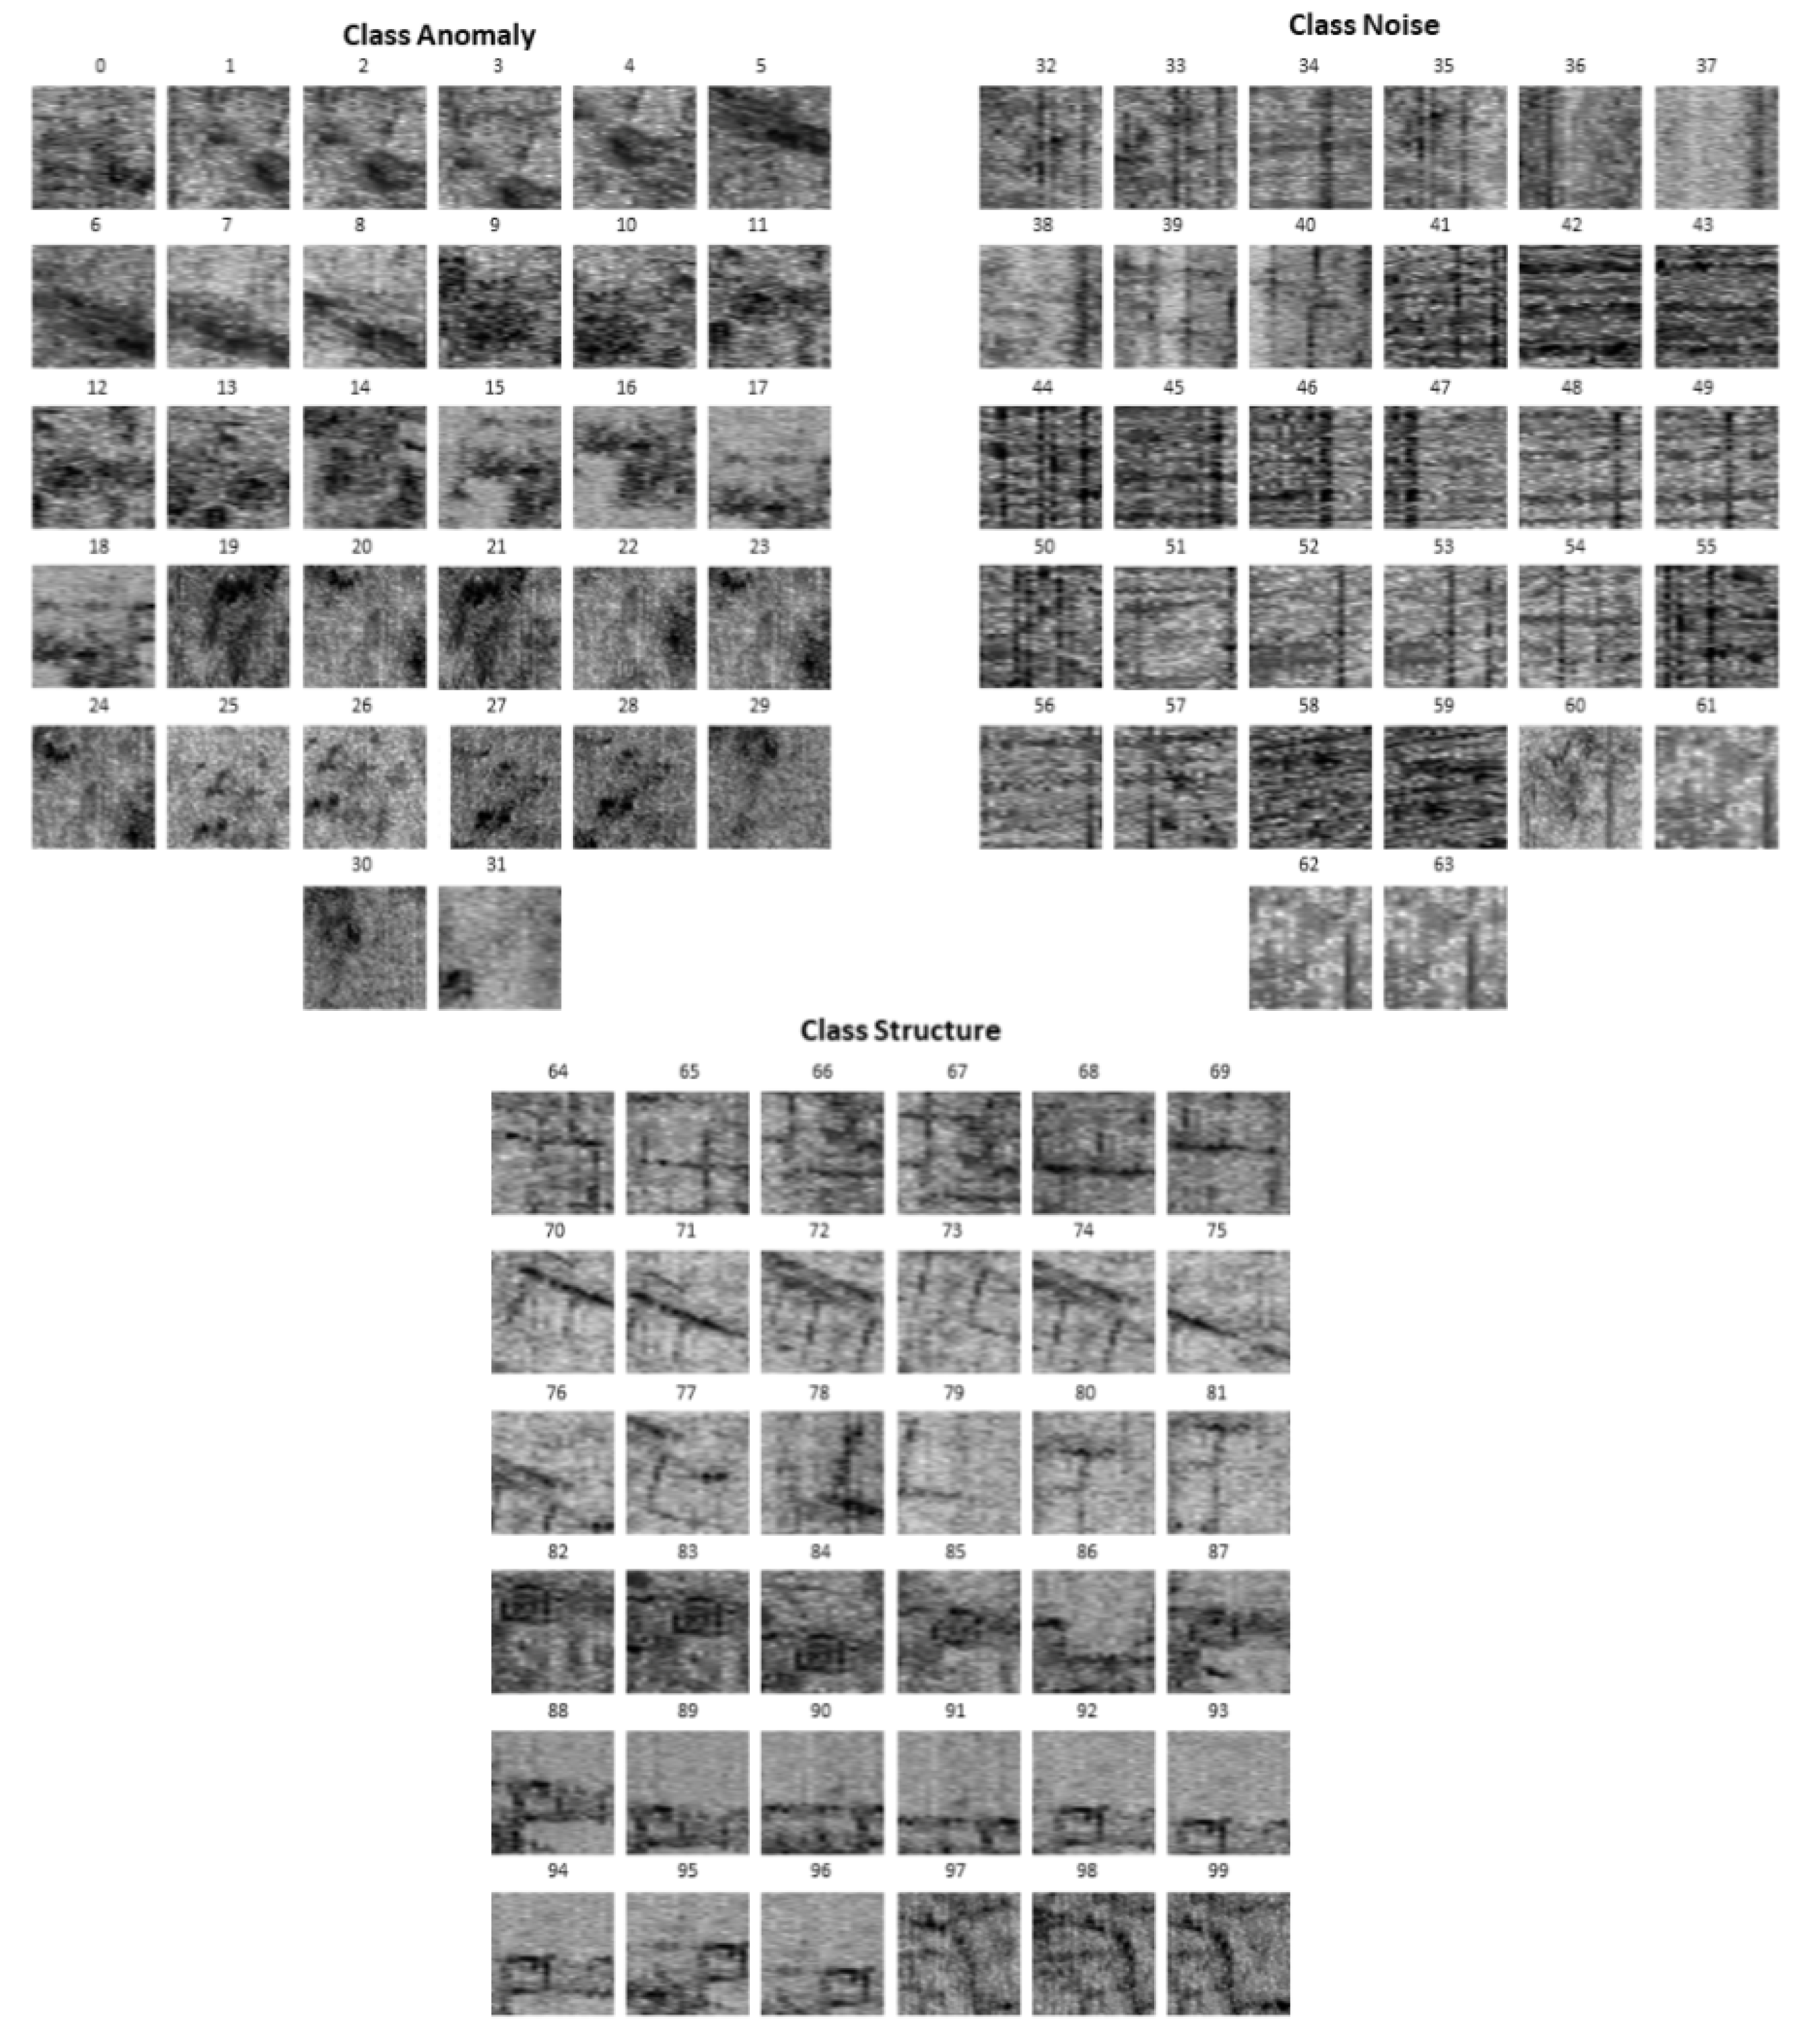
50] was applied with a rate of 0.5 after the first two fully connected layers. Further, tuning of the batch size and learning was performed using the RandomGrid search of Keras Tuner library. Training included 50 epochs and the weights yielding performance improvements were saved. Two models were obtained, representing the learning achieved from each dataset. Model A is constructed from training with dataset A and Model B, from training with dataset B. To test their generalization, an evaluation set was made containing 100 examples from archaeological sites excluded from the training process. These sites are Ancient Halos in Magnesia, Thessaly, Greece, and Sissi in Heraklion, Crete, Greece. The selected examples that represent the three classes were used to make predictions. Similar images of the same feature positioned differently were also used to test the models’ prediction robustness. The evaluation set is presented in
Figure 3.
6.3. Prediction Results
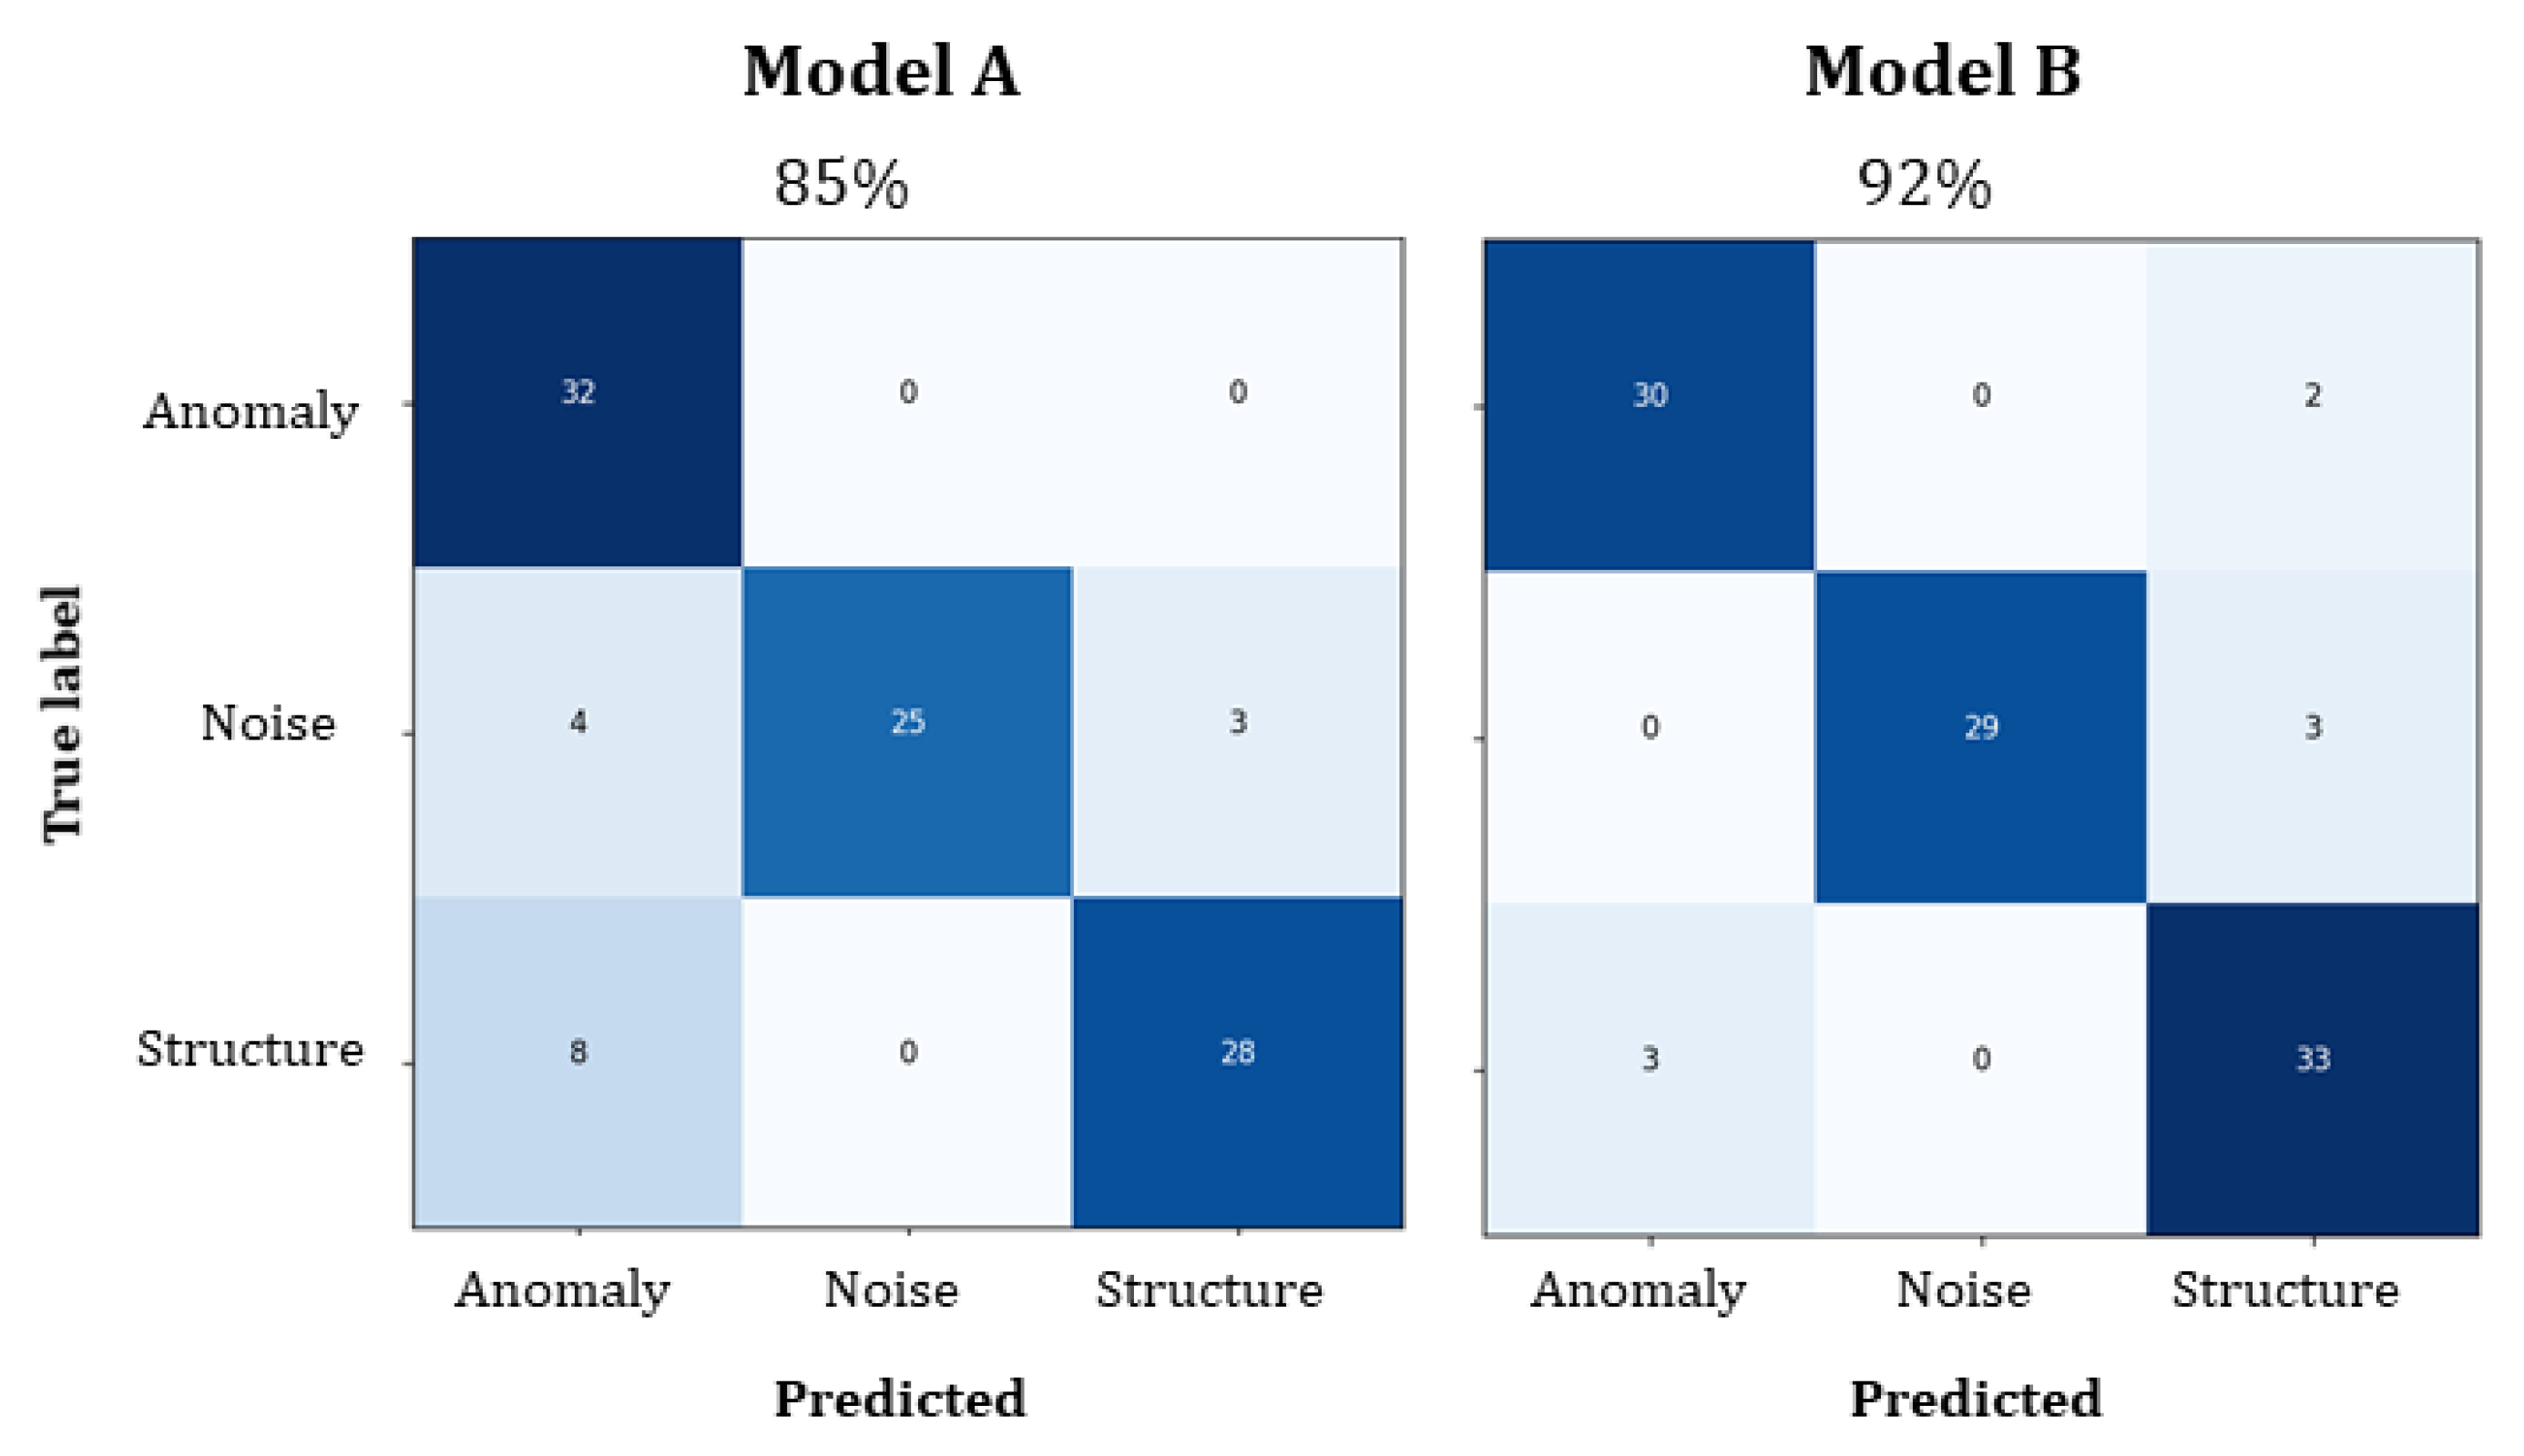
The prediction results are summarized in the confusion matrices (
Figure 4). The results indicated that Model B performs overall better than Model A, reaching a classification score of 92% over 85%. This shows that the random splitting approach should be preferred as it is easier to train and generalizes better. However, Model A was better than Model B in the predictions made for the anomaly class. More specifically, Model A was 100% accurate having predicted all 32 examples correctly, while Model B predicted 30 out of 32 examples correctly (Anomaly class in
Figure 4). On the other hand, Model B is more accurate for the other two classes, predicting correctly 29 out of 32 noise examples. Model B predicted 25 and 33 out of 36 structure examples, whereas Model A, 28.
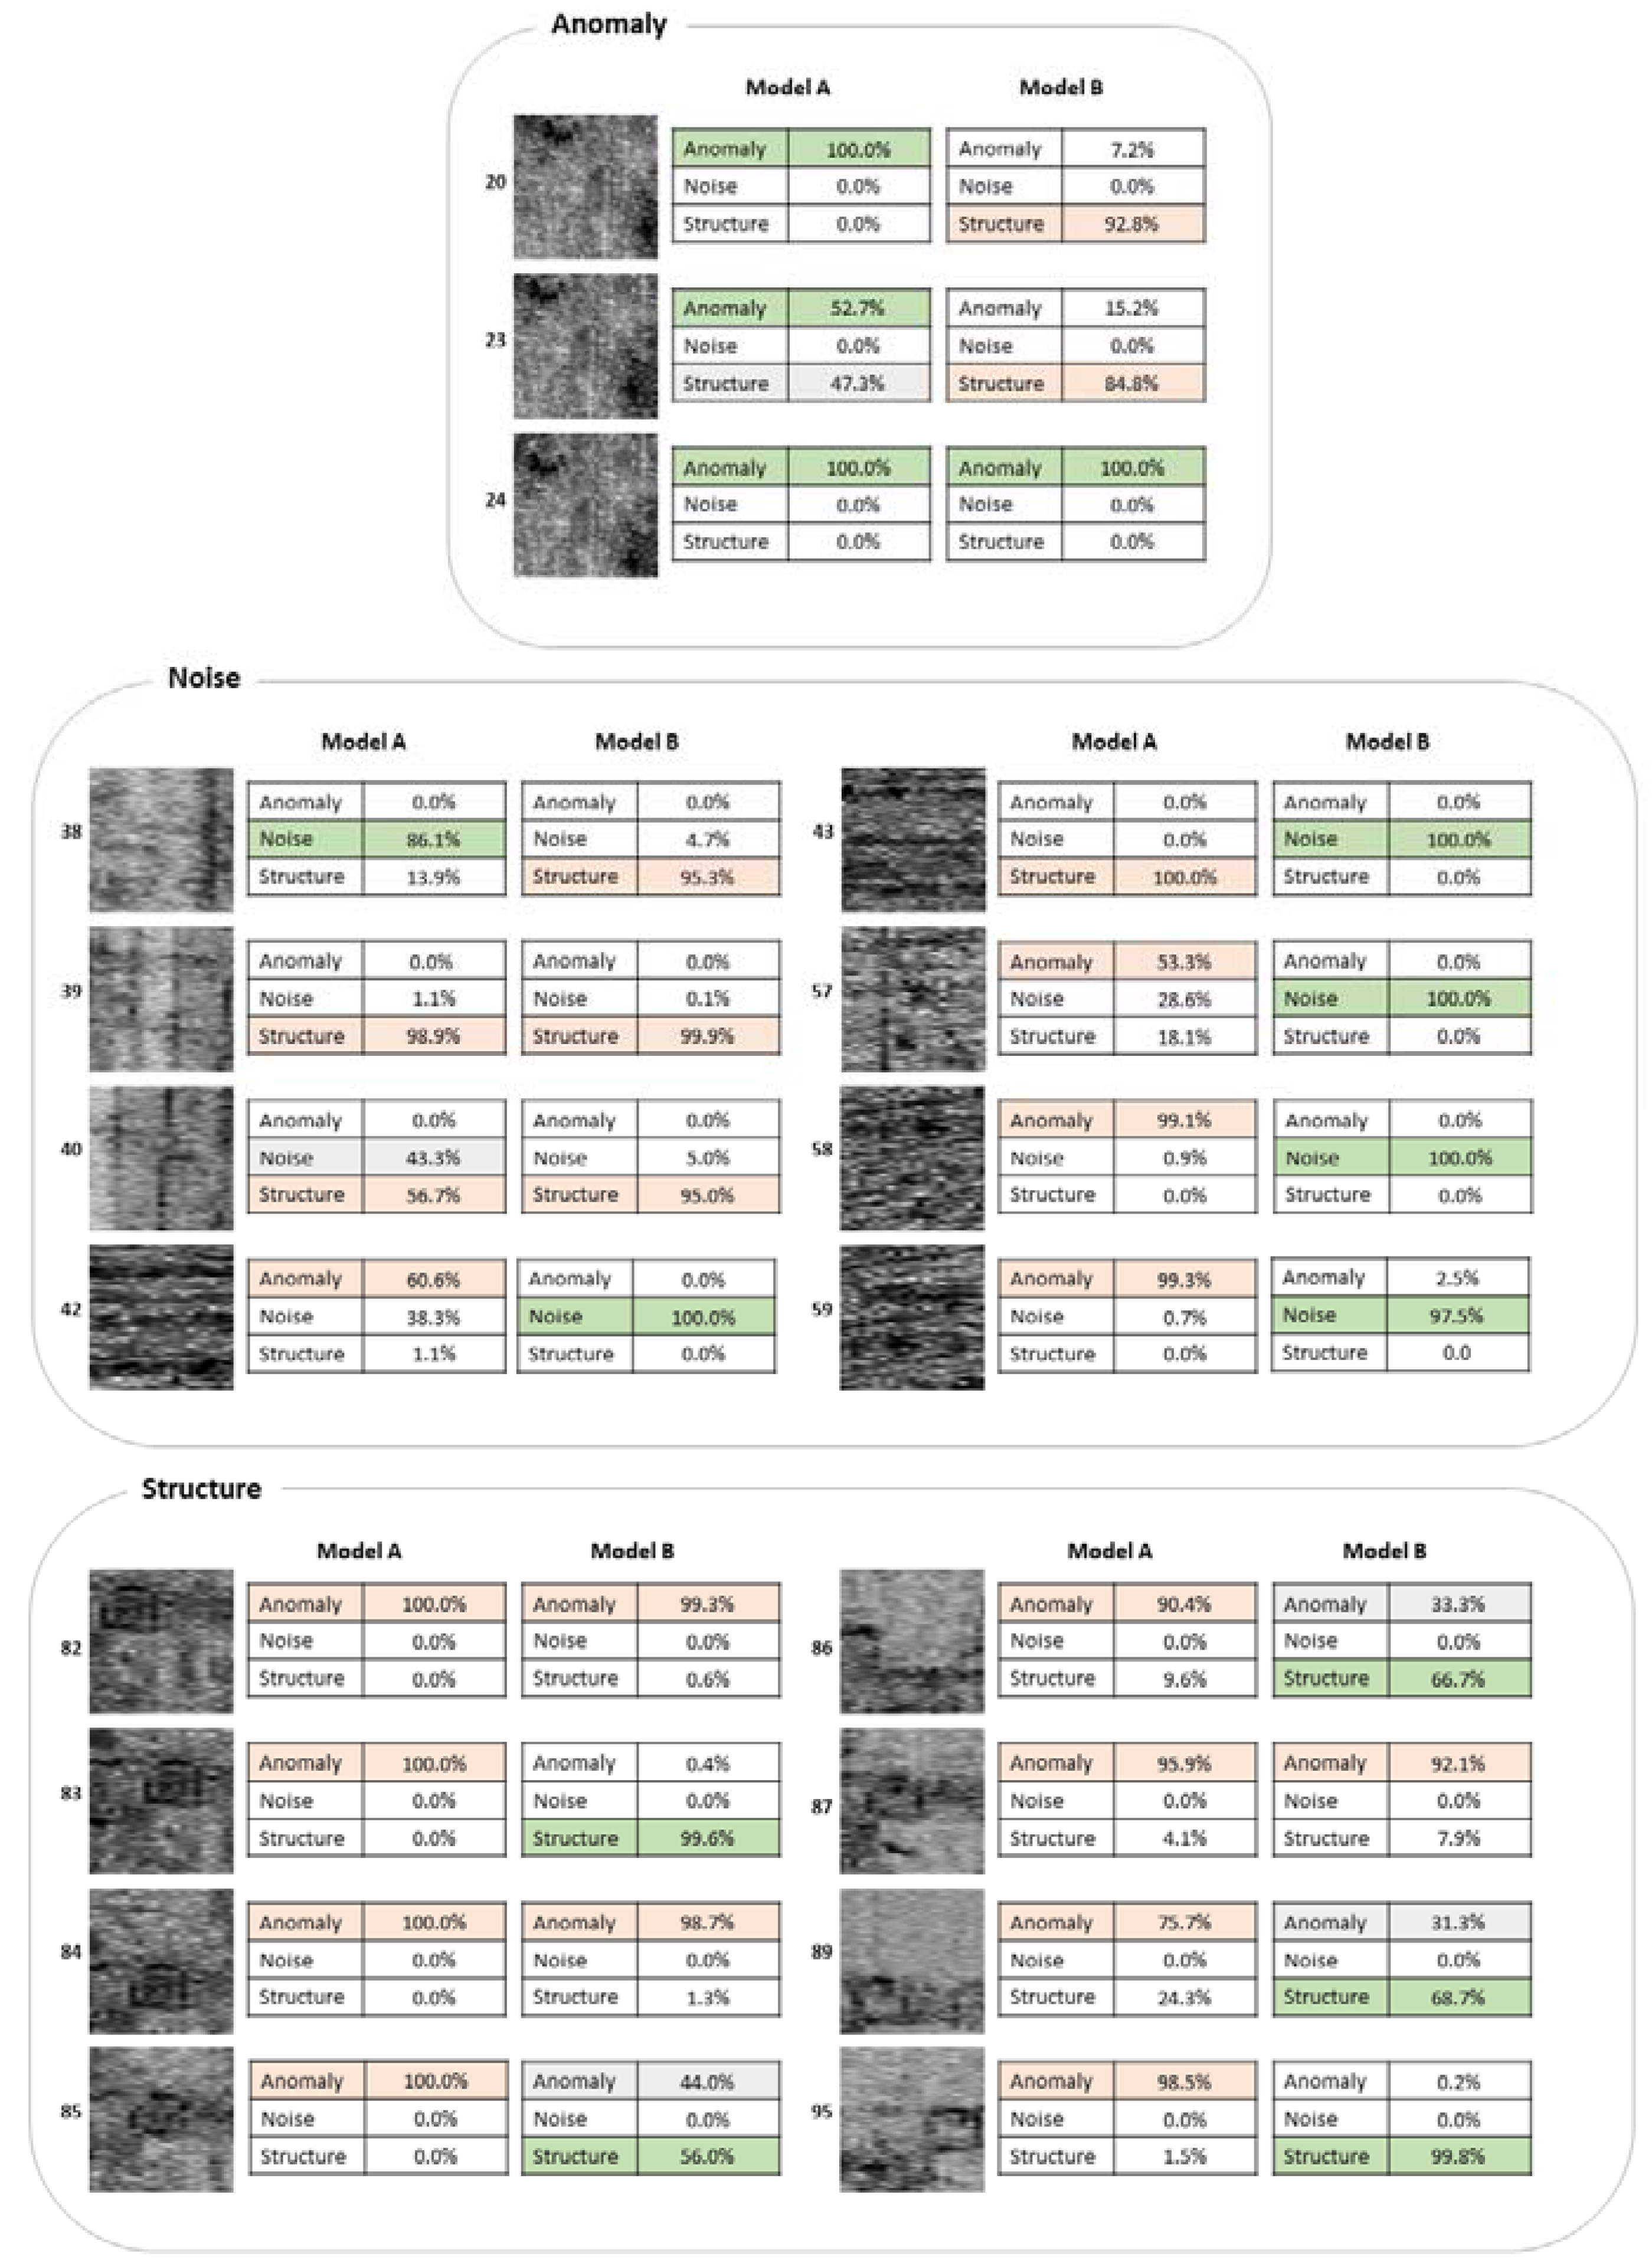
All of the misclassified examples are presented in
Figure 5. The incorrect predictions made by Model B for the Anomaly class are examples #21 and #23 that were classified as structures. These examples are different views of the same structure resulting from the overlapping sliding window approach. In addition, example #23 is a marginally correct prediction by Model A (52.7% as an anomaly and 47.3% as a structure). Further, example #24, which is another view of the same feature, is correctly classified by both models. This shows a non-robust behavior that should be considered for future improvements and highlights the need to successfully apply data augmentation techniques.
As for the noise class, Model A made seven mistakes, while Model B made three. Example #38 was classified as a structure by Model B, and more likely, was mistaken as a wall. Similarly, examples #39 and #40 were mistaken as structures by both models, with example #39 being a marginally negative prediction for Model A (43.3% as noise, 56.7% as structure). However, Model B performed better in identifying correctly noise derived from the surface such as plowing lines, as presented in examples #42, #43, #58, and #59. Example #57 has three different noise types appearing in three different orientations: vertical, horizontal, and diagonal. Model B prediction was accurate, while Model A gave mixed results, having classified 53.3% as an anomaly, 28.6% as noise, and 18.1% as a structure.
The structure class incorrect predictions for Model A are #82 to #87, #89, and #95, which were classified as an anomaly instead of structure. Examples #82 to #85 are different views of the same structural feature, which bears a unique pattern probably due to a collapsed roof. Model B was also mistaken (examples #82 and #84) but it managed to predict examples #83 and #85 correctly, with the latter being a marginal case. Example #85 shows this particular not well-preserved structure at a different depth. The rest of the examples were derived from a structural complex, and Model B was overall more accurate than Model A.
The obtained results indicate that Model B generalizes better than Model A suggesting that the random approach to split the test set and training set is preferable in this case scenario where available data were not enough to provide enough and unique examples from different case studies. However, the results imply that further data are required in the training datasets to improve the prediction robustness.
7. Discussion
In this paper the drawbacks of the conventional GPR data interpretation process were discussed, and studies aiming to overcome these pitfalls were reviewed. What becomes clear is that GPR data from archaeological prospection are quite complex and site-dependent. No straightforward process exists in both processing and interpreting the data, which requires a deeper understanding of the GPR method. Therefore, it is recommended to follow a target-directed analysis while taking into account both B-scans and C-scans to get the most out of GPR recorded information. Attribute analysis used in seismic data seems to be beneficial in enhancing archaeological remains not very well described by the traditional instantaneous envelope. Further, developments in hardware and computational systems allow using multiple sensors to collect information from the area of interest. This combined information can improve interpretation significantly leading to a complete understanding of the buried past. At the same time, it allows generating more intuitive visualizations through highly detailed and immersive 3D models. This can be expanded in fusion approaches that aim to merge the information acquired from the different sensors, reducing, in this way, interpretation uncertainties. However, the approaches mentioned above come at the price of significantly increasing time spent in data collection, processing time, and interpretation. On this matter, the automatic interpretation using DL algorithms may have a potential to aid data interpretation and be embedded in the process by using trained models to detect and identify complex patterns. Even though DL algorithms are widely used in computer vision tasks such as image classification, object detection, and image segmentation for image analysis, they have not yet been explored with GPR data derived from archaeological prospection. The main reason is the limitation in data availability. For this reason, an example to classify C-scans produced by the traditional interpretation approach was performed.
For the classification task, CNNs with AlexNet architecture were used. The obtained results showed great potential to classify patterns attributed to ancient structures, noise and geophysical anomalies not identified as a structure. This choice of classes produced interesting results and showed that if enough data exists, a complete analysis of the subsurface conditions mapped in GPR C-scans can be achieved with CNNs. Some practical insights were obtained during the training dataset construction, which was proven challenging due to the limited GPR images featuring structures which are rarer to find. At the same time, they are more often noisy and exhibit other geophysical anomalies of the subsurface that are not a structure. For this reason, an overlapping and sliding window crop approach was mandatory to effectively increase the images to a number that allowed learning. Further, two different splitting approaches were tested to examine which one can lead to better performance and generalization. These were tested on an evaluation set that was made using 100 new GPR examples from the sites of Ancient Halos in Magnesia, Thessaly, Greece, and Sissi in Heraklion, Crete, Greece. The results showed how great an impact this has had on the learning process, with the random approach performing better. However, considering the small number of examples in the evaluation, more tests are required to reach a safer conclusion. Overall, the results of this application suggest that CNNs and deep architectures are a promising lead to improve GPR data interpretation processes, and could be combined with the different approaches reviewed in this paper.


