Article

Investigation of the Thermal Conductivity of Silicon-Base Composites: The Effect of Filler Materials and Characteristic on Thermo-Mechanical Response of Silicon Composite

1
Department of Applied Science and Technology, Politecnico di Torino, Corso Duca degli Abruzzi 24, 10129 Torino, Italy
2
OSAI AS S.p.A., Via della Cartiera 4, Parella, 10010 Torino, Italy
*
Author to whom correspondence should be addressed.
Appl. Sci. 2021, 11(12), 5663; https://doi.org/10.3390/app11125663
Submission received: 19 May 2021 / Revised: 4 June 2021 / Accepted: 16 June 2021 / Published: 18 June 2021
(This article belongs to the Special Issue Multifunctional Polymers and Composites)

Abstract

:
Thermal conductivity is a key property in many applications from electronic to informatics. The interaction of fillers with Sylgard 184 was studied; this study explores new composites and the influence of metal particles (copper and nickel), carbon-based materials (carbon nanotubes and carbon black), and ceramic nanoparticles (boron nitride) as fillers to enhance thermal properties of silicon-based composites. The effect of the fillers on the final performances of the composite materials was evaluated. The influence of filler volume, dimension, morphology, and chemical nature is studied. Specifically, FT-IR analysis was used to evaluate curing of the polymer matrix. DSC was used to confirm the data and to further characterize the composites. Thermo-mechanical properties were studied by DMTA. The filler morphology was analyzed by SEM. Finally, thermal conductivity was studied and compared, enlightening the correlation with the features of the fillers. The results demonstrate a remarkable dependence among the type, size, and shape of the filler, and thermal properties of the composite materials. Underlining a that the volume filler influenced the thermal conductivity obtaining the best results with the highest added volume filler and higher positive impact on the k of the composites is reached with large particles and with irregular shapes. In contrast, the increase of filler amount affects the rigidity of the silicon-matrix, increasing the rigidity of the silicon-based composites.

1. Introduction

Polymeric materials have been widely employed in electronic packaging, batteries, cable terminations, and power devices. Thermal loading in these applications has become a critical issue for the further development of electronic devices. Indeed, miniaturization, functionalization of electronic devices, and thermal dissipation are challenging problems. High thermal conductive composites need to be designed to dissipate and transfer the generated heat, especially for thermal interface materials (TIM) [1,2]. PDMS are widely used in TIM applications [1,3,4,5,6,7] due to their high flexibility and thermal stability. However, they possess low thermal conductivity (k) which may limit their application in devices. The value usually varies from 0.1 to 0.5 Wm−1 K−1 according to the different polymeric matrix [8,9].
Low thermal conductivity of these materials is related to the presence of amorphous domains which localize the vibrational modes, limiting heat transfer [10]. An accessible route to improve k is to embed macro- micro- or nano-fillers in the polymeric matrix and to enhance the thermal properties of the material [11]. In particular, carbon-based, ceramic, and metal fillers have been added to polymeric matrices to improve their thermal properties [9,10].
Heat transmission is the result of two different contributions: free electrons and phonon. Phonons are mainly responsible for thermal conduction in carbon and ceramic materials, on the other hand, thermal conductivity of metals can be completely attributed to free electrons motion, whereas phonons’ role is negligible. Both the mechanisms can be used to enhance the k value of a PDMS based composite. The final value of k depends on the loading, distribution, shape, and size of the conductive fillers, as well as on the matrix-filler interface, composition, and nature of the components [10].
Carbon-based fillers include carbon black (CB) particles, carbon nanotubes (CNT), graphene, and graphite. The variety of allotropes cover a remarkable range of thermal properties with k varying from 0.01 W mK−1 to above 3000 W mK−1 [12,13,14].
Liu et al. [15] reached an increase of 65% of k value by adding CNT in a silicon matrix. Sanada et al. [4] used multi-walled carbon nanotube (MWNT) in an epoxy matrix to increase thermal conductivity. The study compared MWNT with alumina nanoparticles and underlines the higher k value reached with MWNT due to high thermal conductivity and high aspect ratio of carbon-based filler. The MWNTs form ideal thermal conducting pathways leading to a marked increase of thermal conductivity of the composites. Thus, the minimal addition of filler (0.4 wt.%) leads to an increase of k of about 80% compared to the pristine polymer matrix [16]. Mu et al. [7] prepared silicon composite adding expanded graphite (EG) by melt mixing and solution intercalation. The maximum thermal conductivity value of silicon/EG was 0.32 Wm−1 K−1 reached at a content of 9 phr and through solution intercalation, whereas 0.24 Wm−1 K−1 was achieved by the standard method of melt mixing. EG was also added into high-density polyethylene (HDPE) by Che et al. [17] to improve the thermal conductivity. Ternary composites were produced by combining CNT to the previous EG/HDPE composite to further increase the thermal dissipation. CNT create an internal network producing a conductive path for the heat. Zhao et al. [18] measured thermal conductivity of 1.08 Wm−1 K−1 of PDMS filled with multilayer graphene flakes (MGFs) and graphene foam (GF).
Ceramic-based fillers, such as alumina, zinc oxide, boron nitride, have been also used to develop high thermally conductive TIMs. Sim et al. [1] compared the effect of alumina (Al2O3) and zinc oxide (ZnO) in a silicon matrix. The thermal pads filled with ZnO reached higher k values compared to Al2O3, when added at the same amounts. The 10 wt% addition of Al2O3 nanoparticles enhanced heat conductivity in PDMS composite up to 0.364 Wm−1 K−1 [19]. Boron nitride (BN) has been widely used as a ceramic filler for thermal management. Hexagonal-BN nanoparticles showed unique thermal and electrical properties, getting interesting for TIM applications [20,21,22].
Metal-based fillers can also be used to increase thermal conductivity of a polymer matrix. Epoxy resin and PVC matrix were filled with metal powders and the variation of k has been studied. Copper and nickel powders with different particle shapes, irregular and spheroidal, respectively, were used as fillers showing the effect of shape and particle distribution [3]. Fu et al. [23] used copper (Cu) powder, aluminum (Al), and silver (Ag) in an epoxy resin (commercially available as E-51) reaching a maximum value of 1.1 Wm−1 K−1 for Al powders. Both thermoset polymers and thermoplastic material, as polyamide [24] or polypropylene [25] has been used for composites filled with Cu powders or fibers. Recent studies showed great potential application in commercial electronics based on the result achieved by metal nanowires and hybrid structures [2,26].
In this paper, the effect on thermal conductivity of three different types of fillers (metals, ceramic, and carbon-based) dispersed into a silicon matrix (Sylgard 184) thermally cured, was investigated. The novelty of the study was the comprehensive investigation and evaluation of how the thermal-conductive filler parameters such as nature, shape, dimension, and surface/volume ratio will influence the enhancement of k value. ATR-FTIR analysis was employed to follow thermal curing. A complete study on kinetics was performed by DSC. Thermo-mechanical properties were tested by DMTA and tensile tests. SEM analyses were performed to elucidate distribution and polymer-filler interaction for the different composites. Thermal conductivity was measured as well as thermal diffusivity.

2. Materials and Methods

2.1. Materials

Sylgard 184 (Sylgard) (SYLGARD 184, Dow Corning Corporation), a polydimethylsiloxane was used as precursor of the polymeric matrix and mixed 10:1 with the curing agent. Three different types of fillers were added to Sylgard matrix: metal fillers, ceramic fillers, and carbon fillers. Concerning metal fillers, two copper (Cu) particles different in shape and size (spheroidal powder, 10–25 μm, purity of 98%, Sigma-Aldrich; dendritic powder, <45 μm, purity of 99.7%, Sigma Aldrich), and two nickel (Ni) particles different in size (powder, 3–7 μm, purity of 99.8%, Sigma Aldrich; powder, <45 μm, purity of 99.8%, Sigma Aldrich). Boron nitride (BN) nanoparticles (size < 150 nm, purity of 99%, Sigma Aldrich) was selected as ceramic filler. Carbon nanotubes (CNT) (NC7000, purity of 90%, Nanocyl SA) and carbon black (CB) (carbon, mesoporous nanopowder, particle size (DLS) < 500 nm, Sigma Aldrich) were selected as carbon filler. The fillers were used as received.

2.2. Formualtion Preaparation and Thermal Curing

Curable formulations were prepared by dispersing fillers were into Sylgard 184 and mixed by DLS Digital Overhead Stirrer (VELP SCIENTIFICA) for 5 min at 500 rpm. The curing agent (Sylgard:hardener) was subsequently added at 10:1 ratio, and the formulations stirred for 2 min. Table 1 summarizes the composition of the investigated formulations.
The composites were prepared by pouring the formulations in Teflon open molds and then thermally cured in oven (150 °C, 60 min).

2.3. Characterization

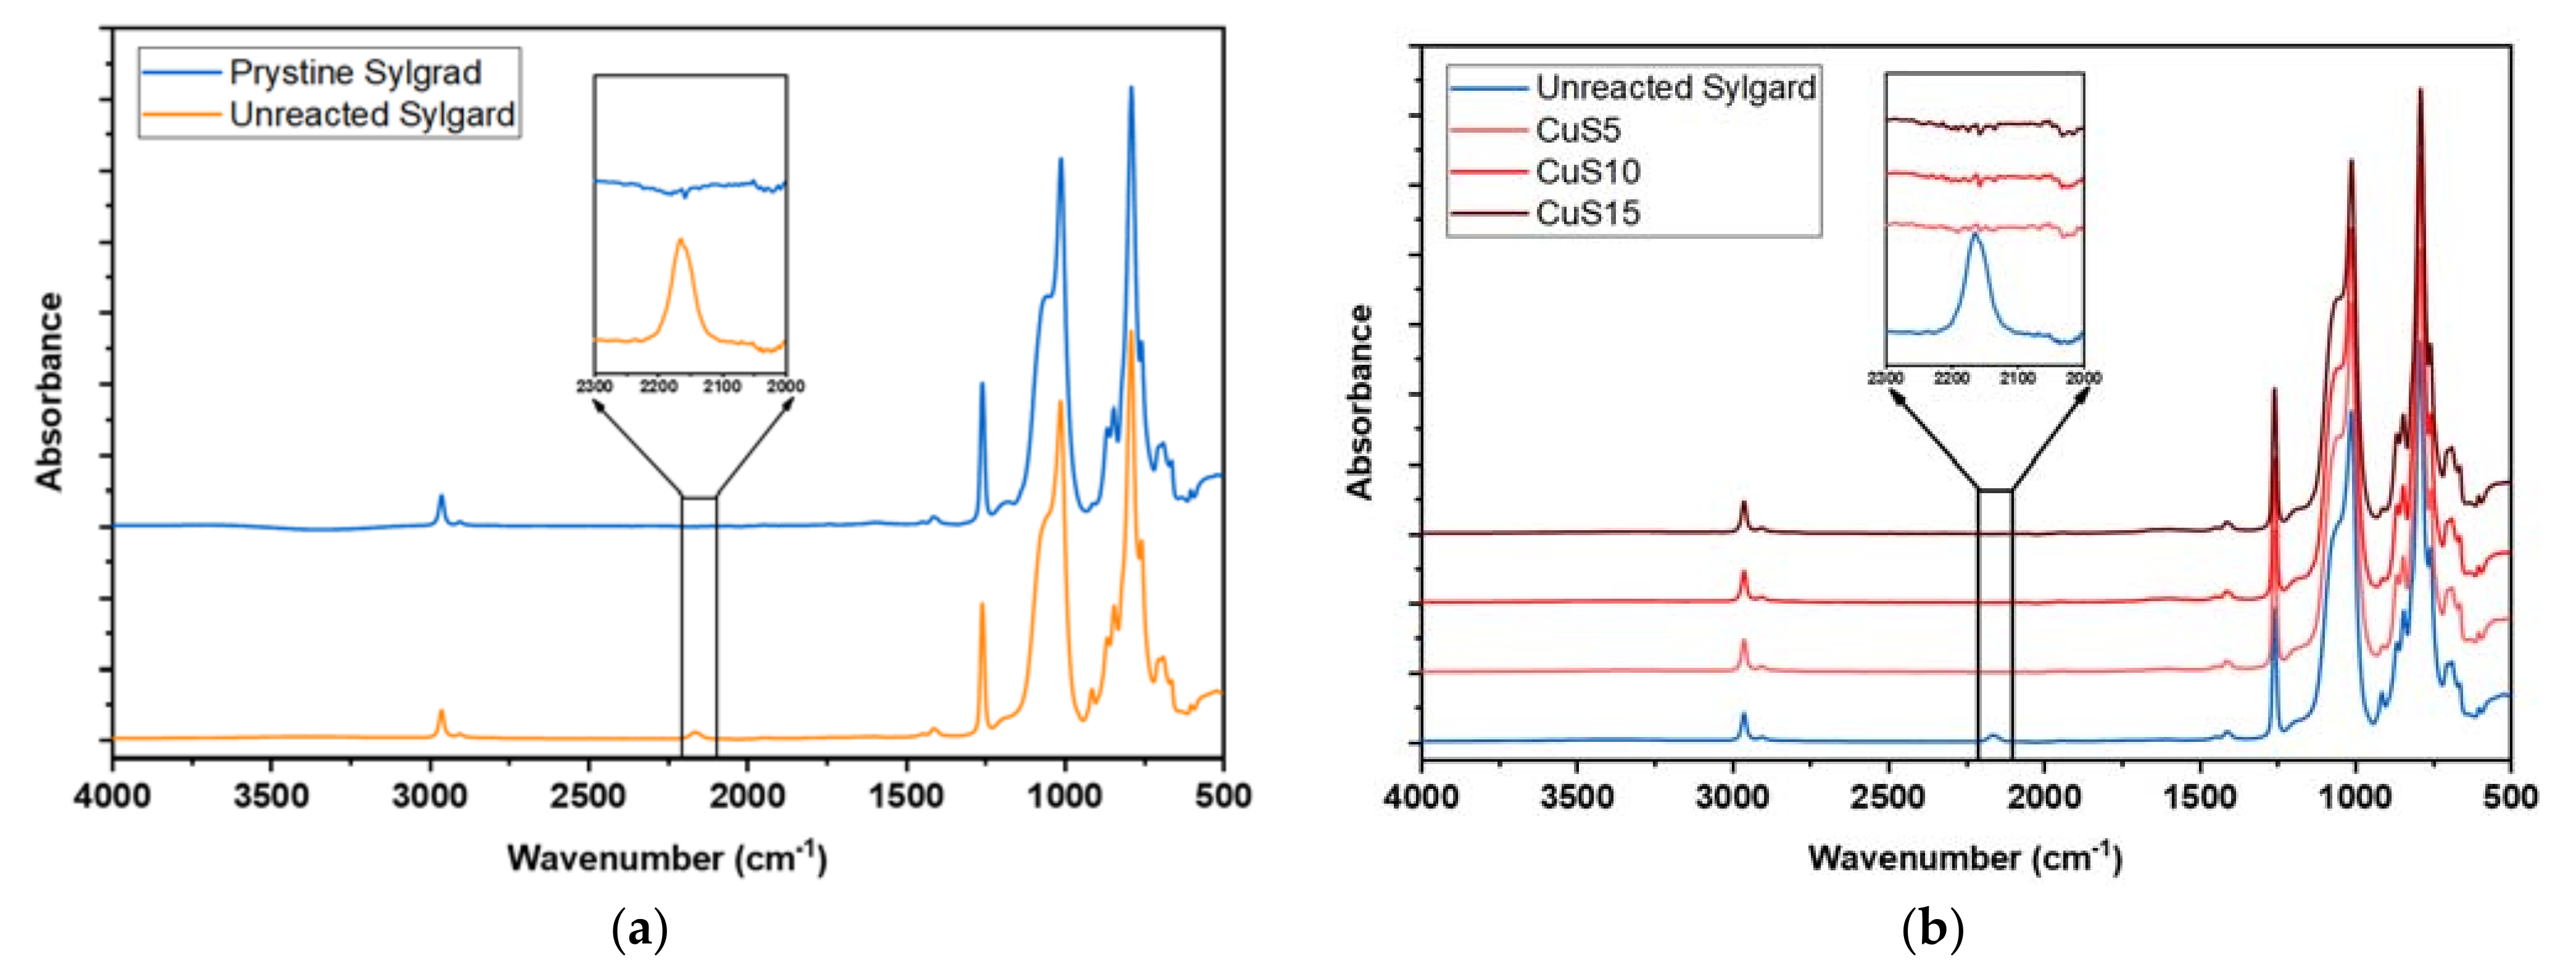
2.3.1. Attenuated Total Reflection-Fourier Transform Infrared Spectroscopy (ART-FTIR)

The ART-FTIR spectra were collected by using a Perkin Elmer Spectrum 2000 FTIR (Waltham, MA, USA) equipped with attenuated total reflectance (ATR) accessory. For each sample 32 scans were recorded, the resolution was 4 cm−1, and the spectra were collected between 4000 and 500 cm−1. Sylgard is cured via a hydrosilylation reaction between the vinyl group in the prepolymer base and the silane group in the curing agent, in the presence of a platinum catalyst [27,28]. Thus, the conversion ratio of the Si-H groups was monitored by evaluating the profile of the peak centered at 2160 cm−1 responsible for the stretching of the Si-H bond.

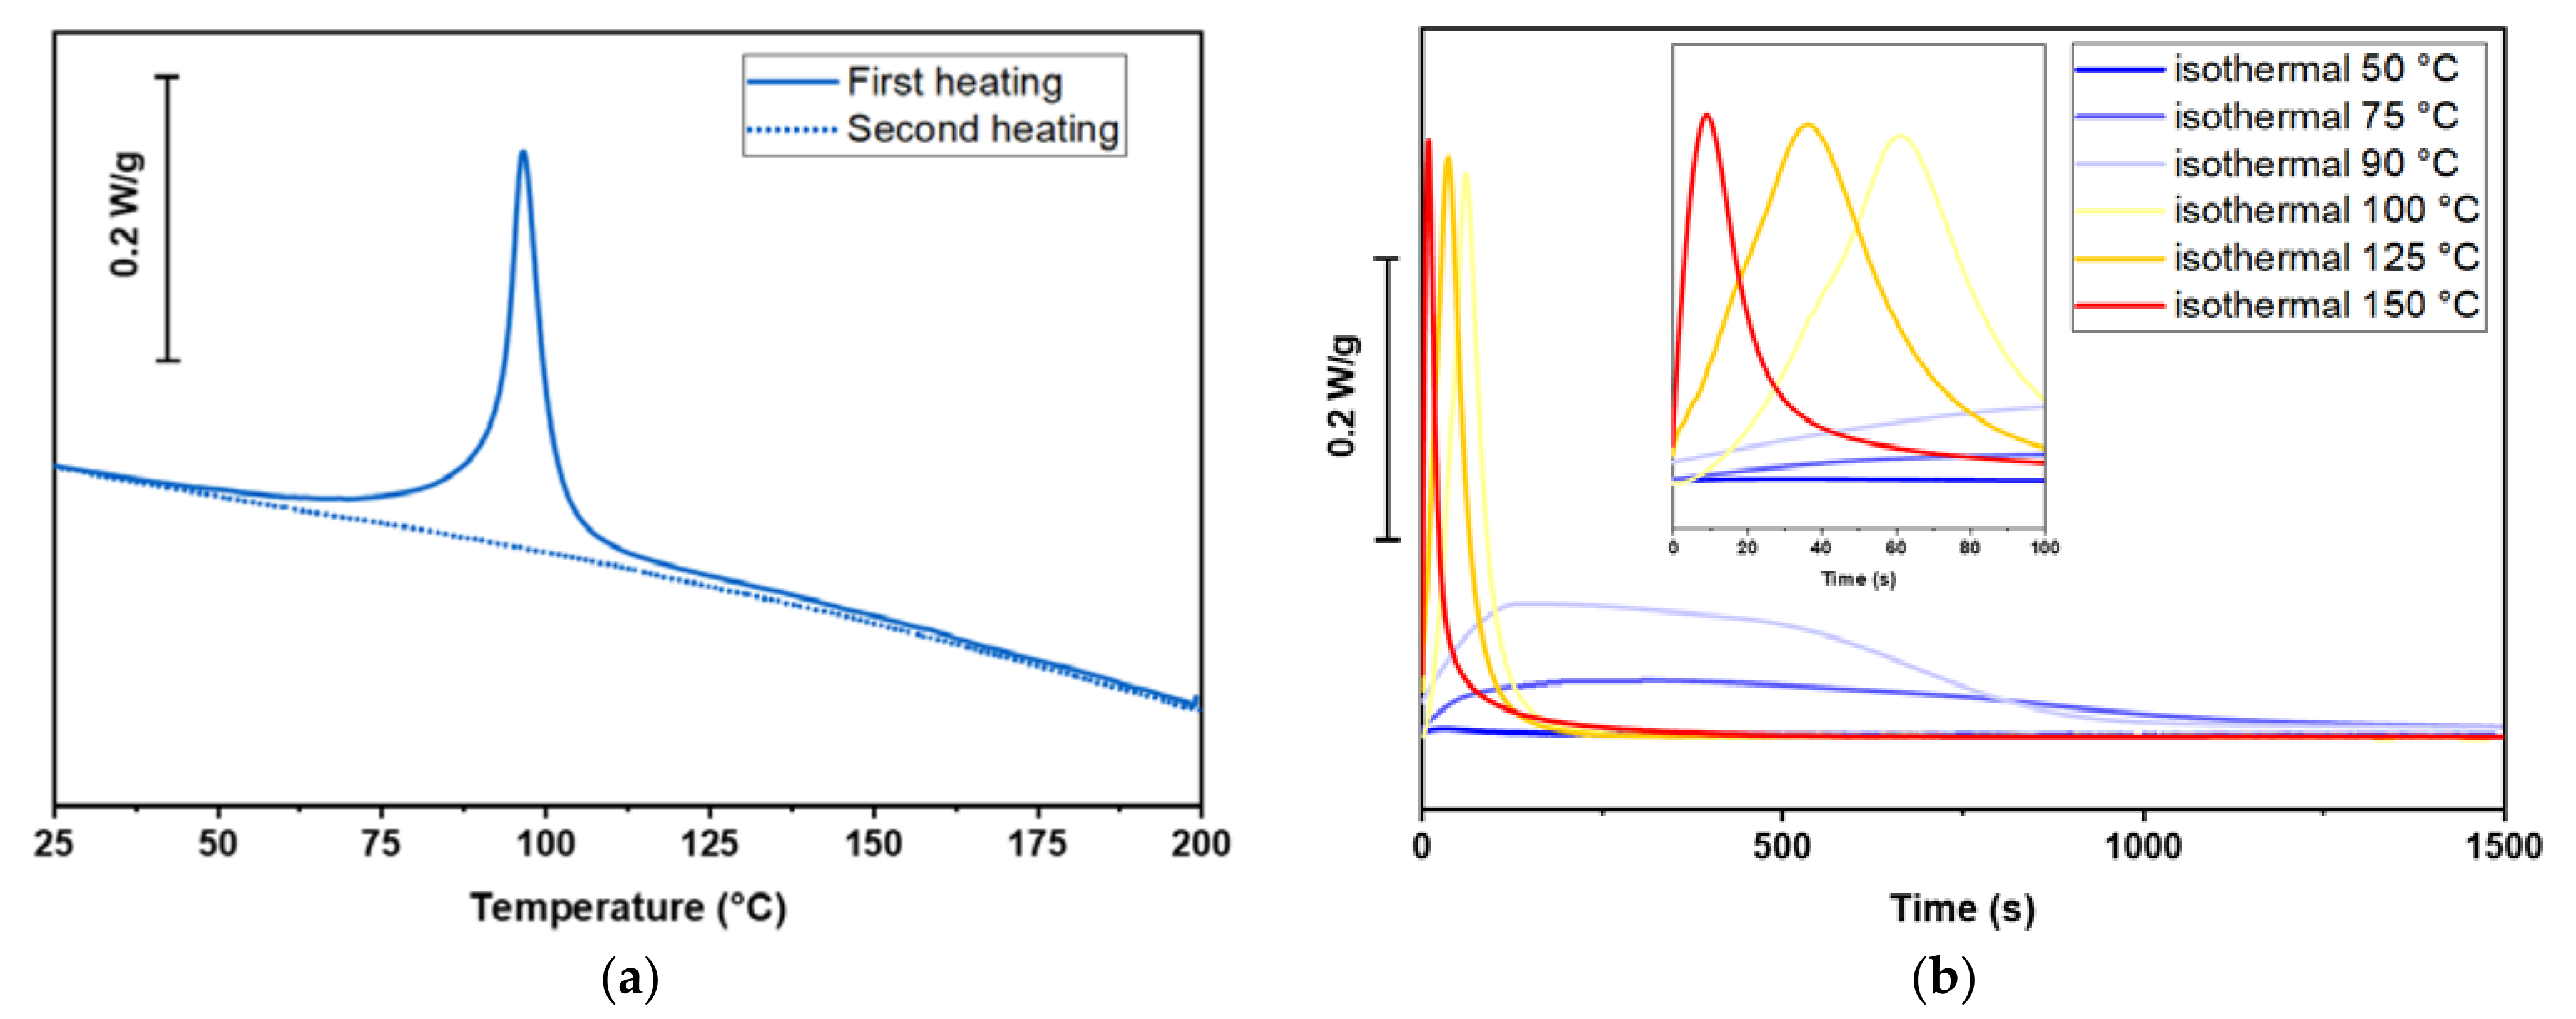
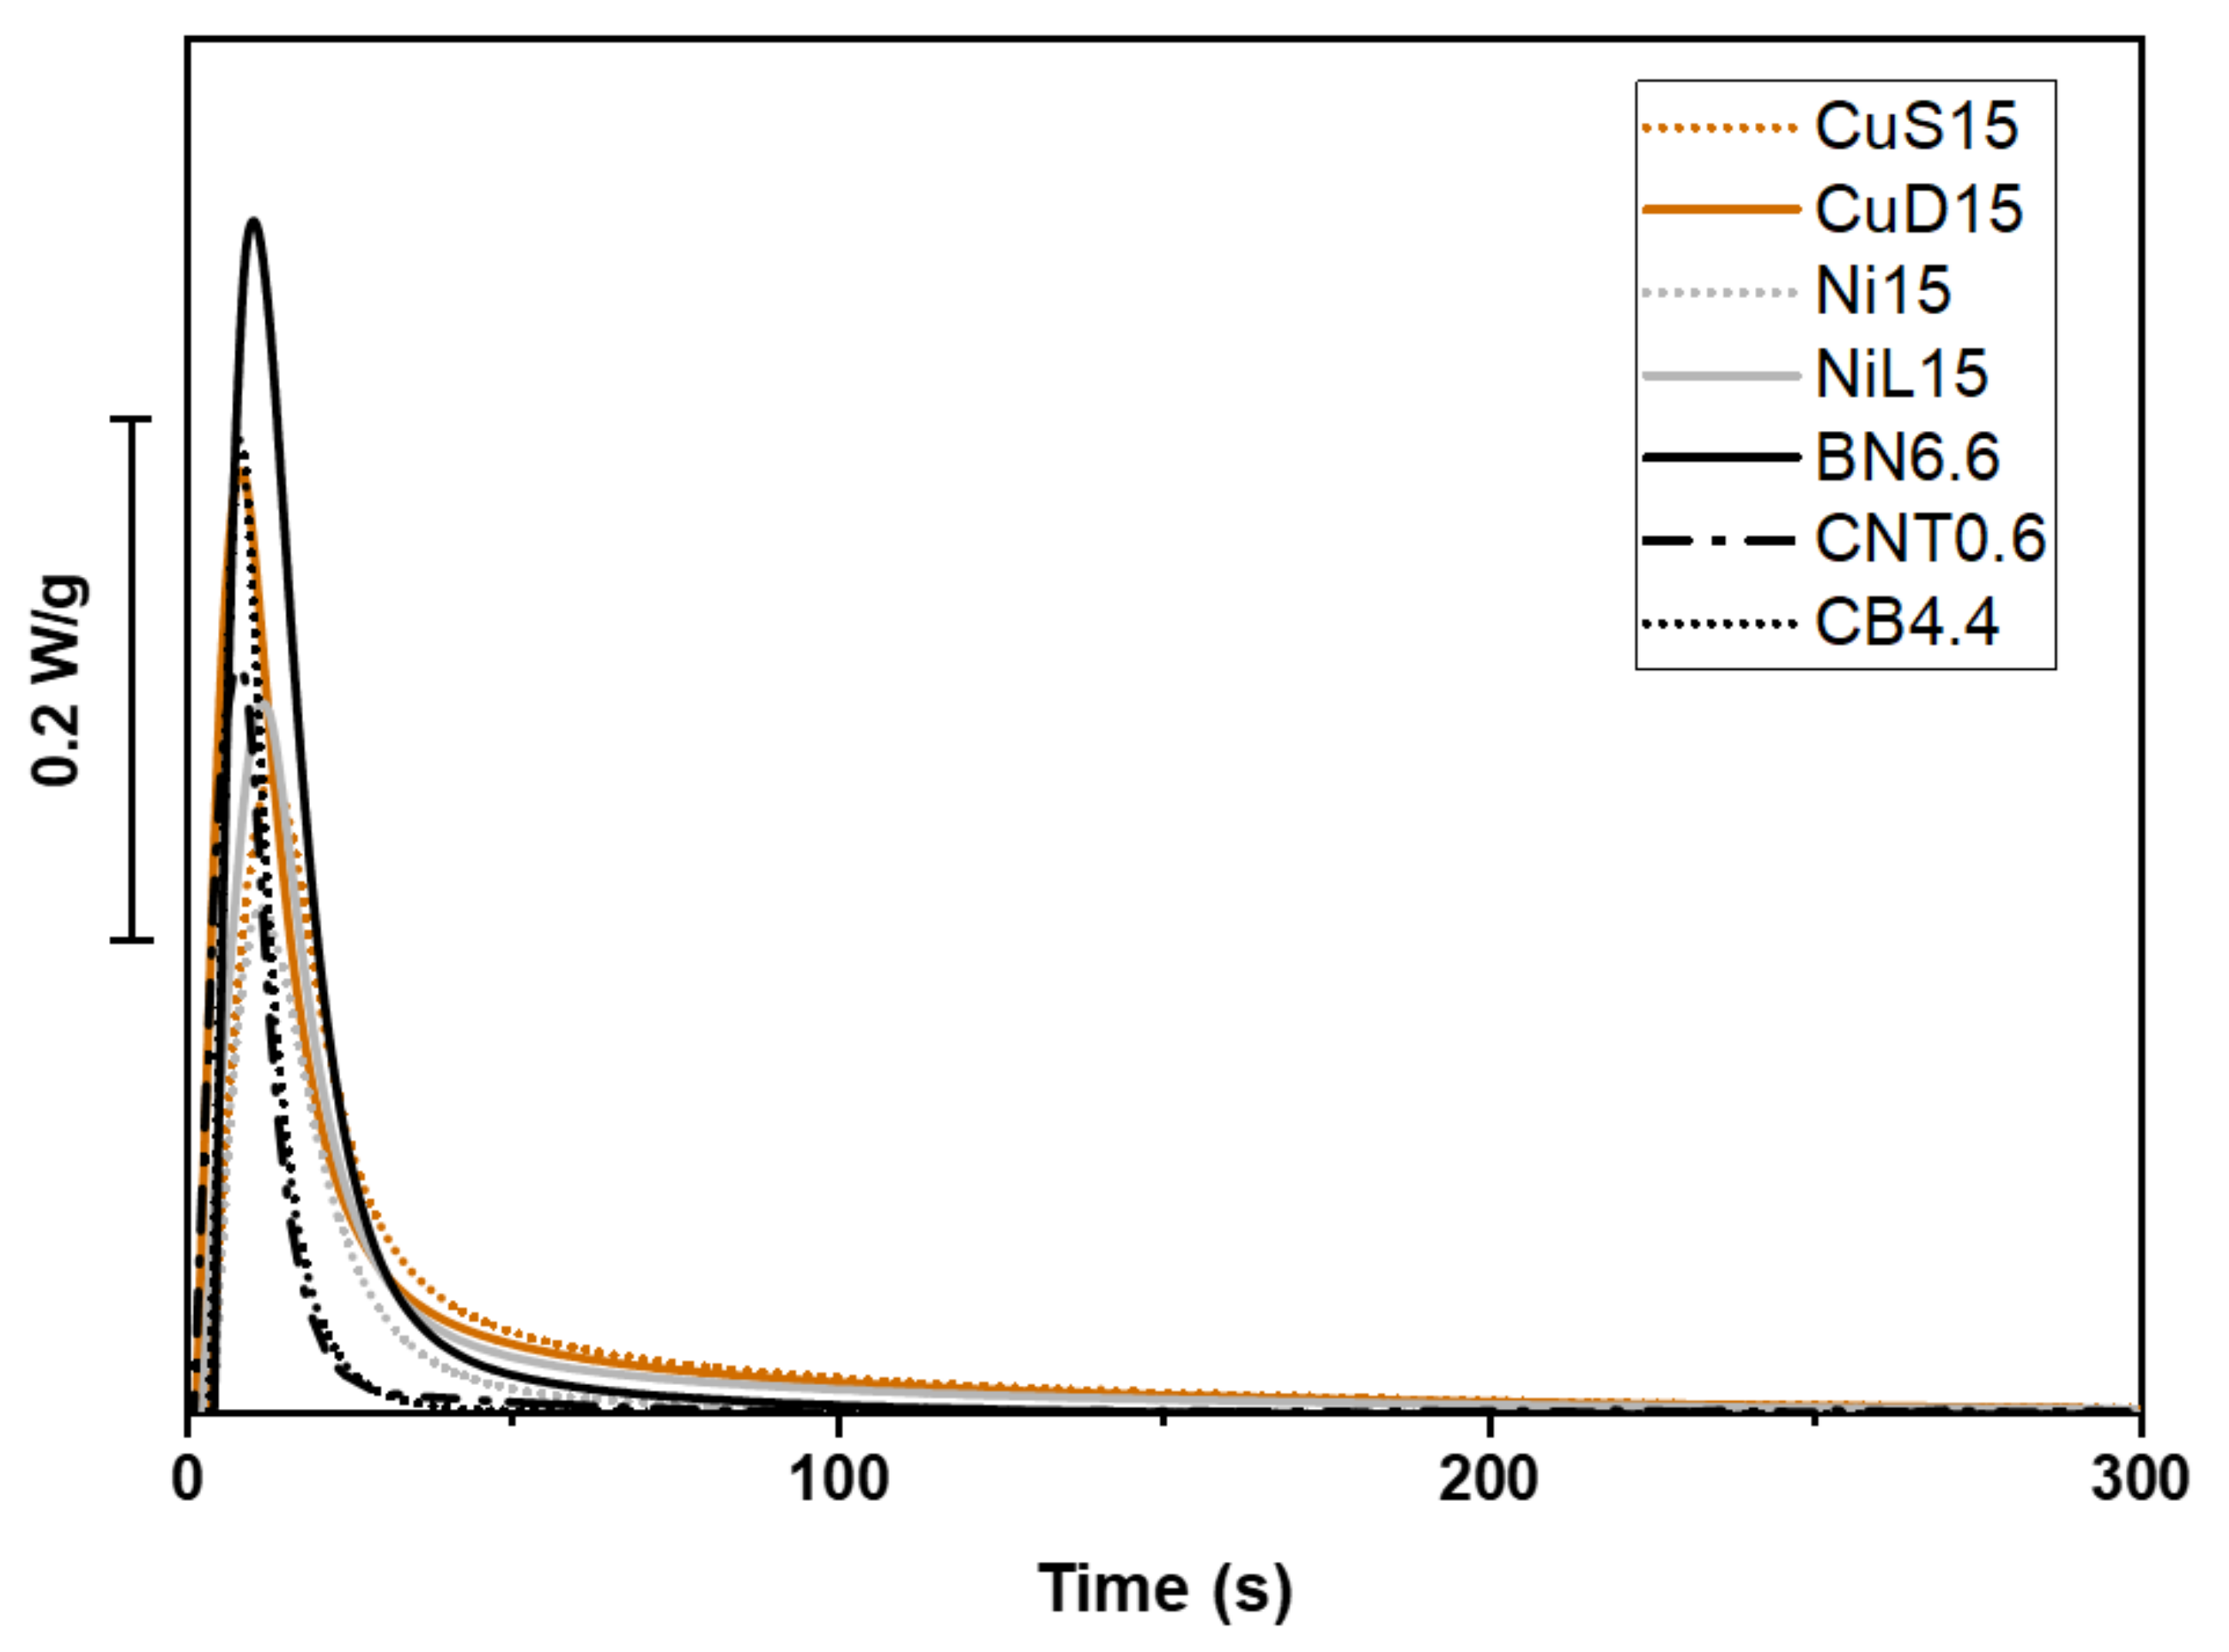
2.3.2. Differential Scanning Calorimetry (DSC)

Thermal curing of the composite was followed by DSC measurement. The DSC analysis was performed on a Mettler Toledo DSC-1 equipped with Gas Controller GC100. The curing of pristine Sylgard was investigated by two different methods: dynamic and isothermal. The dynamic method followed these steps: a first heating ramp of 5 °C/min from 25 °C to 200 °C followed by a cooling down to 25 °C and a second heating ramp until 200 °C. The isothermal curves were taken at different temperatures: 50 °C, 75 °C, 90 °C, 100 °C, 125 °C, and 150 °C. The composite with the maximum amount of filler was tested in the isothermal condition at 150 °C mimicking the thermal curing of samples performed in oven.

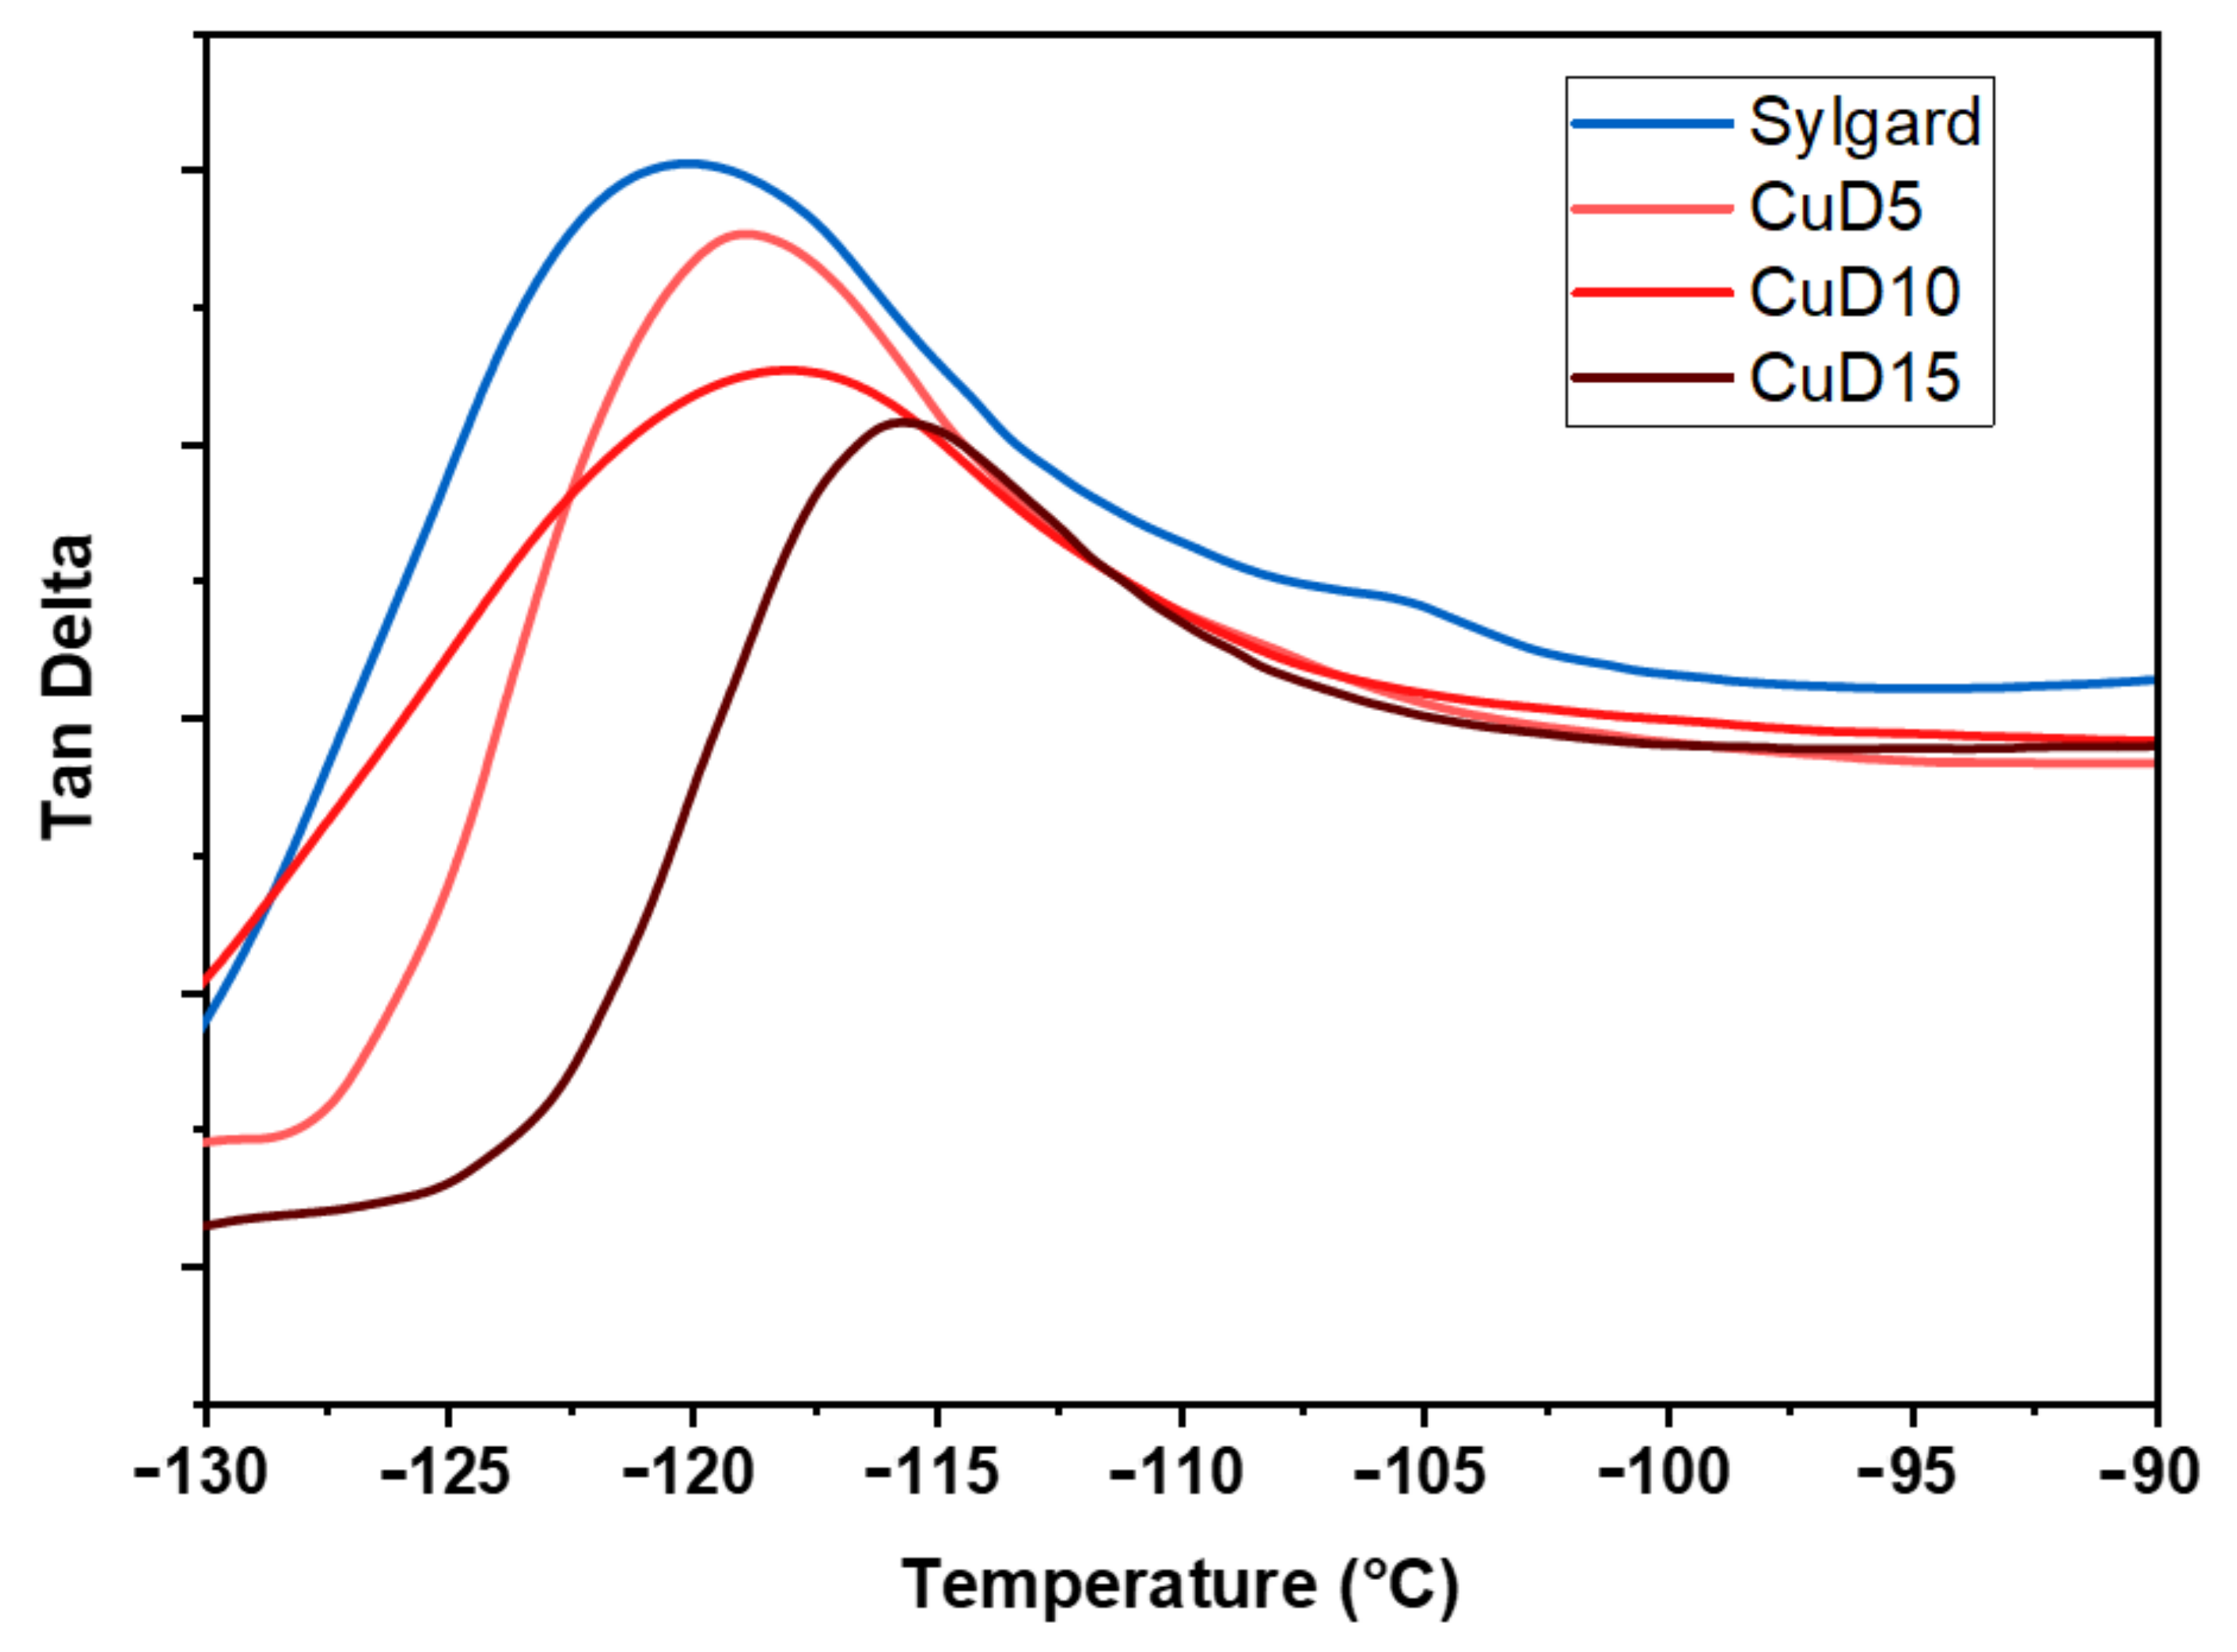
2.3.3. Dynamic Mechanical Thermal Analysis (DMTA)
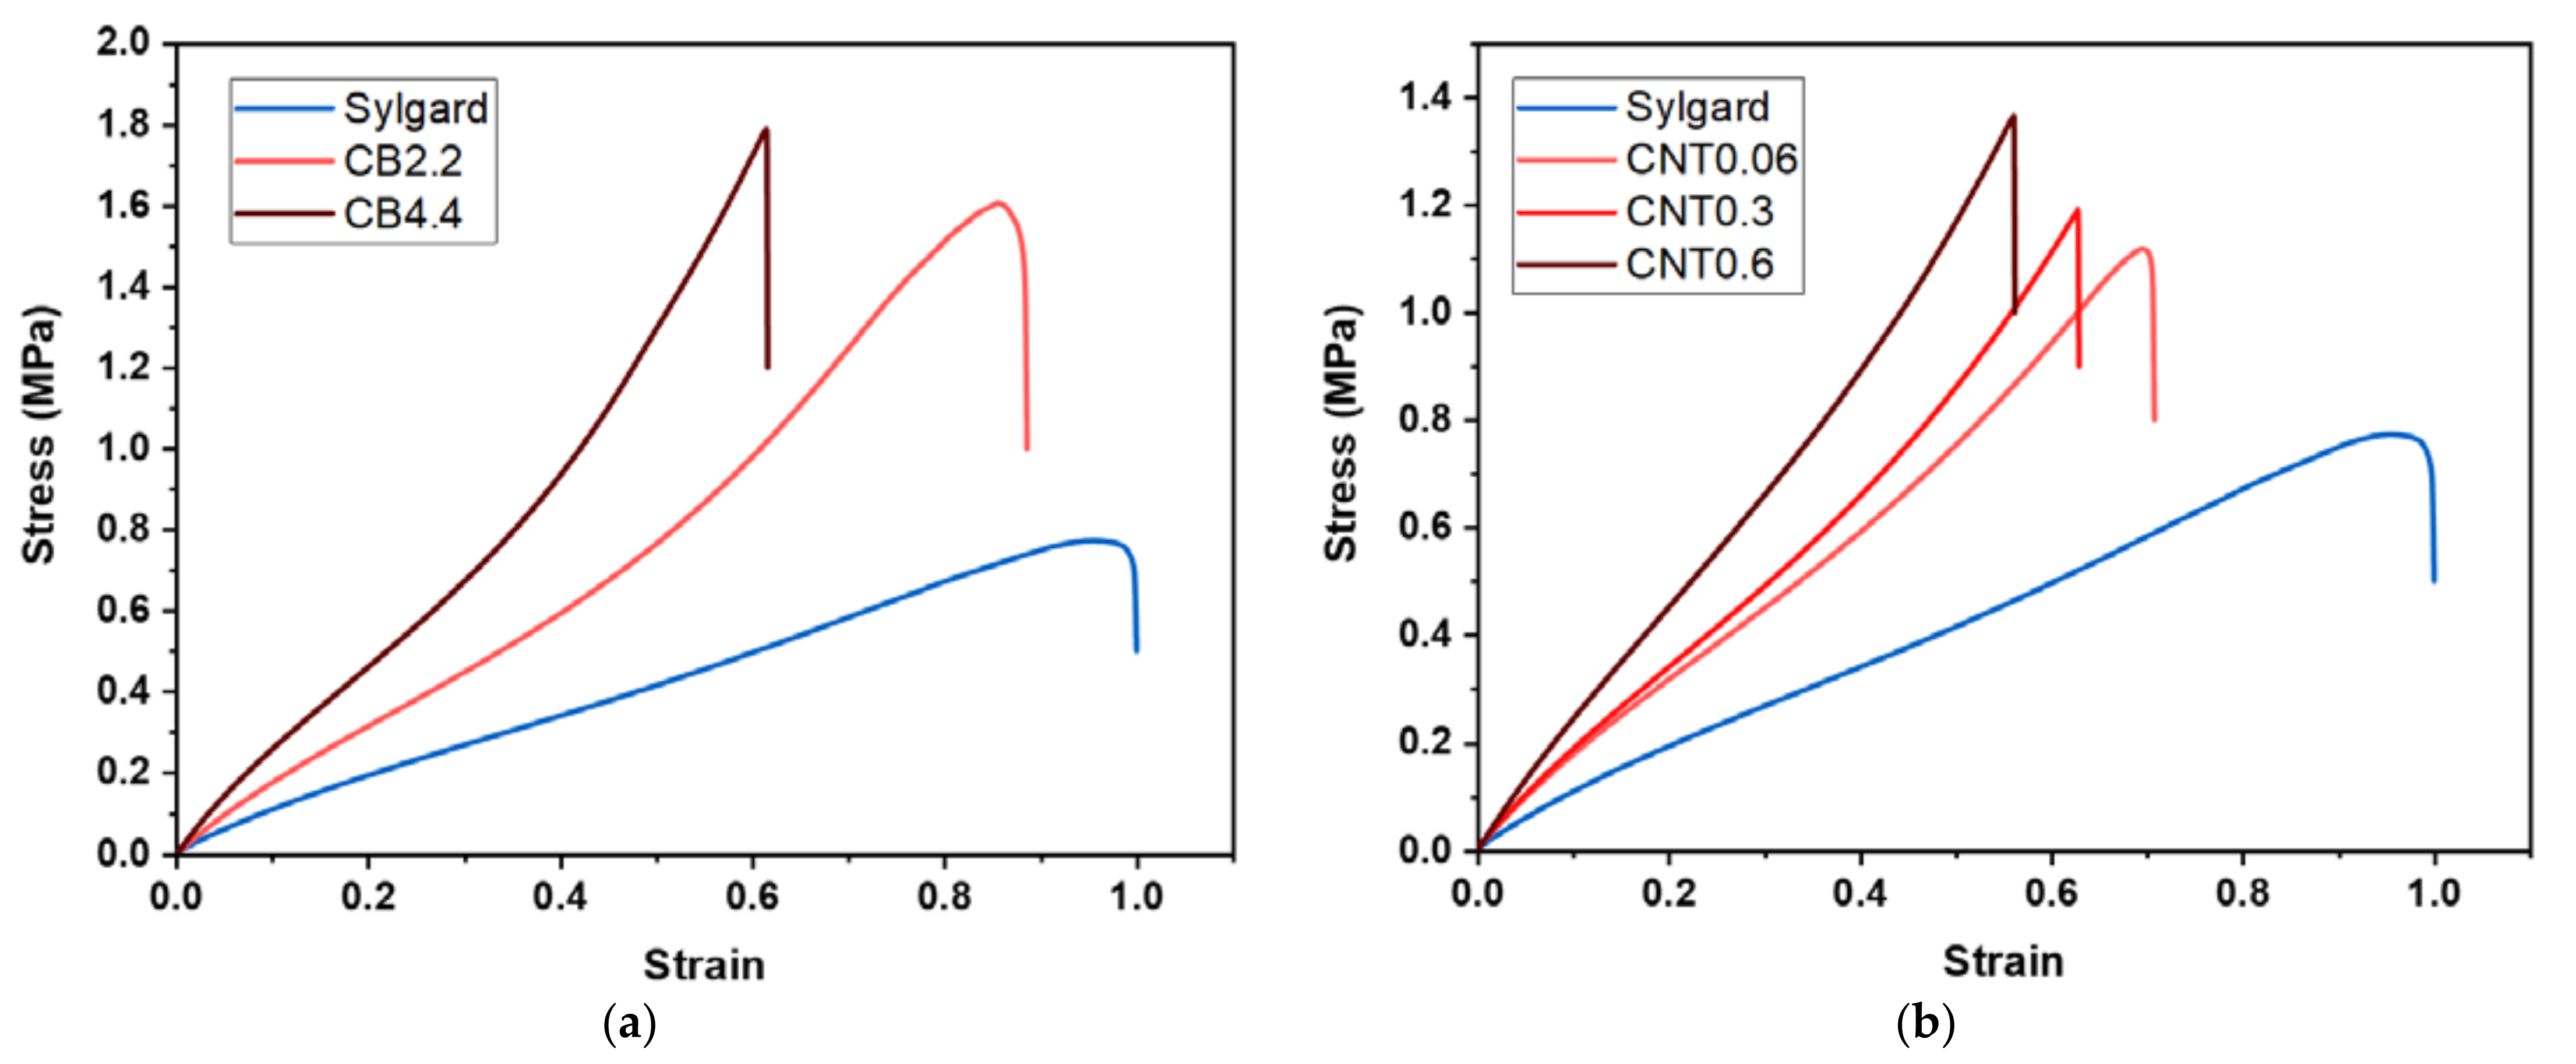
The analyses were performed on samples with the average size of 20 × 5 × 0.5 mm3 through a Triton Technology instrument (Keyworth, Nottingham, UK) equipped with a liquid nitrogen pump. The tests were performed within −130 °C and 60 °C, with a heating rump of 3 °C/min, and by applying a tensile stress with a frequency of 1 Hz.

2.3.4. Tensile Test

The test was performed with rectangular sample in line with the active standard for tensile properties ASTM D882 [29], with length/width ratio of 10 (60 × 6 × 0.5 mm3), using a tensile instrument (MTS QTestTM/10 Elite, MTS System Corporation) combined with a measurement software (TestWorks® 4, MTS System Corporation). A 50 N load cell was used to perform the test, which was carried out three times for every sample, and the parameters for the measure were set as follows: test speed at 10 mm/min and data acquisition rate at 50 Hz. Young’s modulus (evaluated as tangent of the stress/strain curve until 10% strain), ultimate tensile strength (UTS) and elongation at break were measured.

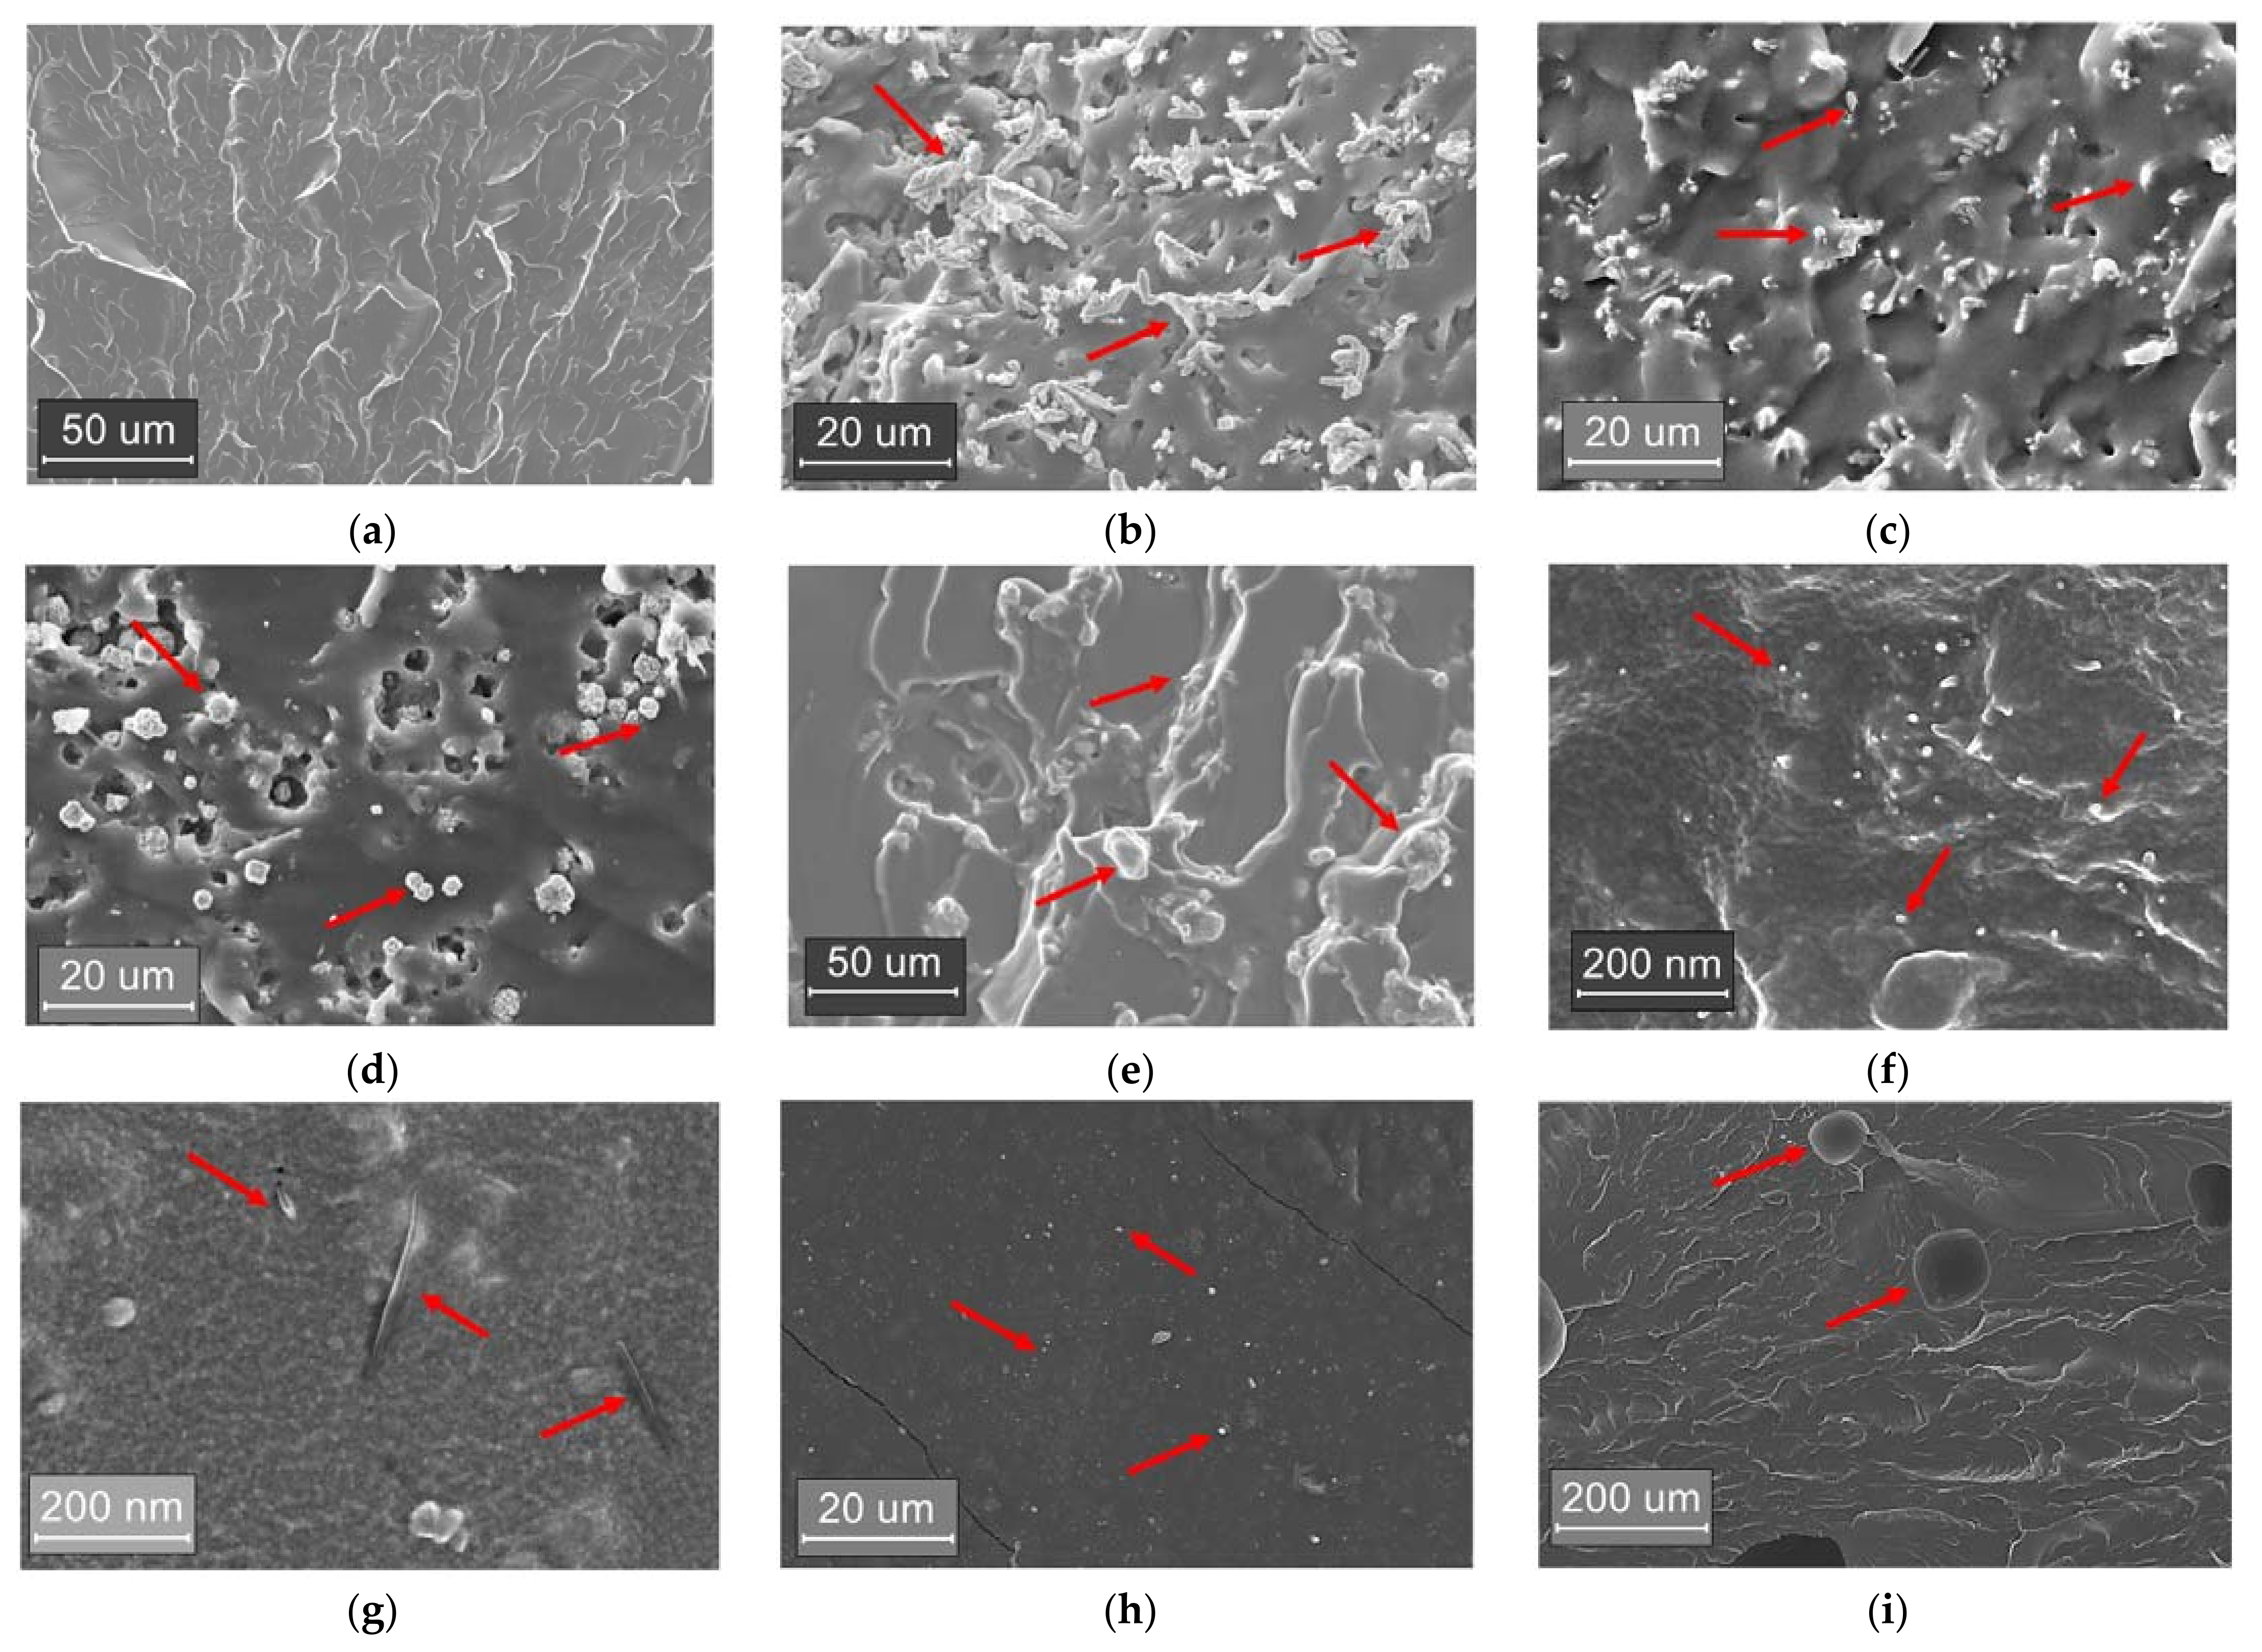
2.3.5. Scanning Electron Microscopy (SEM)

SEM (JCM-6000PLUS, JEOL) was performed on the cryo-fractured surface of samples to evaluate the distribution of the fillers in the polymeric matrix. The samples were covered with a 5 nm layer of gold and observed with a microscope.

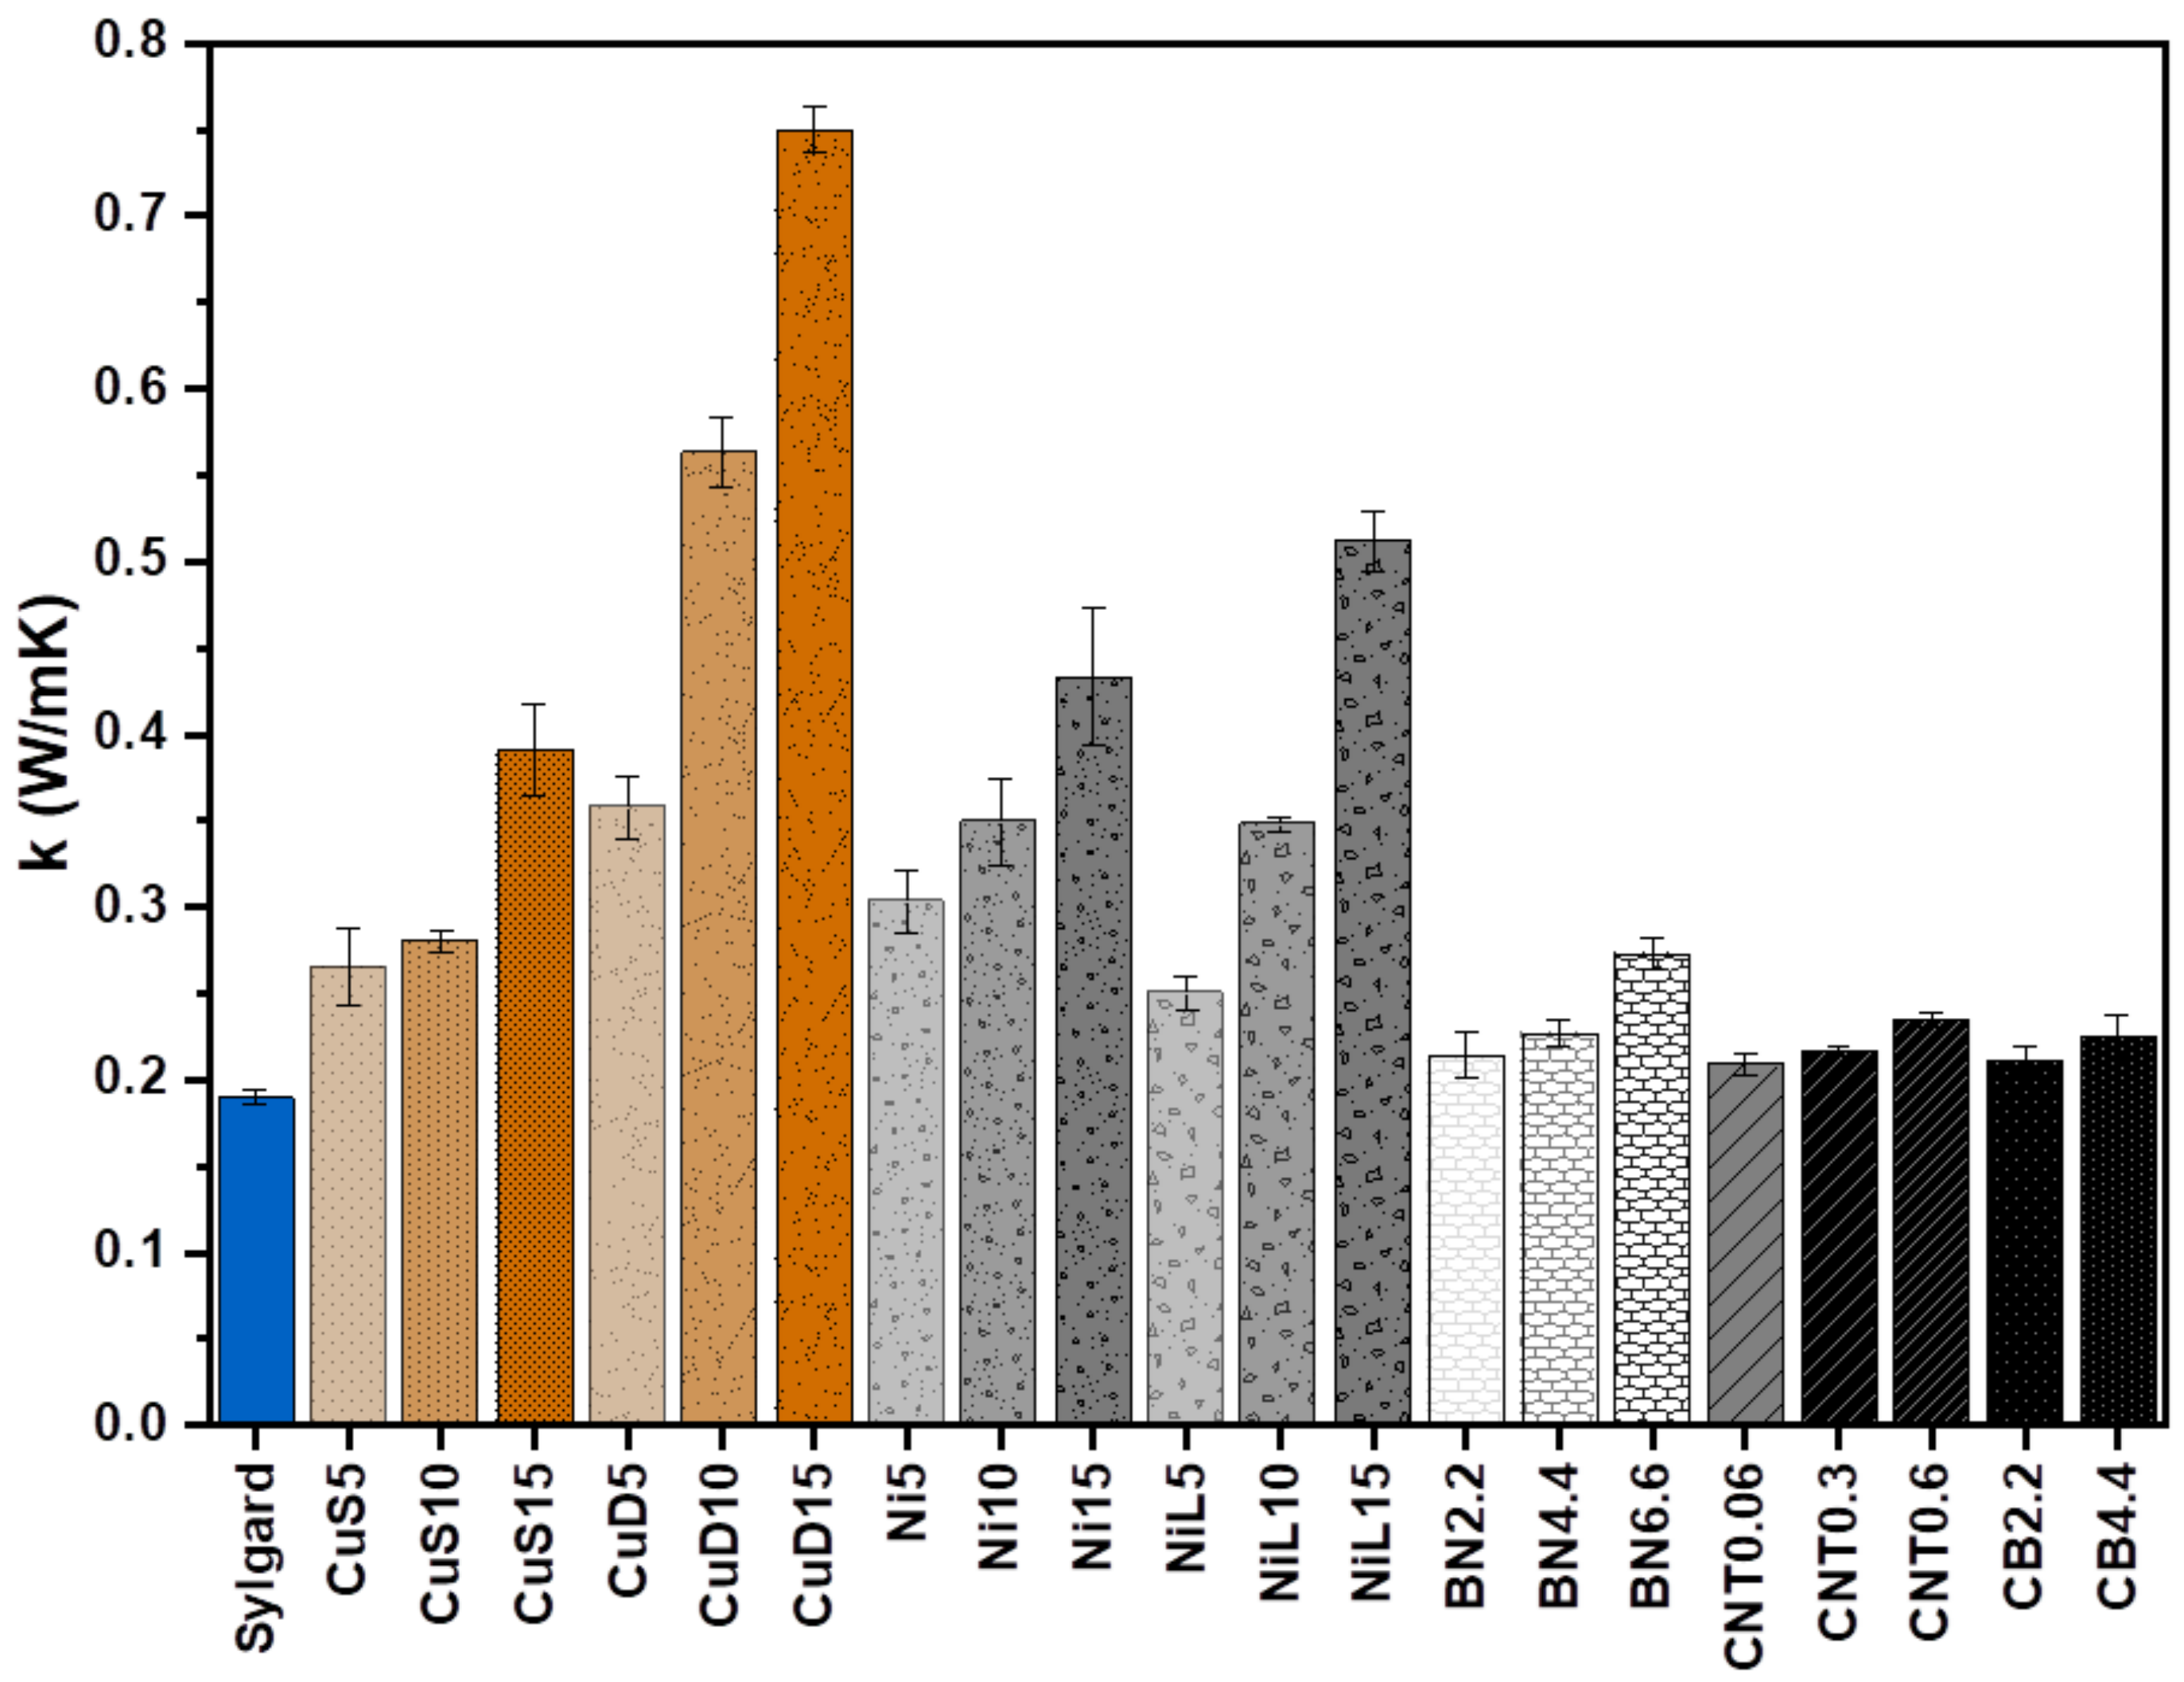
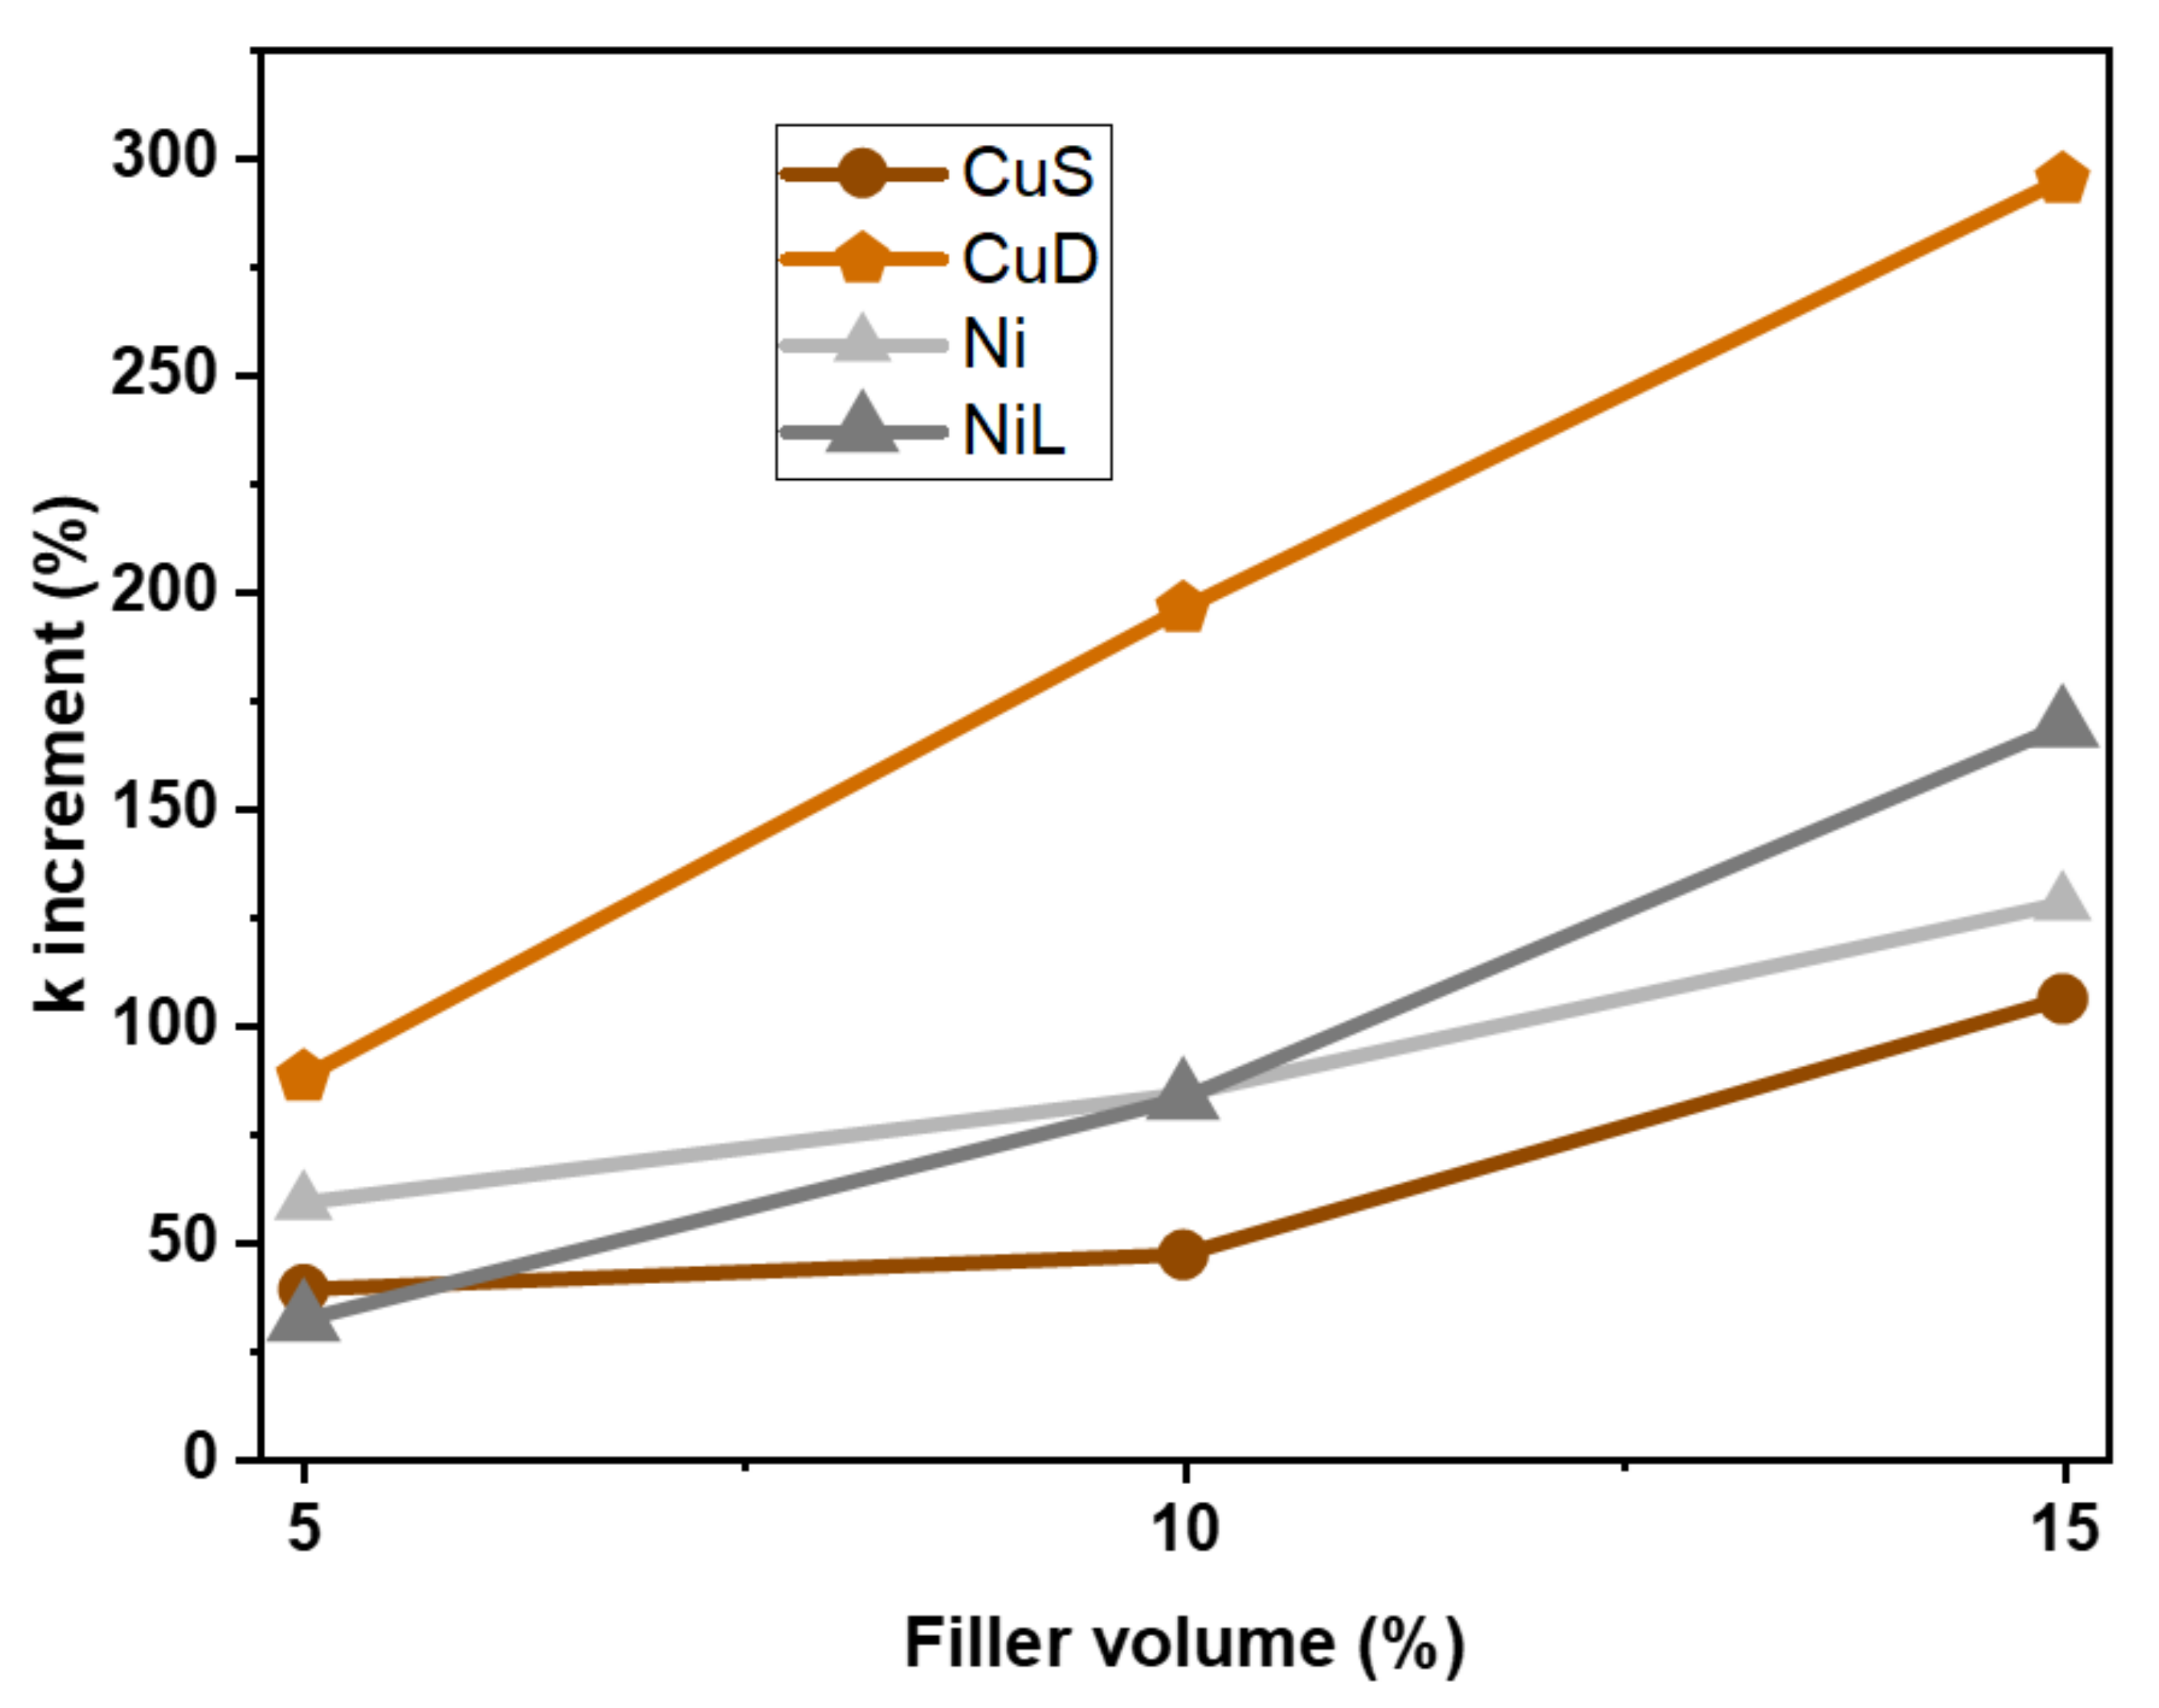
2.3.6. Thermal Analysis

Thermal conductivity (k) and thermal diffusivity (α) were measured through the transient plane heat source method according to ISO 22007-2 [30]. To carry out the measure the instrument (TPS2500S, Hot Disk AB, Walthman, MA, USA) was equipped with a sensor (5465, Kapton sensor, Hot Disk AB, Walthman, MA, USA) with 3.189 mm of radius. Two samples, for each formulation, were taken in contact with the sensor and they were placed in a container with a temperature controller (Haake AC200, Thermo Scientific Inc., Walthman, MA, USA), which set the temperature at 23 ± 0.01 °C. The measure time was 2 min, and it started after the impulse of 30 mW. The samples had parallelepiped shapes with the following sizes: 20 × 20 × 4 mm3 (length × width × thickness).
The measures performed with Hot Disk were compared with analysis through a thermal imaging camera (FLIR A315/A615, INPROTEC IRT, Milano, Italy) with thermal sensibility < 0.05 °C with 10 Hz of frequency to record the temperature. The temperature of a hot plate was set at 90 °C and the thermal imaging camera was placed in a way that it could record temperature variation on the plate surface, then the samples (dimension 55 × 55 × 0.5 mm3) were positioned on it, ensuring a perfect contact between plate and sample. To evaluate an average trend of temperature, four points for each sample were considered and the measure was repeated three times.

3. Results and Discussion

The goal of this study is to evaluate how thermally conductive filler parameters such as nature of the filler, shape, dimension, and surface/volume ratio (qualitative analysis) will influence the enhancement of k value of silicon-based composites.
The highest load of filler was optimized considering the workability of the different formulations. The highest concentration of metal particles was 15% in volume because this is the maximum value for acceptable workability of the formulation with dendritic copper. The best formulation in terms of workability for carbon black was 4.4% thus we selected the same maximum content for boron nitride, nevertheless with this filler it was possible to further increase the content up to 6.6 vol% still keeping a good viscosity of the formulation. Formulations with CNT allowed addition of 0.6% in volume as maximum because of the strong detrimental effect on workability of this type of filler.

3.1. Thermal Curing

ATR-FTIR analysis was performed to evaluate curing of the composite samples. The spectrum of uncured Sylgard + curing agent showed a characteristic peak at 2160 cm−1, which is attributable to the stretching vibration of Si-H groups, related to the curing agent [28,31]. Figure 1 shows the pristine Sylgard (Figure 1a) and the formulation CuS5 (Figure 1b) as an example of filled formulation, before and after the thermal treatment. In all the cured formulations, the peak at 2160 cm−1 completely disappeared after thermal treatment, confirming that the proposed thermal curing process (150 °C, 60 min) fulfilled the cross-linking of the elastomeric matrix despite the presence of fillers (all the ATR-FTIR analysis are reported in the Supplementary Materials Figures S1–S5).
Curing reaction was also followed by DSC analysis. The thermogram in the scan mode for pristine Sylgard (Figure 2a) exhibited a curing peak centered at 96 °C, meaning that the curing rate is maximum around this temperature. From this thermogram in the scan mode, the cure is complete in the first run since the second heating did not present any residual peak. To mimic the curing condition of the composite in the oven, isothermal analyses were performed at different temperatures as shown in Figure 2b. It is evident the increase of reactivity by increasing the temperature. The addition of the filler did not influence the curing kinetics since the position of the peak was almost unchanged for all tested compositions as shown in Figure 3 and in Table 2. The DSC result is in agreement with the ATR-FTIR analysis and both confirmed that the addition of fillers in the formulation did not influence the curing process. A previous study on epoxy matrix [32], showed the influence of the filler on the curing, this was not seen in our study since all the composite cured properly in the selected temperature and timing. The influence of the filler and matrix can explain the different behavior with respect to the previous study.

3.2. Morphology of the Composite

SEM analyses were performed on crosslinked composites to investigate the distribution of the fillers in the polymer matrix. The Figure 4 reports examples of the morphology for the compositions with the highest amount of filler, and it is evident that the different types of filler did not form aggregates, but they were homogeneously dispersed into the matrix. The particles did not form a continuous path limiting the enhancement of k (see paragraph 3.4). In the Figure 4i voids can be seen as marked with red arrows. This can contribute to the limited enhancement of k, especially for the carbon-based filler. The characteristic morphology of dendritic copper is well shown in Figure 4b. Moreover, all the composite showed a good interaction between polymer matrix and filler. In fact, no discontinuities at the interface were detected.

3.3. Thermal-Mechanical Properties

The effect of the dispersed fillers on the thermo-mechanical properties of crosslinked silicone composites was evaluated by DMTA. As reported in Table 2, the addition of the filler did not significantly influence the Tg of the crosslinked polymer matrix. Indeed, all the measured Tg lay within −125 °C and −115 °C. Figure 5 shows, as an example, the tanδ curves for the Sylgard containing spheroidal copper (all results are reported in Supplementary Materials Figures S6–S11). The increased Tg can be explained by the hindrance effect of the filler to the motion of PDSM chains. This result was in accordance with some previous researches [5,6,18].
Tensile tests were carried out on carbon-based composites. The effect of the addition of the filler is shown in Figure 6. The filler influenced the rigidity of the matrix increasing the Young Modulus. The Young Modulus for pristine Sylgard was measured to be 1.16 MPa. The dispersion of CB induced an enhancement of the value to 1.84 MPa and 2.72 MPa respectively for the silicone composite containing 2.2 vol% and 4.4 vol%. When CNTs were dispersed a Young modulus of 1.90 MPa was achieved in the presence of 0.06 vol% of CNT, a value of 2.00 MPa for the composite containing 0.3 vol% and a value of 2.55 MPa for the sample containing 0.6 vol% of the filler. The strain at break point was reduced for the composites with respect to the pristine crosslinked Sylgard. Considering these results, it can be assumed that the mechanical effect of the filler was the increasing of rigidity of the PDMS matrix. Previous study showed similar effect of BN on PDMS-like matrix [6] and of dendritic Cu on polyester resin [33].
Thermal conductivity of pristine crosslinked Sylgard was measured, obtaining a value of 0.19 W/mK. The addition of metal particles increased k values and the data are collected in Figure 7. The dispersion of metal fillers induced an increase of k as a function of filler volume content. Both spheroidal copper and dendritic copper powders led to a large increase of thermal conductivity (Figure 8), it was possible to achieve an enhancement of the k value of Sylgard by 105% when spheroidal copper was added (CuS15), and about 300%, when dendritic copper was dispersed in the silicon matrix (CuD15). While in the case of spheroidal copper it was not possible to observe a linear increase of k as a function of filler content, this is evident in the case of dendritic copper, showing the important role played by the shape of the particles, as it will be further discussed below. These results were consistent with previous studies reported in literature [24,25], where it was observed that spheroidal Cu particles had a lower impact compared to elongated forms of Cu particles on increasing thermal conductivity of polymer composites. This study showed higher % increment respect to the pristine matrix if compared with the previous data cited in literature and report a new composite considering the PDMS as polymer matrix.
Similarly, the Ni particles dispersion within the polymeric matrix showed an enhancement of the k value, achieving higher values by using larger particles (see data collected in Figure 7 and Figure 8) at a content of 15 vol% with a successful enhancement of k of around 150%. These results are in agreement with the data reported in literature [4,10,33], where larger particles are more likely to produce a heat-conductive path in the materials with a higher enhance the thermal conductivity.
The dispersion of boron nitride particles did not show a significant increase of k, compared to pristine silicon crosslinked matrix, especially at low volume percentage. A clear variation of k can be noticed only for the formulation containing the highest tested content of the filler (6.6% in volume), showing an increase of k of about 43%. The lower thermal conductivity enhancement could be attributed to the lack of percolation threshold because of particles shape. The effect of boron nitride filler at a low percentage is discussed in many studies [6,20,34].
The samples containing CNTs showed lower enhancement of thermal conductivity; however, it is important to mention that the maximum load of CNT was fixed at 0.6 vol%, a much lower value compared to the maximum concentration achieved for metal particles (15 vol%). This is due to the detrimental effect of the CNT filler on workability. The composite with the lowest amount of CNT shows a k increase of 9% with respect to the matrix, whereas by further increasing the CNT content up to 0.3 vol% or 0.6 vol% it was not achieved any further significant increase. This could be attributed to the fact that it was not reached the percolation threshold which could allow to have a good heat conductivity within the polymeric matrix. Nevertheless, it is evident the higher thermal conductivity enhancement with respect to BN at a much lower volume fraction. This could be attributed both to the higher k value of CNT (CNT 2000–6000 W/mK) with respect to BN (250–300 W/mK) [34], as well as to the higher surface area of the CNTs with respect to the BN particles. In fact, the filler–matrix interface plays an important role in thermal conductivity: fillers with a higher surface/volume ratio are more efficient in improving thermal conductivity [34]. This was already demonstrated by comparing spheroidal and dendritic copper filler at the same volume content and showing the higher efficiency of the dendritic particles, which shows higher S/V ratio. The qualitative analysis considering spheroidal shape (lower S/V ratio) and dendritic shape (higher S/V ratio) was confirmed also in this study as the k value demonstrate. The best thermal behavior of composite elastomers can be achieved by selecting the proper combination in terms of filler type, shape, dimension, and surface/volume ratio.
The thermal diffusivity values (α) are directly connected to thermal conductivity (k), and the data for all investigated composites are collected in Figure 9. It is evident a thermal diffusivity enhancement for all the investigated fillers, and in agreement with the results of thermal conductivity, the size and shape of the fillers can strongly influence heat dispersion throughout the composite.
The thermal conductive properties evaluation of the composites, measured by means of Hot Disk, were compared with the measurements through a thermal imaging camera, where the variation of temperature as a function of time indicates the thermal diffusivity; the collected data are in agreement with the Hot Disk results. All the measurements are reported in the Supplementary Material (Figures S12–S18).

4. Conclusions

The study demonstrated the influence of various fillers in thermal properties of silicon polymer base composite through a simple and easily repeatable method used to create the composites. Any tested formulation did not widely influence the Tg of the silicon, whereas the fillers increased the rigidity of the PDMS matrix, affecting the characteristic properties of the polymer itself. The nature of the filler affected the thermal conductivity. Among the metals tested, dendritic Cu returned the highest increment (reaching an increment of 300% with respect to the pristine polymer matrix). The volume filler influenced the thermal conductivity, obtaining the best results with the highest added volume filler. Moreover, the shape affected the thermal conductivity and the dimension of the particle influenced the result, in fact, considering the Ni case, larger particles showed a higher increase of thermal conductivity (the k was 150% higher that the pristine matrix). The CNT had an interesting result considering the introduced amount of filler with respect the other tested type.
By this comprehensive investigation we could clarify the filler parameters which affect the thermal conductivity of the silicone composites. The best thermal behavior can be achieved by selecting the proper combination in terms of filler type, shape, dimension, and surface/volume ratio.

Supplementary Materials

The following are available online at https://www.mdpi.com/article/10.3390/app11125663/s1, Figure S1. ATR-FTIR for composite with spheroidal copper; Figure S2. ATR-FTIR for composite with smallest Ni particles; Figure S3. ATR-FTIR for composite with biggest Ni particles; Figure S4. ATR-FTIR for composite with BN; Figure S5. ATR-FTIR for composite with CNT; Figure S6. DMTA for composite with spheroidal copper; Figure S7. DMTA for composite with Ni particles; Figure S8. DMTA for composite with the largest Ni particles; Figure S9. DMTA for composite with boron nitride nanoparticles; Figure S10. DMTA for composite with CNT; Figure S11. DMTA for composite with carbon black nanoparticles; Figure S12. Thermocamera result for the composite with carbon nanotubes; Figure S13. Thermocamera result for the composite with Ni (large particles); Figure S14. Thermocamera result for the composite with Ni (small particles); Figure S15. Thermocamera result for the composite with dendritic Cu particles; Figure S16. Thermocamera curves for the composite with spheroidal Cu particles; Figure S17. Thermocamera result for the composite with carbon black; Figure S18. All curves compared with Sylgard measured with the thermocamera.

Author Contributions

Conceptualization, S.S., M.S. and A.T.; investigation, G.R., L.P. and S.L.; writing—original draft preparation, G.R., L.P., S.L., A.T., S.S. and M.S.; supervision, S.S. and M.S.; project administration, S.S. All authors have read and agreed to the published version of the manuscript.

Funding

This research was funded by the European Commission through the local agency Finpiemonte within the project “4CUSTHER” (Manunet call 2019), grant number MNET19/NMAT-3622.

Conflicts of Interest

The authors declare no conflict of interest.

References

  1. Sim, L.C.; Ramanan, S.R.; Ismail, H.; Seetharamu, K.N.; Goh, T.J. Thermal characterization of Al2O3 and ZnO reinforced silicone rubber as thermal pads for heat dissipation purposes. Thermochim. Acta 2005, 430, 155–165. [Google Scholar] [CrossRef]
  2. Huang, Z.; Wu, W.; Drummer, D.; Liu, C.; Wang, Y.; Wang, Z. Enhanced the Thermal Conductivity of Polydimethylsiloxane via a Three-Dimensional Hybrid Boron Nitride@Silver Nanowires Thermal Network Filler. Polymers 2021, 13, 248. [Google Scholar] [CrossRef] [PubMed]
  3. Mamunya, Y.P.; Davydenko, V.V.; Pissis, P.; Lebedev, E. V Electrical and thermal conductivity of polymers filled.pdf. Eur. Polym. J. 2002, 38, 1887–1897. [Google Scholar] [CrossRef]
  4. Sanada, K.; Tada, Y.; Shindo, Y. Thermal conductivity of polymer composites with close-packed structure of nano and micro fillers. Compos. Part A Appl. Sci. Manuf. 2009, 40, 724–730. [Google Scholar] [CrossRef]
  5. Sangermano, M.; Razza, N.; Graham, G.; Barandiaran, I.; Kortaberria, G. Electrically insulating polymeric nanocomposites with enhanced thermal conductivity by visible-light curing of epoxy-boron nitride nanotube formulations. Polym. Int. 2017, 66, 1935–1939. [Google Scholar] [CrossRef]
  6. Pezzana, L.; Riccucci, G.; Spriano, S.; Battegazzore, D.; Sangermano, M.; Chiappone, A. 3D Printing of PDMS-Like Poly-mer Nanocomposites with Enhanced Thermal Conductivity: Boron Nitride Based Photocuring System. Nanomaterials 2021, 11, 373. [Google Scholar] [CrossRef] [PubMed]
  7. Mu, Q.; Feng, S. Thermal conductivity of graphite/silicone rubber prepared by solution intercalation. Thermochim. Acta 2007, 462, 70–75. [Google Scholar] [CrossRef]
  8. Shen, M.-X.; Cui, Y.-X.; He, J.; Zhang, Y.-M. Thermal conductivity model of filled polymer composites. Int. J. Miner. Met. Mater. 2011, 18, 623–631. [Google Scholar] [CrossRef]
  9. Chen, H.; Ginzburg, V.; Yang, J.; Yang, Y.; Liu, W.; Huang, Y.; Du, L.; Chen, B. Thermal conductivity of polymer-based composites: Fundamentals and applications. Prog. Polym. Sci. 2016, 59, 41–85. [Google Scholar] [CrossRef]
  10. Guo, Y.; Ruan, K.; Shi, X.; Yang, X.; Gu, J. Factors affecting thermal conductivities of the polymers and polymer composites: A review. Compos. Sci. Technol. 2020, 193, 108134. [Google Scholar] [CrossRef]
  11. Wang, M.; Pan, N. Predictions of effective physical properties of complex multiphase materials. Mater. Sci. Eng. R Rep. 2008, 63, 1–30. [Google Scholar] [CrossRef]
  12. Han, Z.; Fina, A. Thermal conductivity of carbon nanotubes and their polymer nanocomposites: A review. Prog. Polym. Sci. 2011, 36, 914–944. [Google Scholar] [CrossRef] [Green Version]
  13. Balandin, A.A. Thermal properties of graphene and nanostructured carbon materials. Nat. Mater. 2011, 10, 569–581. [Google Scholar] [CrossRef] [PubMed] [Green Version]
  14. Mokhena, T.C.; Mochane, M.J.; Sefadi, J.S.; Motloung, S.V.; Andala, D.M. Thermal Conductivity of Graphite-Based Polymer Composites. Impact Therm. Conduct. Energy Technol. 2018, 181. [Google Scholar] [CrossRef] [Green Version]
  15. Liu, C.H.; Huang, H.; Wu, Y.; Fan, S.S. Thermal conductivity improvement of silicone elastomer with carbon nanotube loading. Appl. Phys. Lett. 2004, 84, 4248–4250. [Google Scholar] [CrossRef]
  16. Tessema, A.; Zhao, D.; Moll, J.; Xu, S.; Yang, R.; Li, C.; Kumar, S.K.; Kidane, A. Effect of filler loading, geometry, dispersion and temperature on thermal conductivity of polymer nanocomposites. Polym. Test. 2017, 57, 101–106. [Google Scholar] [CrossRef] [Green Version]
  17. Che, J.; Wu, K.; Lin, Y.; Wang, K.; Fu, Q. Largely improved thermal conductivity of HDPE/expanded graphite/carbon nanotubes ternary composites via filler network-network synergy. Compos. Part A Appl. Sci. Manuf. 2017, 99, 32–40. [Google Scholar] [CrossRef]
  18. Zhao, Y.-H.; Zhang, Y.-F.; Bai, S.-L. High thermal conductivity of flexible polymer composites due to synergistic effect of multilayer graphene flakes and graphene foam. Compos. Part A Appl. Sci. Manuf. 2016, 85, 148–155. [Google Scholar] [CrossRef]
  19. Yi, P.; Awang, R.A.; Rowe, W.; Kalantar-Zadeh, K.; Khoshmanesh, K. PDMS nanocomposites for heat transfer enhancement in microfluidic platforms. Lab A Chip 2014, 14, 3419–3426. [Google Scholar] [CrossRef]
  20. Zhou, W.-Y.; Qi, S.-H.; Zhao, H.-Z.; Liu, N.-L. Thermally conductive silicone rubber reinforced with boron nitride particle. Polym. Compos. 2007, 28, 23–28. [Google Scholar] [CrossRef]
  21. Gu, J.; Meng, X.; Tang, Y.; Li, Y.; Zhuang, Q.; Kong, J. Hexagonal boron nitride/polymethyl-vinyl siloxane rubber dielectric thermally conductive composites with ideal thermal stabilities. Compos. Part A Appl. Sci. Manuf. 2017, 92, 27–32. [Google Scholar] [CrossRef]
  22. Kemaloglu, S.; Ozkoc, G.; Aytac, A. Properties of thermally conductive micro and nano size boron nitride reinforced silicon rubber composites. Thermochim. Acta 2010, 499, 40–47. [Google Scholar] [CrossRef]
  23. Fu, Y.-X.; He, Z.-X.; Mo, D.-C.; Lu, S.-S. Thermal conductivity enhancement with different fillers for epoxy resin adhesives. Appl. Therm. Eng. 2014, 66, 493–498. [Google Scholar] [CrossRef]
  24. Tekce, H.S.; Kumlutas, D.; Tavman, I.H. Effect of Particle Shape on Thermal Conductivity of Copper Reinforced Polymer Composites. J. Reinf. Plast. Compos. 2007, 26, 113–121. [Google Scholar] [CrossRef]
  25. Boudenne, A.; Ibos, L.; Fois, M.; Majesté, J.; Géhin, E. Electrical and thermal behavior of polypropylene filled with copper particles. Compos. Part A Appl. Sci. Manuf. 2005, 36, 1545–1554. [Google Scholar] [CrossRef]
  26. Yin, C.-G.; Liu, Z.-J.; Mo, R.; Fan, J.-C.; Shi, P.-H.; Xu, Q.-J.; Min, Y.-L. Copper nanowires embedded in boron nitride nanosheet-polymer composites with enhanced thermal conductivities for thermal management. Polymer 2020, 195, 122455. [Google Scholar] [CrossRef]
  27. Wolf, M.P.; Salieb-Beugelaar, G.B.; Hunziker, P. PDMS with designer functionalities—Properties, modifications strategies, and applications. Prog. Polym. Sci. 2018, 83, 97–134. [Google Scholar] [CrossRef]
  28. Murphy, E.C.; Dumont, J.H.; Park, C.H.; Kestell, G.; Lee, K.; Labouriau, A. Tailoring properties and processing of Sylgard 184: Curing time, adhesion, and water affinity. J. Appl. Polym. Sci. 2020, 137, 1–10. [Google Scholar] [CrossRef]
  29. D20 Committee. Test Method for Tensile Properties of Thin Plastic Sheeting; ASTM International: West Conshohocken, PA, USA, 2018. [Google Scholar]
  30. ISO. ISO 22007-2 Plastics—Determination of Thermal Conductivity and Thermal Diffusivity—Part 2: Transient Plane Heat Source (Hot Disc) Method; ISO: Geneva, Switzerland, 2015. [Google Scholar]
  31. González-Rivera, J.; Iglio, R.; Barillaro, G.; Duce, C.; Tinè, M.R. Structural and Thermoanalytical Characterization of 3D Porous PDMS Foam Materials: The Effect of Impurities Derived from a Sugar Templating Process. Polymers 2018, 10, 616. [Google Scholar] [CrossRef] [PubMed] [Green Version]
  32. Zhao, Y.; Drummer, D. Influence of Filler Content and Filler Size on the Curing Kinetics of an Epoxy Resin. Polymers 2019, 11, 1797. [Google Scholar] [CrossRef] [PubMed] [Green Version]
  33. Yaman, K.; Taga, Ö. Thermal and Electrical Conductivity of Unsaturated Polyester Resin Filled with Copper Filler Composites. Int. J. Polym. Sci. 2018, 2018, 8190190. [Google Scholar] [CrossRef] [Green Version]
  34. Ha, J.-U.; Hong, J.; Kim, M.; Choi, J.K.; Park, D.W.; Shim, S.E. Improvement of Thermal Conductivity of Poly(dimethyl siloxane) Composites Filled with Boron Nitride and Carbon Nanotubes. Polym. Korea 2013, 37, 722–729. [Google Scholar] [CrossRef] [Green Version]
Figure 1. ART-FTIR spectra; (a) spectra of Sylgard pristine formulation (Entry 1; Table 1) before (orange curve) and after (blue curve) thermal curing at 150 °C. zoom of the Si-H peak at 2160 cm−1 in the insert of the graph; (b) spectra filled Sylgard formulation containing spheroidal Cu (Entry 2, 3, 4; Table 1), before (blue curve) and after (red curves) thermal curing at 150 °C. Zoom of the Si-H peak at 2160 cm−1 in the insert of the graph.
Applsci 11 05663 g001
Figure 2. DSC thermogram; (a) thermogram curve for the pristine Sylgard, first heating ramp with curing peak at 96 °C (blue continuous curve) and second heating curve (blue dot curve); (b) thermogram in isothermal mode for Sylgard at different temperatures.
Applsci 11 05663 g002
Figure 3. DSC thermogram of isothermal curing at 150 °C for the tested formulations.
Applsci 11 05663 g003
Figure 4. SEM imagines for composite, the red arrows highlight the filler and in the picture I the voids; (a) pristine Sylgard, 100×; (b) Cu15D, 400×; (c) Cu15S, 4000×; (d) Ni15, 400×; (e) NiL15, 100×; (f) BN6.6, 10,000×; (g) CNT0.6, 10,000×; (h) CB4.4, 400×; (i) CB4.4 100×.
Applsci 11 05663 g004
Figure 5. Tanδ curve of DMTA analysis for the composite containing dendritic copper particles.
Applsci 11 05663 g005
Figure 6. Tensile test results; (a) stress-strain curves for Sylgard composites containing CB; (b) stress-strain curves for Sylgard composites containing CNTs.
Applsci 11 05663 g006
Figure 7. k values of the different composite measured by Hot Disk.
Applsci 11 05663 g007
Figure 8. Percentage of k increment related to pristine Sylgard of the different metal-based composites.
Applsci 11 05663 g008
Figure 9. Thermal diffusivity (α) of the different composite measured by Hot Disk.
Applsci 11 05663 g009
Table 1. Composition of the tested formulations, showing the different fillers and the volume percentage used for the comparison; weight percentage of the filler is reported.
EntryAcronymSylgard Matrix + CURING Agent
(Vol %)
Type of FillerFiller (Vol %)Filler (wt.%)
1Sylgard100.00/0.000.00
2CuS595.00Spheroidal copper powder5.0030.95
3CuS1090.00Spheroidal copper powder10.0048.60
4CuS1585.00Spheroidal copper powder15.0060.00
5CuD595.00Dendritic copper powder5.0030.95
6CuD1090.00Dendritic copper powder10.0048.60
7CuD1585.00Dendritic copper powder15.0060.00
8Ni595.00Nickel powder (3–7 μm)5.0030.80
9Ni1090.00Nickel powder (3–7 μm)10.0048.50
10Ni1585.00Nickel powder (3–7 μm)15.0059.95
11NiL595.00Nickel powder (<45 μm)5.0030.80
12NiL1090.00Nickel powder (<45 μm)10.0048.50
13NiL1585.00Nickel powder (<45 μm)15.0059.95
14BN2.297.80Boron nitride nanoparticles2.204.70
15BN4.495.60Boron nitride nanoparticles4.409.12
16BN6.693.40Boron nitride nanoparticles6.6013.30
17CNT0.0699.94Carbon nanotubes0.060.10
18CNT0.399.70Carbon nanotubes0.300.50
19CNT0.699.40Carbon nanotubes0.601.00
20CB2.297.80Carbon black2.203.90
21CB4.495.60Carbon black4.407.65
Table 2. Time-curing peak and TG values of silicone composites.
EntryAcronymTime Curing Peak
(s)
Tg
(°C)
1Sylgard9−121
2CuS5-−120
3CuS10-−119
4CuS1513−116
5CuD5-−119
6CuD10-−118
7CuD159−116
8Ni5-−118
9Ni10-−117
10Ni1511−116
11NiL5-−118
12NiL10-−115
13NiL1512−114
14BN2.2-−120
15BN4.4-−119
16BN6.610−118
17CNT0.06-−118
18CNT0.3-−118
19CNT0.68−118
20CB2.2-−120
21CB4.48−119
Publisher’s Note: MDPI stays neutral with regard to jurisdictional claims in published maps and institutional affiliations.

