Abstract
There is increasing demand for the on-board diagnosis of lubricating oils. In this research, we consider various sensor principles for on-board diagnosis of the thermal aging of engine oils. One of the parameters investigated is the viscosity of the lubricating oil, which can be efficiently measured using a microacoustic sensor. Compared with conventional viscometers, these sensors probe a different rheological domain, which needs to be considered in the interpretation of measurement results. This specific behavior is examined by systematically investigating engine oils, with and without additive packages, that were subjected to a defined artificial aging process. This paper presents design strategies for the algorithm developed and applied for direct on-board diagnosis of engine oil conditions with a fluid property sensor; this enables prediction of remaining oil life and optimization of oil change intervals, thereby minimizing the likelihood of dramatic engine failure and reducing maintenance costs. After a general description of the principles of sensor measurement, different engine oil contaminants, aging phenomena, and associated sensor detection and measurement capabilities are discussed.
1. Introduction
Lubricating oil in an internal diesel engine is exposed to various strains that depend on operating conditions, fuel quality, ambient conditions, and operating parameters. The rate of deterioration strongly depends on these influences. To avoid engine failure, the oil must be changed before it loses its protective properties. However, an unnecessary oil change should be avoided for environmental and economic reasons. To reliably determine the optimum oil change interval, it is necessary to monitor the actual physical and chemical conditions of the oil [1,2].
The aging process of the oil is very much influenced by, among other things, fuel quality, because of the blow-by gases of the combustion process [3,4]. Therefore, especially for gas engines fueled with biogas of a priori unknown and fluctuating fuel quality, direct monitoring of the oil condition is essential [5].
According to the current state-of-the-art for automotive applications, the condition of engine oil is estimated by means of indirect methods that mainly rely on operating parameters, such as engine speed, performance, and temperature [6].
For large-scale stationary engines, a more reliable, but also more elaborate approach is currently used, in which oil samples are taken at regular intervals for off-line laboratory analysis to determine the optimal oil change interval [7,8]. The disadvantages of this method are high fixed costs and the delay between sample drawing and return of analysis results.
Currently developed alternative approaches are aimed at utilizing sensors to provide input for on-board diagnosis systems that determine the current oil condition inside an engine. The sensor signals should provide information on the actual physical and chemical oil quality to provide the information needed for the prediction algorithms, as shown in Figure 1. Moreover, the sensors should exhibit a long lifetime, even though they are continuously exposed to an aggressive environment inside an operating combustion engine [9,10]. The entire system should give a reliable indication of the current oil condition and estimate when the oil will reach the end of its lifetime and an oil change will be necessary.
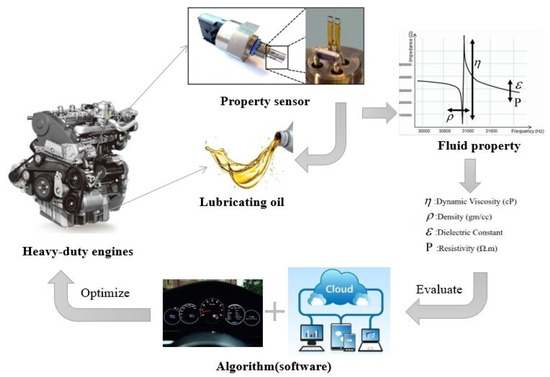
Figure 1.
Structure of a sensor-assisted algorithm for a lubrication-monitoring system. The indirect data provided by the engine management system and its relationship to oil wear will depend on the actual engine platform used, whereas the data provided by the sensors are directly linked to the oil condition and are thus platform-independent.
Previous attempts in the automotive field were based on measuring the permittivity or conductivity of the oil [11].
Although these parameters are measured directly in the oil, they are of limited use because they are influenced by many different oil wear mechanisms; this results in a signal that is of only limited utility. There have also been attempts to sense a representative chemical parameter directly, but chemical sensors commonly exhibit a limited lifetime and show adverse properties with respect to aging and drift [12,13,14].
Monitoring of internal engine oil condition with a fluid property sensor definitively simplifies oil quality management by providing a higher capacity for detection of slow and rapid changes in oil contamination or quality levels, thereby enabling economical and environmentally friendly optimization of oil change intervals [15,16].
Waszczuk et al. [17] adopted the low frequency commercial piezoelectric tuning forks (QTFs) to the measurement of physicochemical properties of liquids, and the result showed that the applied measurement technique based on the analysis of the QTF equivalent electric circuit proved its usefulness for determining liquid viscosity in the range up to 16 cP. Gonzalez et al. [18] researched a novel sensor system for downhole measurements of viscosity, density, and other fluid properties. Gonzalez et al. [19] demonstrated the use of a tuning fork sensor for fast viscosity and density measurements that would enable the characterization of transient fluid properties, such as in multiphase flows of liquids. The result showed that by monitoring the frequency and the decay rate during ring-down, transient changes in density and viscosity could be obtained within milliseconds in liquids. Zhang et al. [20] presented a smart sensing system for viscosity and density measurement of viscous fluids. Using the PMN-PT transducer, the measured viscosity and density of fluids were extracted by analyzing the vibrational properties of the smart probe. Finite element analysis was conducted with COMSOL Multiphysics for theoretical calculation and lab tests were carried out to verify and evaluate the simulation results. Ghader et al. [21] studied a novel microelectromechanical sensor for simultaneous measurement of fluids viscosity and density.
Although this paper demonstrates the feasibility of an oil condition algorithm, the models and analyses are highly dependent on oil type and application characteristics. Specific studies should be performed with each application before implementation so as to adapt and optimize the described models [22].
2. Fluid Property Sensing
2.1. Fluid Property Sensor
A physical diagram of the fluid property sensor is shown in Figure 2. The measurement parameters of the fluid property sensor are shown in Table 1. The fluid property sensor directly and simultaneously measures the viscosity, density, dielectric constant, and temperature of nonconductive fluids. Relying on patented tuning fork technology, the sensor monitors the direct and dynamic relationship between multiple physical properties to determine the quality, condition and contaminant loading of fluids such as engine oil, fuel, transmission and brake fluids, hydraulic and gear oils, refrigerants, and solvents. The capacity for multiparametric analysis improves fluid characterization algorithms. The fluid property sensor provides in-line monitoring of fluids for a wide range of OEM and aftermarket installations, including fluid reservoirs, process lines and pressurized high flow conduits (e.g., engine oil gallery) and for applications that include on- and off-road vehicles, compressors, industrial equipment and turbines. This paper will focus principally on engine oil applications, but most of these analyses can be adapted or replicated for other applications [23,24].
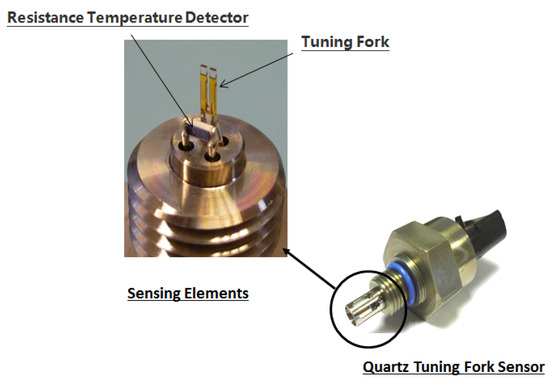
Figure 2.
Physical view of quartz tuning fork sensor.

Table 1.
Measurement parameters of the sensor.
The hardware circuit design of this paper consists of two parts, an STM32F103 microcontroller system control circuit and impedance measurement circuit based on AD5933 impedance measurement chip. The hardware structure of the system is shown in Figure 3. The AD5933 chip is integrated with a DDS frequency generator, I–V amplifier, low-pass filter circuit, A/D conversion circuit, and FFT module, which can realize impedance measurements based on the vector current–voltage method in a high integration environment with certain accuracy. The chip realizes data communication through the I2C interface.The hardware structure of the system is designed as follows:
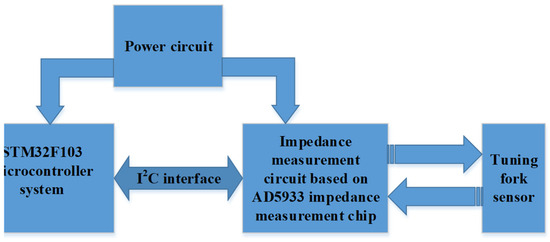
Figure 3.
Design of hardware circuit of the measurement system.
The peripheral circuit design of AD5933 is shown in Figure 4. The chip is powered by a 5-V power supply. The SCL and SDA pins of the microcontroller are used as I2C communication pins and are connected to the 15 and 16 pins of the AD5933 chip through a pull resistance of 10 kΩ. The AVDD and AGND of the analog circuit are directly connected with the VCC and GND, while the AVDD and DGND of the digital circuit are connected with the VCC and GND by a 10-uH chip inductor, respectively, to realize the separation of the analog and digital circuits. The input and output ends of the quartz tuning fork sensor are, respectively, connected to the VOUT, RFB and VINT pins of the AD5933 chip through the connectors; VOUT is the excitation voltage signal output, RFB is the external feedback resistance, and VINT is the transconductance amplifier input. Because the component to be tested is a quartz crystal oscillator, its impedance is large, so it is not necessary to increase the external amplifier circuit to improve the load capacity, and the output end of the chip is directly connected to the crystal oscillator, the measurement can be realized.
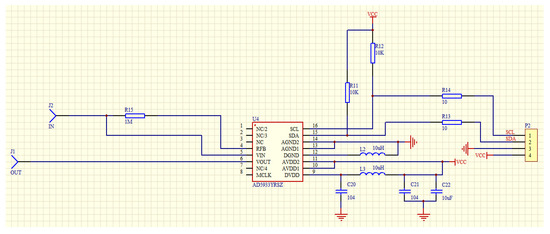
Figure 4.
AD5933 peripheral circuit diagram.
2.2. Measurement Principle
The fluid property sensor measurement is based on a tuning fork flexural resonator. This resonator is composed of quartz, a piezoelectric material capable of being deformed upon the application of a voltage and reciprocally electrically polarized under the action of mechanical stress. The two tines of the fork oscillate and generate a response indicative of the physicochemical and electrical properties of the fluid in which the sensor is immersed.
A sinusoidal excitation voltage applied to the tuning fork’s thin electrodes causes mechanical stress and periodic elastic deformation. This vibration produces a corresponding current through the electrodes. The ratio of the excitation voltage to the induced current allows measurement of the impedance of the system, and this process will be dependent on the excitation frequency, the elastic properties of the piezoelectric material, and the properties of the fluid. The quartz tuning fork impedance response in air has a sharp resonance at approximately 31 kHz. In a fluid, the resonance frequency and amplitude are reduced due to the increased mass load and frictional forces in the system [25,26].
As described in Figure 5, the calculation of the fluid properties is allowed through the use of a tuning fork equivalent electrical model.
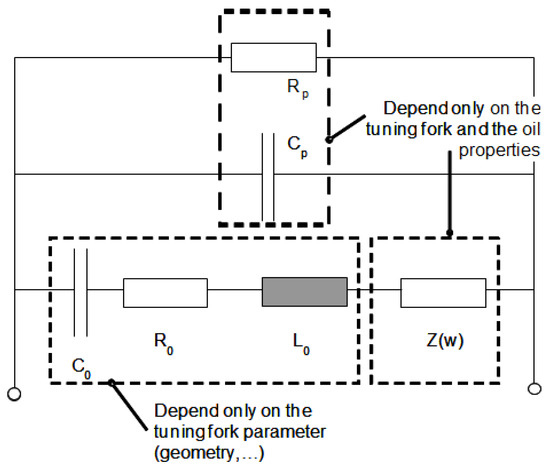
Figure 5.
Tuning fork equivalent electrical model.
The tuning fork complex impedance in air is modeled using the following formula:
Serial capacitance (Cs), resistance (R0) and inductance (L0) depend only on geometrical tuning fork parameters. Fluid impact is described by an additional term:
where ω is the excitation frequency, η is the dynamic viscosity, ρ is the density, and A and B are constants that depend on the resonator geometry [27].
The dielectric constant ε and the electrical resistivity Ρ are measured with the parallel capacitance (Cp) and resistance (Rp) [28,29]:
After a calibration step required to calculate each parameter, the fluid property sensor is used to measure the dynamic viscosity, density, dielectric constant, and Rp, an indication of resistivity, of the unknown fluid in which it is immersed.
For measuring the density “ρ”, the principle is that when the quartz tuning fork is immersed in the oil medium, its surface that is attached to the oil medium experiences effective mass changes, resulting in a reduction in resonance frequency; the use of density and effective mass of the relationship can be realized to measure the density of the oil medium. The principle of measuring viscosity (η) is that when the quartz tuning fork is used as the sensitive element, the impedance characteristics of its equivalent circuit will change due to the influence of viscosity. The purpose of online viscosity monitoring can be achieved by real-time monitoring of impedance. The measured temperature (T) is measured using a resistance temperature detector (RTD). The dielectric constant (ε) is calculated from the temperature measured by the RTD and the oil-related constant. The resistivity of a medium, P, refers to the resistance encountered by free carriers when moving in the medium under the action of an electric field. The resistivity of the oil depends on the viscosity of the fluid, the density of free charge carriers, and the specific chemical composition of the oil. Resistivity (Ρ) can be modeled in a simple linear form: P = H + I.T, where T is the temperature measured by the RTD, and H and I are constants related to oil.
2.3. Engine Oil
Engine oils are composed of paraffinic, naphthenic, and aromatic hydrocarbons mixed with different additives and elaborated to fulfill several functions: lubrication, sealing, power transmission, engine part cooling, cleaning, and neutralization of acid components.
The objective of lubrication is to reduce the friction between sliding surfaces and minimize wear. Insufficient lubrication leads to engine heating, oil degradation, and acceleration and higher risk of engine failures. Sealing between cylinders and piston rings is necessary to avoid blow-by fuel contamination and nitrogen oxide contamination from the combustion gas [30]. Sealing is also required between the valve and valve stem guides to prevent unburned fuel from reaching the oil. Power transmission increases engine efficiency and ensures tappet clearance and camshaft adjustment.
Proper lubrication, sealing, and power transmission are ensured by appropriate oil viscosity.
The viscosity of a fluid is a measure of its resistance to gradual deformation by shear stress. Dynamic viscosity can be defined by considering a fluid trapped between a fixed plate and a second plate moving at a velocity (u).
The friction between each fluid layer of area A leads to a force (F) resisting the relative motion.
Dynamic viscosity η is the proportionality factor relating F and the local shear velocity . Viscosity can also be expressed in other forms such as through kinematic viscosity µ (cSt), which is the ratio of dynamic viscosity η (cP) to density ρ (gm/cc) of the fluid. Viscosity is closely linked to the fluid temperature.
Kinematic viscosity µ (T) can be modeled with the following expression:
where T is the temperature in °C, log is the base 10 log, and B and C are oil-dependent constants.
Density (ρ) can be modeled in a simple linear form:
where D and E are oil dependent constants. Dynamic viscosity η (T) can be deduced from kinematic viscosity µ (T) and density ρ (T).
Base oil viscosity has a naturally high temperature dependence and is characteristically low [31]. To ensure efficient engine performance, oil viscosity should be sufficiently high at high temperature but not thick enough at low temperature to prevent easy engine start-up. To increase the viscosity index (VI), engine oils contain additives designed to improve the VI and these are composed of long–chained hydrocarbon polymers tightly folded at low temperatures and unfolded at high temperatures. Lubrication is also improved by anti-wear additives, which prevent friction between metallic surfaces during extreme operating conditions. Zinc dithiophosphate (ZDP) is an example of an anti-wear agent.
Incorrect sealing can lead to functional deficiency or foam formation. Foam inhibitor additives containing silicon compounds prevent formation of stable oil foams and improve air removal ability [32,33,34].
Oil cleaning is ensured by two types of additives: dispersants and detergents.
A dispersant is composed of a long, nonpolar oleophilic tail and a polar head. The function of the dispersant is to maintain solid or liquid contamination particles suspended in the oil and thus avoid any agglomeration that could lead to sludge formation. The two phenomena involved in this process are peptization and solubilization. Peptization consists of wrapping solid oil contamination particles (diameters of 50–150 nm), such as dust and soot, and keeping them in suspension. Solubilization uses the same mechanism, but it is related to liquid contaminants, such as acids or condensates (less than 20 nm).
A detergent is a colloidal metal-based additive and has a structure similar to that of the dispersant, but its tail is shorter and the polarity of its head is greater. Detergents are used to remove, or avoid formation of, carbon, varnish, or lacquer deposits and to neutralize acids created from combustion, oxidation, and nitration processes. Indeed, contaminating acids are dangerous because they can cause corrosion and accelerate oil degradation.
Engine oil also provides alkaline reserves to prevent acidification. The alkaline reserve can be determined by the value of the total base number (TBN). In the same way, acidity can be determined by the total acid number (TAN). The pH value is not suited for measurement in oil because the medium is not aqueous. The unit for TAN and TBN measurement is mg KOH/g, which corresponds to the equivalent mass of potassium hydroxide required to neutralize one gram of solution. Neutralization is ensured by the use of detergents. Some over-based detergents composed of calcium carbonate or magnesium carbonate achieve a high level of protection against acidity. However, they can lead to ash formation, which is problematic for diesel particulate filters. Manufacturers tend to use engine oils with a relatively low ash content, meaning lower TBN and alkaline reserves; this reduces resistance to chemical degradation.
During oil aging, polar compounds and charge carrier degradation products are created. In parallel, base additive compounds are depleted, decreasing protection against acidification. The electrical and chemical behaviors of these substances have a direct impact on the oil dielectric constant (ε) and resistivity (Ρ).
The dielectric constant (ε) or relative permittivity is the ratio of media permittivity to vacuum permittivity. The dielectric constant represents the capacity of the medium to be polarized under the application of an electric field. Concretely, polarization is the consequence of the reorientation of molecular dipoles in the lubricant. During oil aging, dipole moments change because of microscopic chemical reactions, such as oxidation or nitration, or because of the addition of polar contaminants, such as water (ε water = 80) or soot. The dielectric constant (ε) is defined according to the following equation:
where T is the temperature in °C and F and G are oil-dependent constants.
Indeed, the dielectric constant (ε) can be linked with the density (ρ) using the following relationship (9):
where Na is Avogadro’s number, α is the molecular polarizability volume, and M is the molar mass of the substance.
The resistivity (Ρ) of a medium measures the drag force encountered by free charge carriers moving through the medium under the application of an electric field. Oil resistivity is dependent on fluid viscosity, the density of free charge carriers and the specific chemical composition of the oil. To a first approximation, resistivity (Ρ) can be modeled in a simple linear form:
where T is the temperature in °C and H and I are oil-dependent constants.
General measurements of oil temperature are presented in Figure 6. Two engine oil samples (new 15W40 and 1000 h aged) were measured in the standard engine oil application temperature range. Temperature homogeneity was ensured by mechanical stirring. The results demonstrate the ability of the fluid property sensor to measure oil viscosity (η), density (ρ), dielectric (ε) and Rp as an indicator of resistivity (Ρ) over the entire range of application temperatures.
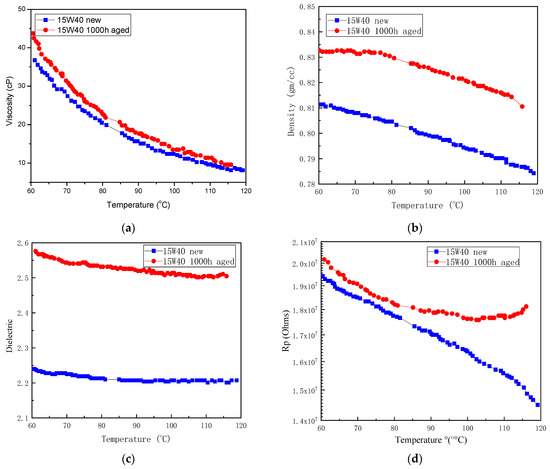
Figure 6.
New and aged engine oil (15W40): (a) viscosity; (b) density; (c) dielectric; and (d) Rp.
Viscosity, density, and dielectric constants are increased during aging. Without any contamination, increases in the three parameter can be considered normal, even if we also observe viscosity decreases due to oil shear. The increase in resistivity at high temperatures is due to depletion of free charge carrier additives [35]. The gradients of variations will depend on oil type and application characteristics, such as temperature or contamination.
3. Oil Ageing Processes and Sensors for Fluid Property Detection
During its whole lifespan, engine oil experiences different degradation and contamination processes resulting from high temperatures and exposure to chemically reactive combustion byproducts and various contaminants. The following sections describe these processes and how each process is detectable with a fluid property sensor.
3.1. Oxidation
When exposed to high temperature, engine oil reacts with oxygen and this reaction is called oxidation. Oil molecules chemically combine with oxygen to form carbonyl compounds (C=O), such as aldehydes, ketones, esters, and carboxylic acids, in different concentrations. The process actually corresponds to two degradations: the evaporation of minor oil components and the incorporation of oxygen elements in oil components. This oxidation induces the polymerization of oil molecules and the formation of insoluble products that lead to an increase in viscosity. Oxidation also induces the formation and depletion of various polar and conductive compounds, which will impact the oil dielectric constant and resistivity [36].
The oxidation process is accelerated by heat, light, and metal catalysts, such as copper or iron, and the presence of water, acids, or solid contaminants that could cause deposit formation. Oxidation is also favored by oil shear. Hydrocarbon compounds and polymer viscosity additives are degraded by shearing, creating carboxylic acids and carbon active sites that can be oxidized to induce a new polymerization. Eventually, oxidation is accelerated by biodiesel or ethanol fuels due to their hygroscopic properties.
Oxidation was measured in the laboratory using Fourier transform infrared (FTIR) spectroscopy as specified by the standard test methods ASTM D7418 or ASTM D7214. The measurement is based on quantification of the carbonyl functional group (C=O), using the 1700 cm−1 frequency peak in the absorbance spectrum. Oxidation measurement is expressed in A/cm.
The measurement of fluid oxidation with the property sensor is presented in Figure 7. Engine oil (15W40) was stored in the laboratory at 120 °C for 3000 h and regularly sampled and analyzed until the point of complete degradation. The results demonstrate the ability of the fluid property sensor to detect and measure oil oxidation, mainly with viscosity, dielectric, and resistivity measurements.
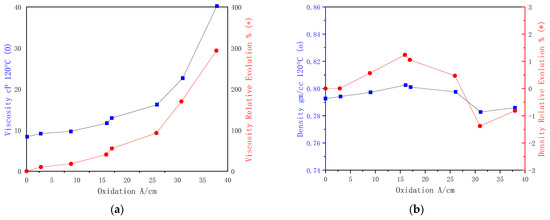
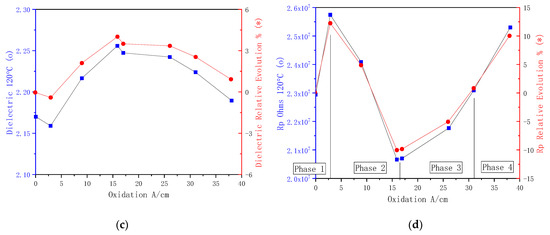
Figure 7.
Engine oil (15W40) oxidation at 120 °C: (a) viscosity; (b) density; (c) dielectric; and (d) Rp.
Viscosity is highly increased during all oxidation processes. Resistivity is a very useful parameter because it can be directly linked to the four different phases of the oil oxidation process (see Table 2).

Table 2.
Four different phases of oil oxidation process.
During Phase 1, the tested oil resistivity is increased by up to 10% at 120 °C. This phenomenon can be explained by the depletion of some free charge carrier additives. The viscosity starts its continuous increase, and the dielectric shows a very slight drop. Phase 1 corresponds to the predominance of a fast chemical process involving very reactive additives.
During Phase 2, the tested oil resistivity is decreased up to −10% at 120 °C, relative to the initial value, and the dielectric showed a significant increase. Phase 2 corresponds to a predominance of a slow chemical process that releases charge carriers and polar compounds.
During Phase 3, the resistivity shows a new increase linked to a new depletion of charge carriers, and the dielectric is stabilized.
Phase 4 corresponds to the dramatic increase in viscosity before complete oil degradation and potential jelling [37].
Even if the density changes remain relatively slight, they can be linked to the four different oxidation phases.
The four different oil degradation phases and corresponding viscosity and resistivity behaviors are described in the literature. Temperature has a relatively low impact on the four oxidation behaviors, and the relative changes, except those for resistivity, are similar for each temperature. The phase 1 resistivity increase is amplified at high temperatures and moderated at lower temperatures.
During Phase 1 and Phase 2, the oil condition is considered good, and the level of degradation is quite low. Phase 3 corresponds to a consequent level of oil degradation. Entry into Phase 3 is the appropriate time to perform an oil change. During Phase 4, oil had already reached a very high level of degradation. There is a high risk of dramatic engine failure. An oil change has to be performed immediately at this point [38].
The oxidation process depends on engine application characteristics and engine oil composition. Oxidation measurements for three different 15W40 engine oils are presented in Figure 8. The three engine oils were stored at 120 °C and regularly measured until the end of Phase 2 of oil oxidation. The results show different measurement gradients for the oils, but the general trends described above are confirmed.
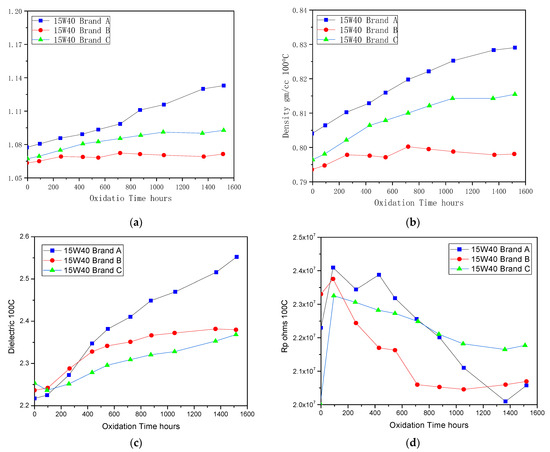
Figure 8.
Engine oil (15W40 brands A, B and C) oxidation at 100 °C: (a) viscosity; (b) density; (c) dielectric; and (d) Rp.
Brand C oil shows a consequent resistivity increase during Phase 1 and then relatively low increases in viscosity and dielectric during Phase 2. Brand A oil shows a lower resistivity increase during Phase 1 but much higher increases in viscosity and dielectric during Phase 2. These different gradients could be linked to additive compositions. Indeed, the type and concentration of additives present in oil will favor or prevent different reactions yielding oxidation and degradation products [39].
Since oxidation is dependent on oil composition and engine application characteristics, precise and complete oxidation modeling seems difficult. However, one can determine a typical physical change by focusing on Phase 1 and Phase 2. The solution consists of modeling Phase 1 and Phase 2 and detecting the entry into Phase 3, which is linked to a consequent level of degradation. For example, the 15W40 engine oils presented in Figure 9 could be modeled with the following equations at constant temperature:
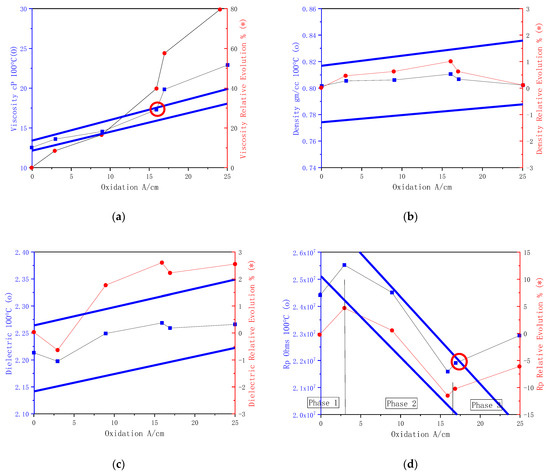
Figure 9.
Engine oil (15W40) oxidation at 100 °C: (a) viscosity; (b) density; (c) dielectric; and (d) Rp.
The models are plotted in Figure 9 with the related accuracy specifications given with full blue lines. The red circles represent detection of the entry into Phase 3 when and .
3.2. Water Contamination
Water contamination comes from the fuel combustion process or from the exterior engine system. Water in oil can be dangerous for an engine because it could induce excessive wear, for example, by cavitation or corrosion. Water also promotes oil oxidation and the formation of acid byproducts and sludge, and thus poor engine reliability.
Water has three different states in oil: dissolved water, emulsified water, and free water. Dissolved water is characterized by dispersed individual water molecules chemically linked to the oil. Above this level, called solubility, the excess water is saturated and will not be chemically linked to the oil; free water is formed, leading to a two-phase system. Because the density of water is higher than that of oil, free water typically accumulates at the bottom of the oil pan. When the mixing ratio is sufficiently high, or in the presence of surfactant additives, an emulsion can be formed. Emulsified water is homogeneously dispersed into the oil [40].
Typical water solubility and associated water states are presented in Figure 10.
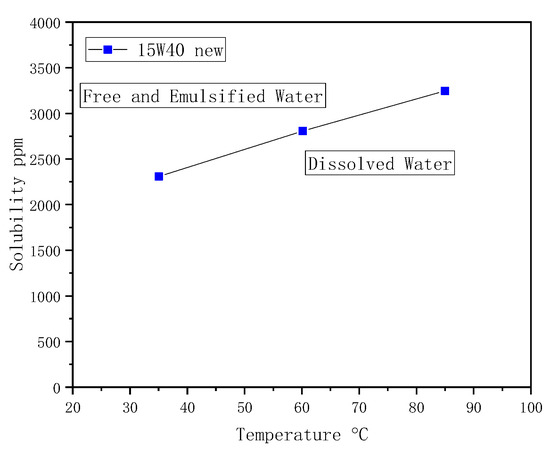
Figure 10.
Typical water solubility in engine oil and associated water states.
Solubility depends on temperature, oil additives, contamination, and oxidation [9]. Water has low solubility in pure oils and hydraulic oils. Typical solubility in engine oil is approximately 2000 ppm at 50 °C.
The solubilities of water in hydraulic oil and fresh and aged 15W40 engine oils, as measured by a water content sensor, are presented in Figure 11.
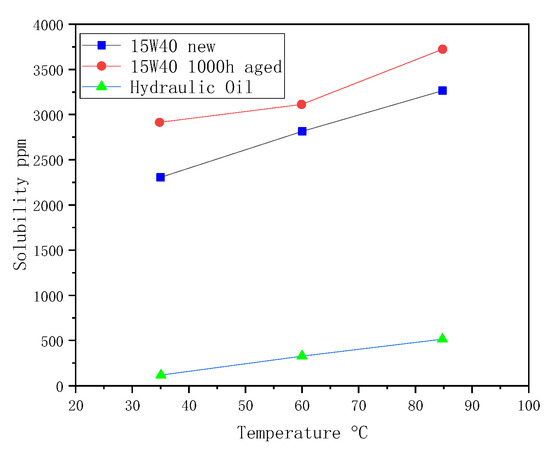
Figure 11.
Water solubility in hydraulic and engine oil measured by a water content sensor.
Water in oil is typically measured in the laboratory with Karl Fisher titration (ISO12937 or ASTM D1533). The Karl Fisher method measures total absolute water in ppm with high accuracy. However, this method is not totally appropriate with engine oil because the measurement could be impacted by specific engine oil additives. The Aqua test (ISO/DIS 9114 or ASTM D7358) and FTIR spectroscopy (ASTM D7418) are alternative methods for measuring total absolute water down to 100 ppm and with 100 ppm accuracy. These three methods do not differentiate dissolved or free water. A water content sensor is able to measure water activity and then to deduce solubility, independent of oil aging. Water activity can be defined by the following formula:
where 0 < aWater < 1, and is the concentration of dissolved water in oil (ppm) and is the concentration of dissolved water in oil (ppm) at the saturation point. The water content sensor and its water activity measurements would be the relevant sensor solution for measuring water content at the saturation point with the highest accuracy.
The fluid property sensor water dilution measurement is presented in Figure 12. Engine oil (15W40) was stabilized at 50 °C and diluted with deionized water. Emulsion homogeneity was ensured by magnetic stirring. The results demonstrate the ability of fluid property sensors to detect and measure water contamination, mainly with dielectric and resistivity measurements.
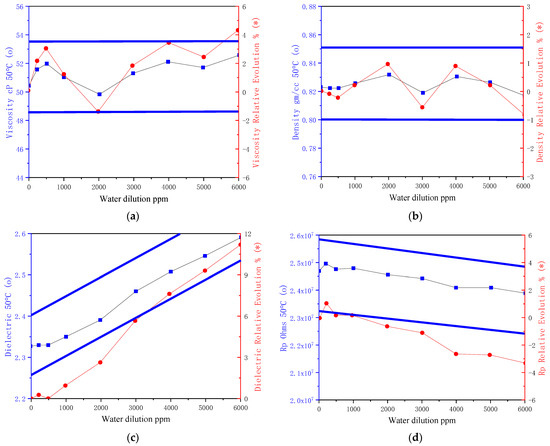
Figure 12.
Water dilution in engine oil (15W40) at 50 °C: (a) viscosity; (b) density; (c) dielectric; and (d) Rp.
Viscosity and density do not show any changes. The dielectric constant is linearly increased and the resistivity is linearly decreased with water dilution. These noticeable changes have been described in the literature and can be explained by the high dielectric constant of water () and the autoionization of water that can release free charge carriers, e.g., protons, into the oil.
The fluid property sensor measures dissolved and emulsified water, which guarantees good compatibility with the application. Indeed, engine operation ensures emulsion by using a sufficiently high mixing ratio. When engine oil reaches a high temperature, water may evaporate, so the detection has to be performed before evaporation, preferably just after engine start-up during the oil temperature increase.
Water in engine oil can be modeled using the following equations at a constant temperature:
These models are plotted in Figure 12, with the related accuracy specifications given as full blue lines.
3.3. Coolant Contamination
Engine coolant contamination comes from leakage from the engine cooling system. Coolant is composed of ethylene glycol or propylene glycol (40 to 60%), water (60 to 40%) and several additives at relatively low concentrations (approximately 5%). Ethylene glycol and propylene glycol are miscible with water and with most organic solvents, but are not miscible with oil. Common coolant additives include sodium silicate, disodium phosphate, sodium molybdate, and sodium borate, and these function as lubricants, buffers, and corrosion inhibitors. Coolant contamination in engine oil can be dangerous for an engine, and have several negative impacts. Low levels of coolant contamination can cause heavy sludge deposits, the formation of acidic compounds, such as glycolic or methanoic acids, and acceleration of oil oxidation. When mixed with oil, high coolant contamination could lead to emulsions or gels and induce occlusions of walls and oil passageways, risks of filter blocking, reductions in oil flow, and a serious general decrease of lubrication efficiency [41].
Coolants in oil are typically measured in the laboratory using FTIR spectroscopy (ASTM D7418) or ICP-AES spectrometry (ASTM D7151), mainly through quantification of the coolant additive elements Na, B, and/or K within the oil.
The fluid property sensor measurement of coolant (50% water) dilution is presented in Figure 13. Engine oil (15W40) was stabilized at 50 °C and diluted with coolant. Emulsion homogeneity was ensured by magnetic stirring. The results demonstrate the capability of the fluid property sensor to detect and measure coolant contamination, mainly with dielectric and resistivity measurements.
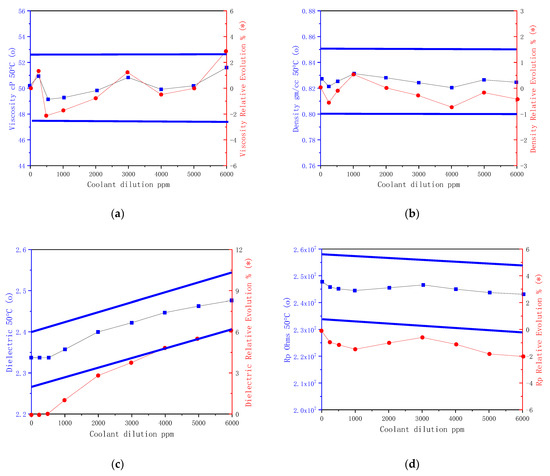
Figure 13.
Coolant dilution in engine oil (15W40) at 50 °C: (a) viscosity; (b) density; (c) dielectric; and (d) Rp.
Viscosity and density did not show any changes. The dielectric increased linearly. With the coolant dilution, when the coolant dilution rate was lower than 2000, the linear decrease of resistivity was not obvious, but it did decrease linearly at a coolant dilution rate above 2000. These results are perfectly consistent with the water dilution results described in the previous section. Indeed, the tested coolant was composed of 50% water, and the dielectric and resistivity slopes are half as high as those in the water dilution results. The changes can be explained by the high dielectric constant of water () and the autoionization of water, which can release free charge carriers and protons into the oil [42].
The fluid property sensor measures dissolved and emulsified water coming from the coolant blend, which guarantees good compatibility with the application. Indeed, engine operation ensures emulsion by establishing a sufficiently high mixing ratio. When engine oil reaches a high temperature, water may evaporate, so the detection has to be performed before evaporation, preferably just after the engine start-up during the oil temperature increase.
The coolant in engine oil can be modeled using the following equations at a constant temperature:
These models are plotted in Figure 13 with the related accuracy specifications given as full blue lines.
3.4. Fuel Contamination
Fuel contamination in engines is caused by imperfect fuel combustion and imperfect sealing. Unburned fuel reaches the crankcase through the space between the piston and cylinder and between the piston groove and the ring. Fuel dilution can be enhanced under particular conditions during the DPF regeneration process.
Internal combustion engines use fuels such as diesel or gasoline, which are mostly hydrocarbon compounds mixed with a variety of additives. Generally obtained as a specific fractional distillate of petroleum, they are now increasingly blended with biofuels such as biodiesel and ethanol. Blended with petroleum diesel, biodiesel is a vegetable oil or animal fat-based fuel composed of long chain alkyl esters. In the US, fuel standard ASTM D7467 specifies blends from B6 to B20, which corresponds to blends with 6% to 20% biodiesel. In Europe, fuel standard EN 590 specifies blends up to B7. In gasoline fuels, ethanol is blended up to 10% (E10) in common markets and can be blended up to 85% (E85) in flexible fuel vehicle applications (ASTM 5798). In the future, biofuel blending rates are expected to increase in order to meet environmental protection rules.
Fuel physical properties can be modeled as oil physical properties:
where T is the temperature in °C and B, C, D, E, F, G, H, and I are fuel-dependent constants. Dynamic viscosity η (T) is deduced from kinematic viscosity µ (T) and density ρ (T).
Fluid property sensor measurements of different fuels are presented in Figure 14. Fuel temperature homogeneity was ensured by magnetic stirring. The results demonstrate the fluid property sensor’s capability to accurately measure fuel properties and allow robust fuel type differentiation.
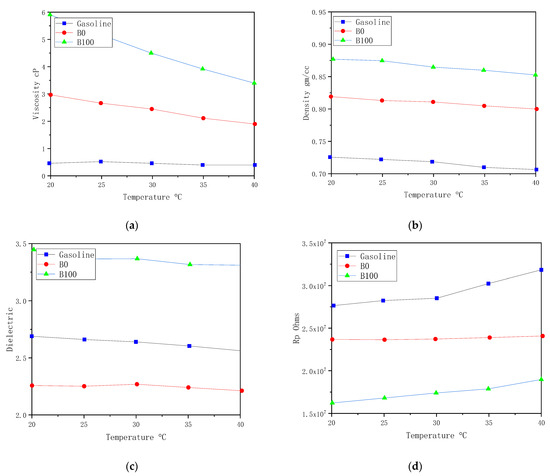
Figure 14.
Gasoline, diesel B0, rapeseed B100 biodiesel: (a) viscosity; (b) density; (c) dielectric; and (d) Rp.
B100 biodiesel has a higher viscosity, density, and dielectric value than pure petroleum fuels. Gasoline shows a much lower viscosity than diesel fluids. The lower resistivity of biodiesel is explained by its hygroscopic characteristics. Fuel property measurements allow differentiation between gasoline, B0 and B100 but also with alternative fuels such as kerosene or hydrotreated vegetable oil (HVO).
Fuel contamination in engine oil can be dangerous for the engine because it can promote oxidation of oil, formation of acidic compounds and formation of soot. These degradations are even more prevalent with biofuels because of the hygroscopic characteristics of biodiesel or ethanol. Fuel dilution will also degrade oil lubrication properties and amplify risks of wear.
Fuel contamination in oil is typically estimated in the laboratory with a method using flash point (ISO 2719) and viscosity measurements (ASTM D445) or with a more accurate and more expensive method using gas chromatography measurements [43].
The fluid property sensor fuel dilution measurement is presented in Figure 15. Engine oil (15W40) was stabilized at 100 °C and diluted with diesel fuel. Blending temperature homogeneity was ensured by mechanical stirring. The results demonstrate the capability of the fluid property sensor to detect and measure fuel contamination, mainly with viscosity measurements.
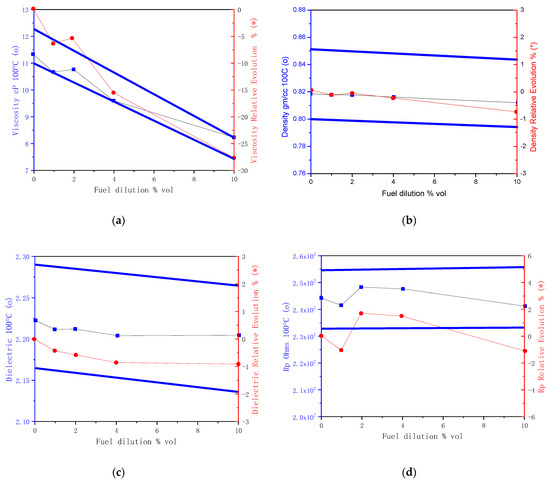
Figure 15.
Fuel dilution in engine oil (15W40): (a) viscosity; (b) density; (c) dielectric; and (d) Rp.
Resistivity does not show any consequent change. Density and dielectric are linearly related to fuel dilution. Slopes depend directly on the density and dielectric properties of the two fluids because they are miscible. The most obvious change is measured with viscosity, which decreases exponentially with fuel dilution.
As engine oil and fuel are miscible fluids, the Refutes method can be used to calculate the theoretical kinematic viscosity (µ) of the blend. The method consists of determining a viscosity blending number (VBN) for each component based on their kinematic viscosity and then calculating the VBN of the blend at a fixed constant temperature [12]:
The kinematic viscosity of the blend can then be estimated using the VBN of the blend in the following equation:
Fuel contamination in engine oil can be modeled using the following equations at a constant temperature:
These models are plotted in Figure 15 with the related accuracy specifications given as full blue lines.
3.5. Soot Contamination
Soot is composed of impure carbon particles resulting from incomplete fuel combustion.
Soot contamination in engine oil can be dangerous for the engine because soot-loaded oil can cause deposits, inducing further engine problems. Soot particles can be abrasive and increase engine wear. Dispersant additives can manage a certain level of soot in the oil, but they cannot avoid viscosity increases with excessive soot contamination [44].
Soot contamination can be measured in the laboratory with FTIR spectroscopy (ASTM D7418). Soot contamination is expressed in %.
The fluid property sensor measurement of soot contamination is presented in Figure 16. Engine oil (15W40) was stabilized at 100 °C and contaminated with standard diesel particulate matter (NIST 2975). Oil homogeneity was ensured by magnetic stirring. The results demonstrate the capability of fluid property sensors to detect and measure soot contamination, mainly with viscosity and dielectric measurements.
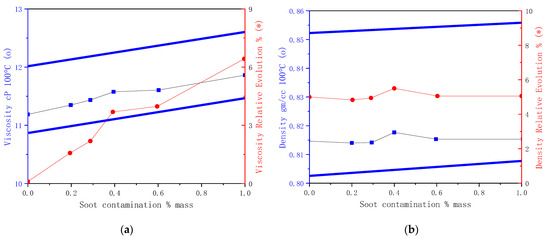
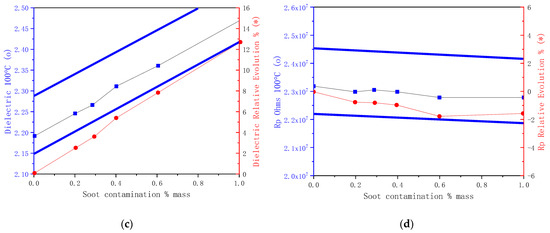
Figure 16.
Soot contamination in engine oil (15W40) at 100 °C: (a) viscosity; (b) density; (c) dielectric; and (d) Rp.
Viscosity and dielectric constant are linearly related to soot contamination. When the value of soot contaminant is above 0.6, the linear relationship between viscosity and soot pollution is demonstrated. Since soot persuasion is related to the ratio of carbon content, the linear relationship is not so obvious in the interval below 0.6. Soot may also induce a slight increase in density and a slight decrease in resistivity. These noticeable changes have been described in the literature and can be explained by the shape, high polarizability, and charge characteristics of soot particles.
Soot contamination in engine oil can be modeled using the following equations at a constant temperature:
These models are plotted in Figure 16 with the related accuracy specifications given as full blue lines.
3.6. Metal Contamination
Metal contamination comes from wear induced by bad lubrication and from corrosion. The main metals to be monitored are Fe, Cu, or Al, which are components of the main engine parts.
Metal contamination is dangerous because it can accelerate oil degradation. Metal contamination is, above all, a sign of abnormal wear.
Metal contamination can be measured in the laboratory with ICP spectrometric analysis (NFT 60 106). Metal contamination is expressed in mg/kg, equivalent to ppm mass [45].
Iron (Fe) contamination measurements are presented in Figure 17. Engine oil (15W40) was stabilized at 100 °C and contaminated with <10 µm Fe particles up to 105 ppm in mass. Oil homogeneity was ensured by magnetic stirring. The results demonstrate the capability of the fluid property sensor to detect and measure extremely high levels of Fe contamination with viscosity, density and dielectric measurements.
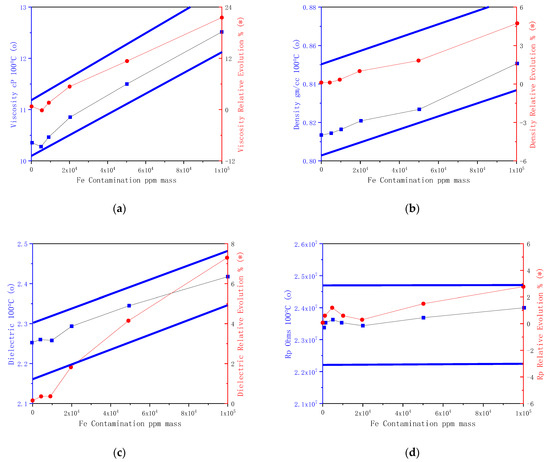
Figure 17.
Fe contamination in engine oil (15W40) at 100 °C: (a) viscosity; (b) density; (c) dielectric; and (d) Rp.
Viscosity, density, and dielectric are strongly and linearly related to Fe contamination level. Fe contamination also induces a slight decrease in resistivity. These noticeable changes can be explained by the shape, high polarizability and charge characteristics of metal particles.
Fe contamination in engine oil can be modeled using the following equations at a constant temperature:
These models are plotted in Figure 17 with the related accuracy specifications given as full blue lines.
Similar results can be obtained with copper (Cu) or other metals.
3.7. TBN, TAN and Ageing
Regular, punctual TBN and TAN measurements are used in reference laboratories to externally monitor oil conditions. Aging and contamination processes induce the creation of different acidic compounds until oil degradation is complete. These acidic compounds accelerate oil degradation via different chemical reactions. For example, metal contamination can be increased by corrosion induced by acidic compounds. To counter the creation of acidic compounds and delay oil degradation, an alkaline reserve is added to the chemical composition of the oil. Thus, fresh oil has a high TBN value, typically ranging from TBN = 8 to TBN = 14, and a low TAN value, typically ranging from TAN = 1 to TAN = 4. During oil life, creation of acidic compounds leads to a continuous decrease in TBN and a continuous increase in TAN. When alkaline species are completely depleted, levels of acidic compounds increase dramatically, and general oil degradation is highly accelerated until the point of complete deterioration and jelling. Depending on oil composition and application characteristics, limits on TBN and TAN values can be considered to optimize oil changes. For example, some manufacturers recommend performing oil changes when TBN = TAN, thereby decreasing the risks of dramatic oil degradation and engine failure [46,47].
Typical TBN and TAN dynamic behaviors are presented in Figure 18. TBN and TAN measurements are plotted as a function of oxidation. Engine oil (15W40) was stored at 150 °C for 3000 h and regularly sampled and analyzed until complete degradation. TBN and TAN were measured by an external reference laboratory. The oil samples correspond to the same samples used to determine the oxidation data presented in Figure 7.
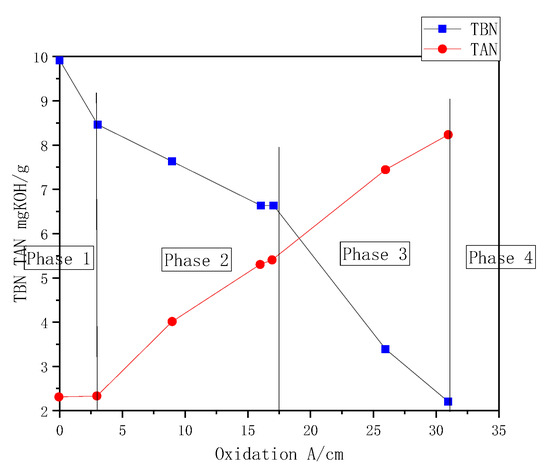
Figure 18.
Engine oil (15W40) TBN and TAN were measured in a reference laboratory.
The results show a continuous decrease in TBN and a continuous increase in TAN as oxidation increases. The four different phases of oil degradation described in Figure 18 can also be considered. During Phase 1 and Phase 2, the TBN value was higher than the TAN value. At the end of Phase 2, the TAN value reached the TBN value and surpassed the TBN value. TBN and TAN measurements corresponding to the 38 A/cm sample from Figure 18 were not performed because of the excessive degree of oil degradation, from which the oil was indeed completely jelled.
The correlation between the absolute value of the difference |TBN-TAN| and the resistivity measurement is presented in Figure 18. The results demonstrate the ability of the fluid property sensor to measure TBN and TAN values through resistivity measurements.
As described in Figure 19, resistivity increased during Phase 1. Phase 1 is relatively short-lived, and the level of resistivity increase depends on the oil chemical composition and application characteristics. Then, the resistivity decreases during Phase 2 until it reaches a minimum and increases again during Phase 3. |TBN-TAN| has similar behavior, starting from a high value (because fresh oil has alkaline reserve and low acid concentration) and decreasing during Phase 2 until a minimum is reached, and then increasing during Phase 3 due to creation of acidic compounds and neutralization of alkaline species. A clear correlation (R2 = 0.83) is demonstrated between resistivity and |TBN-TAN|. A similar correlation has been described in the literature. |TBN-TAN| can be modeled using Equation (44) at a constant temperature:
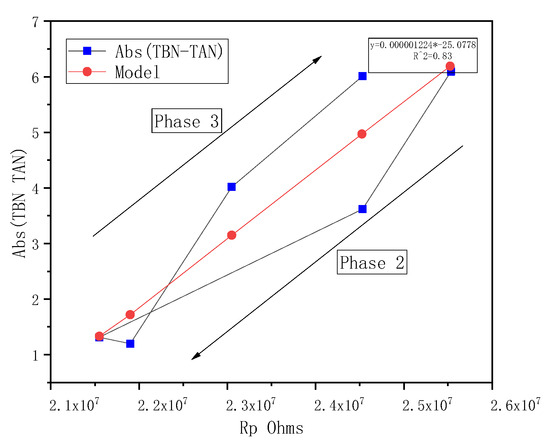
Figure 19.
Correlation between Abs (TBN-TAN) and Rp measurements at 100 °C.
Simultaneous resistivity measurements do not allow a precise direct measurement of TBN and TAN values. However, resistivity monitoring allows a prediction of |TBN−TAN| and detection of Phase 2 (when , TBN > TAN) and Phase 3 (when , TAN > TBN). As stated previously, Phase 3 corresponds to a level of oil degradation for which an oil change is appropriate.
3.8. Incorrect Fluid Detection
Filling with incorrect fluids can be dangerous for the engine. Indeed, engines are designed to operate with determined oil characteristics. Use of the wrong oil may degrade engine performance and could induce risk of failure.
Fluid property sensor measurements of four different oils are presented in Figure 20: three engine oils, 0W40, 10W30 and 15W40, and one bio ISO32 hydraulic oil were studied. Each oil sample was stabilized and tested at different temperatures, ranging from 50 °C to 120 °C. The results demonstrate the capability of the fluid property sensor to detect the presence of an incorrect fluid with viscosity, density, dielectric, and resistivity measurements.
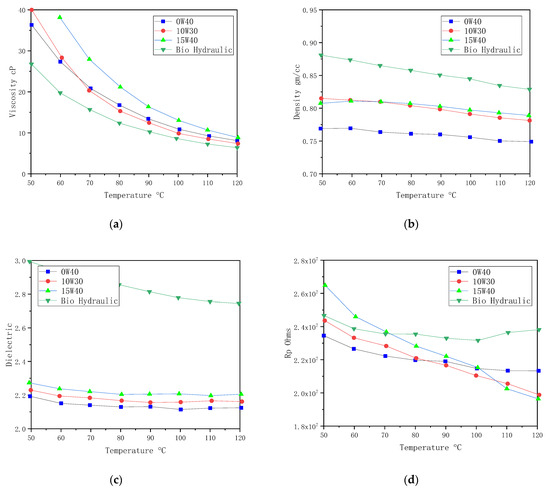
Figure 20.
Measurements of 0W40, 10W30, 15W40 oils and biohydraulic oil: (a) viscosity; (b) density; (c) dielectric; and (d) Rp.
A fluid property sensor is capable of differentiating any type of engine oil or hydraulic oil, mainly with viscosity measurements. Indeed, the viscosity of each sample is clearly identified by fitting with viscosity grade standard SAE J300: 15W40 oil has the highest viscosity; 0W40 oil has a viscosity lower than those of the other engine oils at low temperature and has a viscosity similar to that of 15W40 oil at high temperatures; 10W30 oil has lower viscosity at high temperature than the two other engine oils. ISO32 hydraulic oil has a lower viscosity than the three engine oils. Density depends on oil composition and cannot be predicted with the SAE J300 grade standard. Fluid property sensors clearly differentiate the different oils by using density measurements. The three tested engine oils have similar dielectric constants, ε = 2.2 at 100 °C and can easily be differentiated from the tested biohydraulic oil with ε = 2.7 at 100 °C, although ISO32 hydraulic oils typically have dielectric constants ranging between ε = 2 and ε = 2.4. Some differences between the fluids can also be observed from resistivity values [48,49].
Effective detection of incorrect fluid is made possible by modeling the desired fluid for the considered application and fixing thresholds for each physical parameter. The threshold levels will depend on the application and the different incorrect fluids that may be encountered.
4. Conclusions
It has been shown that the viscosity of mineral-based oils can be reliably measured by a microacoustic sensor. However, the influence of particular polymer additives, such as OCP, on macroscopic viscosity is not detected by the sensor. Specifically, neither the thickening effect nor the degradation of the viscosity modifier polymers are detected by the microacoustic sensor used. Accordingly, in the case of engine oil containing viscosity additives of high molecular weight, the sensor output does not correlate with a conventional viscosity measurement. This behavior was attributed to the fact that the sensor probes a thin oil film and thus does not detect any changes induced by structures or mechanisms associated with characteristic lengths that are larger or of the same magnitude as the penetration depth of the acoustic wave in the oil. Alternatively, the effect could also be caused by the high oscillation frequency and/or the small oscillation amplitudes associated with the microacoustic sensor (in comparison to conventional methods).
At the same time, experiments with artificially deteriorated oils indicate that the relative increase in the sensor signal provides more direct information on the age of the oil, using oxidation level rather than the conventionally measured “macroscopic” viscosity. In particular, it was found that the sensor signal correlates much better with the degree of oxidation of the oil. This can be explained by the fact that oxidative deterioration causes an increase in the base oil viscosity. Conventional viscosity measurements do not detect this increase effectively since deterioration of viscosity modifiers (if present) yields a decrease in the macroscopic viscosity, which represents an effect trending in the opposite direction.
In experiments with artificially aged oil samples, it has been shown that the sensor signal correlates with the measured value of the total acid number (TAN) for artificially aged oil. The acidity of artificially aged oils is caused by the oxidative degradation of the oil itself, and the presence of oxidized thermal degradation products can be detected by the microacoustic sensor regardless of the additive content in the oil. Thus, the sensor is potentially suited for the detection of oxidation-induced viscosity changes caused by thermal deterioration of the oil.
In association with a specific oil (15W40 grade oil, which is designated for use in heavy-duty truck engines) condition algorithm with the main strategy described in this paper, the fluid property sensor is able to directly monitor the heavy-duty truck engine oil conditions, predict remaining oil life and achieve optimization of oil change intervals, minimize the risk of dramatic engine failure, and reduce maintenance costs.
Author Contributions
Data curation, H.S., Y.L. and J.T.; form analysis, H.S.; funding acquisition, J.T.; software, H.S., Y.L. and J.T.; writing—original draft, H.S.; writing—review and editing, H.S. and Y.L. All authors have read and agreed to the published version of the manuscript.
Funding
This research is financially supported by the Natural Science Foundation of China (No. 51508304, No. 41275133 and No. 52075303).
Institutional Review Board Statement
Not applicable.
Informed Consent Statement
Not applicable.
Data Availability Statement
Data are contained within the article.
Acknowledgments
This work was supported by the National Natural Science Foundation of China (No. 51508304, No. 41275133 and No. 52075303). The authors are grateful to the China Environmental Monitoring Center for their cooperation. In addition, Hao Sun wants to thank, in particular, the patience, care, and support from Qi Li.
Conflicts of Interest
The authors declare no conflict of interest.
Correction Statement
This article has been republished with a minor correction to the Funding statement and Acknowledgments. This change does not affect the scientific content of the article.
References
- Zhu, X.; Zhong, C.; Zhe, J. A Multi-Functional Sensor for Online Lubricating Oil Condition Monitoring. Int. J. Math. Game Theory Algebra 2017, 26, 303–315. [Google Scholar]
- Adeniyi, A.A.; Morvan, H.; Simmons, K. A Computational Fluid Dynamics Simulation of Oil-Air Flow between the Cage and Inner Race of an Aero-engine Bearing. J. Eng. Gas Turbines Power 2017, 139, 012506.1–012506.8. [Google Scholar] [CrossRef]
- Tamer, B.; Henein, N.; Naeim, A. Three-Dimensional Computational Fluid Dynamics Modeling and Validation of Ion Current Sensor in a Gen-Set Diesel Engine Using Chemical Kinetic Mechanism. J. Eng. Gas Turbines Power 2017, 139, 102810.1–102810.11. [Google Scholar]
- Rutledge, J.L.; Polanka, M.D.; Greiner, N.J. Computational Fluid Dynamics Evaluations of Film Cooling Flow Scaling Between Engine and Experimental Conditions. J. Turbomach. 2017, 139, 021004.1–021004.7. [Google Scholar] [CrossRef]
- Kordonski, W.; Gorodkin, S.; Behlok, R. In-line monitoring of (MR) fluid properties. J. Magn. Magn. Mater. 2015, 382, 328–334. [Google Scholar] [CrossRef]
- Liu, Y.; Ge, Y.; Tan, J.W. Emission characteristics of offshore fishing ships in the Yellow Bo Sea, China. J. Environ. Sci. 2018, 65, 86–94. [Google Scholar] [CrossRef]
- Zushi, Y.; Yamatori, Y.; Nagata, J.; Nabi, D. Comprehensive two-dimensional gas-chromatography-based property estimation to assess the fate and behavior of complex mixtures: A case study of vehicle engine oil. Sci. Total Environ. 2019, 669, 739–745. [Google Scholar] [CrossRef] [PubMed]
- Rodríguez, E.; Gutiérrez, A.; Palos, R.; Azkoiti, M.J.; Arandes, J.M.; Bilbao, J. Cracking of Scrap Tires Pyrolysis Oil in a Fluidized Bed Reactor under Catalytic Cracking Unit Conditions. Effects of Operating Conditions. Energy Fuels 2019, 33, 3133–3143. [Google Scholar] [CrossRef]
- Zhuang, G.Z.; Gao, J.H.; Peng, S.M.; Zhang, Z.P. Synergistically using layered and fibrous organoclays to enhance the Theological properties of oil-based drilling fluids. Appl. Clay Sci. 2019, 172, 40–48. [Google Scholar] [CrossRef]
- Bulinski, Z.; Kabaj, A.; Krysinski, T.; Szczygiel, I.; Stanek, W.; Rutczyk, B.; Czarnowska, L.; Gladysz, P. A Computational Fluid Dynamics analysis of the influence of the regenerator on the performance of the cold Stirling engine at different working conditions. Energy Convers. Manag. 2019, 195, 125–138. [Google Scholar] [CrossRef]
- Kobayashi, S.; Kondoh, J. Properties of engine oil measured using a surface acoustic wave sensor. Jpn. J. Appl. Phys. 2018, 57, 07LD09. [Google Scholar] [CrossRef]
- Li, Y.Q.; Zhang, H.; Yang, Z.; Yuan, B.; Yuan, Z.; Xue, H. The Influence of Incident Power on the Magnetic Fluid Sensor Sensitivity Based on Optical Transmission Properties. Math. Probl. Eng. 2018, 2018, 9026071. [Google Scholar] [CrossRef]
- Blaise, M.; Feidt, M.; Maillet, D. Influence of the working fluid properties on optimized power of an irreversible finite dimensions Carnot engine. Energy Convers. Manag. 2018, 163, 444–456. [Google Scholar] [CrossRef]
- Rahimi, B.; Semnani, A.; Nezamzadeh-Ejhieh, A.; Langeroodi, H.S.; Davood, M.H. Monitoring of the Physical and Chemical Properties of a Gasoline Engine Oil during Its Usage. J. Anal. Methods Chem. 2012, 2012, 819524. [Google Scholar] [CrossRef] [PubMed]
- Rakopoulos, C.D.; Kosmadakis, G.M.; Pariotis, E.G. Evaluation of a new computational fluid dynamics model for internal combustion engines using hydrogen under motoring conditions. Energy 2009, 34, 2158–2166. [Google Scholar] [CrossRef]
- Aithal, S.M. Impact of Egr Fraction on Diesel Engine Performance Considering Heat Loss and Temperature-dependent Properties of the Working Fluid. Int. J. Energy Res. 2009, 33, 415–430. [Google Scholar] [CrossRef]
- Waszczuk, K.; Piasecki, T.; Nitsch, K.; Gotszalk, T. Application of piezoelectric tuning forks in liquid viscosity and density measurements. Sens. Actuators B Chem. 2011, 160, 517–523. [Google Scholar] [CrossRef]
- González, M.; Ham, G.; Al Haddad, A.; Bernero, G.; Deffenbaugh, M. Downhole viscosity measurement platform using tuning fork oscillators. Sensors 2016. [Google Scholar] [CrossRef]
- Gonzalez, M.; Seren, H.; Buzi, E.; Deffenbaugh, M. Fast downhole fluid viscosity and density measurements using a self-oscillating tuning fork device. In Proceedings of the 2017 IEEE Sensors Applications Symposium (SAS), Glassboro, NJ, USA, 13–15 March 2017. [Google Scholar]
- Zhang, C.; Kaluvan, S.; Zhang, H.; Wang, G. PMN-PT based smart sensing system for viscosity and density measurement. Measurement 2017, 101, 15–18. [Google Scholar] [CrossRef]
- Ghader, R.; Mina, G. On the Mathematical Modeling of a MEMS-Based Sensor for Simultaneous Measurement of Fluids Viscosity and Density. Sens. Imaging 2018, 19, 27. [Google Scholar]
- Poursadegh, F.; Lacey, J.S.; Brear, M.J.; Gordon, R.L. On the Fuel Spray Transition to Dense Fluid Mixing at Reciprocating Engine Conditions. Energy Fuels 2017, 31, 6445–6454. [Google Scholar] [CrossRef]
- Rakopoulos, D.C.; Rakopoulos, C.D.; Giakoumis, E.G. Impact of properties of vegetable oil, bio-diesel, ethanol and n-butanol on the combustion and emissions of turbocharged HDDI diesel engine operating under steady and transient conditions. Fuel 2015, 156, 1–19. [Google Scholar] [CrossRef]
- Jonusas, A.; Miknius, L. Influence of the Process Conditions on Yield, Composition, and Properties of the Products Derived from the Thermolysis of Scrap Tire and Used Engine Oil Blends. Energy Fuels 2015, 29, 6978–6987. [Google Scholar] [CrossRef]
- Ettefaghi, E.; Ahmadi, H.; Rashidi, A.; Nouralishahi, A.; Mohtasebi, S.S. Preparation and thermal properties of oil-based nanofluid from multi-walled carbon nanotubes and engine oil as nano-lubricant. Int. Commun. Heat Mass Transf. 2013, 46, 142–147. [Google Scholar] [CrossRef]
- Ghazvini, M.; Akhavan-behabadi, M.A.; Rasouli, E.; Raisee, M. Heat Transfer Properties of Nanodiamond-Engine Oil Nanofluid in Laminar Flow. Heat Transf. Eng. 2012, 33, 525–532. [Google Scholar] [CrossRef]
- Gonzalez, M.; Seren, H.R.; Ham, G.; Buzi, E.; Bernero, G.; Deffenbaugh, M. Viscosity and Density Measurements Using Mechanical Oscillators in Oil and Gas Applications. IEEE Trans. Instrum. Meas. 2018, 67, 804–810. [Google Scholar] [CrossRef]
- Voglhuber-Brunnmaier, T.; Reichel, E.K.; Sell, J.K.; Jakoby, B. Monitoring of Monosodium Urate Crystallization for the Detection of Crystal Arthropathies in Human Joints. Proceedings 2017, 1, 544. [Google Scholar] [CrossRef]
- Reichel, E.K.; Voglhuber-Brunnmaier, T.; Jakoby, B. Fluid Impedance Model for Resonator Viscosity Sensors. Procedia Eng. 2016, 168, 1012–1015. [Google Scholar] [CrossRef]
- Zabel, F.; Law, H.S.; Taylor, S.; Zuo, J. Impact of Uncertainty of Heavy Oil Fluid Property Measurements. J. Can. Pet. Technol. 2010, 49, 28–35. [Google Scholar] [CrossRef]
- Wang, W.; Tian, G.; Chen, M.; Tao, F.; Zhang, C.; Abdulraham, A.A.; Li, Z.; Jiang, Z. Dual-objective program and improved artificial bee colony for the optimization of energy-conscious milling parameters subject to multiple constraints. J. Clean. Prod. 2020, 245, 118714. [Google Scholar] [CrossRef]
- Liu, Y.; Ge, Y.; Tan, J.; Wang, H.; Ding, Y. Research on ammonia emissions characteristics from light-duty gasoline vehicles. J. Environ. Sci. 2021, 106, 182–193. [Google Scholar] [CrossRef]
- Huang, J.; Liu, Y.; Meng, Z. Effect of Different Aging Conditions on the Soot Oxidation by Thermogravimetric Analysis. ACS Omega 2020, 5, 30568–30576. [Google Scholar] [CrossRef] [PubMed]
- Liu, Y.; Tan, J. Experimental Study on Solid SCR Technology to Reduce NOx Emissions from Diesel Engines. IEEE Access 2020, 8, 151106–151115. [Google Scholar] [CrossRef]
- Jung, K.W.; Kharangate, C.R.; Lee, H.; Palko, J.; Zhou, F.; Asheghi, M.; Dede, E.M.; Goodson, K.E. Embedded cooling with 3D manifold for vehicle power electronics application: Single-phase thermal-fluid performance. Int. J. Heat Mass Transf. 2019, 130, 1108–1119. [Google Scholar] [CrossRef]
- Huang, W.; Wang, J.F.; Xia, J.X.; Zhao, P.; Dai, Y.P. Performance analysis and optimization of a combined cooling and power system using low boiling point working fluid driven by engine waste heat. Energy Convers. Manag. 2019, 180, 962–976. [Google Scholar] [CrossRef]
- Wei, A.; Qu, J.; Qiu, H.H.; Wang, C.; Cao, G.H. Heat transfer characteristics of plug-in oscillating heat pipe with binary-fluid mixtures for electric vehicle battery thermal management. Int. J. Heat Mass Transf. 2019, 135, 746–760. [Google Scholar] [CrossRef]
- Shuai, S.; Tang, T.; Zhao, Y.; Hua, L. State of the art and outlook of diesel vehicle emission regulations and aftertreatment technologies. J. Automot. Saf. Energy 2012, 3, 200–217. [Google Scholar]
- Dong, S.; Shen, G.; Xu, M.; Zhang, S.; An, L. The effect of working fluid on the performance of a large-scale thermoacoustic Stirling engine. Energy 2019, 181, 378–386. [Google Scholar] [CrossRef]
- Kitson, R.C.; Cesnik, C.E.S. Fluid–Structure–Jet Interaction Effects on High-Speed Vehicle Performance and Stability. J. Spacecr. Rockets 2019, 56, 586–595. [Google Scholar] [CrossRef]
- Tian, J.; Cheng, Y.L.; Liu, Z.C. Carrier temperature controlling strategies of diesel particulate filter during drop-to-idle regeneration process. Trans. CSICE 2013, 31, 154–158. [Google Scholar]
- Yu, X.; Yu, W.; Wang, C.; Yu, D. Thermodynamic analysis of the influential mechanism of fuel properties on the performance of an indirect precooled hypersonic airbreathing engine and vehicle. Energy Convers. Manag. 2019, 196, 1138–1152. [Google Scholar] [CrossRef]
- Kitson, R.C.; Cesnik, C.S. Fluid-Structure-Jet Interaction Modeling and Simulation of High-Speed Vehicles. J. Spacecr. Rockets 2018, 55, 190–201. [Google Scholar] [CrossRef]
- Tian, G.D.; Zhang, H.H.; Feng, Y.X.; Jia, H.F.; Zhang, C.Y.; Jiang, Z.G.; Li, Z.W.; Li, P.G. Operation patterns analysis of automotive components remanufacturing industry development in China. J. Clean. Prod. 2017, 64, 1363–1375. [Google Scholar] [CrossRef]
- Lao, C.T.; Akroyd, J.; Eaves, N.; Kraft, M. Modeling of secondary particulate emissions during the regeneration of Diesel Particulate Filters Open access. Energy Procedia 2017, 142, 3560–3565. [Google Scholar] [CrossRef]
- Liu, Y.; Tan, J.W. Green Traffic-Oriented Heavy-Duty Vehicle Emission Characteristics of China VI Based on Portable Emission Measurement Systems. IEEE Access 2020, 8, 106639–106647. [Google Scholar] [CrossRef]
- Tian, G.; Ren, Y.; Feng, Y.; Zhou, M.; Zhang, H.; Tan, J. Modeling and Planning for Dual-objective Selective Disassembly Using AND/OR Graph and Discrete Artificial Bee Colony. IEEE Trans. Ind. Inform. 2019, 15, 2456–2468. [Google Scholar] [CrossRef]
- Ju, P.; Jiang, T.Y.; Li, H.Y. Hierarchical Control of Air-Conditioning Loads for Flexible Demand Response in the Short Term. IEEE Access 2019, 11, 184611–184621. [Google Scholar] [CrossRef]
- Ge, Y.S.; Wang, A.J.; Wang, M.; Ding, Y.; Tan, J.W.; Song, Y.C. Application of Portable Emission Measurement System (PEMS) on the Emission Measurement of Urban Vehicles On-road. Automot. Saf. Energy 2010, 2, 141–145. [Google Scholar]
Publisher’s Note: MDPI stays neutral with regard to jurisdictional claims in published maps and institutional affiliations. |
© 2021 by the authors. Licensee MDPI, Basel, Switzerland. This article is an open access article distributed under the terms and conditions of the Creative Commons Attribution (CC BY) license (https://creativecommons.org/licenses/by/4.0/).