Article

A Novel Test Rig for the Basic Nonlinear Characterization of Bolted Joints

1
School of Energy and Power Engineering, Beihang University, Beijing 100191, China
2
Collaborative Innovation Center of Advanced Aero-Engine, Beihang University, Beijing 100083, China
3
Department of Mechanical and Aerospace Engineering, Politecnico di Torino, Corso Duca degli Abruzzi 24, 10139 Torino, Italy
*
Authors to whom correspondence should be addressed.
Appl. Sci. 2021, 11(12), 5613; https://doi.org/10.3390/app11125613
Submission received: 16 May 2021 / Revised: 11 June 2021 / Accepted: 15 June 2021 / Published: 17 June 2021
(This article belongs to the Special Issue Bladed Disks Structural Dynamics)

Abstract

:
The paper aims at performing a comprehensive experimental study on the peculiar properties of a bolted joint, and investigates the damping induced at different interfaces (between flanges, bolt head/nut and flange, threads) during vibrations. A novel, simplified, single-bolt system joining a two-beam structure is designed and tested. Experimental results under different boundary conditions are presented, and the influence of the harmonic excitation force, as well as the bolt tension, is investigated. The test results show how the contact interface between the clamped flanges plays an important role in terms of frictional damping provided to the system during vibration, while the contact interfaces between the head/nut and flange, and secondarily between the threads, affect the system response at a less, but not negligible, extent. The test setup and test procedure can provide a database to validate single bolt contact models to be included in a more complex structure.

1. Introduction

Bolted joints are widely used for the assembly of mechanical components to provide continuity of the structure and transfer internal actions (i.e., forces and moments) from one member to another. Typical applications of bolted joints can be found in aircraft turbo-engines where bolted flanges are largely employed to connect turbine or casing stages (Figure 1). The dynamical response of structures assembled by bolts is significantly influenced by the damping due to friction at all the contact interfaces, i.e., those between the two parts held together, the screw threads, and the interfaces between the bolt head/nut and the parts (Figure 1c). In this regard, it has been proved that most of the structural damping comes from the bolted joints instead from the material, especially in structures made of metal [1]. Reported damping ratios for monolithic metallic structures are small, typically between 0.0001 and 0.001, while the damping ratio of built-up structures with joints is in the order of 0.01, with friction providing up to the 90% of the total structural damping [2].
The dynamic behavior of built-up structures assembled by bolted joints, as well as the structural damping resulting from the nonlinear behavior of the joints, has drawn the attention of researchers since the early stage of the 20th century [3]. A series of experimental investigations on either bolted flanges or bolted beams were reported by Ungar [4], Beards [5], Masuko [6], and Gaul [7] et al. A usual comparison between the one-piece structure and the equivalent built-up system proved that the main source of damping is the joint instead of the material [8].
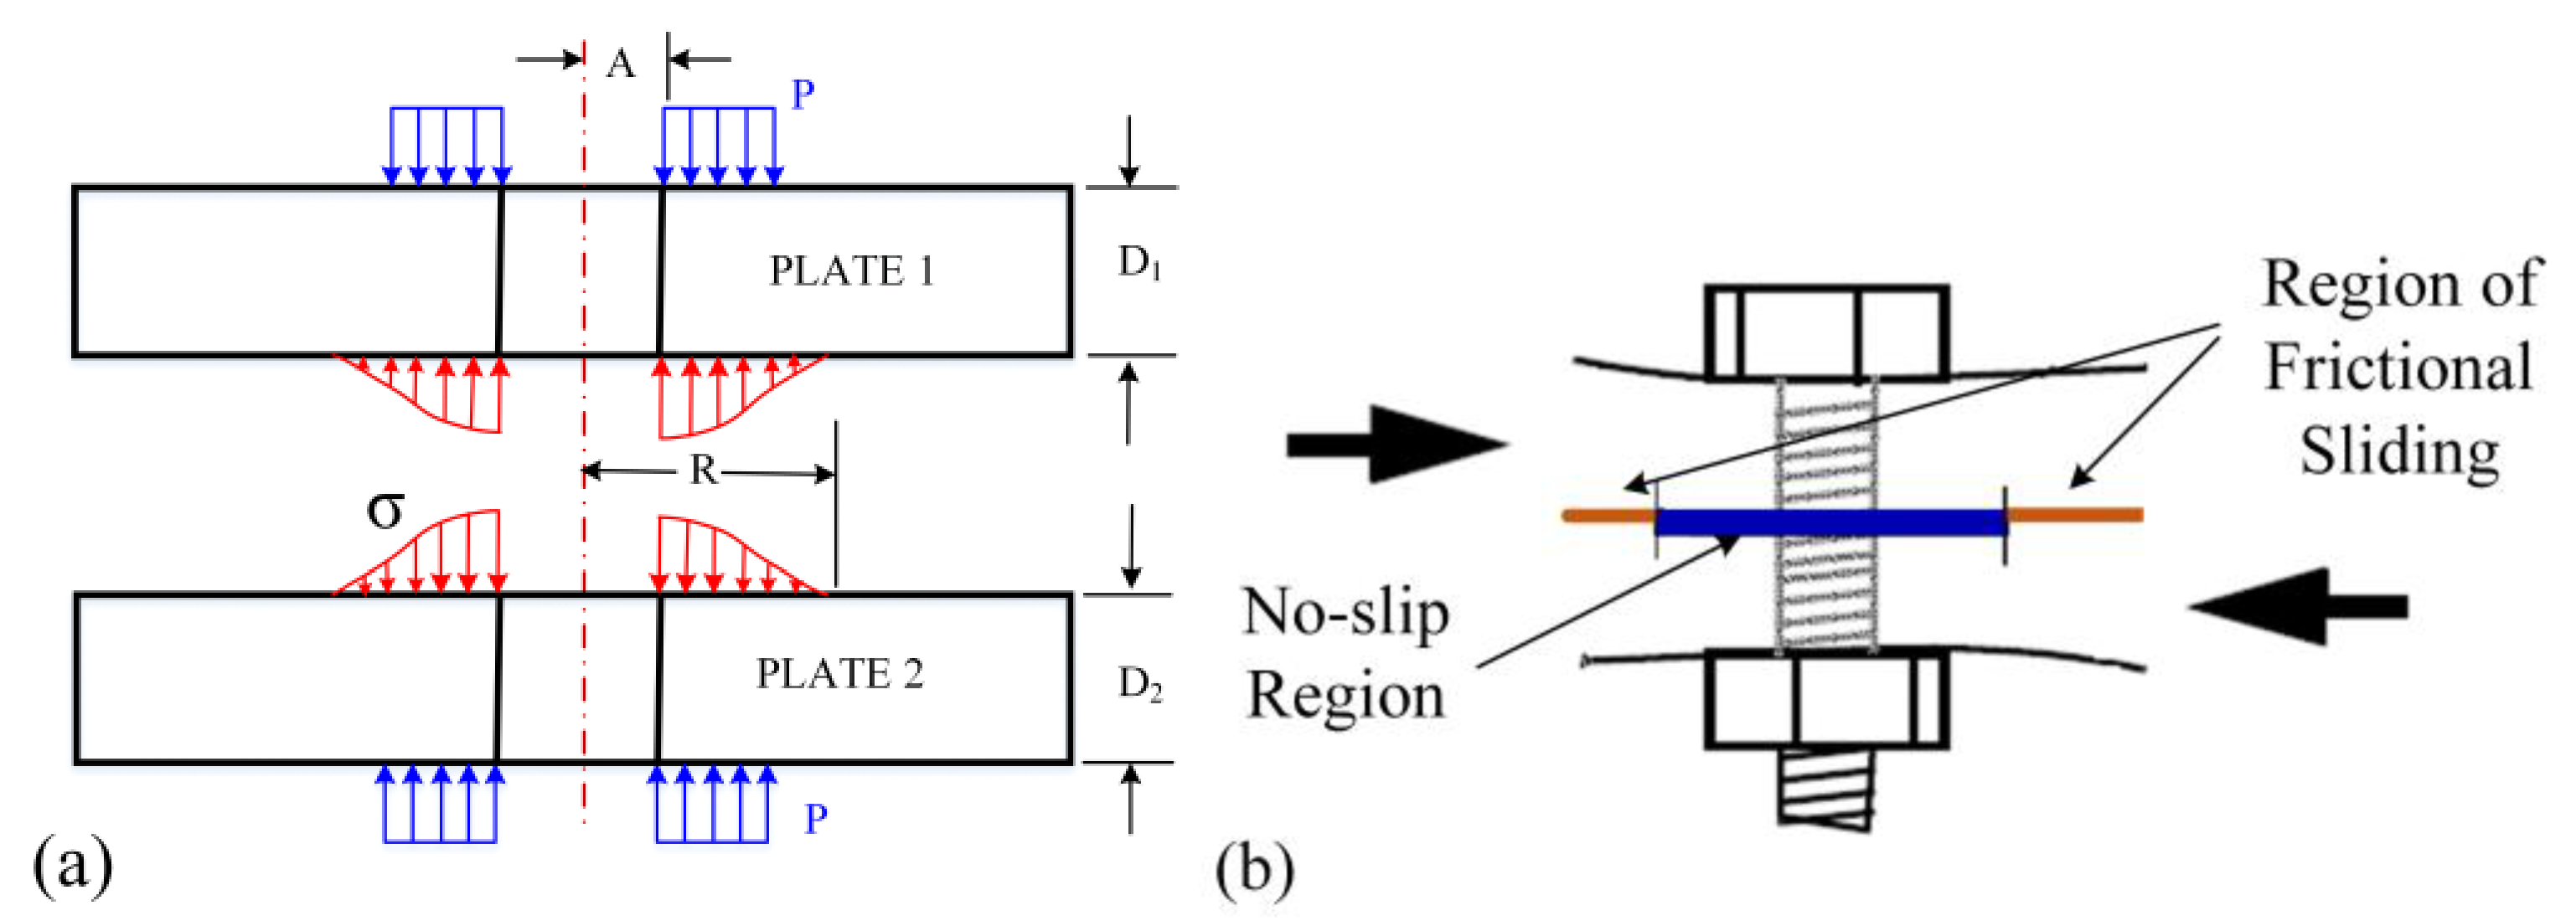
For instance, in bolted flanges, it has been observed that damping is mainly induced by the partial contact area surrounding the bolt, which is limited with respect to a wider potential contact area, due to the occurrence of receding contact. In this region, the contact pressure distribution in the vicinity of the bolt hole rapidly decreases from the center towards the outer region (Figure 2a) [9], causing the micro-slip [10]. An in-plane relative motion at the contact interface will be responsible for the micro-slip in the regions where the normal pressure is not large (Figure 2b) [11]. Under the action of a cyclic excitation, the micro-slip involves energy dissipation and a reduction of vibration amplitudes. Nevertheless, contact interfaces between the bolt head/nut and flange, as well as the screw threads, might also provide a non-negligible amount of friction damping if certain vibration modes are excited at resonance.
In this frame, the experimental tests play a crucial role in most of the published studies, and various test rigs and experimental measurement techniques have been developed in recent past years in several laboratories worldwide [12]. In most of these tests, the relationship between the tangential force and the in-plane displacement is investigated, in order to identify the hysteresis behavior and obtain the damping and stiffness parameters of the bolted joint [13]. Quasi-static tests in bolted flanges on a universal testing machine were carried out by Ferrero [14] and Abad [15]. However, due to the simple experimental setup, no conclusions can be inferred from a dynamical point of view. For this reason, in the Gaul resonator designed at the University of Stuttgart for lap joints [16], the dynamic excitation was applied by means of an electromagnetic shaker. A similar dynamic test rig called dumbbell oscillator, was developed at the Sandia National Laboratories [12]. The test rig, which was also used by Maren and Ma et al. [17], represents a common framework for several studies, since the identified hysteresis parameters can be used to define the model of a joint under the action of tangential loads. However, the out-of-plane vibration of the bolted joint is ignored in these rigs, and the influence of the normal relative displacement at the interface still needs to be investigated.
Vibration modes of real engineering structures are characterized by a complex kinematics that unavoidably affects the relative displacements at the contact interface between two jointed components. In this regard, the beam with shear lap joints may be tested, assuming different boundary conditions (e.g., fixed-free [18], free-free [19]) to excite different vibration modes. In the last few years, the Brake-Reuß beam has become a reference academic-standard test rig for the investigation of the damping, contact kinematics, and contact properties in bolted joints. Based on the Brake-Reuß beam, all the aspects related to the effects of the applied boundary conditions [20], excitation and measurement techniques [21], different control strategies [22], as well as variability and repeatability [23] on the measurements of the system’s stiffness and damping properties, have been investigated. Some other test rigs showing different bolts layouts and excited vibration modes can also be found in the technical literature. Among these, it is worth mentioning the beam assembly with regularly spaced bolts along the beam midline [24] and the “S4 Beam” [25]. Other test rigs were purposely developed for specific applications to characterize the dynamical effect of bolted joints in real structures. For example, Boeswald and Link [26] confirmed the nonlinear behavior induced by bolted joints in an aero-engine casing, which was also tested by Beaudoin using a specially designed slip table [27].
In this paper, a novel test rig for the identification of the stiffness and damping characteristics of the bolted joints employed in flanges subjected to out of plane vibrations, is presented. The test case consists of two beams clamped by one single bolt, which makes the experimental setup simple and useful for a deep investigation of different experimental parameters. The dynamic response of the bolted joint around the first bending mode of the beams is detected, and the modal damping ratio is identified to characterize the nonlinearity introduced by the bolt, for under different levels of harmonic excitation and bolt tension. Furthermore, a similar test rig including one equivalent monolithic beam is also used to separately investigate the influence of the bolt head/nut contact interface on the forced response.

2. Rationale

The nonlinear dynamic behavior of a friction joint is affected by the amount of tangential relative displacement at the contact interfaces. This suggests the importance of the contact kinematics involved by the mode shapes for the analysis of the stiffness and damping characteristics of the joint. The dynamical characteristics of a bolted joint are studied on a beam-like experimental test rig whose flexural mode shapes resemble those occurring at the bolted flanges of turbomachinery casings, where the out-of-plane (i.e., normal to the contact plane) vibration modes involve in-plane (i.e., tangential) relative displacements of the contact interface.
The existence of traveling-wave vibrations in cylindrical-shell components of gas turbine engines has been clearly demonstrated [28]. Typical traveling-wave vibration modes of the casing with bolted flanges are shown in Figure 3a, where the cyclic distribution of the bolts has not been considered. Figure 3b shows how the traveling-wave propagates in the bolted flange, exciting the flexural mode shapes that become the main responsibility of relative in-plane displacement at the contact interface.
The displacements of the two contact flanges are different in tangential direction due to the flexural deformation of the system (Figure 3c), and the slip may start where the relative tangential displacement is higher. The relative tangential displacement is different at different positions, which can be explained by taking the flange included in the π/2 h~π/h sector as an example. The out-of-plane displacement amplitude w0 is at position π/2 h, but the tangential displacements are the same for two flanges, which means there is no slip. As the position changes from π/2 h to π/h, the tangential slip displacement increases due to the flexural deformation, which reaches the maximum value at position π/h.

3. Experimental Setup General Description and Design

The layout and geometric features of the test rig are shown in Figure 4. Two identical rectangular beams (200 × 40 × 4 mm) are assembled by means of bolt (in this case, an M16 class 8.8 bolt is used). Four different contact interfaces result from the assembly: the contact interfaces between the two beams, the interfaces between the bolt head (or nut) and the upper (or the lower) surface of the beam A (or B), and the helical interface of the threads.
In order to isolate the influence of the contact interface between the beams, another test rig consisting of one 200 × 40 × 8 mm monolithic beam is also manufactured for comparison purposes, as shown in Figure 4b. For both test rigs, the experimental frequency response functions (FRF) were measured and compared, in order to separate the nonlinear behavior associated with the small contact interfaces (i.e., the bolt head/beam A, the nut/beam B, and the threads), from that related to the large contact interface between the beams.
For a preliminary assessment of the joint stress state under static load, a finite element (FE) nonlinear static analysis was carried out on the two-beam test rig in Ansys APDL. Each contact interface was modeled in a standard configuration by employing the contact elements CONTA174 and TARGE170 in the augmented Lagrangian formulation [29]. Pretension elements PRETS179 were also used to apply a reference tension preload of 10 kN at the bolt.
The nonlinear static analysis results are shown in Figure 5, where the magnitude of the beams displacement along the bolt axis and the contact status at all the contact interfaces are represented by the colormaps. The results show that the region of the beams close to the bolt is tightly compressed, which leads to the sticking status of the contact interfaces (red area regions in Figure 5b). The outer diameter of the sticking area was estimated to be about twice the diameter of the bolt and it is fully included in the beams’ width. A narrow sliding area (i.e., the orange region in Figure 5b) delimits the sticking region from the remaining part where separation occurs due to the receding contact [30]. The result is a continuing divergence of the wide nominal contact surfaces up to the edges, where the maximum clearance of 0.111mm (along the beam length, points L and R in Figure 5a) was found.
In order to investigate the vibration modes of the assembled bolted joint, a modal analysis was carried out using the linearized model, where the boundary conditions were set according to the contact status predicted as output of the nonlinear static analysis. As the method given in Ref. [31], the full compatibility of the displacements in all the directions is applied for the sticking area, the displacements compatibility in the normal direction is applied in the sliding area, and no boundary conditions are used for the separation area.
The first bending mode shape of both test rig was identified and used for the identification of the experimental results (Figure 6). The mode shape shows two nodes at the bolt’s sides and resembles a kinematics typical of the mode shapes of cyclic symmetric bolted flanges. The natural frequency obtained for the test rig mounting the monolithic beam was found much higher than that of the two-beam setup (854 Hz vs. 472 Hz).

4. Measurement of the Bolt Tension

4.1. Design of the Measurement System

For reliable and accurate monitoring of the bolt tension, four strain gauges were glued in pairs on two diametrically opposite locations of the lateral surface of the screw, which was previously modified by removing few threads beneath the screw’s head (Figure 7). A Wheatstone full-bridge configuration was produced to measure the axial load and compensate strains produced by a possible spurious bending load on the screw, wires were led out from a small hole drilled at the top of the screw’s head. The HBM Spider8 module and HBM Catman Express 3.1 acquisition software were used to process the strain gauges data and monitor the strains caused by the screw elongation under the application of a tensional load.

4.2. Calibration of Strain Gauges

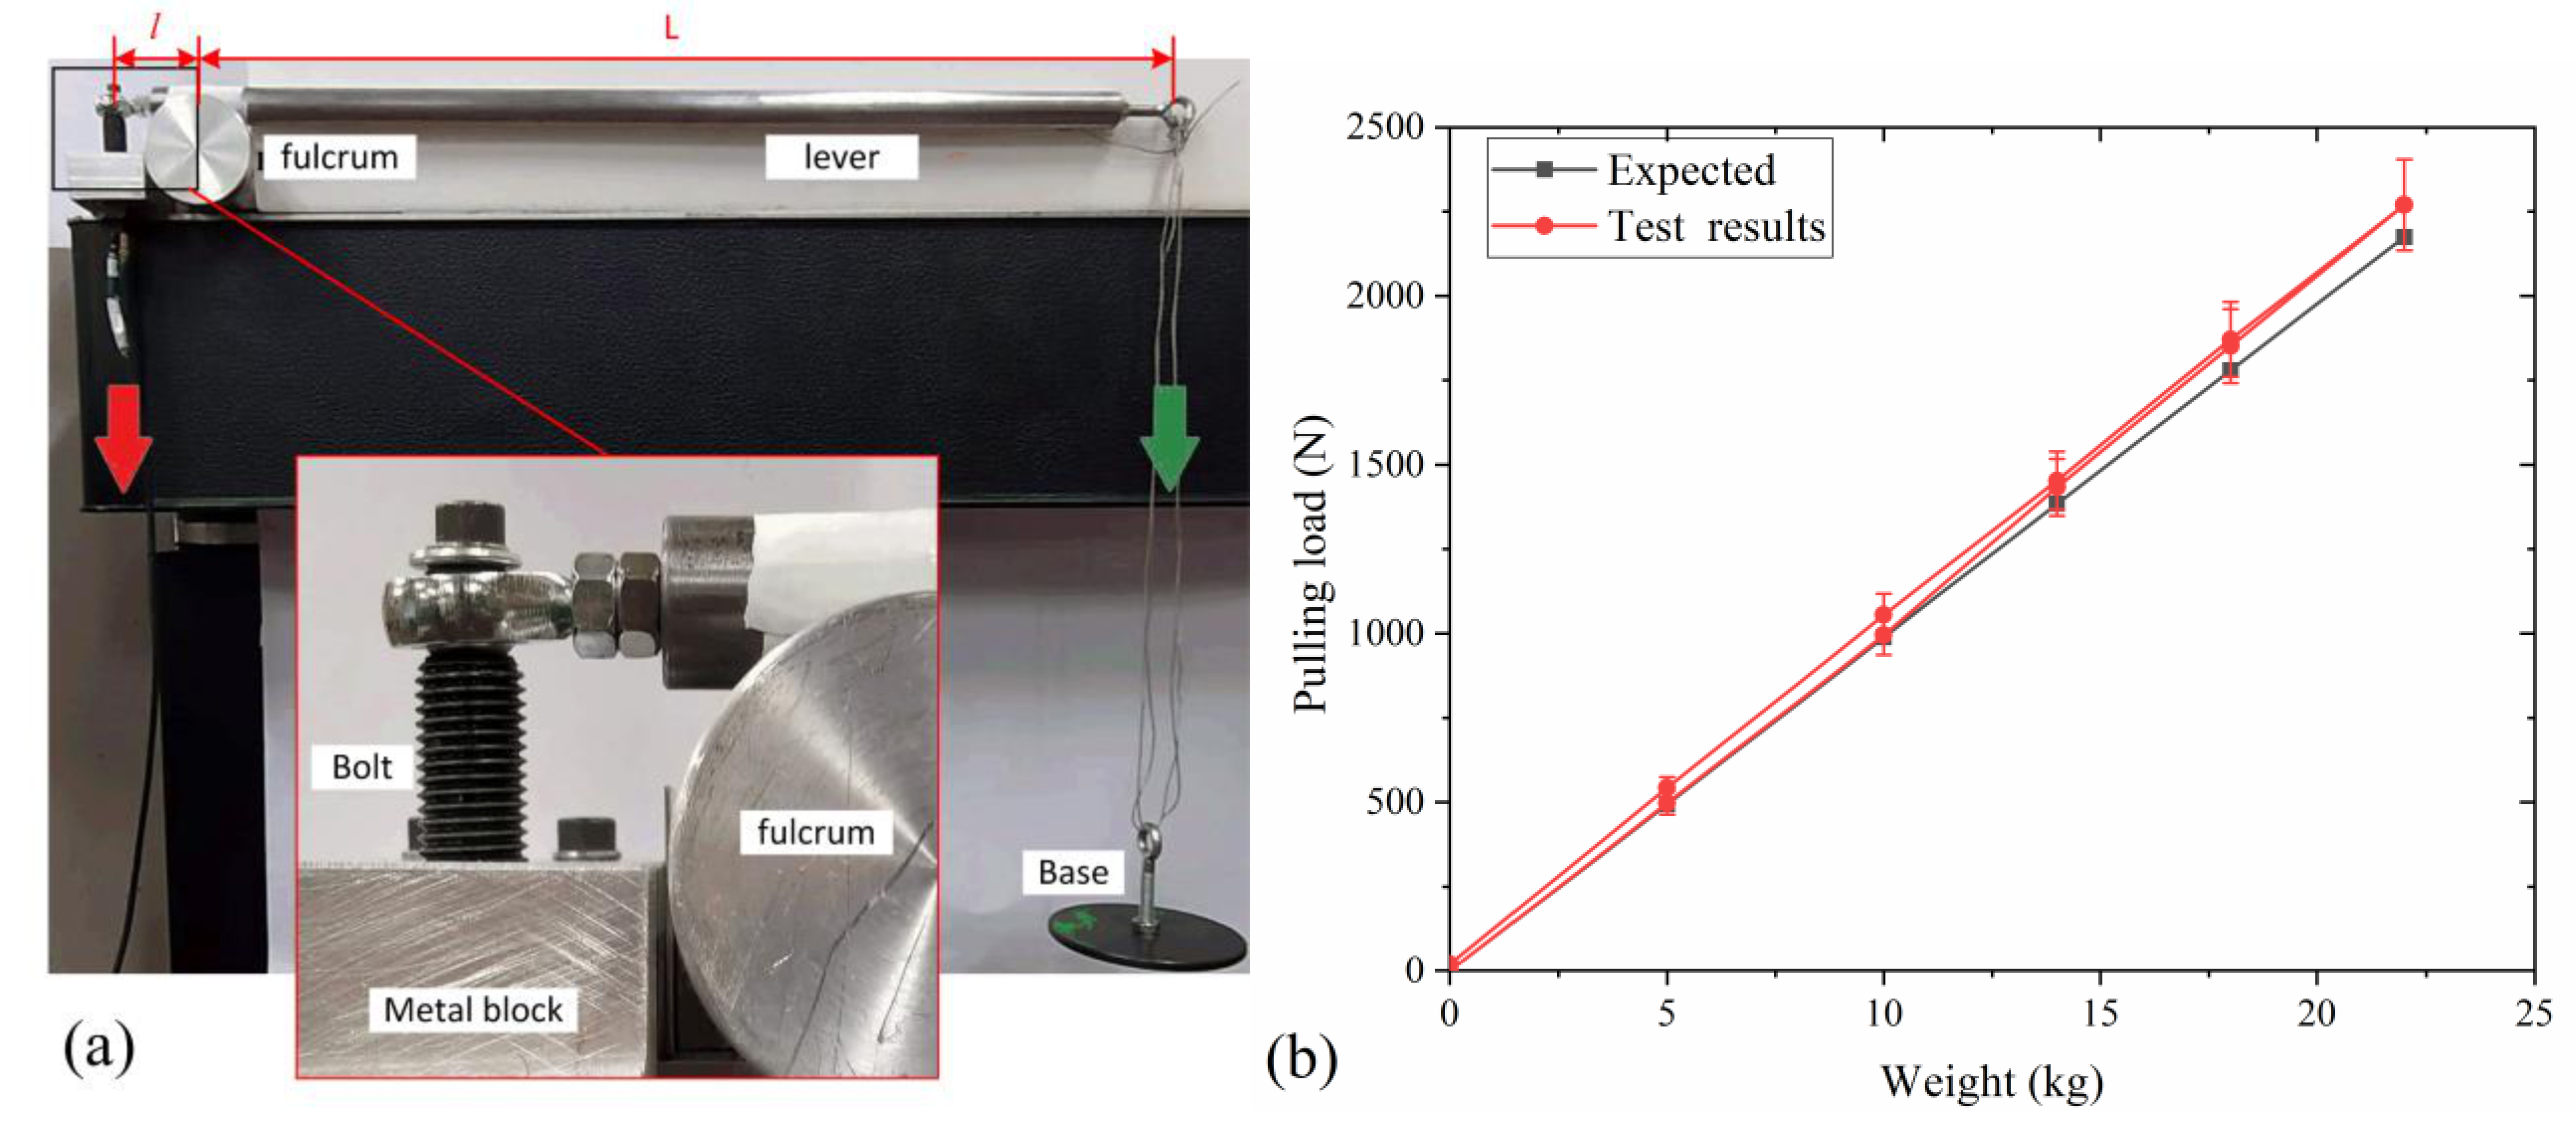
Before performing dynamical tests, the verification of the strain gauge calibration was carried out by means of a simple tensile test of the bolt (Figure 8a). The bolt was inserted on a metal block, and a lever system was used to multiply the pulling load caused by the application of a dead mass M at one end. For a certain value of mass M, the expected pulling load at the bolt can be expressed as:
F e x p = M · g · L / l
where the two quantities L and l are the lengths of the lever arms and the ratio is a multiplication factor of the force produced by the mass M. The actual pulling load indirectly measured from the strain measurement can be written as:
F a c t = σ · A = E ε · π d / 2 2
where ε is the strain measured by the Wheatstone bridge, E is the bolt’s material Young’s modulus (steel, around 200 GPa), and d is the screw diameter where strain gauges are applied (13 mm). The results of the tensile test for 5 different values of M are shown in Figure 8b, from which the linearity and repeatability of the test can be observed. The measured tension preloads well agree with the expected theoretical values, which confirm the accuracy and reliability of the strain gauges application.

4.3. Correlation of the Axial Load and Torque

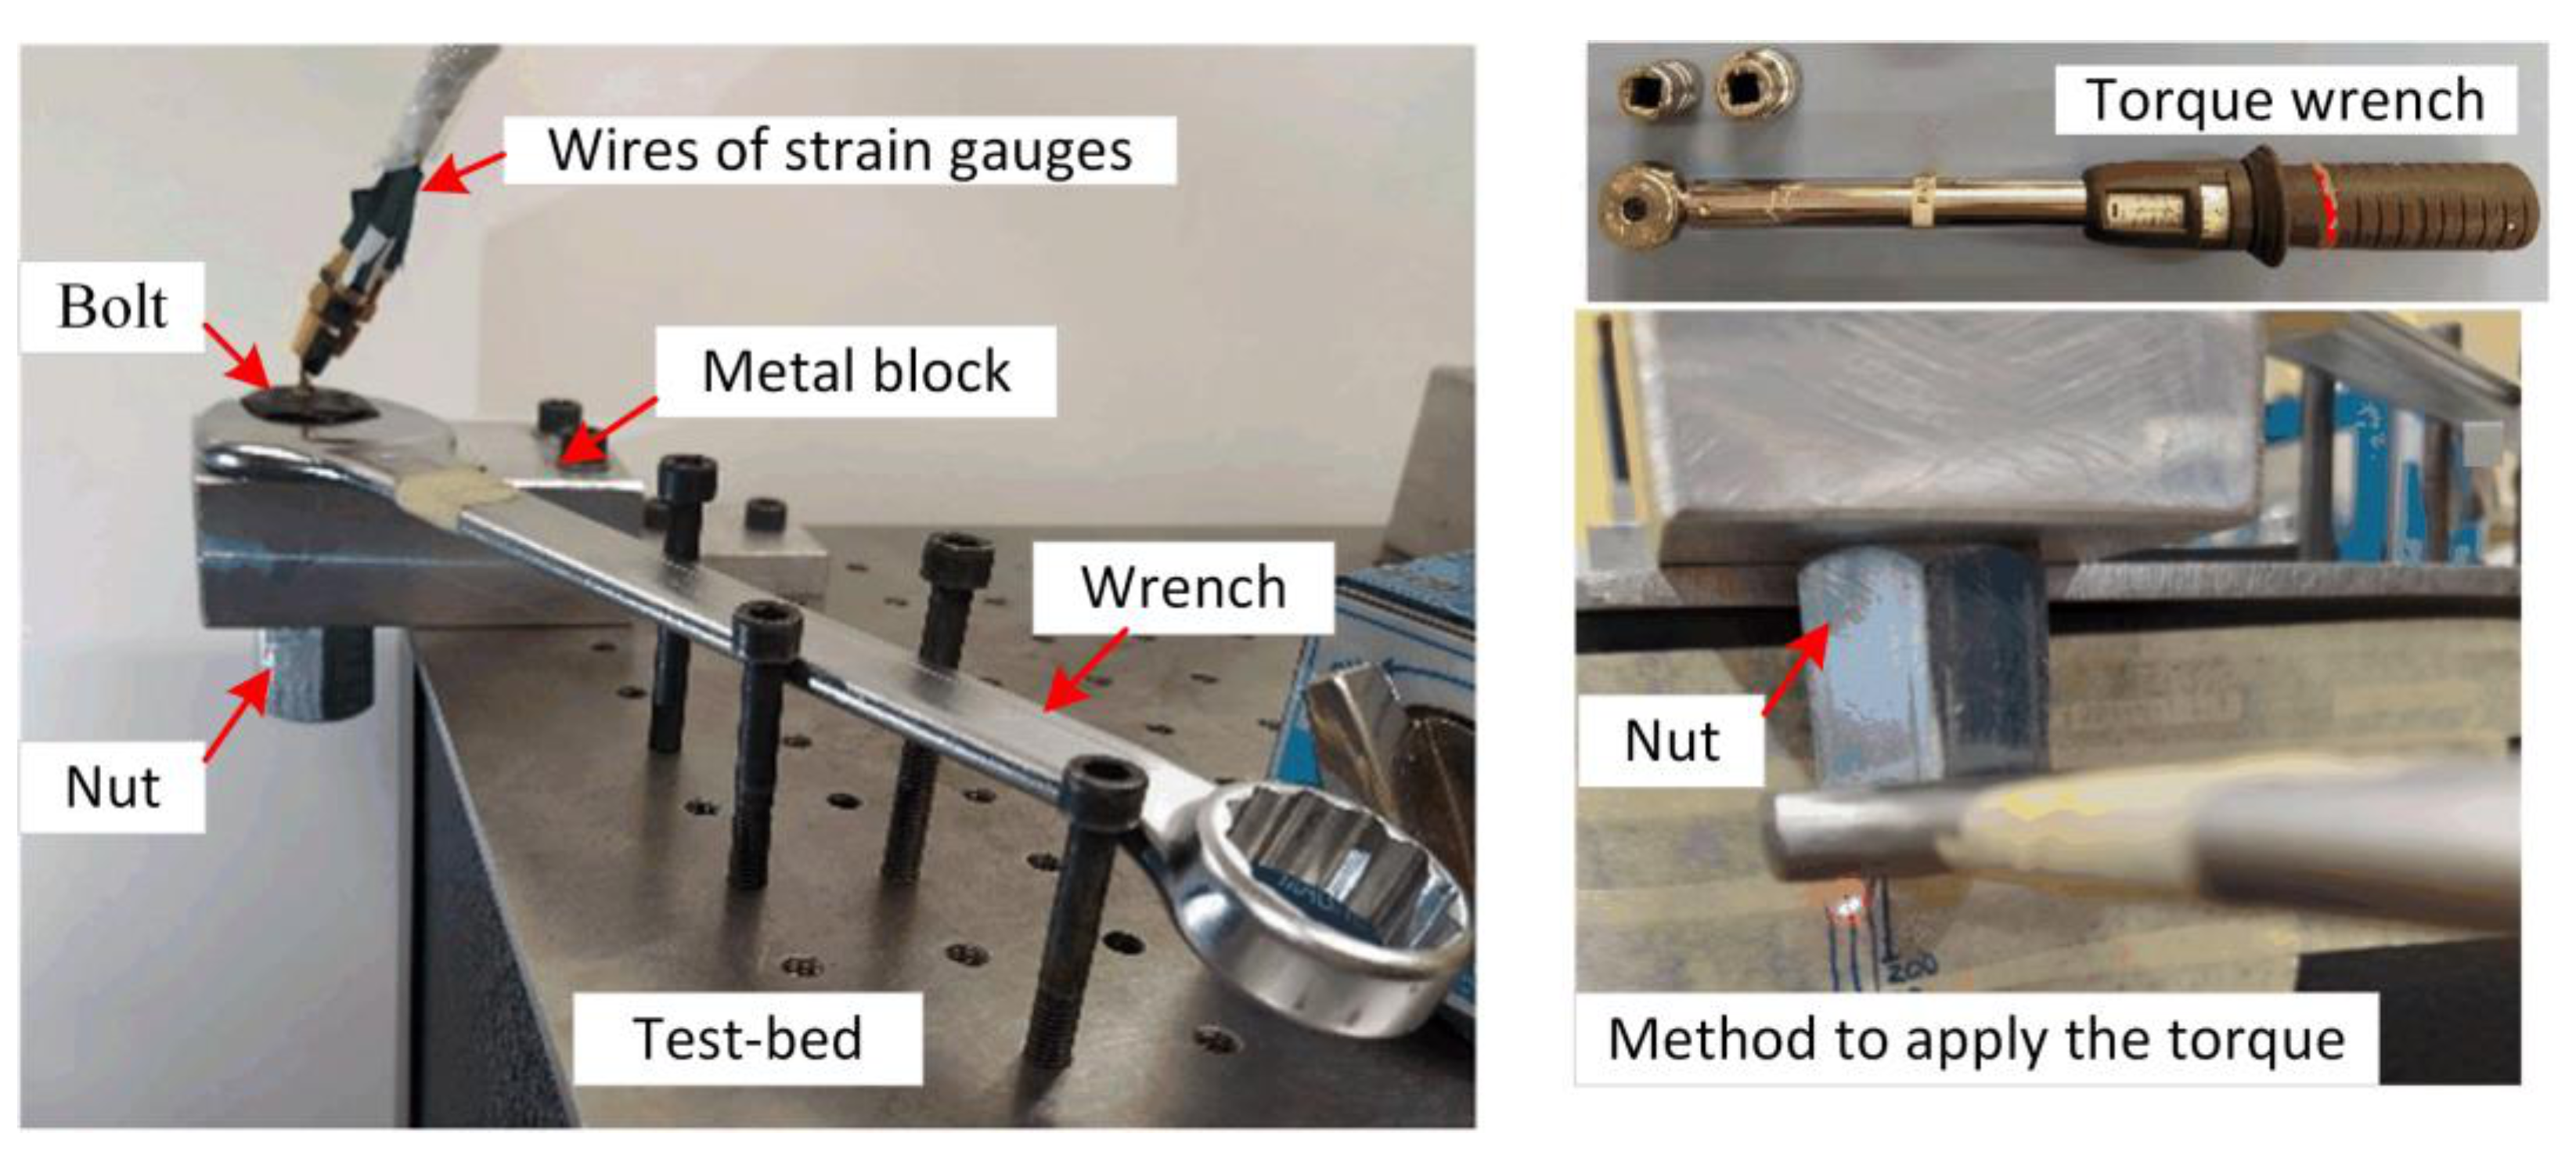
A torque wrench was used to apply the preload (Figure 9), as it was applied for the dynamic test. In order to obtain repeatable results, the head of the screw was kept in the same position on the metal block using a wrench fixed in a specific position. The axial loads measured by the strain gauges were compared with theoretical values obtained by using the analytical formulation where the tightening torque is considered, and their correlation was analyzed to assess the reliability of results.
The axial load generated by the torque-wrench is influenced by the friction occurring at the head and the threads, and only a limited percentage of the tightening torque T is spent to generate the tension preload assembly F e x p . The relations occurring between T and F e x p can be expressed as follows [32]:
T = T t h , P + T t h , F + T b = F e x p P 2 π + d 2 2 c o s α / 2 μ t h + D b 2 μ b
where T t h , P is the thread pitch torque, T t h , F the thread friction torque, and T b the nut friction torque, while the average diameter D b of the bolt head contact interface can be expressed as:
D b = d o u t + d i n / 2
with d o u t and d i n representing the nut outer and inner diameters, respectively.
Given the value of the measured torque T, F e x p can be obtained from Equation (3) by using the parameters listed in Table 1.
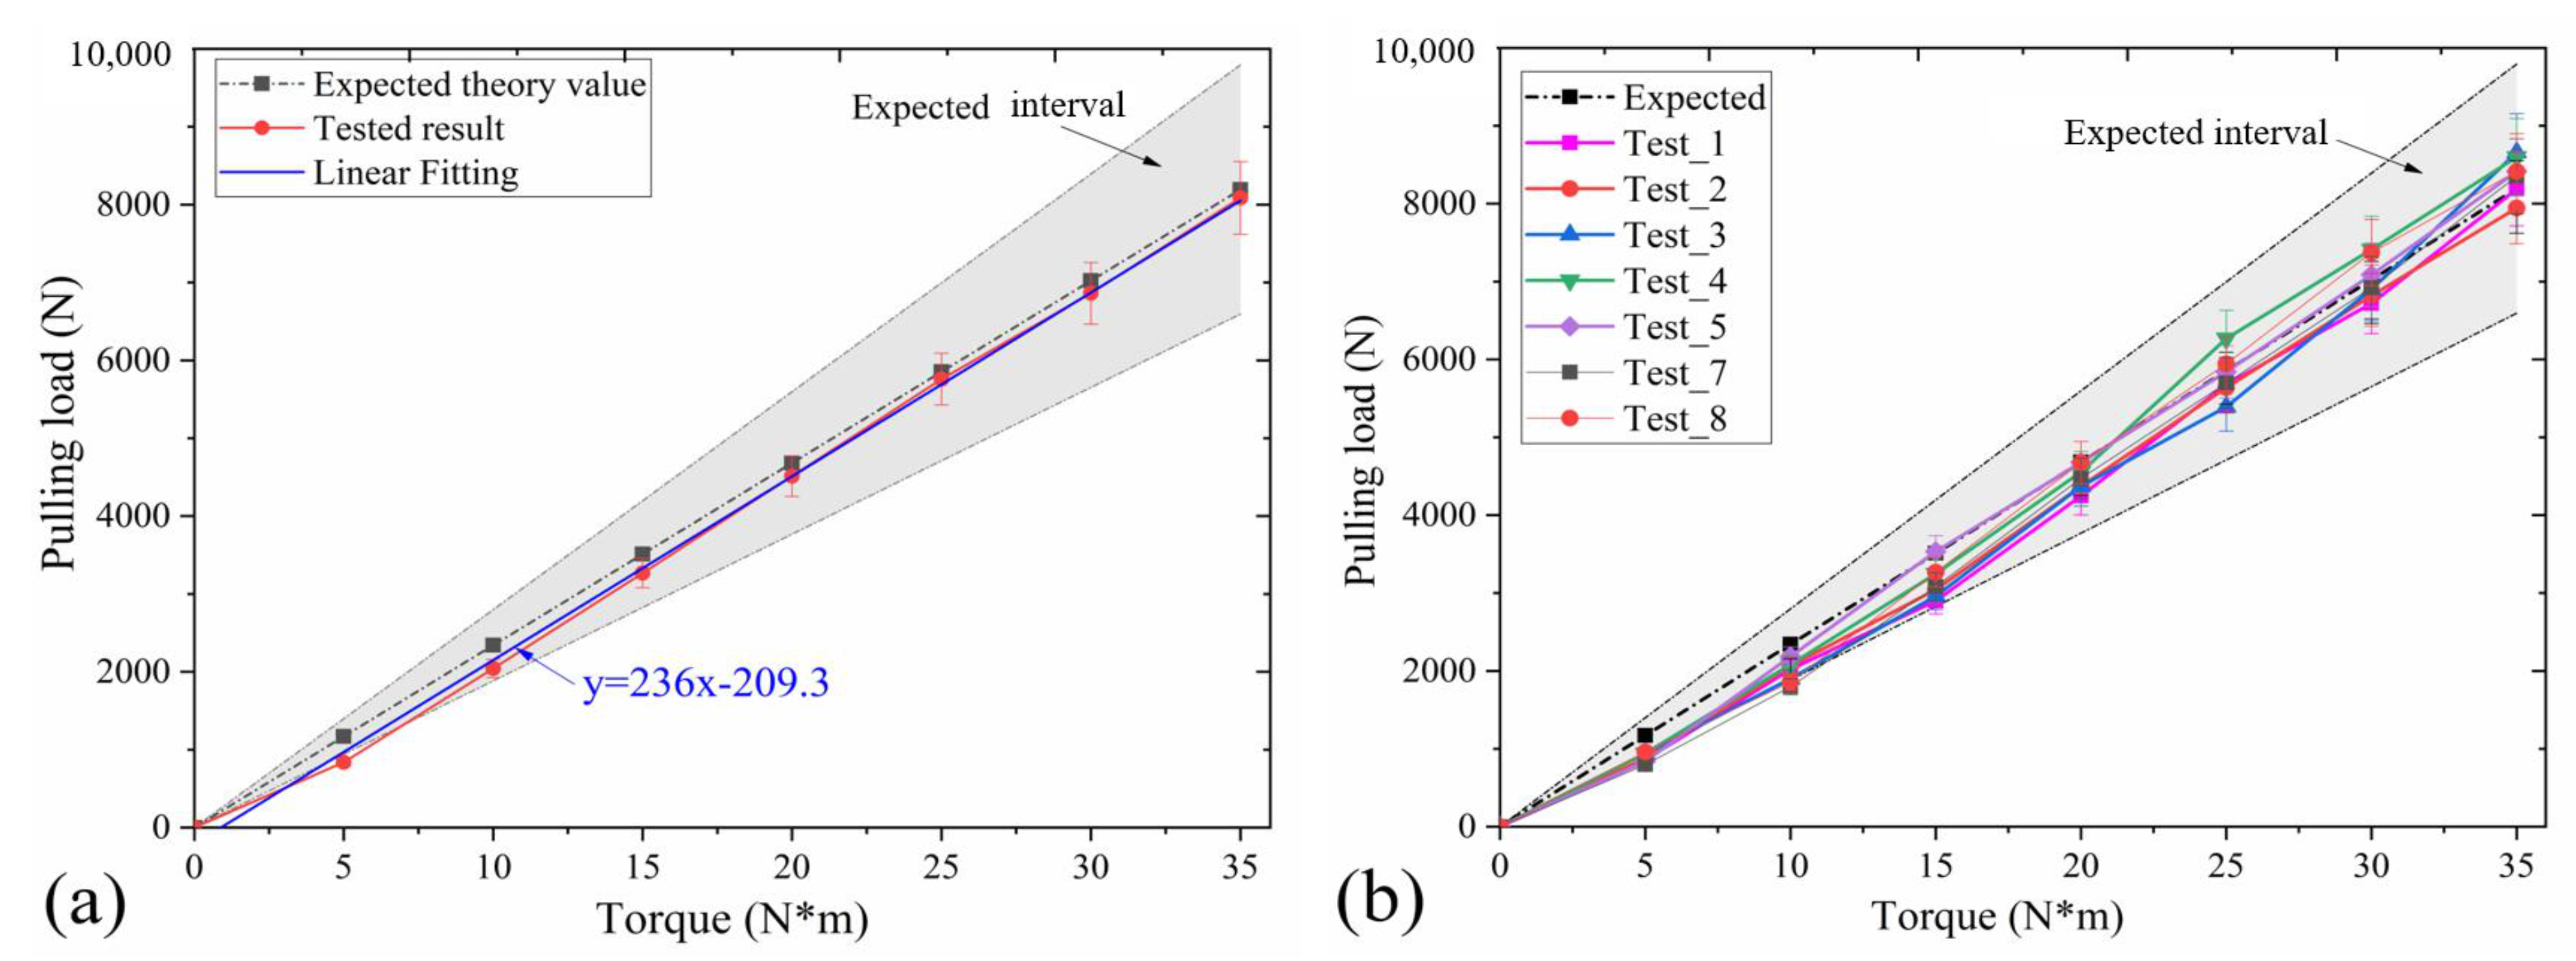
Considering the presence of possible uncertainties in the bolt tension calculation, mainly due to the definition of the friction coefficient, the bolt tension cannot be represented by a single value corresponding to the applied tightening torques, but an interval of values is needed (i.e., the grey region in Figure 10). The strain gauge measurements reported in Figure 10 show a well-defined linear variation of the tension preload within the expected theoretical interval, even after 8 consecutive tests. This result gives confidence to the testing practice, which can therefore be considered consistent and repeatable. In order to improve the test repeatability, the tensile load on the bolt is applied with reference to measured strains instead of the applied torque.

5. Dynamic Tests and Analysis

5.1. The Excitation and Measurement Systems

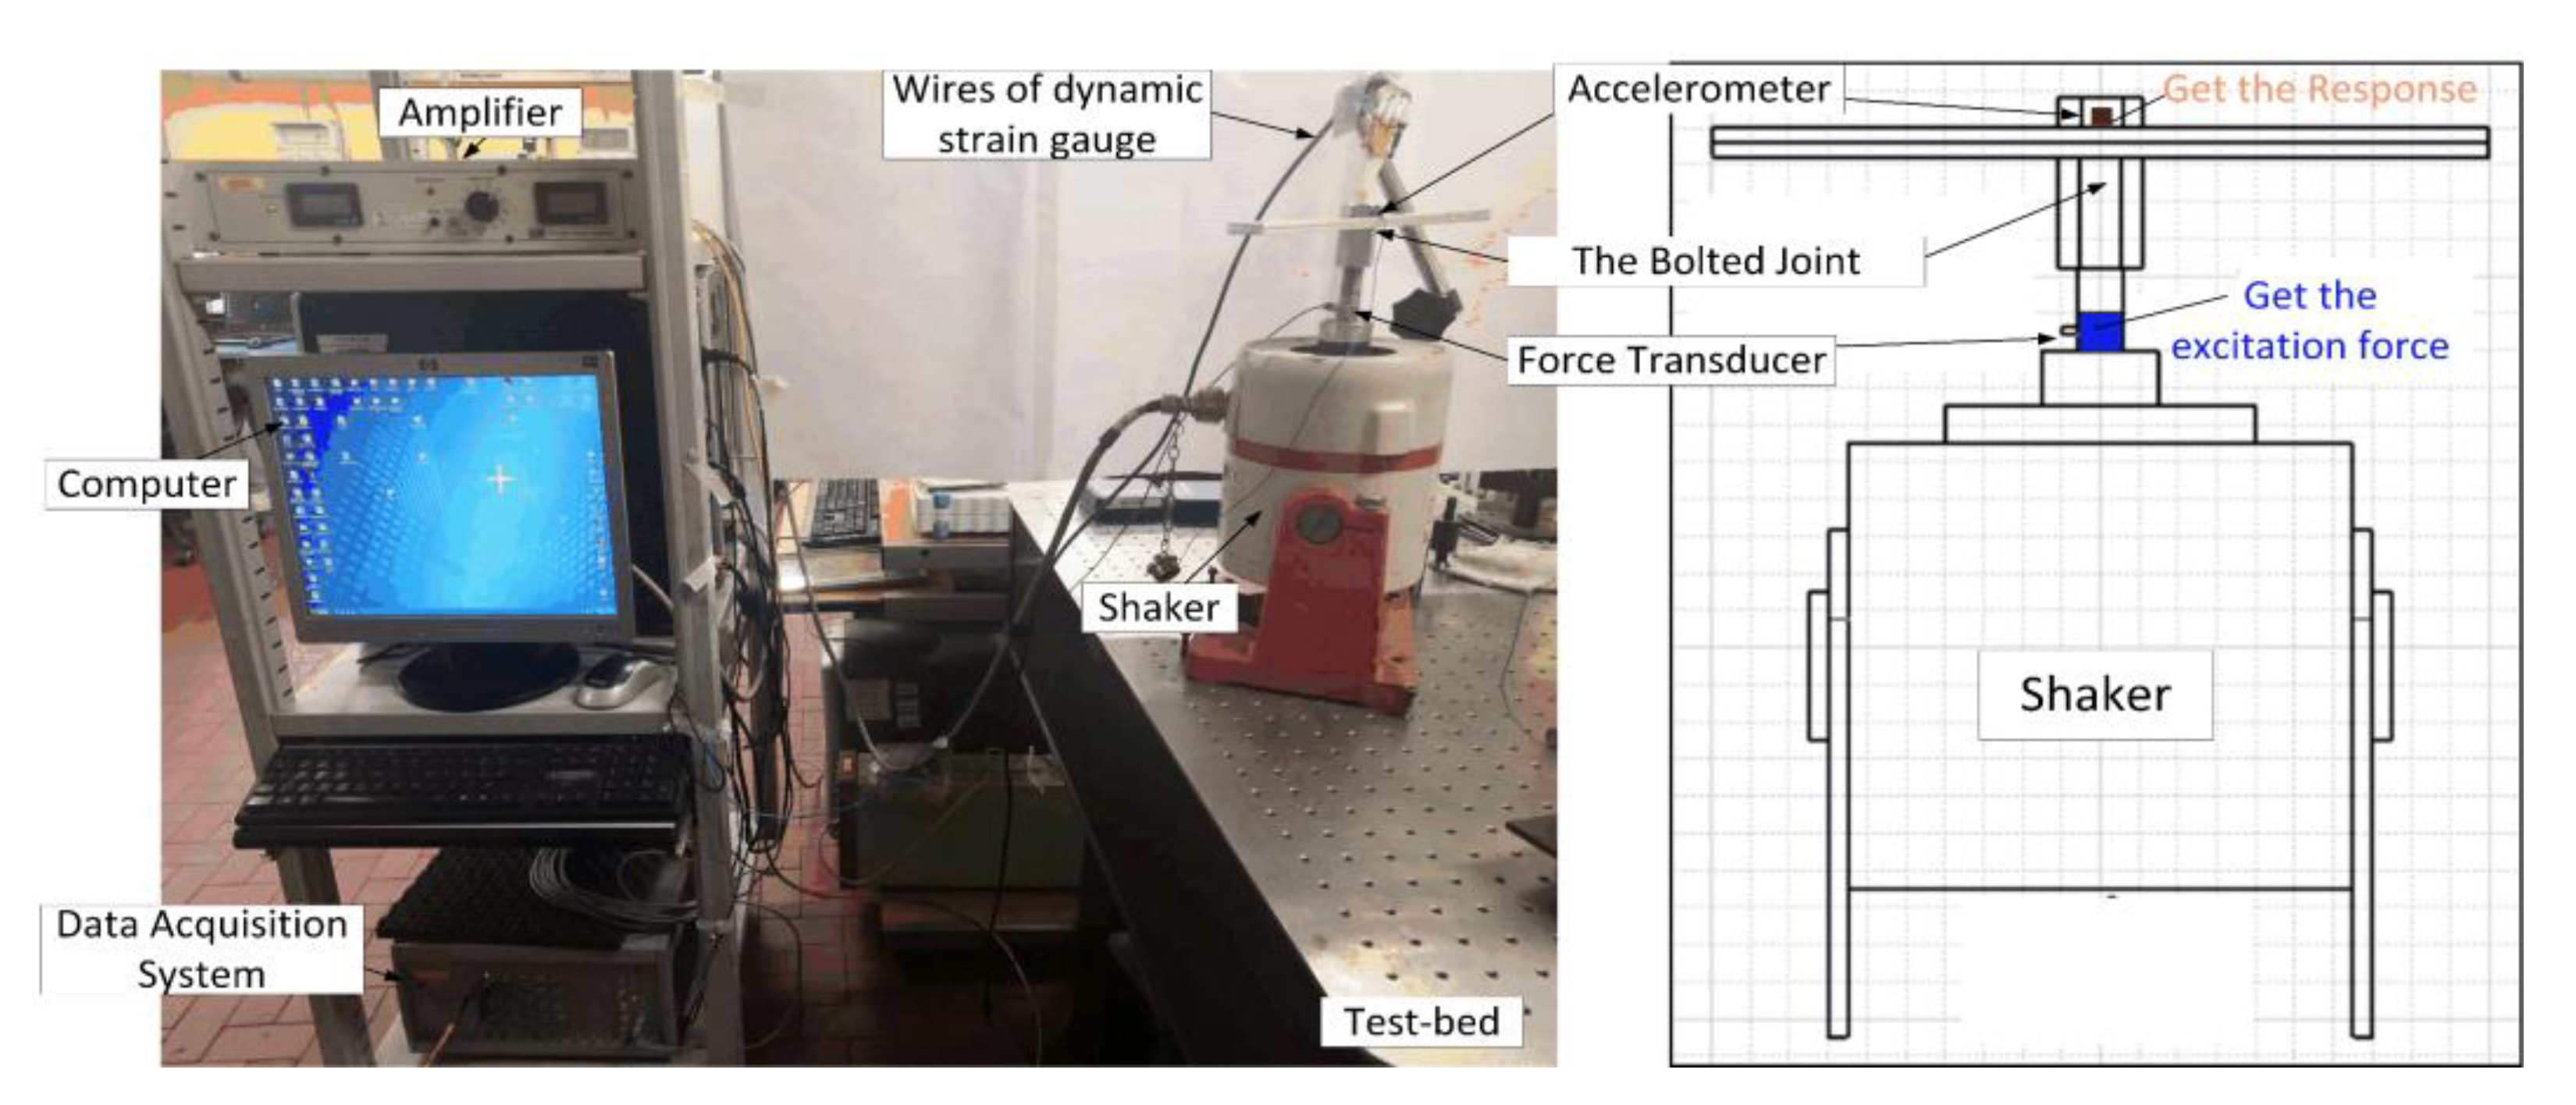
The test rig setup (Figure 11) aims to simplify the structure as a one degree of freedom system, in order to have a clean and direct measurement of the frictionally damped response. For this reason, an electromagnetic shaker fixed on a test-bench provides the dynamic excitation, which is measured by a force transducer screwed on one side to the bottom surface of the screw and on the other side to the shaker. In this way, the only constraint of the system is represented by the location of the input excitation that is continuously measured and controlled during a force controlled, stepped sine test.
The system response is measured by an accelerometer glued at the outer surface of the upper beam (i.e., the beam A in Figure 4) in the middle of the beam’s length. The strain gauges used to assess the value of the static tension preload are also employed to monitor the preload variation during the dynamical tests. Time-varying forces and accelerations are collected and processed by the data acquisition system LMS TestLab. The force-controlled stepped sine method was used to excite the bolted joint in a frequency range containing the bending vibration mode detected by the numerical modal analysis. The frequency response functions (FRFs) were obtained by exciting the bolted joint for 1000 cycles for each frequency step before control iterations are made, which ensures to obtain the steady-state response and more robust control of the force.
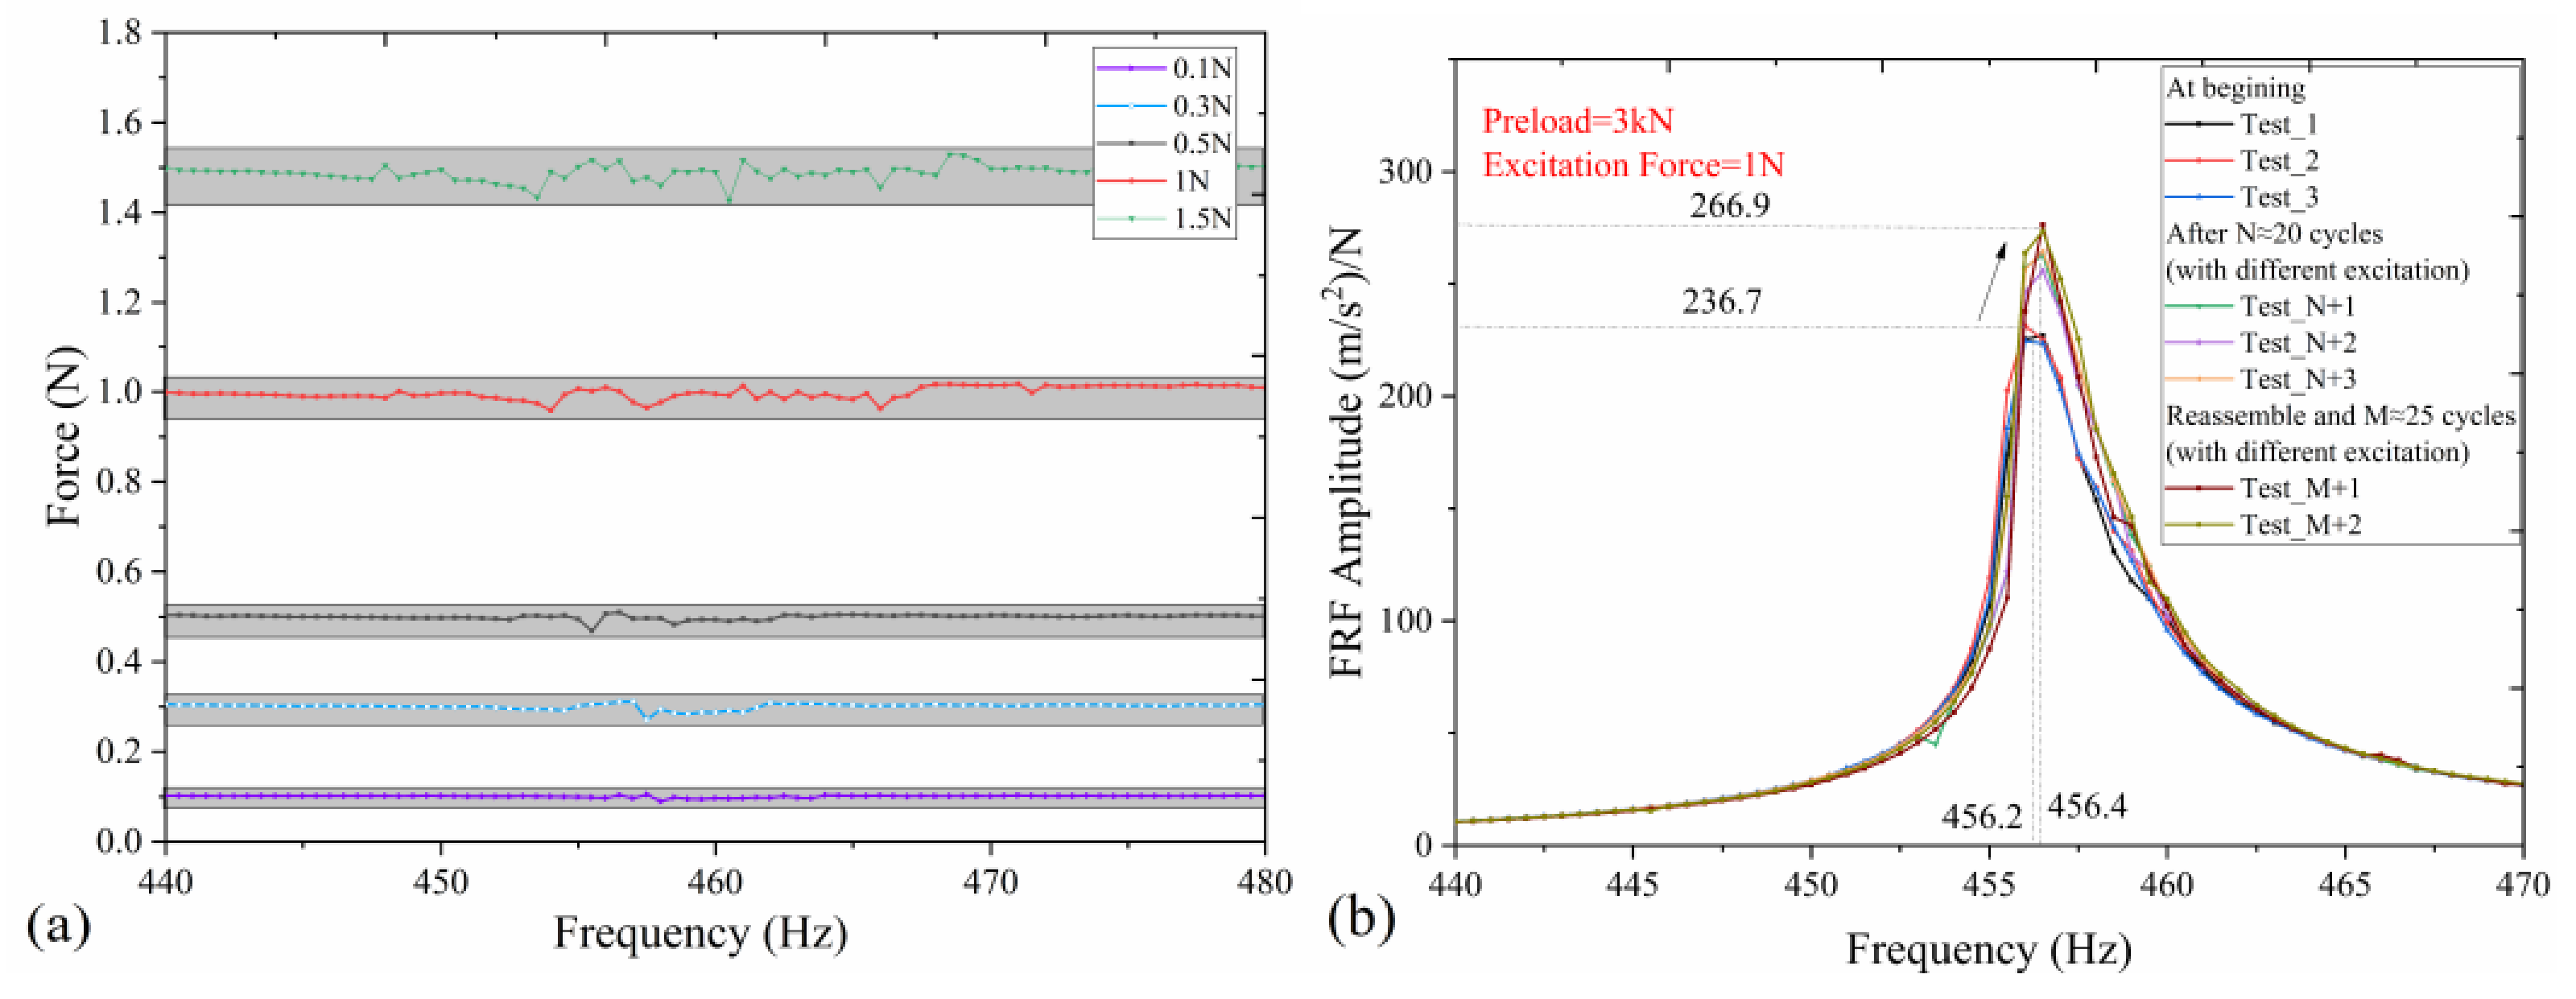
The bolted joint was tested under different controlled levels of excitation in order to study the nonlinear behavior caused by the contact interfaces. The force control provided by the LMS TestLab can be graphically observed in Figure 12a, where the trend of the controlled force vs. the excitation frequency is shown. The results show that the force can be easily controlled if a tolerance no smaller than 10% (±5%) is set with respect to the nominal values of 0.1, 0.3, 0.5, 1, 1.5 N excitation peak amplitude.
In order to check the repeatability of the test practice, the FRFs of three different tests were obtained by using a 1 N dynamic excitation and 3 kN as the bolt tension (Figure 12b). Although the test results show a negligible variation of the resonance frequency, the amplitude of the response changes significantly after several test repetitions (N ≈ 10) performed at different excitation amplitudes, due to the settling of the contact status at the interfaces. Nevertheless, two different aspects must be pointed out. First, the dynamic response tends to be stable as the number of repetitions increases, including also a variation of the dynamic excitation. Second, the FRFs evaluated in the third test session of the figure (i.e., the tests Test_M+1, Test_M+2, M ≈ 20) were obtained after disassembly/assembly operations of the test rig, and the repeatability of the test measurement is still verified.

5.2. Comparisons with the Monolithic Beam

The two-beam bolted joint, as well as the monolithic beam, are tested under the same loading condition for comparison purposes. Figure 13 shows the two FRFs averaged on three repeated tests (bolt tension equal to 5 kN, excitation force amplitude equal to 1 N).
As predicted by the numerical simulations, the resonance frequencies of the two test cases differ for about 400 Hz (449.6 Hz vs. 837.2 Hz for the two-beam bolted joint and the monolithic beam, respectively). The experimental resonance frequencies are slightly lower than the numerical ones (i.e., 449.6 Hz vs. 472 Hz and 837.2 Hz vs. 854 Hz, for the two-beams and single beam test case, respectively), since the real constraints at the contact interfaces are not as ideal as happens for the fully bonded constraints used in the simulation. Both FRFs appear to be slightly asymmetrical with respect to the resonance peak, which suggests the presence of the nonlinear behavior of the bolted structures. It is worth pointing out that such a nonlinear trend is also clear for the single beam test case, where just the contact interfaces between head/nut and beams are present, as well as that at the threads.
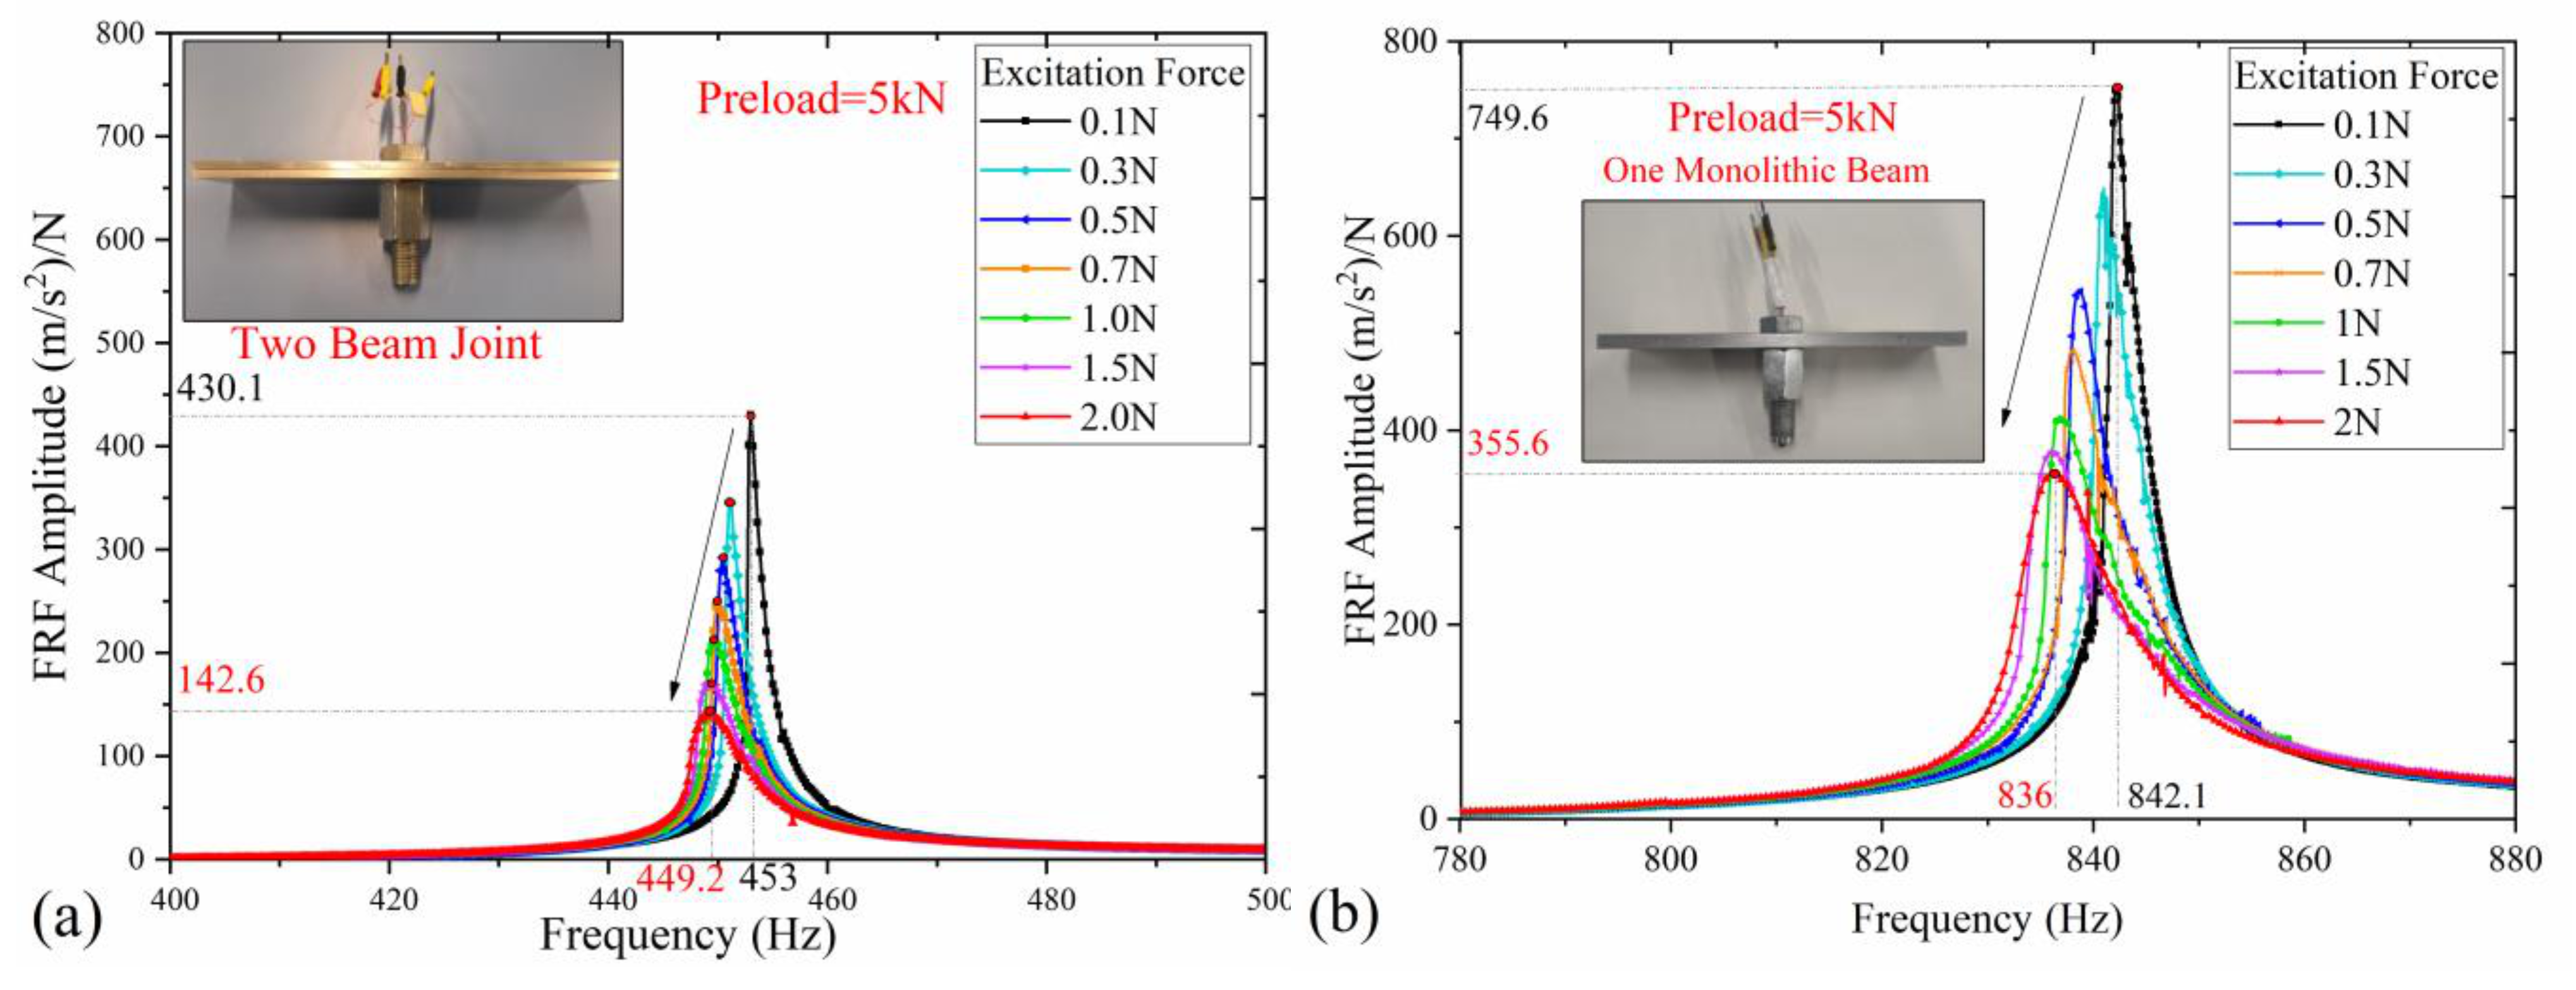
In order to test the nonlinear behavior of the two structures, a set of FRFs was measured by varying the amplitude of the excitation, while keeping the bolt tension constant and equal to 5 kN (Figure 14). In both cases, the resonance frequency and the response amplitude decrease as the excitation force increases from 0.1 to 2 N, a typical effect that is justified by the changing stiffness and damping due to the nonlinear behavior of the structures during vibration. From a detailed look into the plots of Figure 14, it can be noted a different ratio between the FRFs peak amplitudes corresponding to the highest and lowest excitation force (i.e., 0.1 and 2 N, respectively). In particular, the FRF amplitudes for the monolithic beam vary from 749.6 to 355.6 m/s2/N, corresponding to a reduction of the peak response equal to 52%, which is smaller than the 67% obtained for the two-beam bolted joint, where the acceleration amplitude decreases from 430.1 to 142.6 m/s2/N.
The damping induced at the contact interfaces seems to be much more sensitive to the variation of the excitation force rather than the stiffness, since the frequency only decreases from 453 to 449.2 Hz for the two-beams joint, corresponding to a 0.83% difference. This result is probably due to the slight variation of the joint stiffness that mainly depends on the sticking area, which slightly decreases when the force amplitude is increased, while the thin sliding area varies proportionally more than the central sticking area and produces an important variation in the peak response.
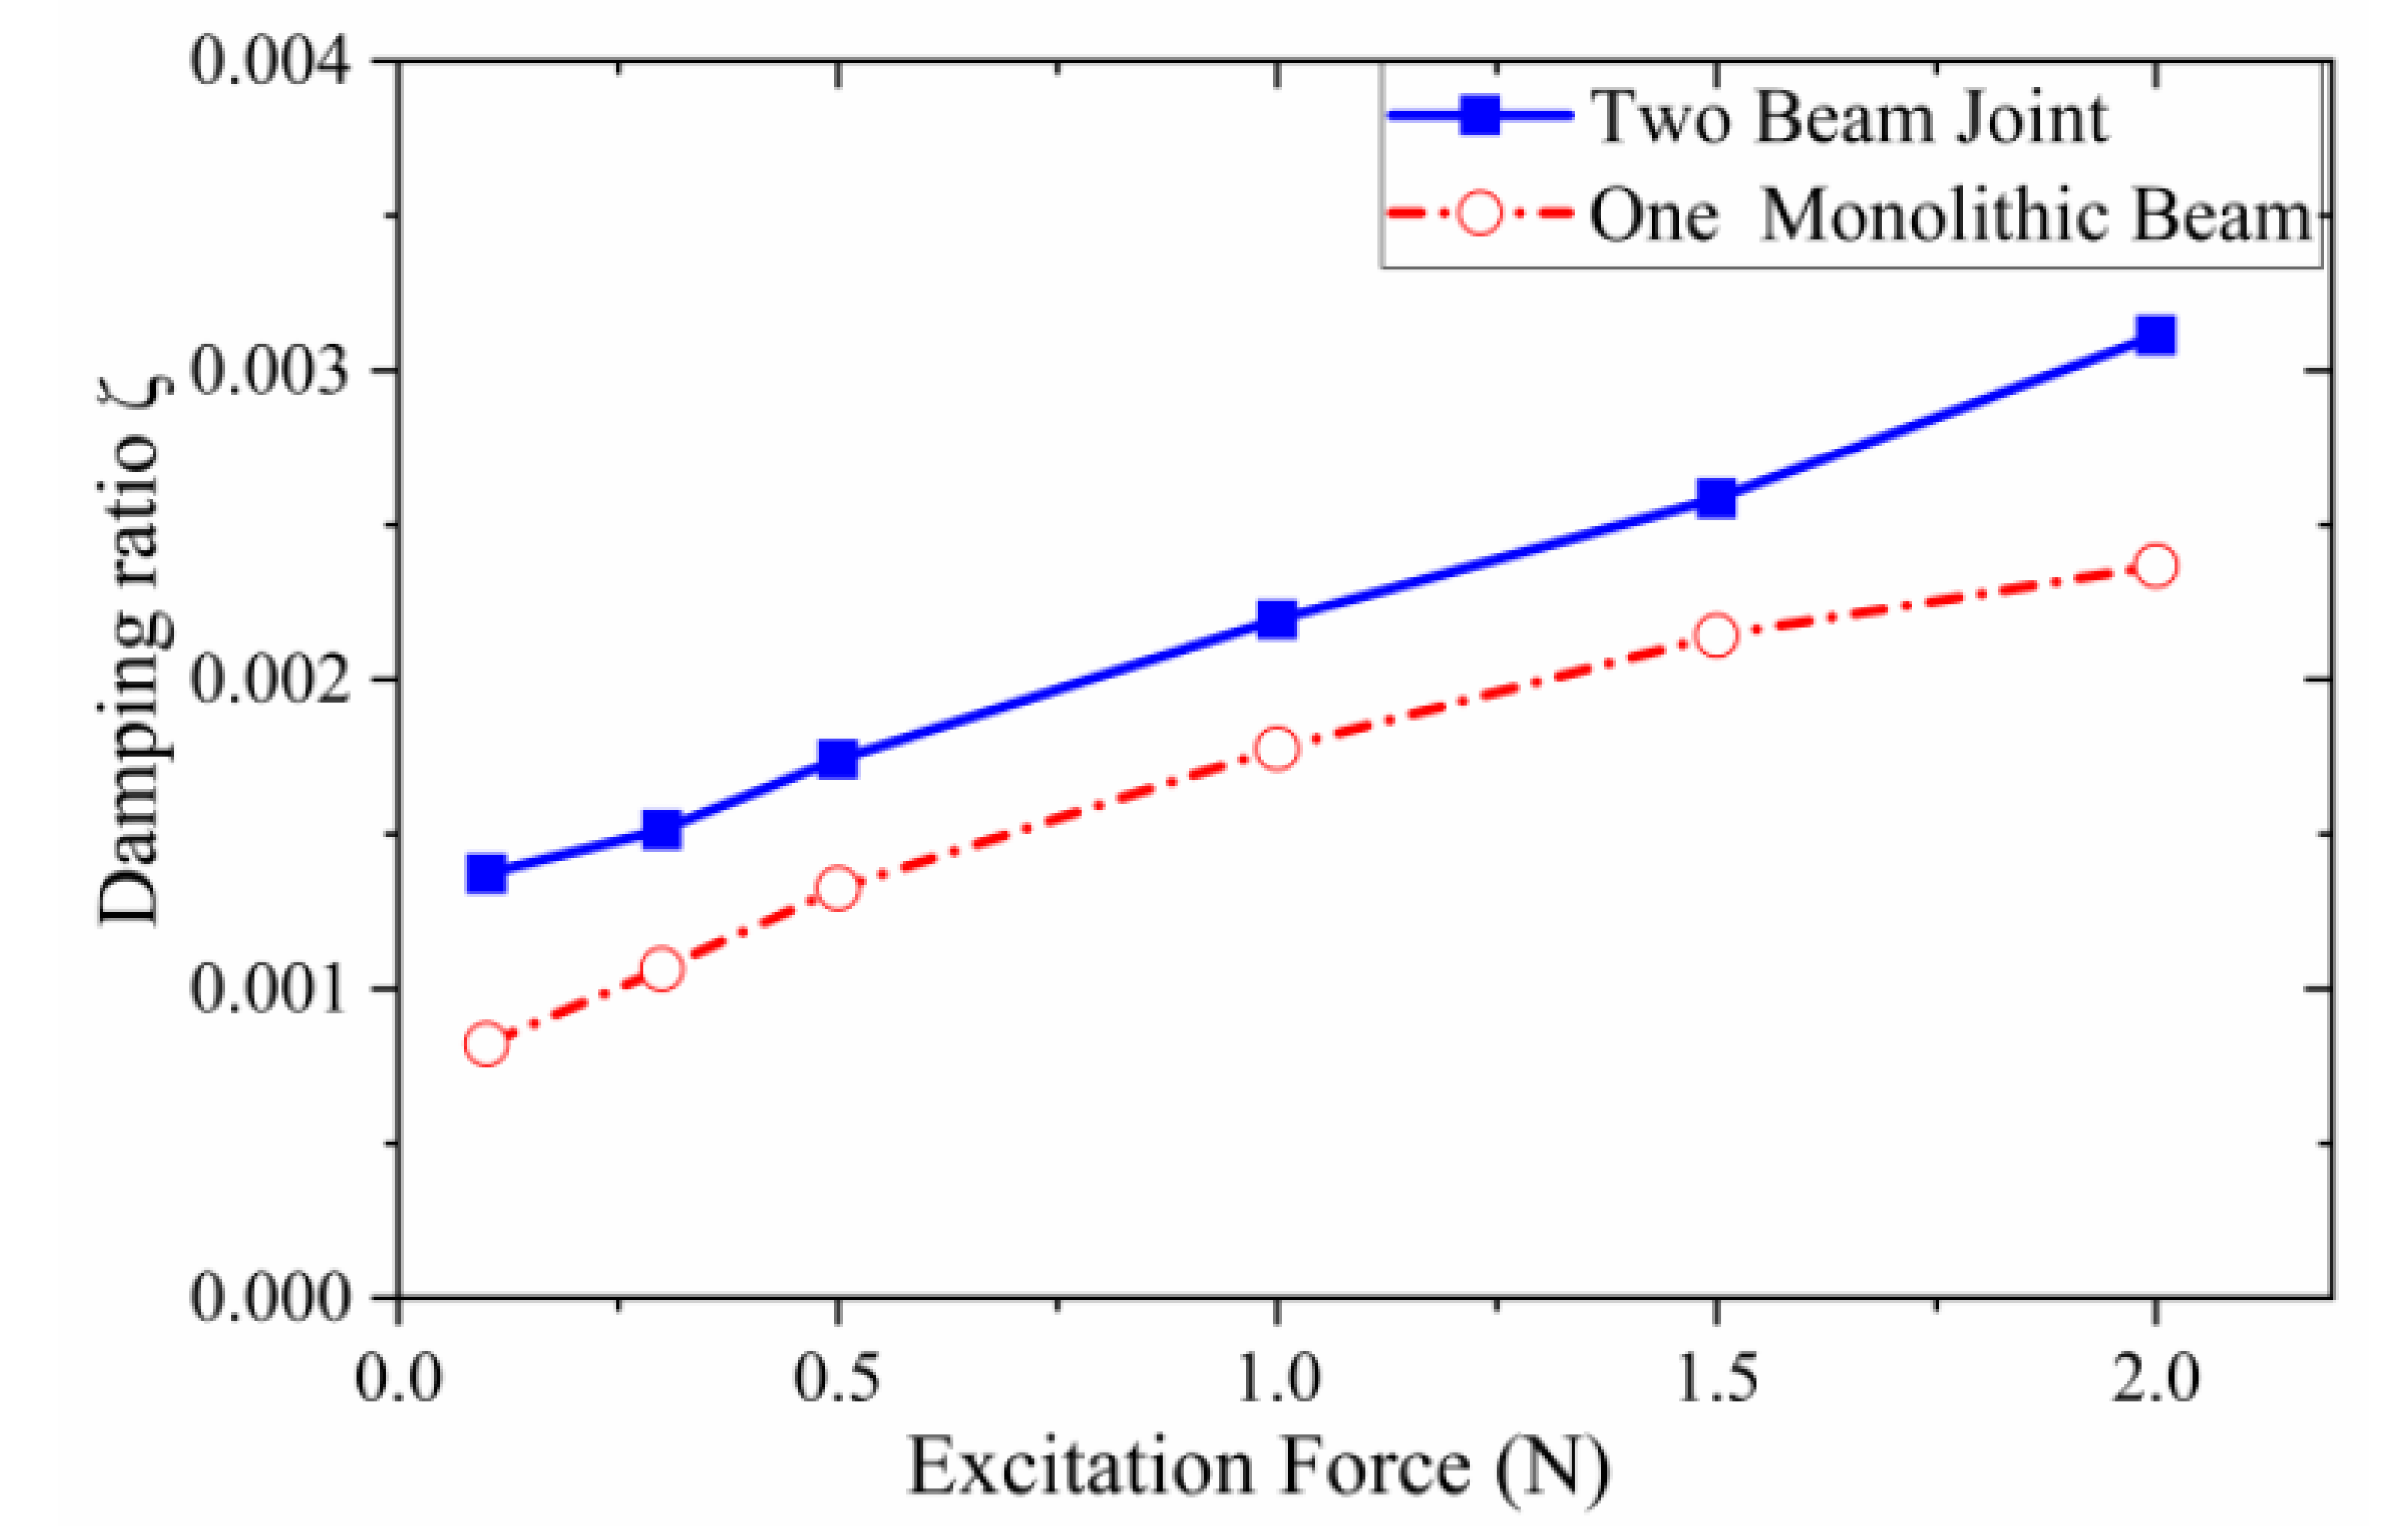
For the experimental identification of the modal damping ratio ζ , the rational fraction polynomials method reduced to SDOF, was used in this study [34]. The variation of the parameters ζ for a set of measurements obtained for a fixed value of the bolt tension (5 kN) and different dynamic excitation amplitudes are shown in Figure 15. It can be noted that the damping identified for the two test cases ( ζ = 1 × 10⁻³~4 × 10⁻³) is much larger than that of the metal (about 1 × 10⁻⁴~5 × 10⁻⁴) [35], which indicates that the frictional damping induced at the contact interfaces is the main source of the structural damping. The FRF for the two-beams setup shows a modal damping ratio ζ larger than that obtained for the monolithic beam. This proves how the contact interface between two beams represents a source of the friction damping. However, the influence of the contact interfaces of the head/nut-beam and threads contacts cannot be ignored. In fact, the FRFs obtained for the monolithic beam are characterized by a modal damping ratio that is several times larger than that of the material.

5.3. Results for Different Bolt Tensional Loads

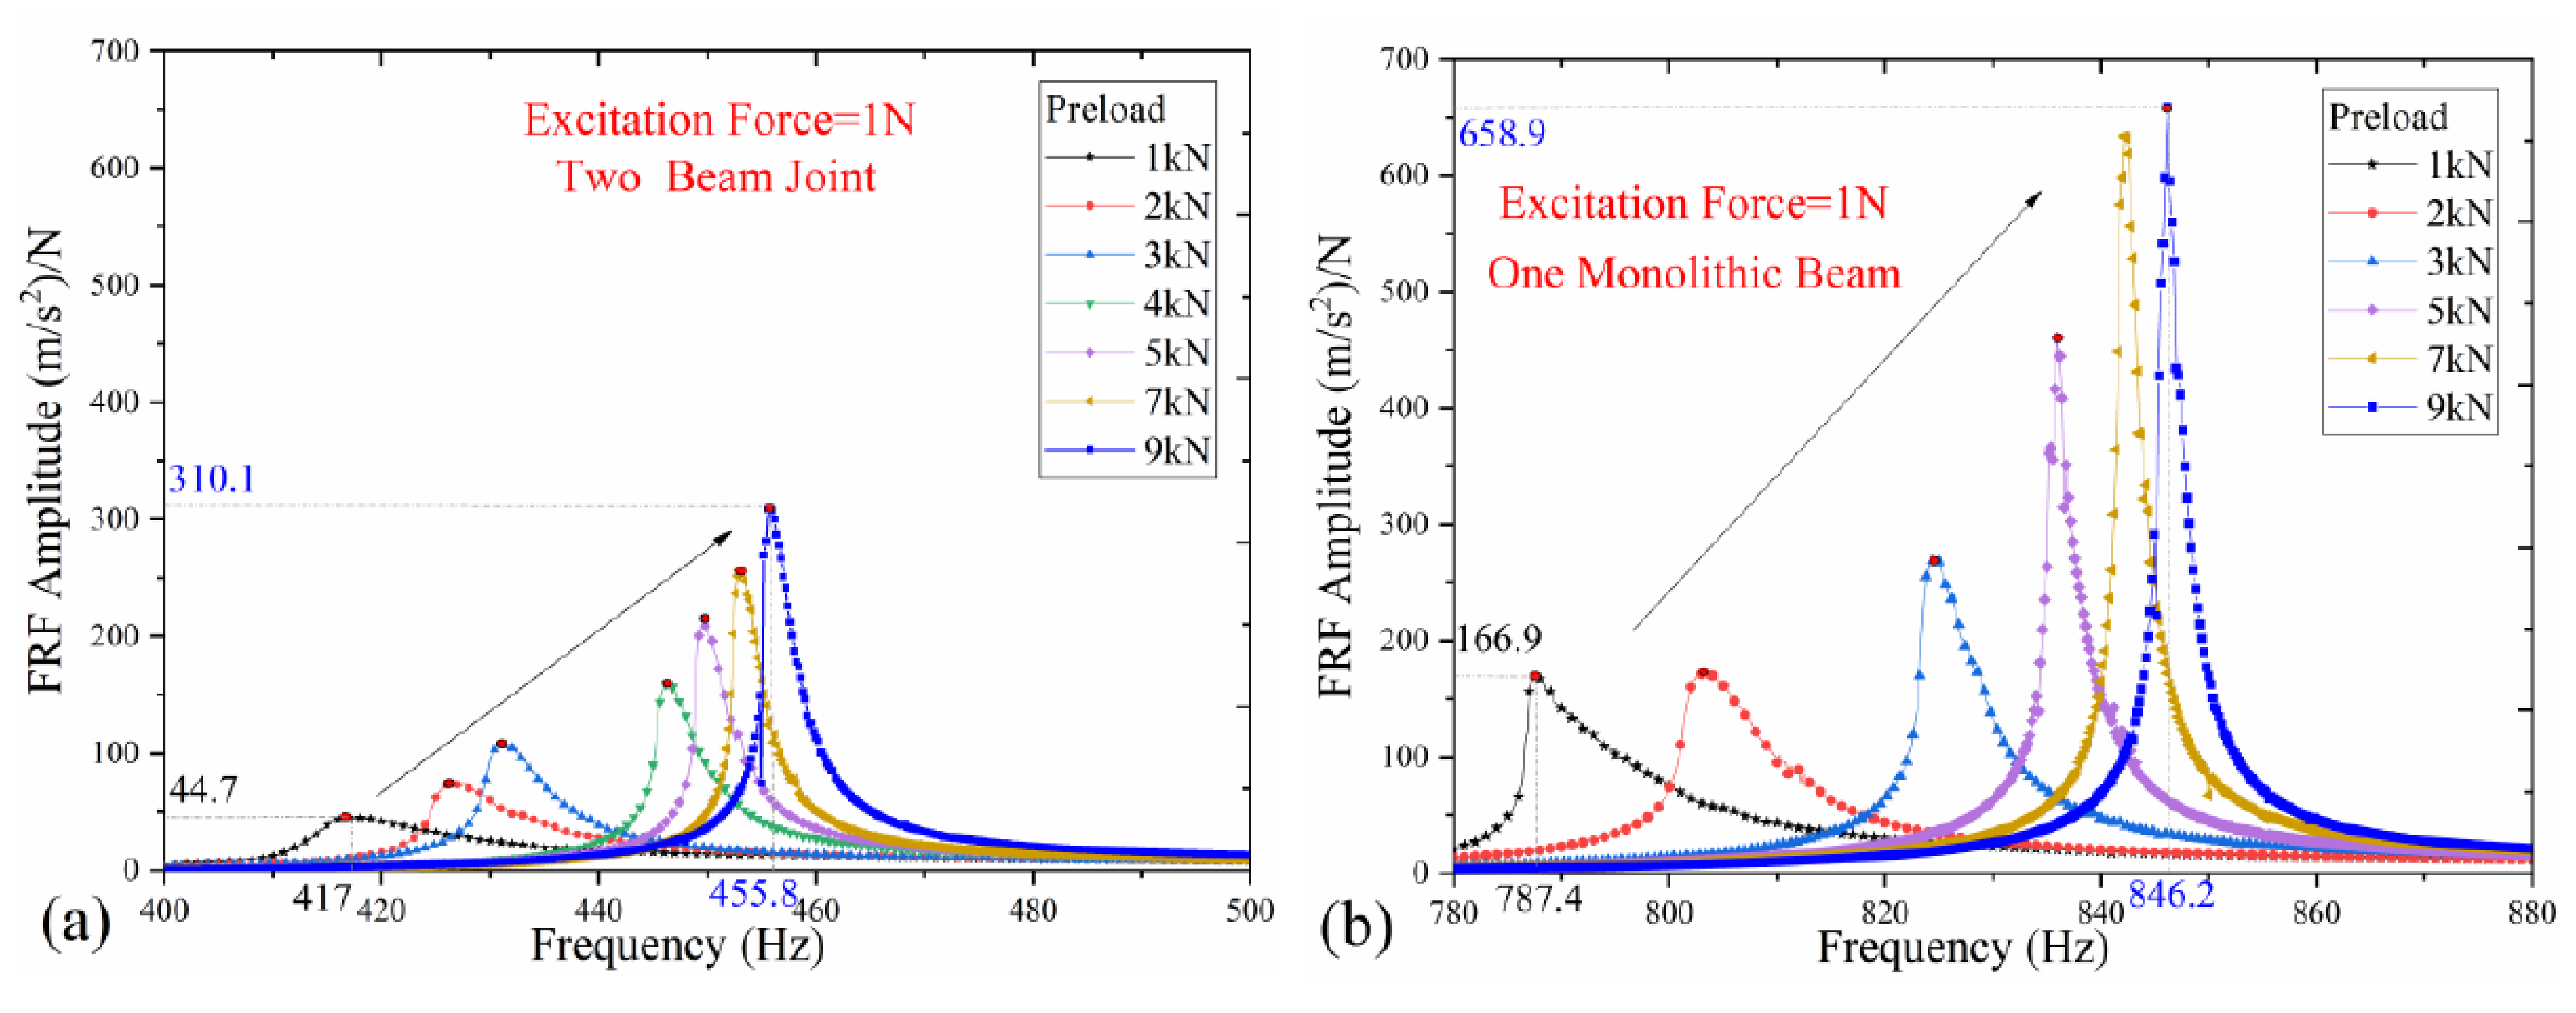
Further tests were performed for the same set of excitation forces adopted in the previous tests, by varying the bolt tension. The typical results are shown in Figure 16 where the systems are excited with 1 N excitation amplitude and a range of variable bolt tension (1~9 kN).
The experimental results show that for both structures, the response amplitude and natural frequency increase when the bolt tension increases from 1 to 9 kN. Numerical simulations suggest that for a bolt tension reduction from 7 to 1 kN, a contact pressure reduction takes place (Figure 17). This means that the smaller the bolt tension, the smaller the friction forces needed to trigger the slip status at the contact interface when the structure is dynamically excited. Thus, for the same excitation force, a structure with a smaller bolt tension features a higher amount of energy dissipated by friction.
From Figure 16, it appears that the FRF of the two-beams bolted joint is more influenced by the bolt tension variation than those corresponding to the monolithic beam. In particular, the response amplitude of two beams in contact increases from 44.7 to 310.1 m/s2/N as the bolt tension increases from 1 to 9 kN, corresponding to a change of the 594%, while for the monolithic beam the increase of the peak response is 294.8% (from 166.9 to 658.9 m/s2/N as the bolt tension increases).
Similar to what has been observed on the effects of excitation forces, the FRFs peak amplitude is much more sensitive to the variation of the bolt tension rather than the peak frequency, which is caused by the greater variation of the damping induced at the sliding area.
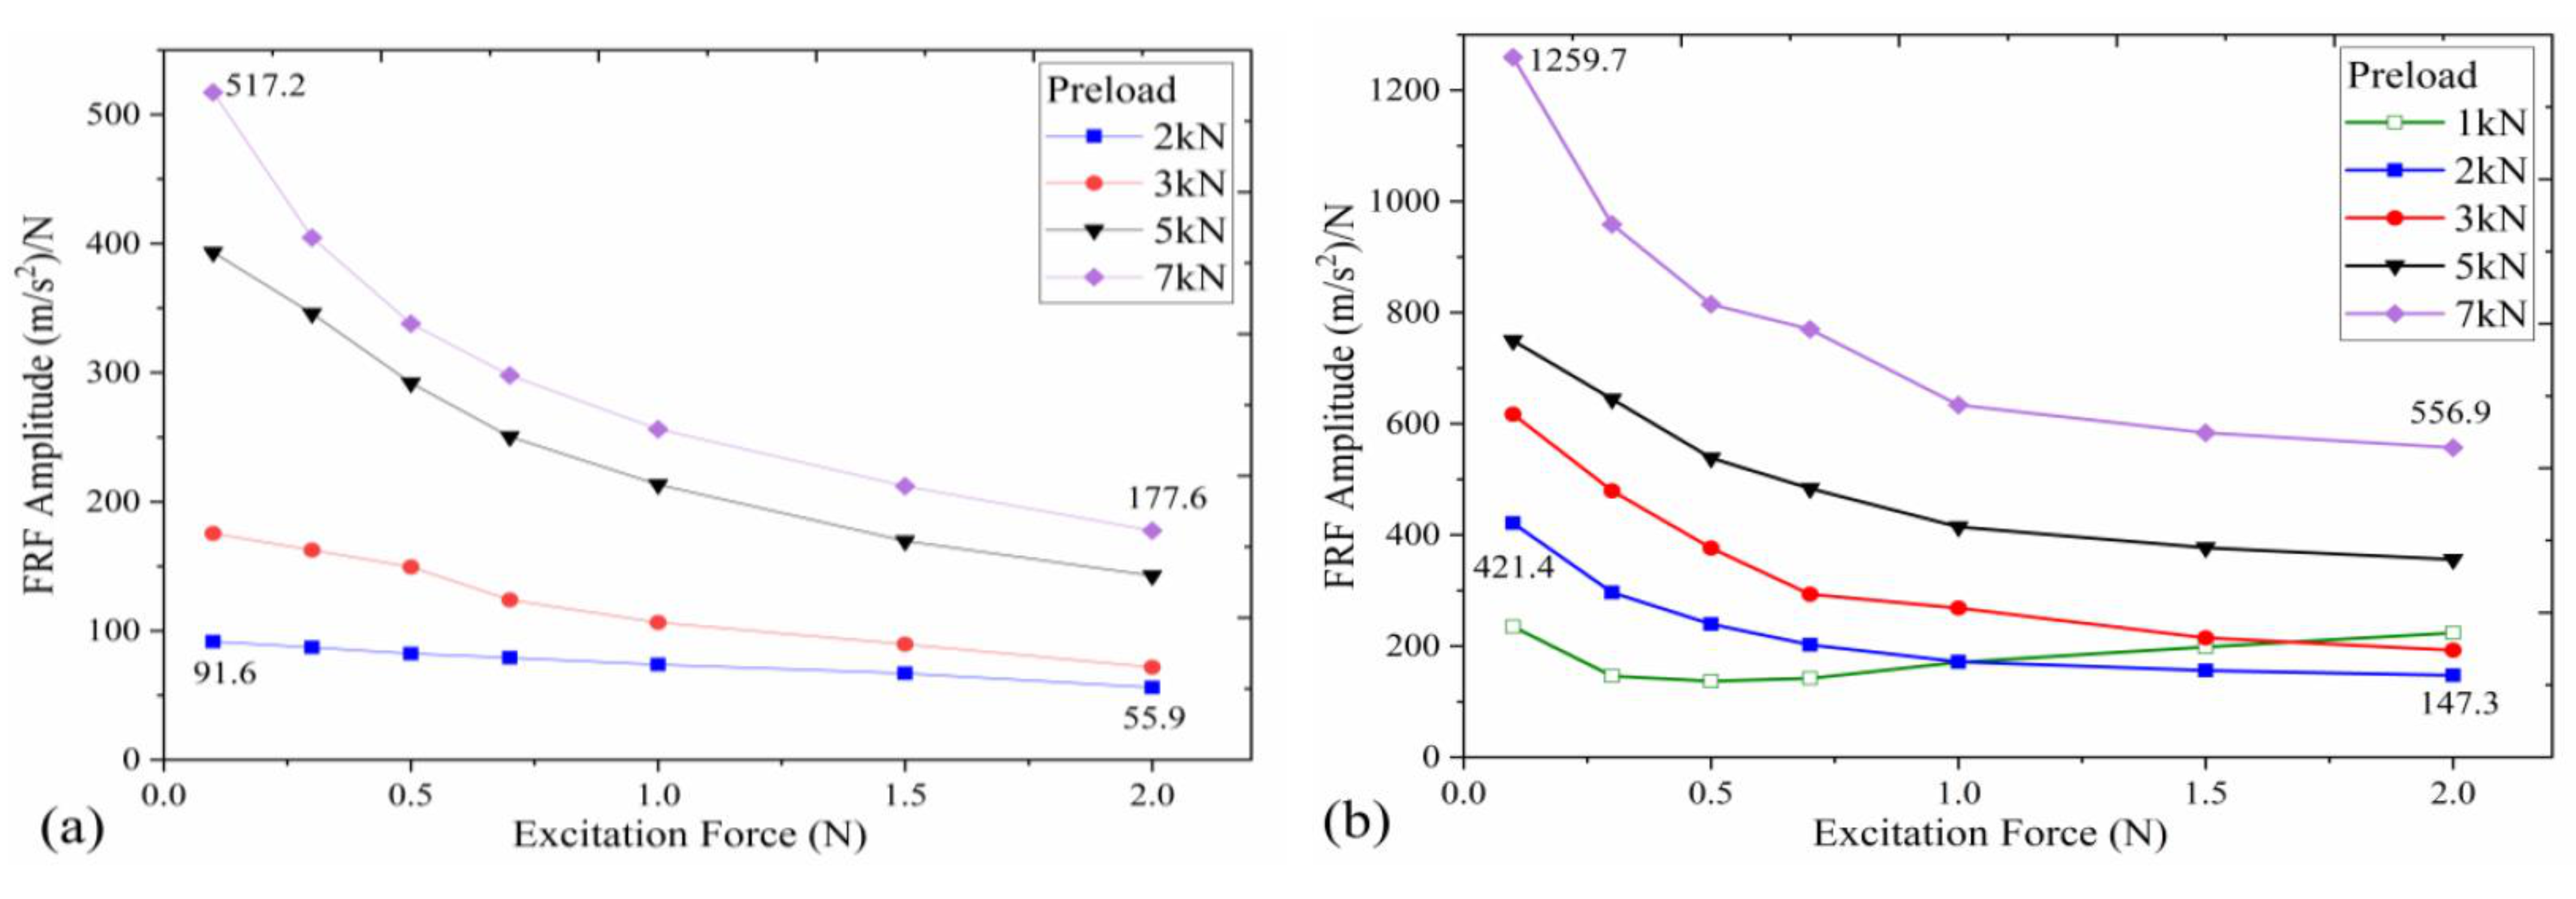
The influence of the bolt tension on the resonance frequency is larger than the excitation force. In fact, by keeping the excitation force fixed and equal to 1 N, an increase of the bolt tension from 1 to 9 kN generates an increase in the resonance frequency from 417 to 455.8 Hz for the two-beams joint system, corresponding to a 9.5% variation. The response versus the resonance frequency are shown in Figure 18, where the plotted curves refer to different bolt tensions and excitation amplitudes. The corresponding plots of the FRF amplitude versus the excitation forces are given in Figure 19.
From Figure 18, it can be noted that the trends found for the response amplitudes with respect to the excitation force, (increasing from 0.1 to 2 N) are similar to each other for both test cases for the different bolt tension. The only exception is represented by the FRF obtained for the monolithic beam under 1 kN bolt tension. In particular, as the excitation force increases from 0.1 to 2.0 N, the FRF amplitude first decreases until the minimum corresponding to 0.5 N of excitation force is reached (Figure 19b), and then increases for all the remaining excitation levels. In this case, i.e., when the contact preload is small, sliding can occur at low excitation forces and be responsible for large energy dissipation. On the other hand, if the excitation force is so large that significant relative displacements occur at the contact interfaces, the energy dissipation might result in low damping due to the inefficiency of the friction damping caused by the larger vibration amplitudes.
Figure 20 shows the trends of the modal damping ratio ζ identified using the rational fraction polynomials method versus the excitation forces at different bolt tension. The damping ratio increases as the excitation force increase from 0.1 to 2.0 N. However, according to the results shown in Figure 18b, Figure 19b and Figure 20b, the variation of the modal damping ratio of the one monolithic beam under the action of 1 kN bolt tension shows a maximum value in correspondence of the minimum response. It can be concluded that the contact interfaces between the two beams may represent an important source of damping for the structure and all the other interfaces together produce a non-negligible contribution to reduce vibrations.
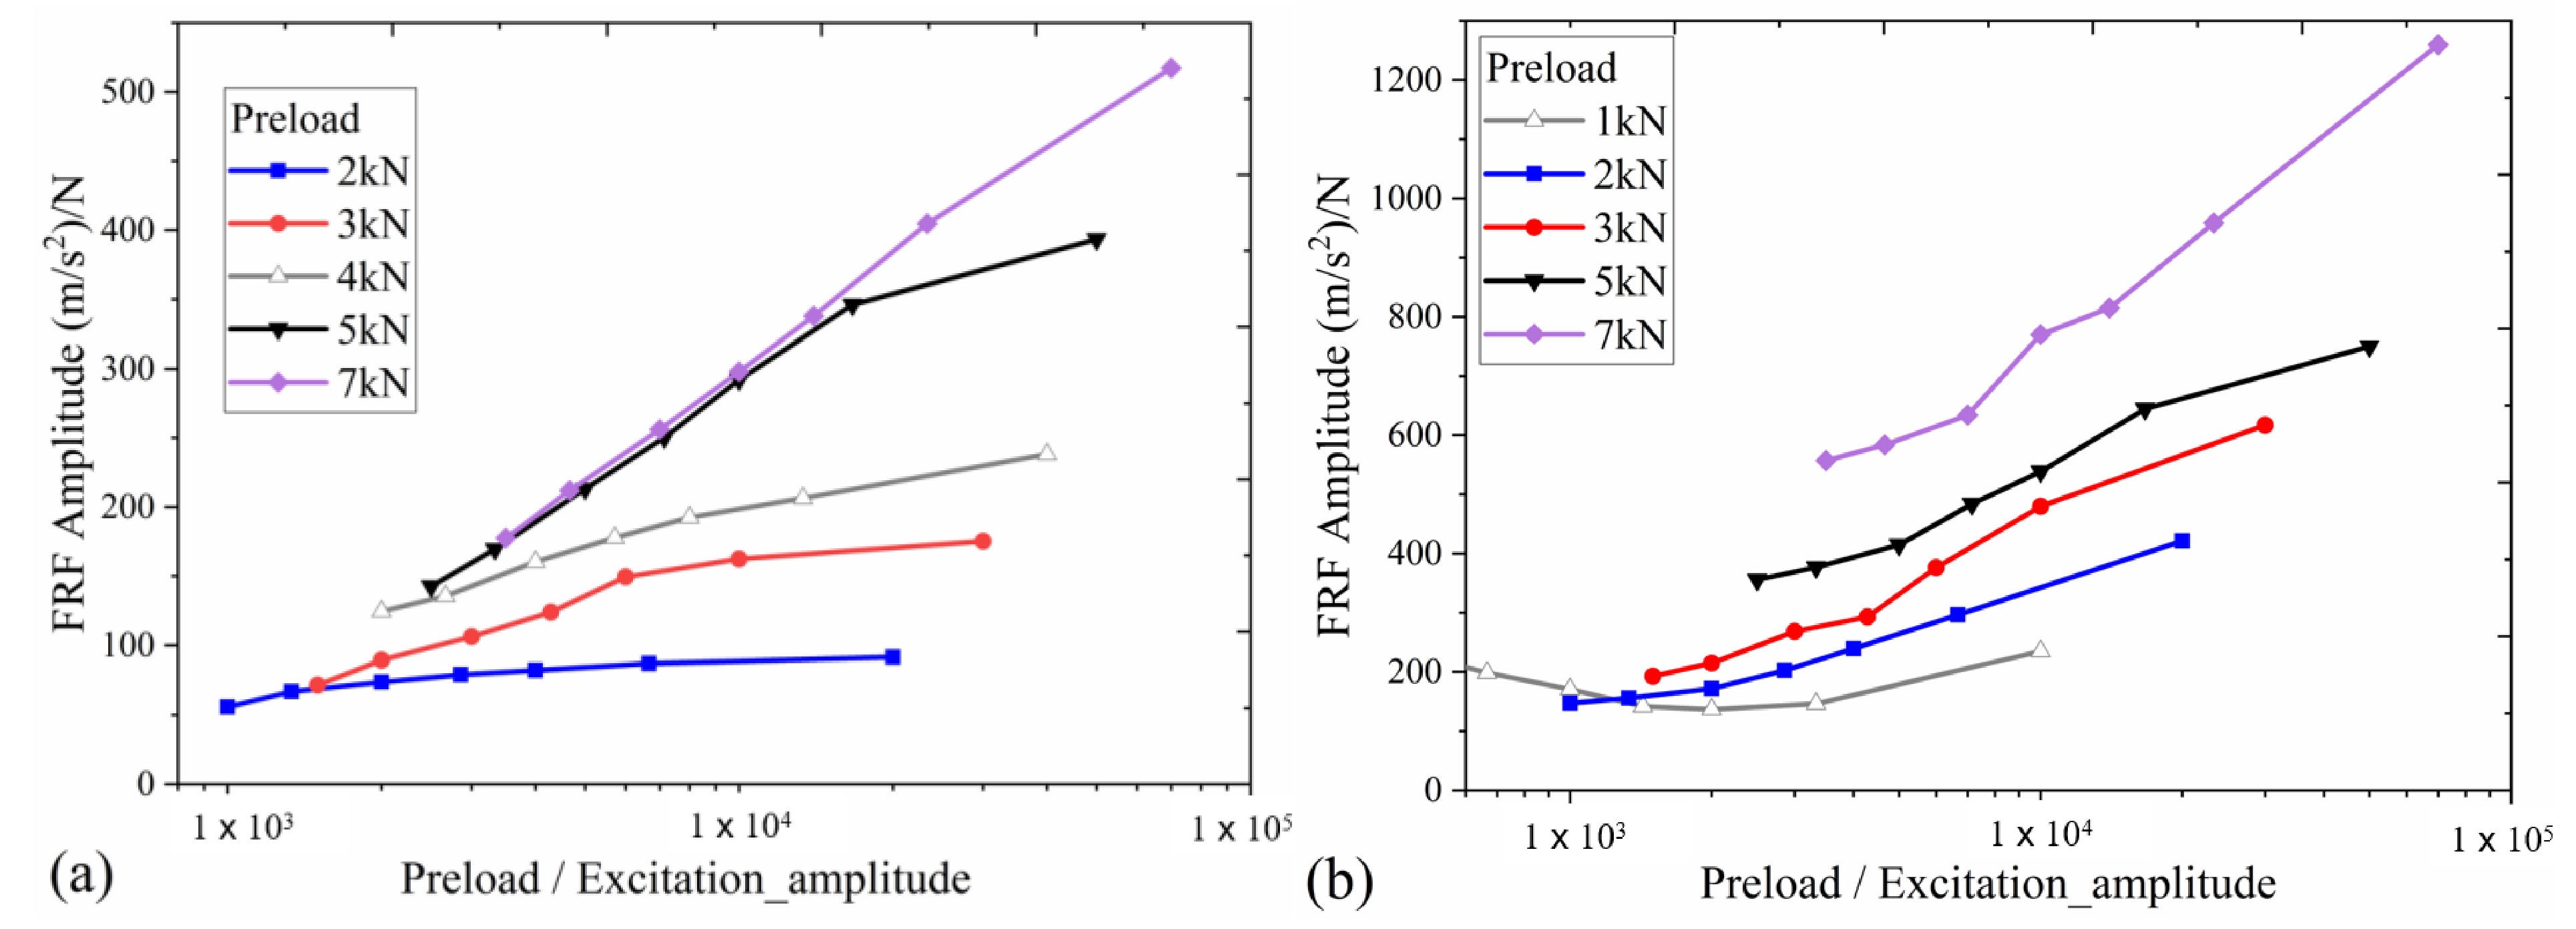
Figure 21 shows the response amplitude versus the ratio bolt tension/excitation amplitude. It can be demonstrated that the response only depends on the specified ratio, if a friction joint can be properly simulated by means of a single macro-slip contact element like the Jenkins element described in Ref. [36]. Since the curves in the figures do not overlap, it can be concluded that the bolted joint shows a much more complex contact behavior (where micro-slip is predominant) that needs specific contact modeling formulation.

6. Influence of the Head/Nut Contact Area

Figure 22 shows the contact interfaces between the bolt head/nut and beams. For both contact interfaces, the outer diameter is determined by the bolt size, while the inner diameter of the contact area is limited by the hole’s perimeter. To study the influence of the contacts bolt head/nut-beam, the hole diameter was increased from 18 to 19 mm, resulting in a 22% decrease of the contact area (Figure 22b).
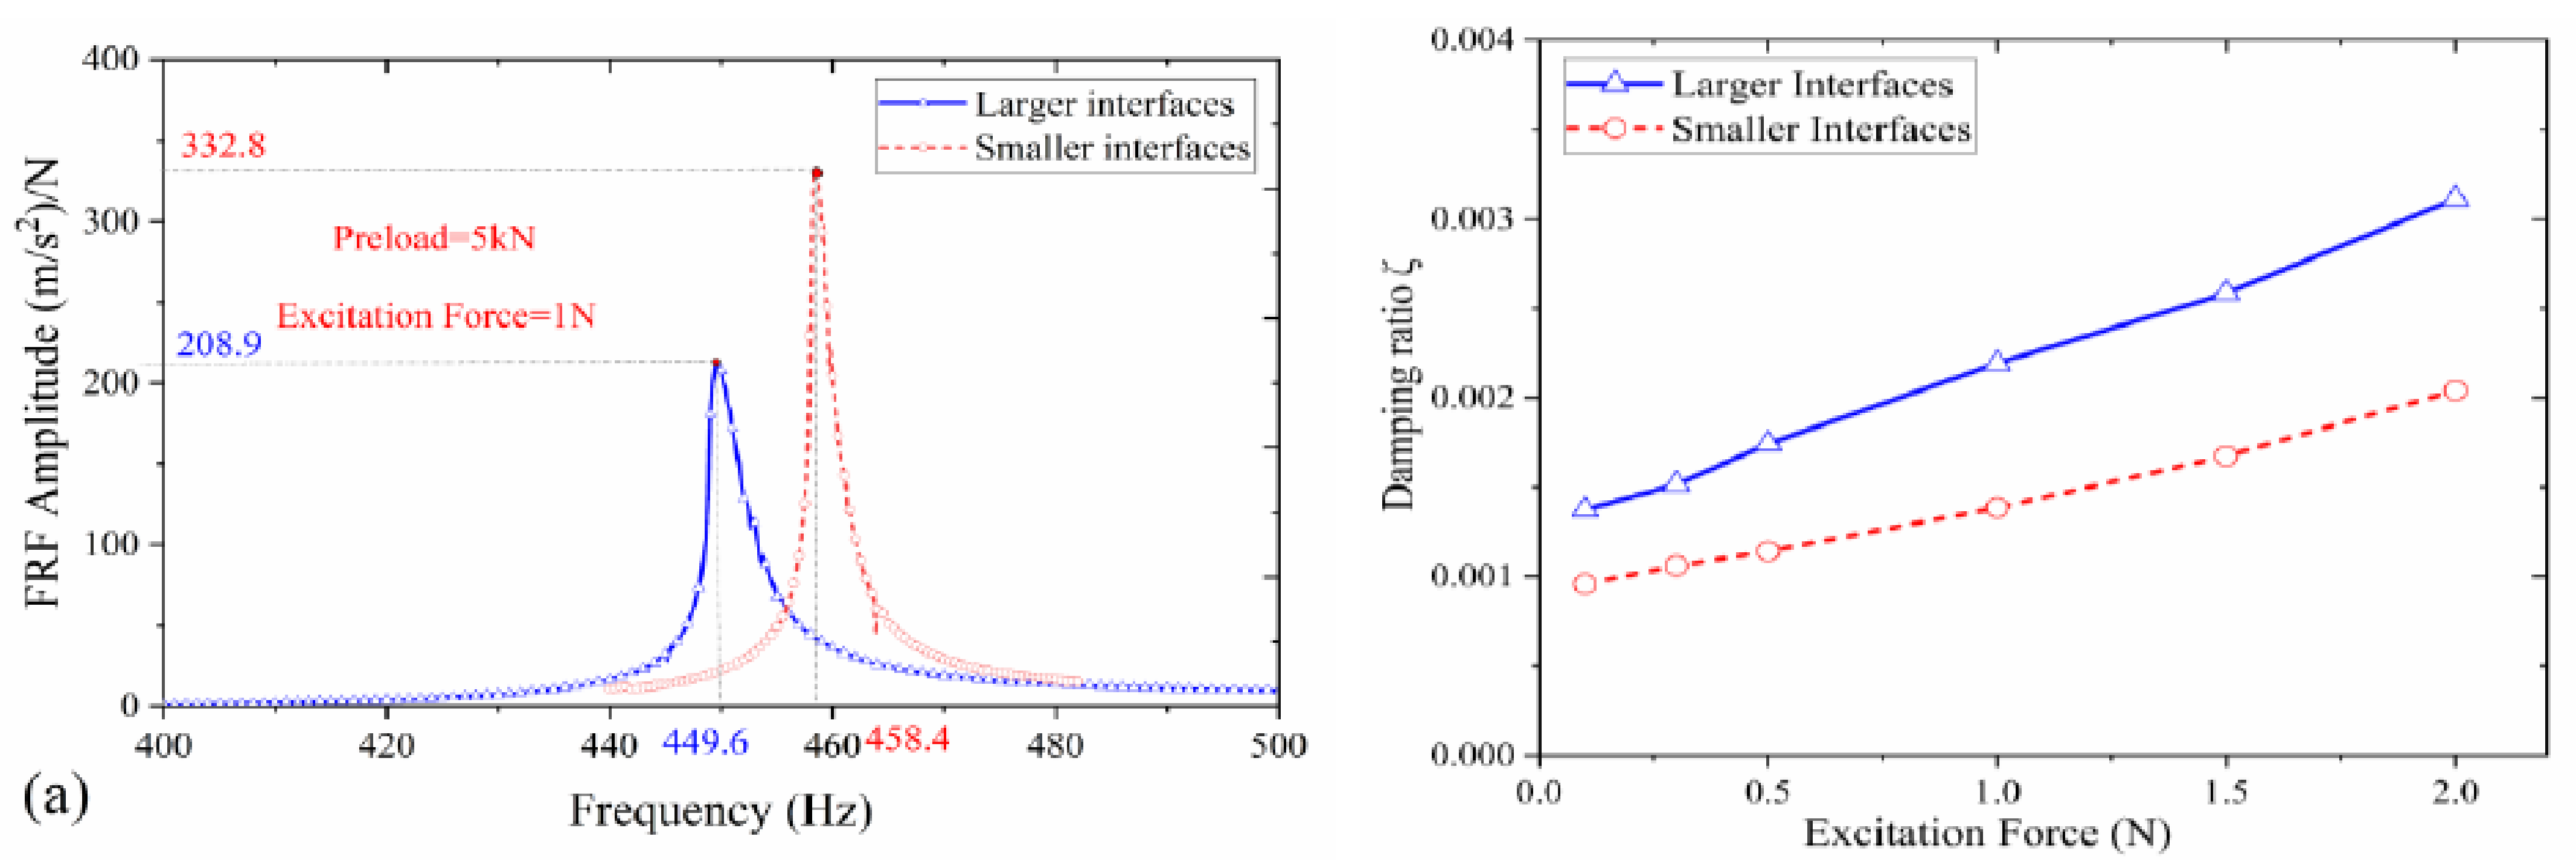
The new systems were tested as for the previous experiments, and the FRFs, as well as the damping characteristics, were identified under the same loading condition (i.e., bolt tension equal to 5 kN and excitation force of 1 N) on the two-beams test rig.
The experimental results given in Figure 23 show a different amplitude at resonance as the extension of the contact area changes. In particular, the structure with smaller interface exhibits a peak response that is significantly larger than that obtained with a larger contact area (i.e., 332.5 m/s2/N vs. 208.9 m/s2/N). The reason for that can be found in a larger contact pressure caused by a smaller contact interface under the same preload. A larger excitation force is needed to overcome the friction force if the contact pressure is higher, which enhances the tangential stiffness and increases the resonance frequency. The test results confirm the great importance the contact interfaces between the bolt head/nut and the beams have on the dynamic response of the structure.
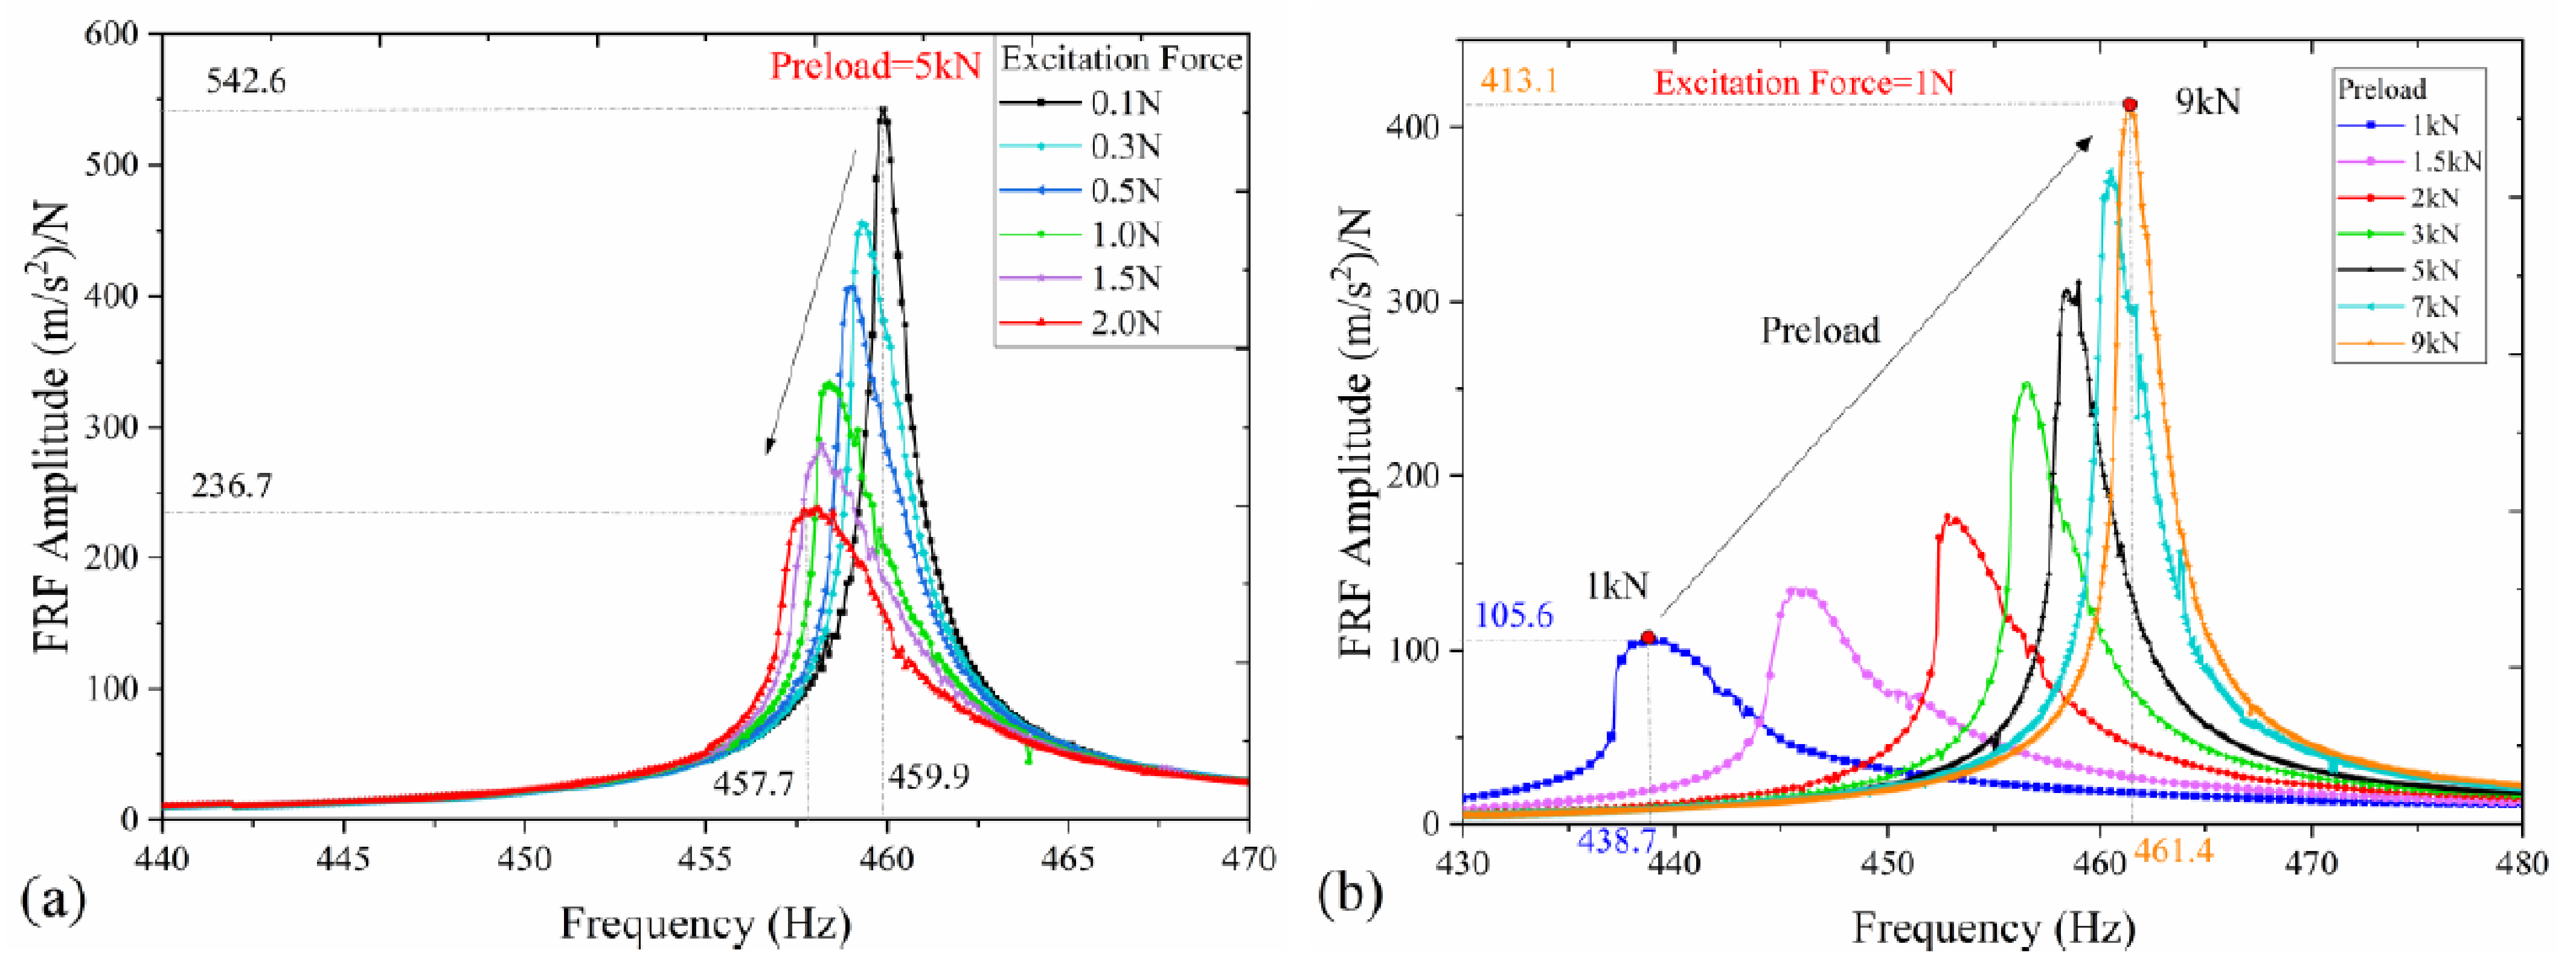
The effects of different excitation forces and different preload on the dynamic response of the bolted structures are shown in Figure 24. The influence of either the excitation force or bolt tension on the measured FRFs is mutually consistent for the two-beam structures. As the excitation force increases, the FRFs amplitude, and the resonance frequency reduce in both cases (Figure 24a), while the same quantities increase with an increasing bolt tension (Figure 24b). If the results are compared with those of a larger head/nut contact interface, it is possible to see that an increase of the excitation force from 0.1 to 2 N causes a decrease in the amplitude of the 66.8% (i.e., 430.1 m/s2/N vs. 142.6 m/s2/N) with a large head/nut contact interface, and of the 56.4% (i.e., 542.6 m/s2/N vs. 236.7 m/s2/N) for the smaller head/nut contact interfaces, respectively.

7. Conclusions

The dynamical characteristics of the bolted flanges during the out of plane vibration were experimentally investigated in this paper. A new, simple test rig was designed to highlight the nonlinear effect of a single bolted joint by controlling the bolt preload and the excitation amplitude. The frequency response functions of the bolted structures, as well as the damping, are studied, and the effects of the excitation force amplitudes and the bolt tension are analyzed. From the application of the test rig to different bolted joint systems, the following conclusions can be drawn within the scope of this study:
(1)
By comparing the dynamical characteristics of the two-beams bolted joint with that of the monolithic beam, it can be proved frictional damping induced at the interfaces between two flanges is the main source of the structural damping. Roughly speaking, the contribution of the interfaces between flanges to the modal damping ratio is not less than 2/3 of the total.
(2)
However, the nonlinear characteristic of the bolted monolithic beam clearly show how the dynamical characteristics of the bolted structures are also affected by the other contact areas of the joint (i.e., the interface between the head/nut and flange, or threads in contact). Thus, the influence of other contact areas of joints also needs to be considered in the study of the bolted structures.
(3)
As the excitation force increases, both the natural frequency and the response amplitude decrease nonlinearly, which can be explained by the nonlinear stiffness and damping caused by the contact interfaces. Micro-slip is more likely to occur at the contact interfaces as the excitation force increase, leading to more energy dissipation (i.e., damping) and lower tangential stiffness. Similar results are obtained by varying the bolt preload.
(4)
According to the experimental results of bolted beams with different contact areas at the head/nut, the amplitude of the structure with smaller contact interfaces is higher than that with larger interfaces under the same loading condition. The testing results further proved that the contact interfaces between the bolt head (or nut) and the flange has an important influence on the dynamic response of the structure.

Author Contributions

Conceptualization, C.M.F. and J.H.; methodology, C.M.F. and Y.W.; software, G.B.; validation, Y.W.; formal analysis, Y.M.; investigation, Y.W.; resources, C.M.F.; data curation, Y.W.; writing—original draft preparation, Y.W.; writing—review and editing, C.M.F. and Y.M.; visualization, Y.W. and G.B.; supervision, C.M.F. and J.H.; funding acquisition, C.M.F. and J.H. All authors have read and agreed to the published version of the manuscript.

Funding

This research was funded by the AerMec Laboratory of the Politecnico di Torino and the National Natural Science Foundation of China (Nos. 52075018).

Institutional Review Board Statement

Not applicable.

Informed Consent Statement

Not applicable.

Acknowledgments

The authors would like to thank the National Natural Science Foundation of China (Nos. 52075018), and the China Scholarships Council (No. 201906020037) for their support in this research.

Conflicts of Interest

The authors declare no conflict of interest.

References

  1. Bograd, S.; Reuss, P.; Schmidt, A.; Gaul, L.; Mayer, M. Modeling the dynamics of mechanical joints. Mech. Syst. Signal Process. 2011, 25, 2801–2826. [Google Scholar] [CrossRef]
  2. Ferri, A.A. Friction Damping and Isolation Systems. J. Mech. Des. 1995, 117, 196–206. [Google Scholar] [CrossRef]
  3. Ungar, E.E. Energy Dissipation at Structural Joints; Mechanisms and Magnitudes; Bolt Beranek and Newman Inc.: Cambridge, MA, USA, 1964. [Google Scholar]
  4. Ungar, E.E.; Carbonell, J.R. On panel vibration damping due to structural joints. AIAA J. 1966, 4, 1385–1390. [Google Scholar] [CrossRef]
  5. Beards, C.; Williams, J. The damping of structural vibration by rotational slip in joints. J. Sound Vib. 1977, 53, 333–340. [Google Scholar] [CrossRef]
  6. Masuko, M.; Ito, Y.; Koizumi, T. Horizontal Stiffness and Micro-Slip on a Bolted Joint Subjected to Repeated Tangential Static Loads. Bull. JSME 1974, 17, 1494–1501. [Google Scholar] [CrossRef] [Green Version]
  7. Gaul, L.; Nackenhorst, U.; Willner, K.; Lenz, J. Nonlinear vibration damping of structures with bolted joints. In Proceedings of SPIE—International Society for Optical Engineering; SPIE International Society for Optical Engineering: Bellingham, WA, USA, 1994; pp. 875–881. [Google Scholar]
  8. Hanks, B.R.; Stephens, D.G. Mechanisms and scaling of damping in a practical structural joint. Shock Vib. Bull. 1967, 36, 1–8. [Google Scholar]
  9. Gould, H.H.; Mikić, B.B. Areas of Contact and Pressure Distribution in Bolted Joints. J. Eng. Ind. 1972, 94, 864–870. [Google Scholar] [CrossRef] [Green Version]
  10. Groper, M. Microslip and macroslip in bolted joints. Exp. Mech. 1985, 25, 171–174. [Google Scholar] [CrossRef]
  11. Segalman, D.J. An Initial Overview of Iwan Modeling for Mechanical Joints. Rep. Sand 2001, 811. [Google Scholar] [CrossRef] [Green Version]
  12. Segalman, D.J.; Gregory, D.L.; Starr, M.J.; Resor, B.R.; Jew, M.D.; Lauffer, J.P.; Ames, N.M. Handbook on Dynamics of Jointed Structures; Sandia National Laboratories: Albuquerque, NM, USA, 2009.
  13. Botto, D.; Lavella, M.; Gola, M.M. Measurement of contact parameters of flat on flat contact surfaces at high temperature. In ASME Turbo Expo 2012: Turbine Technical Conference and Exposition; American Society of Mechanical Engineers Digital Collection: New York, NY, USA, 2012; pp. 1325–1332. [Google Scholar]
  14. Ferrero, J.-F.; Yettou, E.M.; Barrau, J.-J.; Rivallant, S. Analysis of a dry friction problem under small displacements: Application to a bolted joint. Wear 2004, 256, 1135–1143. [Google Scholar] [CrossRef] [Green Version]
  15. Abad, J.; Franco, J.; Celorrio, R.; Lezáun, L. Design of experiments and energy dissipation analysis for a contact mechanics 3D model of frictional bolted lap joints. Adv. Eng. Softw. 2012, 45, 42–53. [Google Scholar] [CrossRef]
  16. Gaul, L.; Lenz, J. Nonlinear dynamics of structures assembled by bolted joints. Acta Mech. 1997, 125, 169–181. [Google Scholar] [CrossRef]
  17. Yanhong, M.A.; Yongfeng, W.; Cun, W.; Jie, H. Nonlinear interval analysis of rotor response with joints under uncertainties. Chin. J. Aeronaut. 2020, 33, 205–208. [Google Scholar]
  18. Jalali, H.; Ahmadian, H.; Mottershead, J.E. Identification of nonlinear bolted lap-joint parameters by force-state mapping. Int. J. Solids Struct. 2007, 44, 8087–8105. [Google Scholar]
  19. Maloney, C.; Peairs, D. Characterization of Damping in Bolted Lap Joints; Los Alamos National Lab.: Los Alamos, NM, USA, 2000.
  20. Cooper, S.B.; Rosatello, M.; Mathis, A.T.; Johnson, K.; Mayes, R.L. Effect of far-field structure on joint properties. In Dynamics of Coupled Structures; Springer: Cham, Switzerland, 2017; Volume 4, pp. 63–77. [Google Scholar]
  21. Smith, S.; Bilbao-Ludena, J.C.; Catalfamo, S.; Brake, M.R.W.; Reuß, P.; Schwingshackl, C.W. The Effects of Boundary Conditions, Measurement Techniques, and Excitation Type on Measurements of the Properties of Mechanical Joints. Conf. Proc. Soc. Exp. Mech. Ser. 2016, 1, 415–431. [Google Scholar]
  22. Catalfamo, S.; Smith, S.A.; Morlock, F.; Brake, M.R.W.; Zhu, W.D. Effects of experimental methods on the measurements of a nonlinear structure. In Dynamics of Coupled Structures; Springer: Cham, Switzerland, 2016; Volume 4, pp. 491–500. [Google Scholar]
  23. Brake, M.; Schwingshackl, C.; Reuß, P. Observations of variability and repeatability in jointed structures. Mech. Syst. Signal Process. 2019, 129, 282–307. [Google Scholar] [CrossRef]
  24. Deaner, B.J.; Allen, M.S.; Starr, M.J.; Segalman, D.J.; Sumali, H. Application of Viscous and Iwan Modal Damping Models to Experimental Measurements from Bolted Structures. J. Vib. Acoust. 2015, 137, 021012. [Google Scholar] [CrossRef]
  25. Singh, A.; Scapolan, M.; Saito, Y.; Allen, M.S.; Kuether, R.J. Experimental characterization of a new benchmark structure for prediction of damping nonlinearity. In Nonlinear Dynamics; Springer: Cham, Switzerland, 2019; Volume 1, pp. 57–78. [Google Scholar]
  26. Boeswald, M.; Link, M.; Meyer, S.; Weiland, M. Investigations on the non-linear behaviour of a cylindrical bolted casing joint using high level base excitation tests. In Proceedings of the ISMA: International Conference on Noise and Vibration Engineering, Leuven, Belgium, 16–17 September 2002. [Google Scholar]
  27. Beaudoin, M.-A.; Behdinan, K. Analytical lump model for the nonlinear dynamic response of bolted flanges in aero-engine casings. Mech. Syst. Signal Process. 2019, 115, 14–28. [Google Scholar] [CrossRef]
  28. Macke, H.J. Traveling-Wave Vibration of Gas-Turbine Engine Shells. J. Eng. Power 1966, 88, 179–187. [Google Scholar] [CrossRef]
  29. Wriggers, P. Finite element algorithms for contact problems. Arch. Comput. Methods Eng. 1995, 2, 1–49. [Google Scholar] [CrossRef]
  30. Kloosterman, G. Contact Methods in Finite Element Simulations. Ph.D. Thesis, Universiteit Twente, Enschede, The Netherlands, 2002. [Google Scholar]
  31. Fronk, M.; Eschen, K.; Starkey, K.; Kuether, R.J.; Brakeet, M. Inverse methods for characterization of contact areas in mechanical systems. In Nonlinear Dynamics; Springer: Cham, Switzerland, 2019; Volume 1, pp. 45–56. [Google Scholar]
  32. Klöcker, M.; Westphal, S. Investigations of friction-relevant parameters to ensure reliable bolted joints. In Matec Web of Conferences; EDP Sciences: Les Ulis, France, 2017; Volume 94, p. 04007. [Google Scholar]
  33. Published Torque Technical Information from Internet. Available online: http://www.markserv.co.th/torqueinfo3.php (accessed on 7 January 2021).
  34. Mark, H.R.; David, L.F. Parameter Estimation from Frequency Response Measurements using Rational Fraction Polynomials. In Proceedings of SPIE—The International Society for Optical Engineering; SPIE the International Society for Optical Engineering; Bellingham, WA, USA, 1982. [Google Scholar]
  35. Published Viscous Damping Ratios for Different Systems and Materials from the Internet Website. Available online: https://help.solidworks.com/2016/English/SolidWorks/cworks/r_viscous_damping_ratios.htm (accessed on 7 January 2021).
  36. Firrone, C.M.; Zucca, S. Modelling friction contacts in structural dynamics and its application to turbine bladed disks. Numer. Anal. Theory Appl. 2011, 14, 301–334. [Google Scholar]
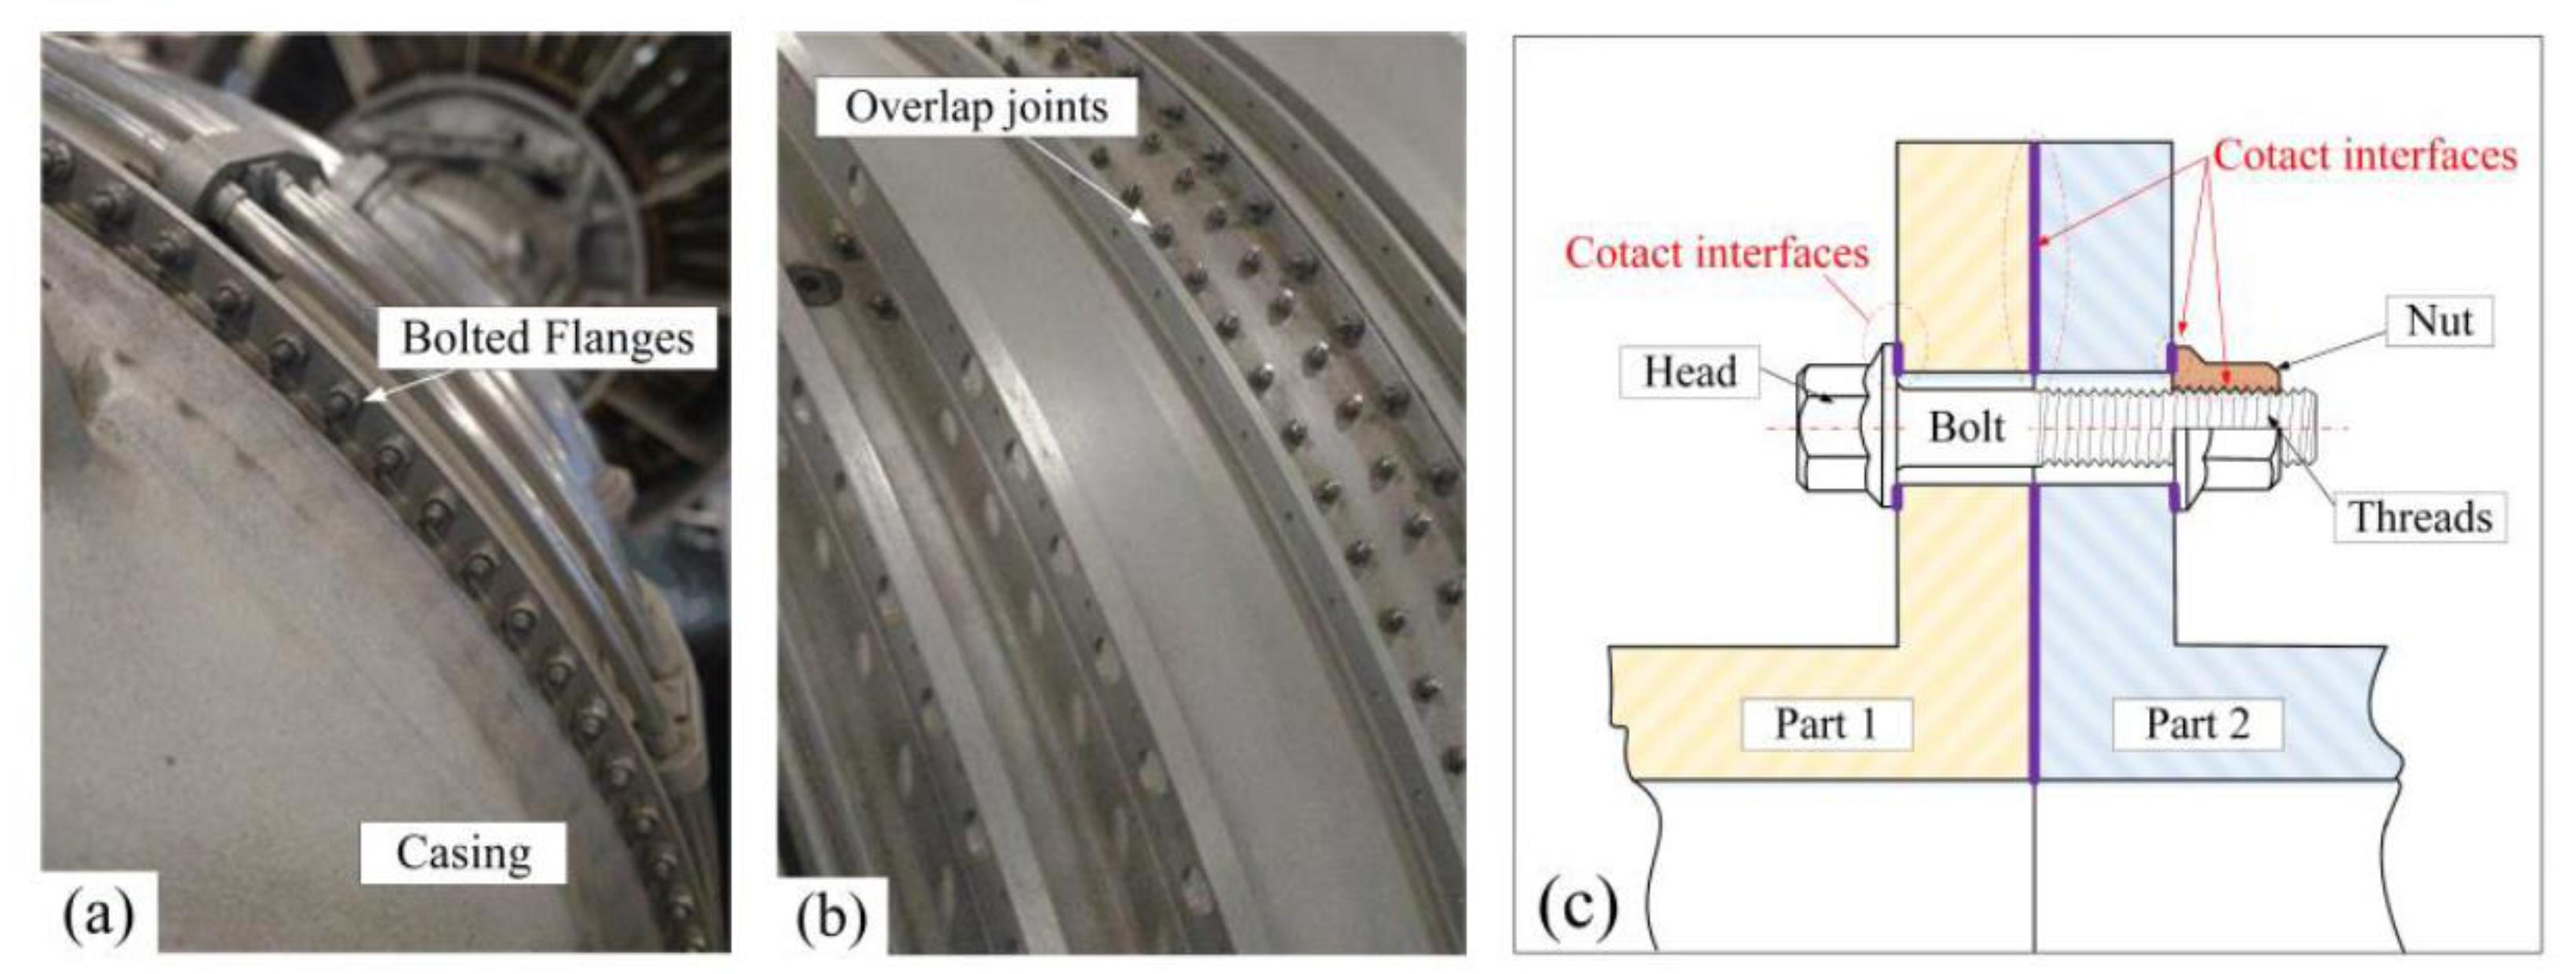
Figure 1. Illustration of bolted joints, (a) bolted flanges, (b) overlap joints, (c) the contact interfaces.
Applsci 11 05613 g001
Figure 2. Illustration of a bolted joint, (a) Qualitative representation of the pressure distribution [9], (b) Sliding in the contact patch [11].
Applsci 11 05613 g002
Figure 3. Deformation of the bolted flanges in vibration, (a) typical vibration modes of the bolted casing, (b) vibration shape of the flange, (c) deformed geometry of the single wave.
Applsci 11 05613 g003
Figure 4. Comparison of the two experimental setups: (a) two-beam joint, and (b) one monolithic beam.
Applsci 11 05613 g004
Figure 5. Nonlinear static analysis of the bolted joint, (a) displacements, and (b) contact status.
Applsci 11 05613 g005
Figure 6. Excited bending modes, (a) two-beam joint (472 Hz), (b) one monolithic beam (854 Hz).
Applsci 11 05613 g006
Figure 7. The strain gauges glued on the bolt for the axial tension measurement.
Applsci 11 05613 g007
Figure 8. The bending vibration, (a) two-beam joint (472 Hz), (b) one monolithic beam (854 Hz).
Applsci 11 05613 g008
Figure 9. Setup to apply the tension preload through the torque wrench.
Applsci 11 05613 g009
Figure 10. Test results of the applied torque and corresponding bolt tension, (a) typical result and linear fitting, (b) repeated tests.
Applsci 11 05613 g010
Figure 11. Experimental system for the dynamical tests of the bolted joint.
Applsci 11 05613 g011
Figure 12. Verification of testing results, (a) the controlled force amplitude for the selected frequency range, (b) repeatability check of the FRF measurements.
Applsci 11 05613 g012
Figure 13. Comparisons of the FRF responses between two beams joint and one monolithic beam.
Applsci 11 05613 g013
Figure 14. Experimental FRFs influenced by the excitation, (a) two-beam joint, (b) one monolithic beam.
Applsci 11 05613 g014
Figure 15. Modal damping ratios for different excitation force amplitudes (bolt tension = 5 kN).
Applsci 11 05613 g015
Figure 16. Experimental FRFs influenced by the bolt tension, (a) two-beam joint, (b) one monolithic beam.
Applsci 11 05613 g016
Figure 17. Contact pressure of interfaces under, (a) small bolt tension (1 kN), (b) large bolt tension (7 kN).
Applsci 11 05613 g017
Figure 18. FRF peak point under various condition, (a) two-beam joint, (b) one monolithic beam.
Applsci 11 05613 g018
Figure 19. Characteristics of the FRF amplitudes versus the excitation force, (a) two-beam joint, (b) one monolithic beam.
Applsci 11 05613 g019
Figure 20. Influence of the excitation force on the identified modal damping ratio, (a) two-beam joint, (b) one monolithic beam.
Applsci 11 05613 g020
Figure 21. FRF amplitudes versus the ratio of ‘Bolt tension/Excitation’, (a) two-beam joint, (b) one monolithic beam.
Applsci 11 05613 g021
Figure 22. Contact interfaces between the bolt head/nut and beams, (a) larger interfaces (hole diameter 18 mm), (b) smaller interfaces (hole diameter 19 mm).
Applsci 11 05613 g022
Figure 23. Results for different hole size, (a) FRFs curves, (b) modal damping ratio.
Applsci 11 05613 g023
Figure 24. FRFs of bolted joints with small interfaces, influence of (a) excitation force, (b) bolt tension.
Applsci 11 05613 g024
Table 1. Bolt geometrical parameters.
ParameterDescriptionsValueUnit
Pthe pitch1.95~2.05mm
d2pitch diameter of bolt 14.95~15.05mm
doutnut outer diameter22.95~20.55mm
dinnut inner diameter17.95~18.05mm
μththread friction coefficient0.14~0.25 [33]
μbscrew head friction coefficient0.19~0.25 [33]
Publisher’s Note: MDPI stays neutral with regard to jurisdictional claims in published maps and institutional affiliations.