Article

Study of Different Crystal Habits of Aprepitant: Dissolution and Material Attributes

1
Maratha Vidya Prasarak Samaj’s College of Pharmacy, Nashik 422002, India
2
Department of Pharmaceutical Engineering and Technology, Indian Institute of Technology (BHU), Varanasi 221005, India
3
Wits Advanced Drug Delivery Platform Research Unit, Department of Pharmacy and Pharmacology, School of Therapeutic Sciences, Faculty of Health Sciences, University of the Witwatersrand, Johannesburg 2193, South Africa
4
Department of Pharmaceutics, National Institute of Pharmaceutical Education and Research (NIPER), S.A.S. Nagar 160062, India
*
Author to whom correspondence should be addressed.
Appl. Sci. 2021, 11(12), 5604; https://doi.org/10.3390/app11125604
Submission received: 11 April 2021 / Revised: 4 June 2021 / Accepted: 8 June 2021 / Published: 17 June 2021

Abstract

:

Featured Application

The results of this study can be used for recrystallization and selection of suitable polymorph and crystal habit for product development, improving material attributes, and pharmaceutical processability.

Abstract

In the present study, aprepitant (APT) was selected to find its suitable crystal habit, which can improve its existing poor dissolution and manufacturing processability. Solvents were screened out for solubility analysis of APT and further crystal habit modification. Solid-state characterization studies like powder X-ray diffraction (PXRD), differential scanning calorimetry (DSC), thermogravimetric analysis (TGA), and Fourier infrared spectroscopy (FTIR) distinguished that tabular crystal habit was generated from acetone (APT-AC) and long tabular crystal habit was generated from ethyl acetate (APT-EA). Kawakita analysis and powder flow property studies showed that APT-EA is cohesive, has poor flow property and low bulk density compared to APT-AC (p < 0.05). Heckel plots reflected that APT-EA shows higher fragmentation and particle rearrangement during the initial stages as indicated by the higher intercept values. Higher slopes in APT-EA and APT-AC confirmed better plasticity but lower yield pressure in APT-AC proved good plastic deformation compared to APT-EA (p < 0.05). The dissolution profile of the APT-EA was found to be better than that of APT-AC. Overall, it can be concluded that APT-AC crystal habit has a better flow rate, tensile strength, and plasticity whereas APT-EA has better dissolution.

1. Introduction

Polymorphism is the ability of a molecule to pack in different crystal lattices whereas crystal habit is the external appearance of a compound [1,2]. Crystal habit modification and polymorphism have an important role in the formulation and development of poorly water-soluble drugs as it improves dissolution and other material properties which in turn improve pharmaceutical and biopharmaceutical performance [1,3,4]. Crystal habit affects material attributes such as flow property, packing, compressibility, dissolution [5,6]. Material properties of active pharmaceutical ingredient (API) take an important place in the high-dose formulations where API occupies a large volume. Issues of improper flow, blend uniformity, non-uniform filling of capsules on capsule filling machine, results in variation in content uniformity and dissolution. In this scenario, improvement of material attributes of API itself such as bulk density, flowability is of utmost importance [7]. The size and shape of API crystal habits are directly linked to flow, cohesiveness, bulk density, tensile strength, and compactibility of API powder [8]. Crystals with high aspect ratios such as needle, bar, tabular are notorious for bad powder flow properties [9]. Bad powder flow creates a non-uniform filling of the die on the compression machine and capsule filling. Formulation choices such as direct compression and capsule filling are preferred over others due to the simple and time-saving process but still require a good flow of blend [5,10]. The purpose of the granulation step during tablet manufacturing is to improve the flow of material. Direct compression avoids the granulation step and the use of organic solvents, helping to design the environment-friendly manufacturing process at a larger scale. To eliminate granulation step flow properties of API need to be improved. Suitable crystal habit for the API can be evaluated among the possible crystal habits for improved flow and other material attributes. Approaches such as solvent recrystallization, co-crystallization are used to develop a suitable crystal habit to improve the processing of powder blend at a large scale.
The nature of the solvent and its saturation level impact the growth rate of crystal facets [11]. Solvent nature alters the wettability of crystal surface which impacts dissolution [12]. Internalization of functional groups which are less attracted toward a solvent occurs during crystallization [13]. Ammonia solution used for recrystallization of sulphadiazine significantly reduced dissolution rate [14]. Dissolution of plate shape crystals of ibuprofen recrystallized using acetone and ethanol was higher than that of rod-shaped crystals recrystallized from propylene glycol and 2-propanol [15]. The symmetry of the crystals impacts dissolution, where symmetric crystals due to equal exposure of all surfaces found to give faster dissolution [16]. APT is an off-white crystalline solid which is practically insoluble in water with oral bioavailability of 60–65% [17]. APT is a selective high-affinity antagonist of neurokinin 1 (NK1) receptors and is indicated for the prevention of acute and delayed nausea related to emetogenic cancer chemotherapy and prevention of postoperative nausea and vomiting [17,18]. APT exists in the crystalline form I and form II [19]. Braun et al. [18] prepared single crystals of both polymorphic forms I and II and studied their spectral and thermochemical differences, crystal packing modes, and molecular interactions using Hirshfeld surface analysis. Oral nanocrystalline powder capsule formulation is available in the market but no research has been done on crystal habits of APT and their impact on pharmaceutical properties such as flow, bulk density, cohesiveness, tensile strength, compactibility, and dissolution. In current research work, we found that APT after recrystallization gives tabular and long tabular crystal habits. Both habits were separated with recrystallization experiments and their impact on above mentioned pharmaceutical properties was evaluated and compared.

2. Materials and Methods

2.1. Materials

APT (5-{2-[1-(3,5-bis(trifluoromethyl)phenyl) ethoxy]3-(4-fluorophenyl) morpholin-4-ylmethyl}-2,4-dihydro-1,2,4triazol-3-one) (purity 99.8%) was received as a gift sample from Glenmark pharmaceuticals limited, Sinnar, India. HPLC grade methanol, acetone, acetonitrile, dichloromethane (DCM), chloroform, tert-butyl methyl ether, ethanol, N, N-dimethylformamide (DMF), dimethylsulphoxide (DMSO), Tween 20, and ethyl acetate were purchased from Merck Limited, Mumbai, India. Sodium lauryl sulfate (SLS), orthophosphoric acid used were of analytical grade and purchased from SDFCL Ltd., Mumbai, India.

2.2. Solvent Screening and Solubility Determination

The solubility of the APT was checked in organic solvents mentioned in the materials section. A total of 100 mg drug was taken in a screw-capped glass vial and each solvent was added in increment of 100 µL to the vial. After every increment, the vial was vortexed using a vortex mixer (IKA, Staufen, Germany) for 5 min and checked for visual clarity. The amount of solvent required to get a clear solution was calculated as the saturation point.

2.3. Recrystallization Experiments

Recrystallization was carried out by slow evaporation of the solution in undersaturated conditions. Recrystallization was done in the porcelain cups to get better crystal growth on the porcelain surfaces. APT was dissolved using a magnetic stirrer (IKA, Staufen, Germany) in each solvent with an amount of solvent well above its saturation solubility, which was calculated in solvent screening. The solution was filtered through a 0.45-µ filter paper. This solution was covered with perforated aluminum foil and allowed to evaporate slowly at a temperature range 2–8 °C (5 °C ± 3 °C). A newtronic cooling chamber (Newtronic Lifecare Equipment, Mumbai, India) was used for the process. The purpose of carrying out evaporation at 5 °C ± 3 °C was to slow down the solvent evaporation rate. After complete evaporation, crystals were harvested carefully and dried at 40 °C for 48 h in a vacuum oven to remove any solvent trace and stored in a desiccator until further characterization.

2.4. Optical Microscopy

An optical microscope (Nikon Instruments, Tokyo, Japan) was used to observe the obtained crystals during solvent screening. Around 200 mg of crystalline material was taken in 25 mL purified water. About 2–3 drops of tween 20 were added and sonicated for 1 min in an ultrasonic bath sonicator (PCI Analytics, Thane, India). A drop of the dispersion prepared was poured on a clean microscopic slide and crystals were examined at a magnification of 10× and 40×.

2.5. Scanning Electron Microscopy and Morphology Generation

SEM S 3400 (Hitachi Ltd., Tokyo, Japan) was used to study habit modification. SEM was operated at 25 kV excitation voltage. Crystals were layered on double-sided adhesive tape over sample stubs and sputter-coated with gold using ion sputter (E-1010, Hitachi Ltd., Tokyo, Japan). Morphology was generated using freely available KrystalShaper software version 1.5.0 (JCrystalSoft, 2018, California, USA). The generated morphology provided different facets.

2.6. Differential Scanning Calorimetry

DSC thermograms were generated using DSC Q200 V24.11 Build 124 instrument (TA Instruments, New Castle, DE, USA) with refrigerated system and universal analysis 2000 software (TA Instruments, New Castle, DE, USA) to identify any polymorphic transformation, melting point, and heat of fusion in recrystallized samples. The sample cell was purged with dry nitrogen at a flow rate of 50 mL/min. About 1–5 mg of a sample was taken in an aluminum crimped pan and was scanned at a heating range of 10 °C/min over a temperature range of 0–250 °C. The instrument was calibrated with high purity indium for temperature and heat flow.

2.7. Thermogravimetric Analysis

TGA was carried out to confirm the absence of any solvates using Mettler Toledo 851e TGA/SDTA (Mettler Toledo, Greifensee, Switzerland) operating with Star software, version Solaris 2.5.1 (Mettler Toledo, Greifensee, Switzerland). Around 5–10 mg sample was taken in an alumina crucible and heated at a rate of 10 °C/min over a temperature range of 0–300 °C with nitrogen purge 50 mL/min.

2.8. Powder X-ray Diffraction

PXRD was carried out using Bruker’s D8 Advance X-ray diffractometer (Bruker, AXS, GmbH, Karlsruhe, Germany) using Cu-Kα radiation (λ = 1.54 Ǻ) at 35 kV, 30 mA passing through a nickel filter. In a continuous scan, mode data were collected with a step size of 0.01° and dwell time of 1 s over an angular range of 10° to 40° 2θ. An even layer of around 300 mg of powder was created in a poly-methyl methacrylate (PMMA) holder and samples were analyzed. Simulated PXRD was calculated using a free version of Mercury 2020.3.0, Cambridge Crystallographic Data Centre (CCDC), Cambridge, United Kingdom. Crystallographic Information File (CIF) 117932 and 687301 were freely provided by CCDC.

2.9. Fourier Transform Infrared Spectroscopy

FTIR analysis was carried out. Thin and transparent KBr plates were made using a hydraulic press (Kimaya Engineers, Thane, India) and subjected to FTIR analysis using FTIR Spectrometer (Perkin Elmer Inc., Waltham, MA, USA). All spectra were recorded in transmission mode, from 4000 to 650 cm−1, with 2 cm−1 spectral resolution and scanned 32 times. The spectra were analyzed using spectrum version 3.02.01 software (Perkin Elmer Inc., Waltham, MA, USA).

2.10. Particle Size Distribution and Surface Area

Particle size distribution (PSD) was carried out using Malvern master sizer 2000S (Malvern Instruments Ltd., Worcestershire, UK). The analysis was carried out in a size range of 0.02 µm to 2000 µm using single-lens detection and dual-wavelength measurement. Around 200 mg of crystalline material was taken in 25 mL purified water. About 2–3 drops of tween 20 were added and sonicated for 1 min in an ultrasonic bath sonicator (PCI Analytics, Thane, India). The sample was transferred into the master sizer tank until obscuration level was achieved around 15% in purified water as a medium. d10 (10% of the distribution had a particle size smaller than this value), d50 (50% of the distribution had a particle size smaller than this value), and d90 (90% of the distribution had a particle size smaller than this value), and specific surface area were calculated for the obtained crystal.

2.11. Aspect Ratio Determination

A drop of the dispersion prepared in step 2.10 for PSD analysis was poured on a clean microscopic slide. Three replicates of 10 random fields of views on the slide were examined using 40 X magnification under the Olympus CX21 microscope (Olympus Corporation, Tokyo, Japan). The aspect ratio of a length along axis a to the width along axis b of a crystal was measured using Tucsen microscopic camera (Fuzhou Tucsen Photonics. Co., Ltd., Fujian, China) and ipvPclass software from ImageProvision (Imageprovision Technology Pvt Ltd., Pune, India).

2.12. Kawakita Plots Analysis

Flowability was assessed by Kawakita plots. About 10–20 g of powder was taken into a 100 mL glass measuring cylinder. Heap formed by powder was leveled by spatula and bulk volume “V0” was accurately measured. Tapping was carried out mechanically and change in volume “VN” was measured after the “N” number of taps. Crystal habit behavior was compared using numerical constants obtained from Kawakita plots [20]. Kawakita parameters used in the study are given by Equation (1).
N C = N a + 1 a b
a” and “b” are constants where “a” is the degree of volume reduction at the limit of tapping termed as compactibility. “1/b” is termed cohesiveness. “C” is the degree of volume reduction and calculated from initial volume “V0” and tapped volume “VN” by Equation (2).
C = ( V 0 V N ) V 0
Values of the constants “a” and “1/b” are obtained from a plot of “N/C” vs. the number of taps “N” (10, 20, 30 up to 300) where “1/a” is the slope and “1/ab” is the intercept.

2.13. Bulk Density and Tapped Density

US Pharmacopoeial methods (USP Chapter <616>) [21] were used to study the bulk density and tapped density. About 20 g sample was passed through sieve number 18 and filled in a 100 mL graduated measuring cylinder. For poured bulk density, the cylinder was tilted and filled slowly and powder was leveled using a spatula. For tapped density, the tapped volume was measured with the Electrolab ETB 1020 tap density tester (Electrolab India Pvt. Ltd., Mumbai, India) after tapping in increments of 500, 750, and 1250 with 250 drops per minute.

2.14. Compressibility Index and Hausner’s Ratio

Cars compressibility index (CI) and Hausner’s ratio (HR) were calculated from bulk density and tapped density to get the measure of the flow property and compressibility according to Equations (3) and (4) [21].
C I = ρ t ρ b ρ t × 100
H R = ρ t ρ b
where ρt is the tapped density and ρb is the bulk density.

2.15. Heckel Plot Analysis

Hydraulic pellet press (Kimaya Engineers, Thane, India) was used to prepare compacts of API and both crystal habits [22]. Compression load was used from 10 kg/cm2 to 90 kg/cm2. About 10-mm die and flat punches were lubricated with 2% magnesium stearate dispersion in ethanol. Ten compacts were made through linearly increasing compaction pressure. Compacts were stored in a desiccator for 24 h before evaluation. The thickness, diameter, and weight uniformity of the compacts were determined. Relative density (PR) was determined using the ratio of the apparent density (PA) of compacts and true density (PT) of powder. Linear regression analysis using the least square method was carried out over a compression range between 10 kg/cm2 and 90 kg/cm2 and Heckel plots were obtained to study the compaction characteristics using the following Equations (5) and (6) [23].
In 1 1 ρ R = K P + A
ρ R = ρ A ρ T
The yield pressure (Py) of the powder is the reciprocal of the “K” (slope of the linear portion). “P” is the applied pressure. The yield pressure is inversely related to the ability of the material to deform plastically under pressure and “A” is a function of the original compact volume [22].

2.16. Compactibility Assessment

Compactibility assessment was carried out with compacts prepared for Heckel analysis [24]. The force required to break the compacts diametrically was determined using the Erweka TBH 125 hardness tester (Erweka GmbH, Langen, Germany). The tensile strength (σx) of the compacts was calculated with the following Equation (7).
σ x = 2 x π d t
x” is the hardness in kg/cm2, “d” is the diameter, and “t” is the thickness in mm.

2.17. Dissolution Study

APT USP test 3 method was used for dissolution [25]. SLS 2.2% in 900 mL distilled water was used as the dissolution medium at temperature 37 ± 0.5 °C. USP type 2 apparatus (Electrolab India Pvt. Ltd., Mumbai, India) was used at 100 rpm for 30 min. Total 125 mg drug was filled in a hard gelatin capsule and the capsule was packed in a sinker and placed in a dissolution vessel containing 900 mL dissolution medium. About 10 mL sample was withdrawn from the central portion of the vessel at each 10, 15, 20, 30, and 45 min time point. The sample was filtered through a 0.45-µm PVDF (Polyvinylidene fluoride) filter (Merck KGaA, Darmstadt, Germany). The dissolution medium was replenished with the same 10-mL medium at every time interval. Chromatographic system Shimadzu LC 2010 C (Shimadzu, Kyoto, Japan) was used with LC mode, UV detector with 210 nm wavelength. Dilute phosphoric acid and acetonitrile (52:48) were used as the mobile phase. A reverse-phase column Waters Symmetry C8 (Waters India Private Limited, Mumbai, India) was used with dimensions 4.6 mm × 25 cm and 5 µ particle size. The column temperature used was 35 °C. The flow rate was used 1.5 mL/min with an injection volume of 20 µL and a run time of 15 min.

3. Results and Discussion

3.1. Solubility Study

APT was found highly soluble in DMSO, DMF, methanol, acetone, ethyl acetate, and acetonitrile. DMSO and DMF were not selected due to the high boiling point and viscosity. Solubility results are presented in Table 1. From the selected solvent recrystallization, experiments were carried out. Out of these acetone and ethyl acetate were found to give two different crystal habits. Other solvents resulted in a mixture of crystal habits or irregular plates. Hence, acetone and ethyl acetate were selected for further experiments.

3.2. Recrystallization Experiments

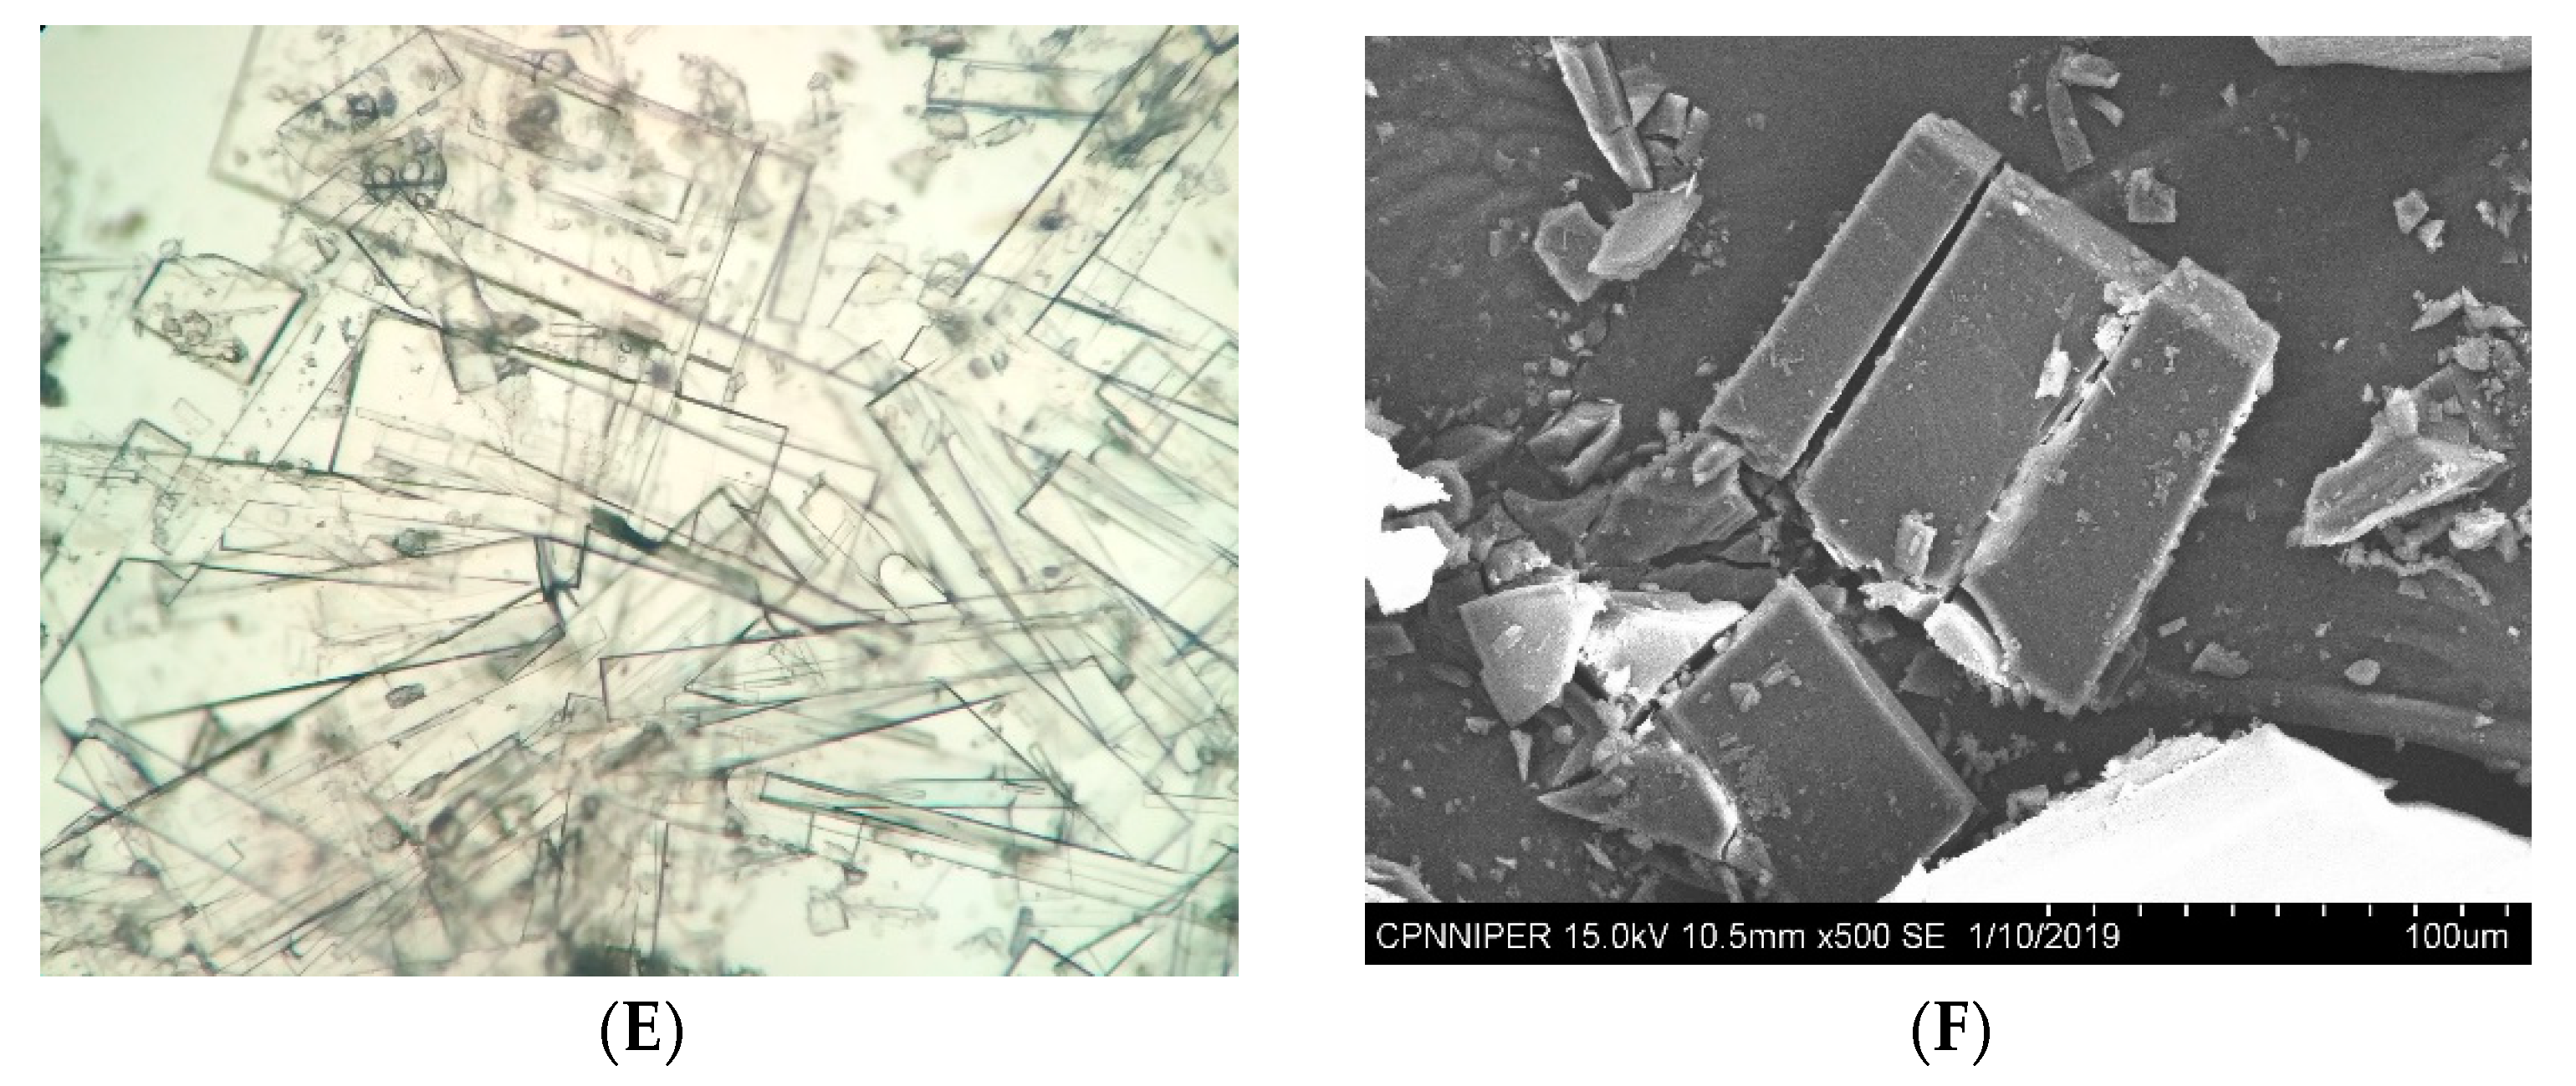
The slow evaporation method was used with API dissolved in organic solvents in undersaturated conditions. Crystals were observed under a compound microscope and SEM. As shown in Figure 1, APT used for recrystallization had irregular plate-shaped crystals. Acetone at 5 ± 3 °C gave tabular crystal habit. Ethyl acetate at 5 ± 3 °C generated a long tabular crystal habit, as crystals are elongated on axis “a”. The habits were compared with the morphology generated using KrystalShaper (Supplementary Figure S1) which shows that the morphologically important crystal facets were (001), (00-1), (010), (010), (100), and (-100). The growth pattern of crystals in a solvent depends on the solvent’s polarity and molecular weight [9]. Interaction of properties of solvent with dissolved drug decides the direction in which the crystal will grow [26]. Solvent’s tendency depending on its polarity to interact with the hydrophobic or hydrophilic surface of the crystals leading to the development of different morphology has been discussed in the literature [27]. In the case of APT-AC, acetone interacted with APT in such a way that tabular crystals were generated with higher growth on axis a and b and limited growth on-axis c. In the case of APT-EA, ethyl acetate interacted with APT in such a way that long tabular crystals were generated with higher growth on axis a, limited growth on axis b, and least growth on axis c. This change in facets is further discussed in Section 3.5.

3.3. Differential Scanning Calorimetry

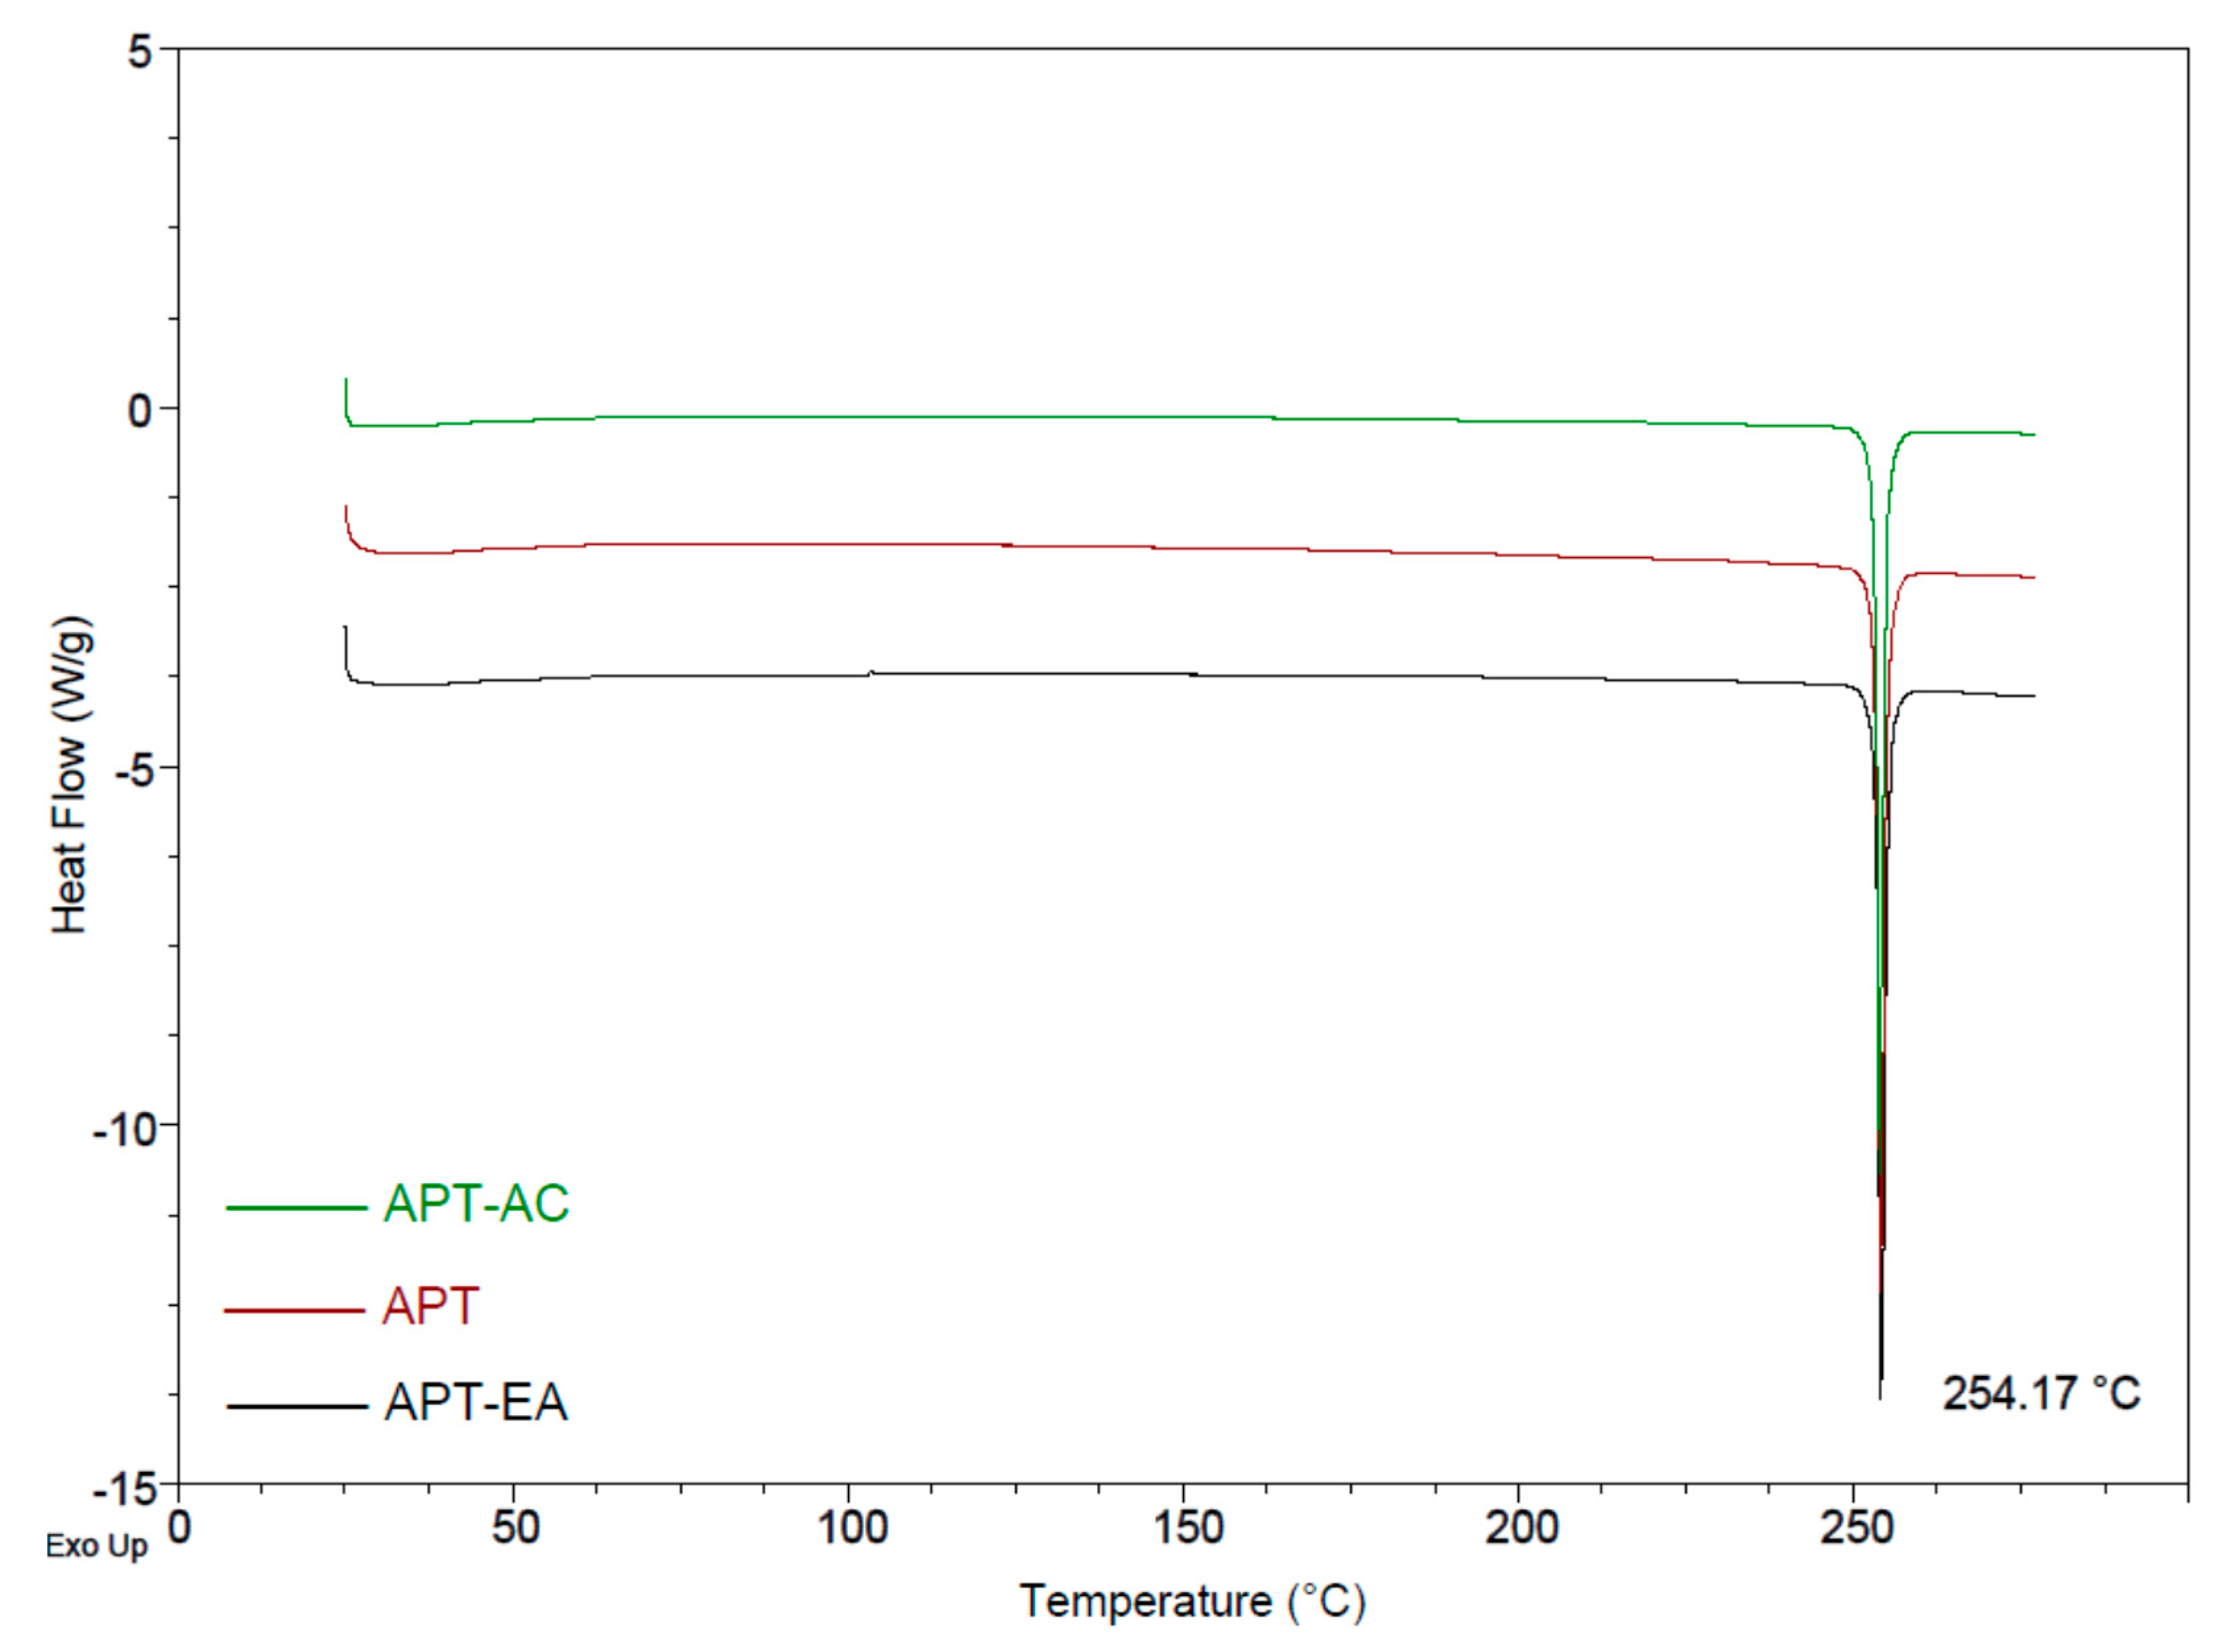
APT-AC gave a melting endotherm at a temperature of 254.10 °C, an extrapolated onset temperature of 246.55 °C, and an enthalpy of 100.8 J/g (Figure 2). APT-EA gave a melting endotherm at a temperature of 254.17 °C, an extrapolated onset temperature of 246.31 °C, and an enthalpy of 98.24 J/g. DSC thermograms of both crystal habits showed no differences in their thermal behavior.

3.4. Thermogravimetric Analysis

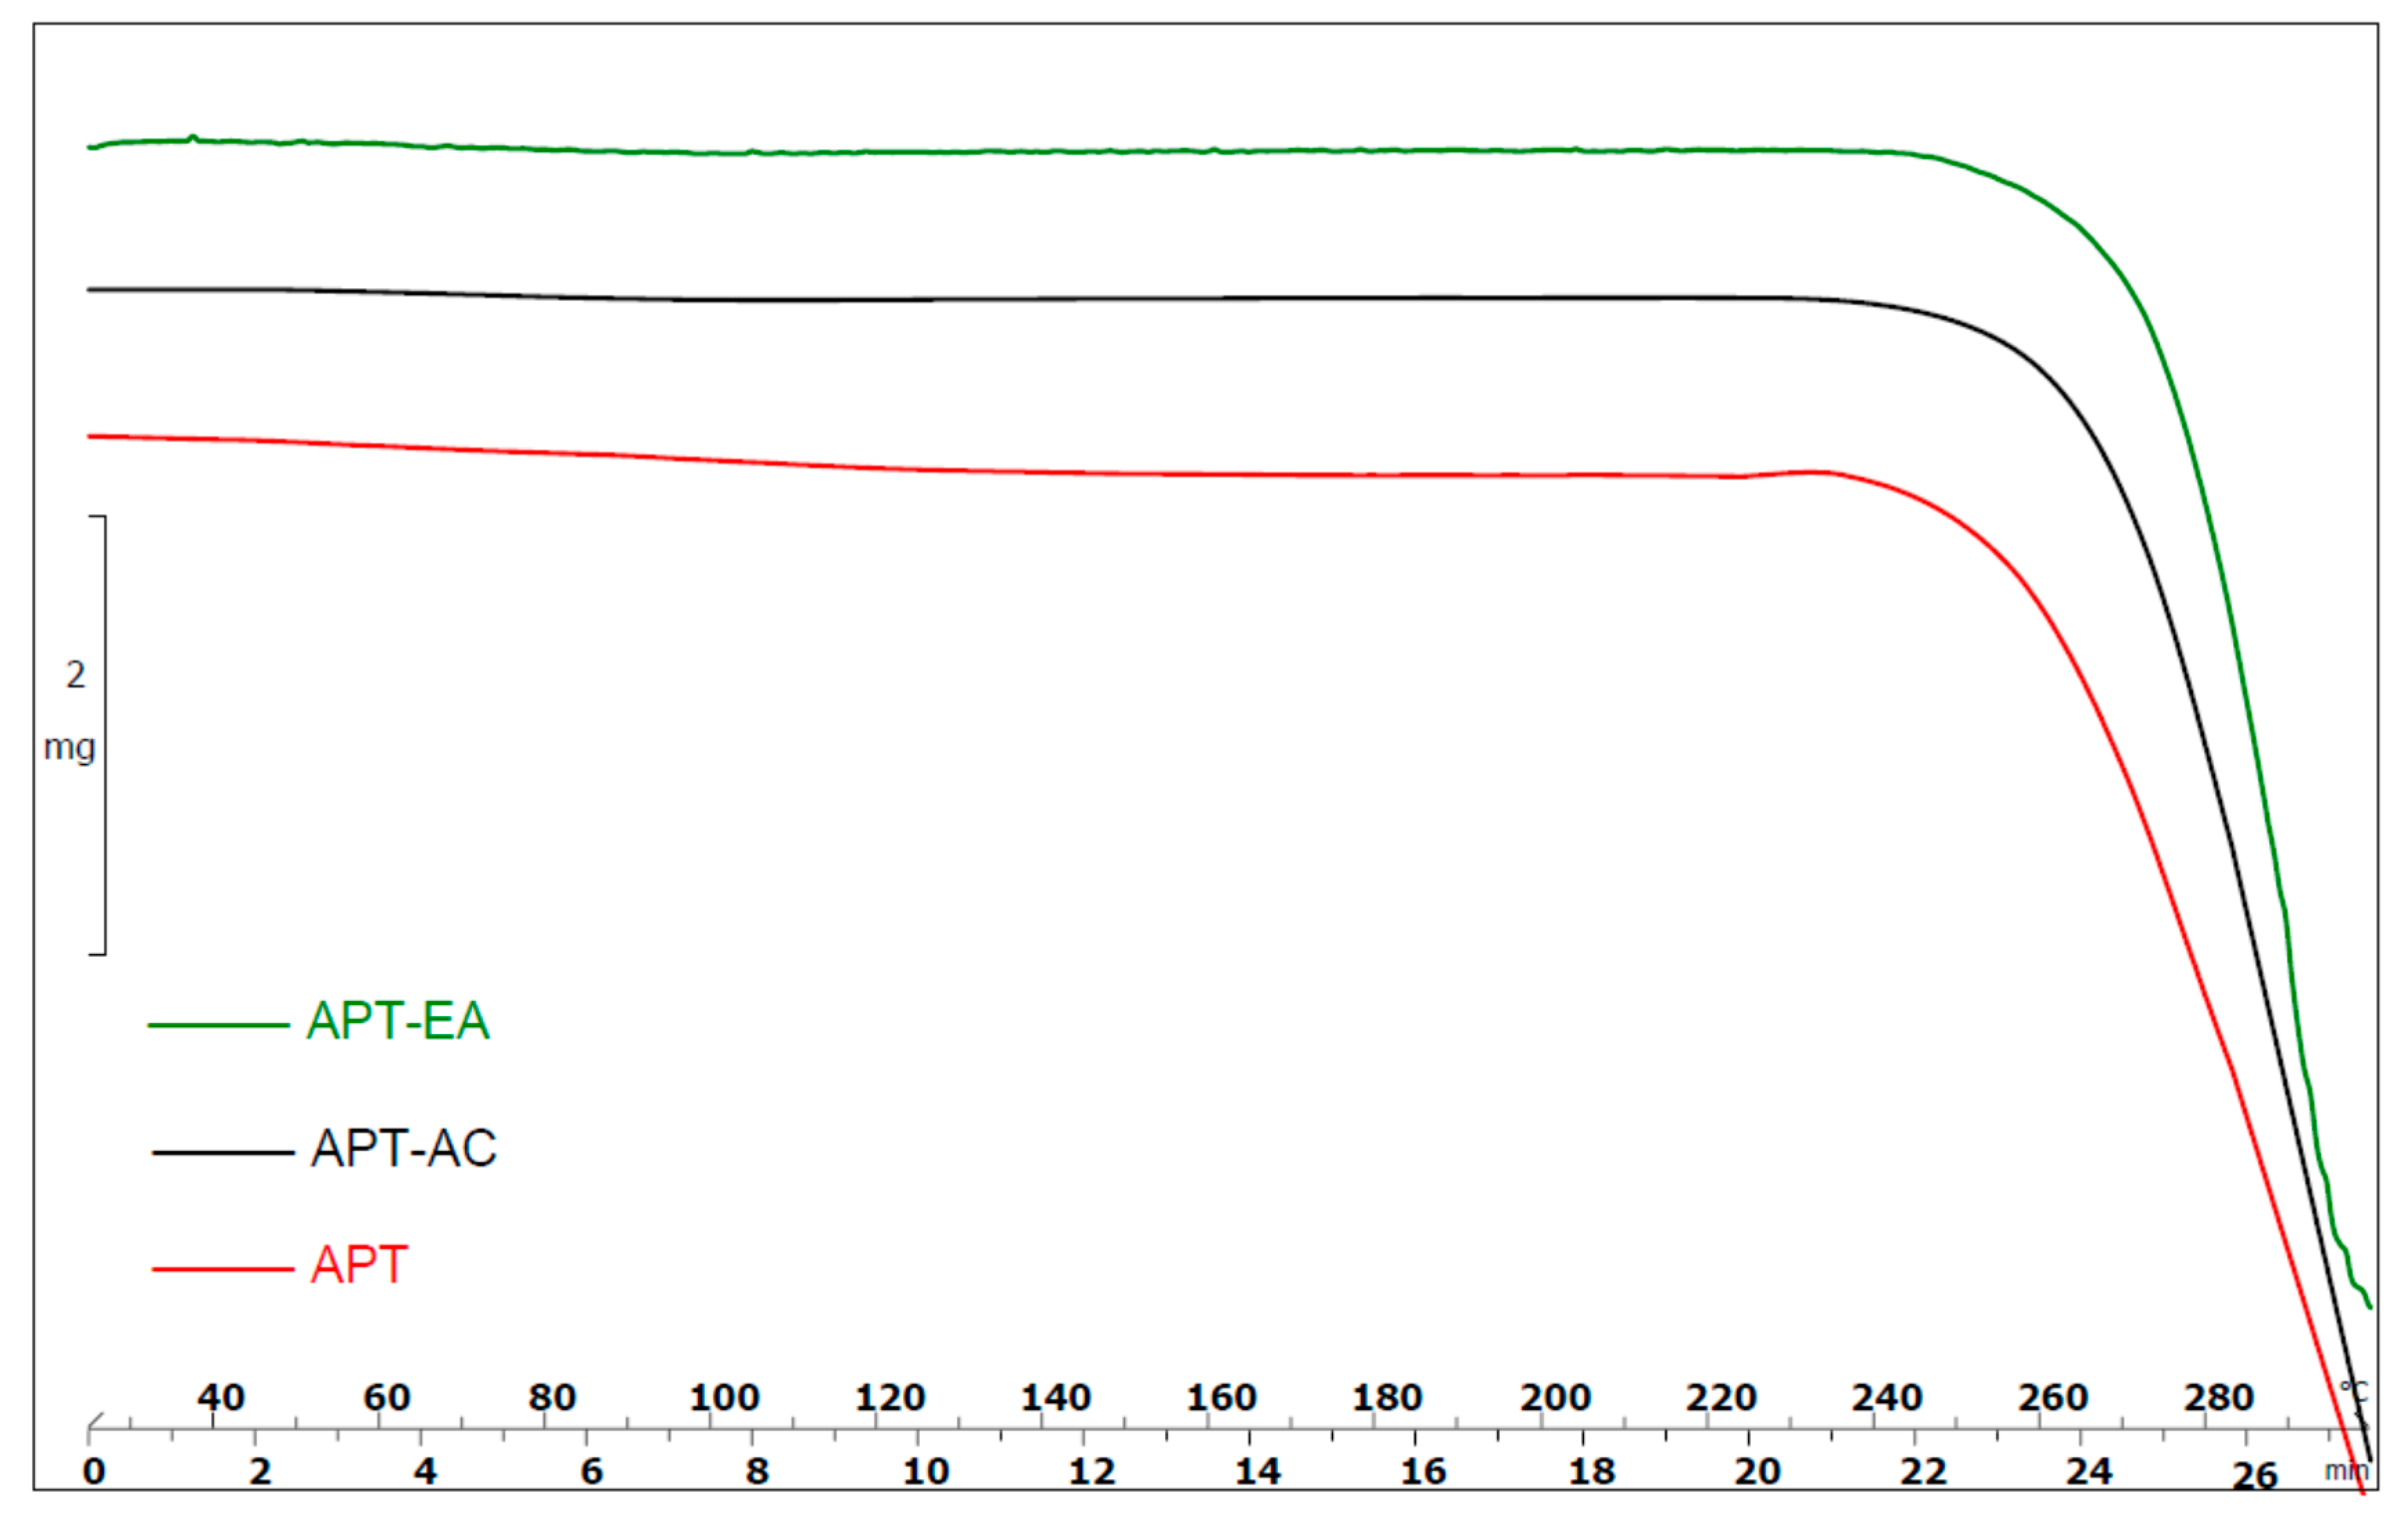
Thermogravimetric analysis was carried out to check the presence of hydrates or solvates after recrystallization. Both modified crystal habits showed a similar weight loss pattern to that of APT. TGA analysis of modified crystal habits in Figure 3 showed no weight loss in the temperature range up to 100 °C which proved that modified crystal habits were not hydrates or solvates.

3.5. Powder X-ray Diffraction

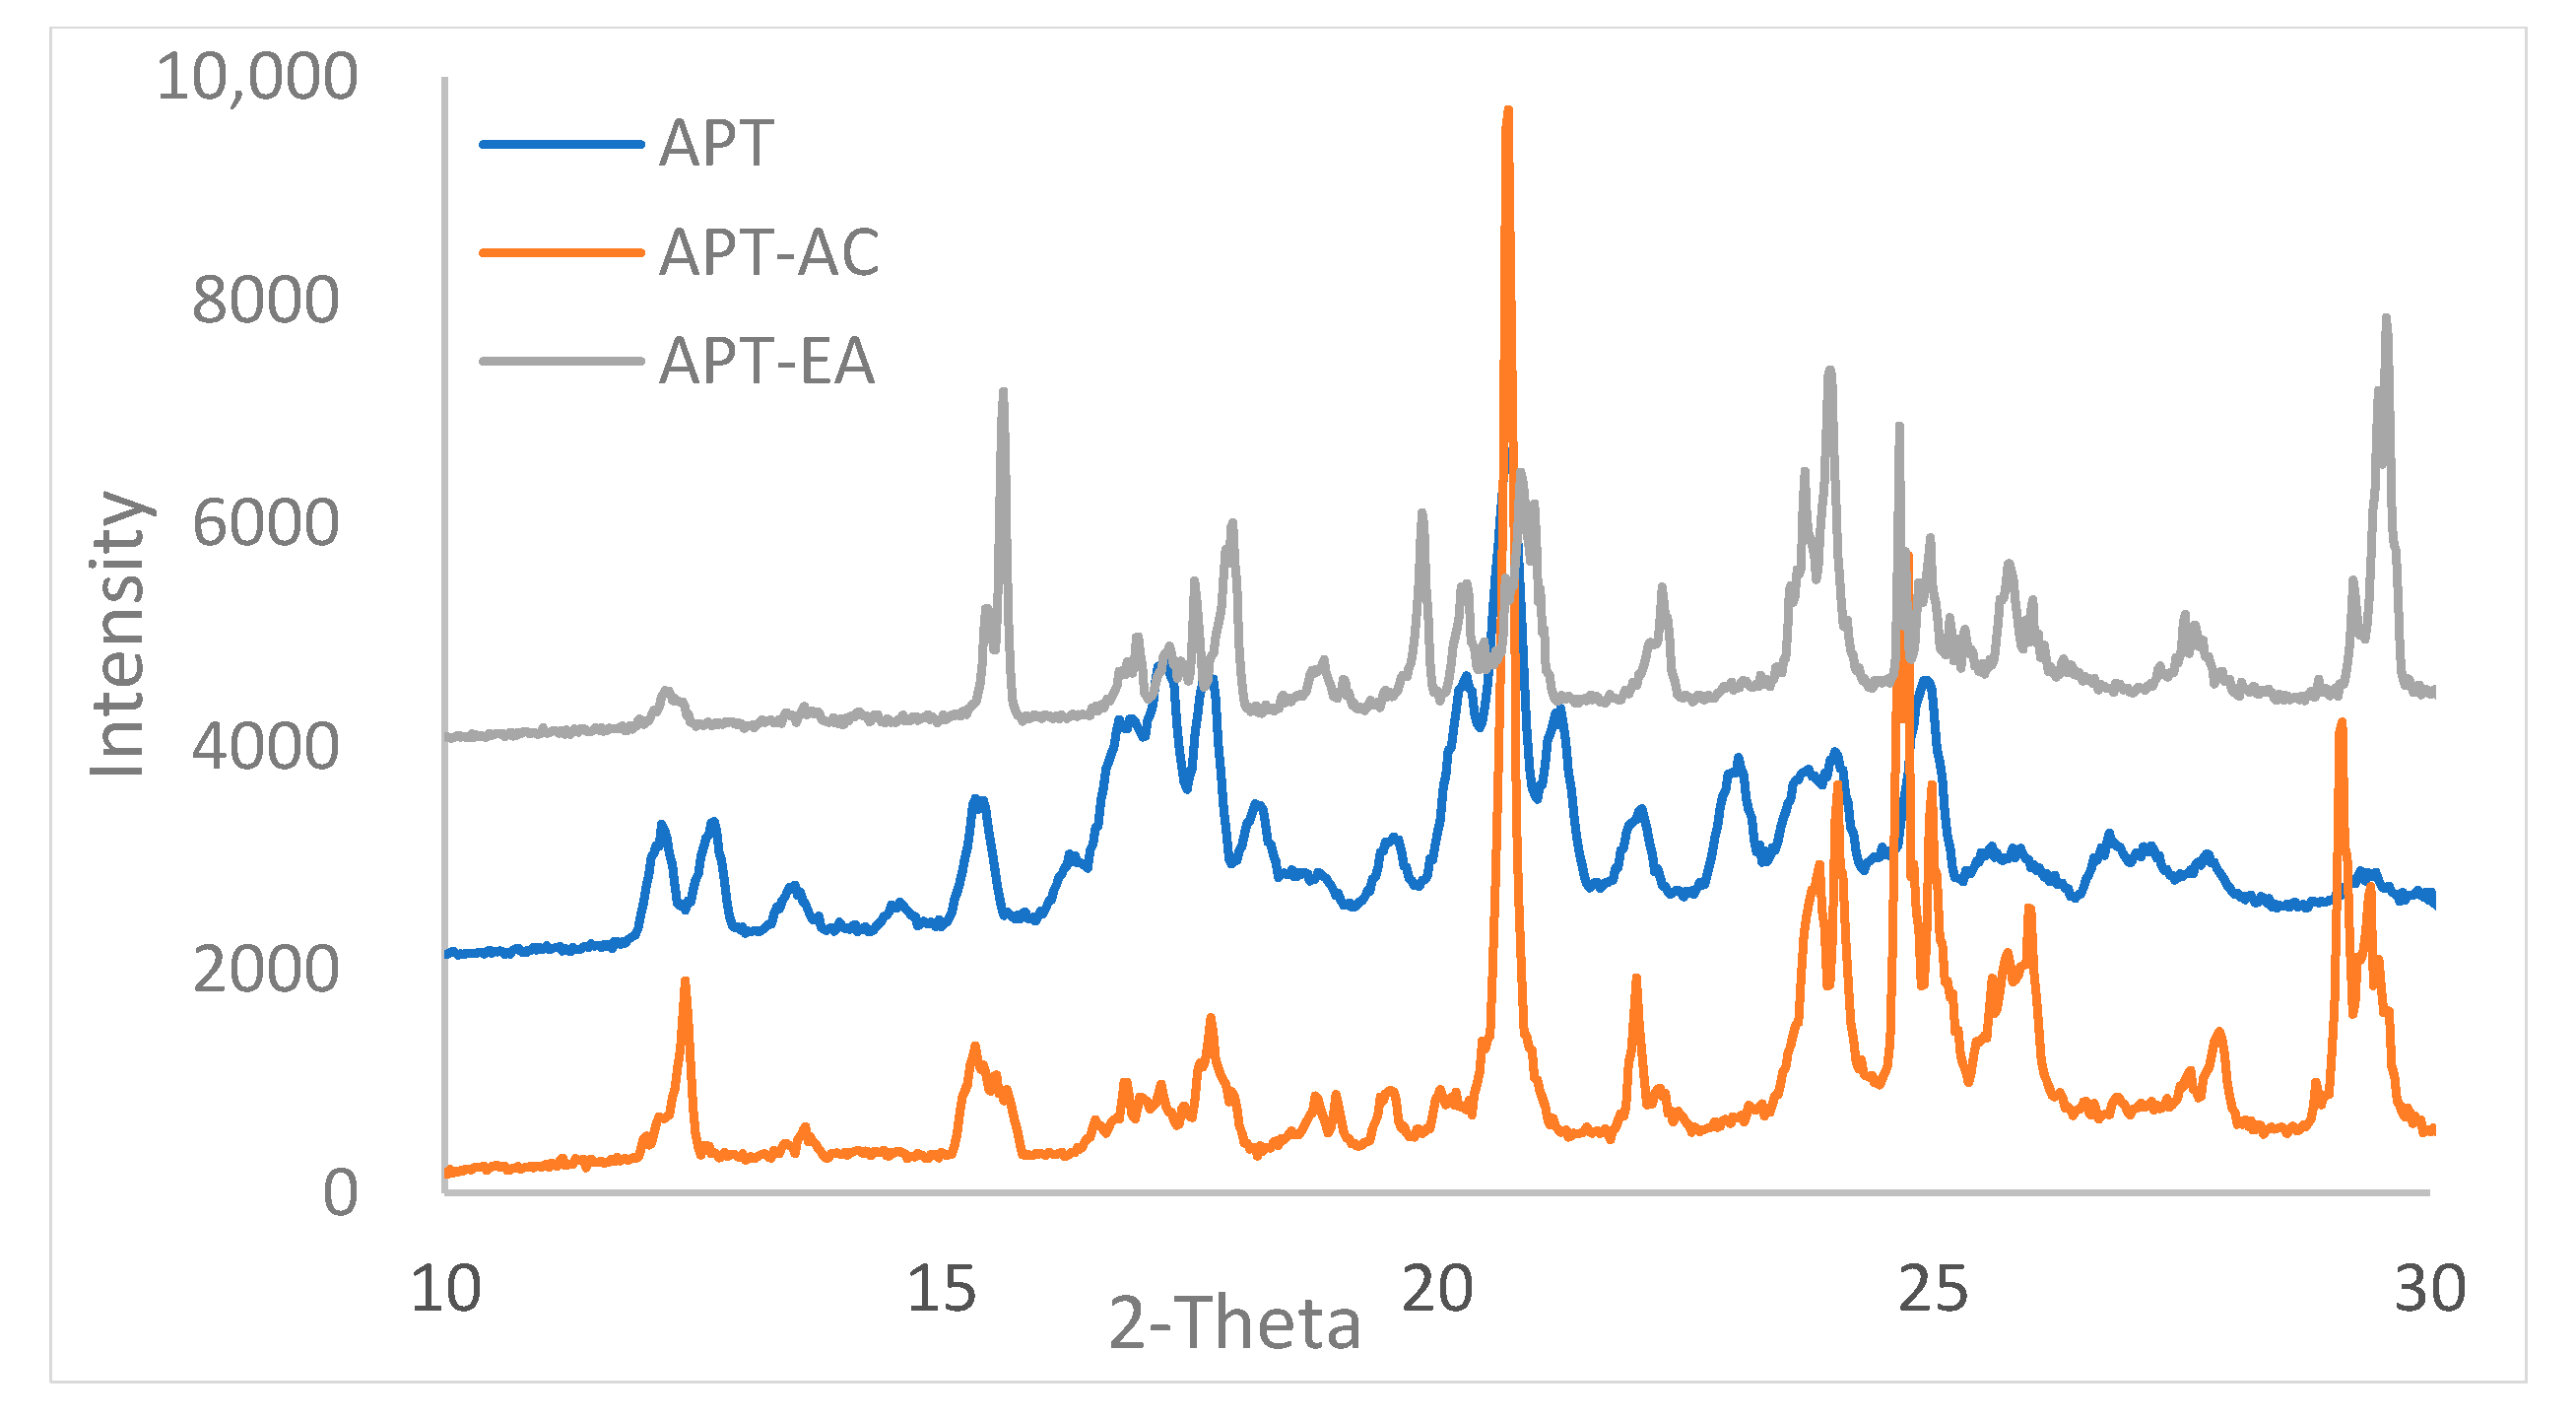
If the PXRD patterns of crystalline material are the same, then they have the same internal structures i.e., the same polymorph but when they have a different pattern or peak position then it means they have different internal structures i.e., different polymorph [28,29]. In the case of the same polymorphs and different crystal habits, peak positions are the same and peak intensities vary [9,28]. PXRD patterns of APT-AC and APT-EA in Figure 4 are similar to others that indicate that these are the same polymorphs (form I), however, the peaks are different from plain APT which is a mixture of form I and form II. US patent no 6096742 [19] also discussed these polymorphic forms of APT in detail. PXRD patterns of APT-AC and APT-EA match to that of form I with characteristic peaks at approximately 12.0, 15.3, 16.6, 17.0, 17.6, 19.4, 20.0, 21.9, 23.6, 23.8, and 24.8°. These conclusions are well supported by the simulated PXRD pattern provided in supplementary Figure S5. It was observed in simulated PXRD that the peak at 12° represents facet (1 0 0) which is more prominent in APT-AC. In the APT-EA, facet (0 0 1) and (0 1 0) are prominent due to higher growth on axis “a” which might be the reason for reduced relative intensity of peak at 12° which represents facet (1 0 0). This supports the crystal growth pattern discussed in Section 3.2. Hence it shows that given recrystallization methods can recrystallize form I separated from the mixture of form I and form II.

3.6. Fourier Transform Infrared Spectroscopy

FTIR patterns for given crystal habits are different in OH stretching patterns. FTIR of APT-AC reflects a deep trough at 3440.10 cm−1. FTIR of APT-EA reflects shallow trough at 3222 cm−1. Check supplementary info for IR spectra.

3.7. Particle Size Distribution

Modified crystal habits PSD mainly d 10, d 50, and d 90, surface area, and aspect ratio are tabulated in Table 2. APT-EA has a higher aspect ratio and surface area. APT-EA showed higher growth along with axis “a” and resulted in a higher aspect ratio (Table 2, Figure 1, and supplementary Figure S1). There is also a significant difference in particle size distribution in both habits which indicates robust inhibition of growth at some crystal faces while stimulus to growth at other faces for both tabular and long tabular habits [9]. This is discussed in detail in Section 3.2 and Section 3.5.

3.8. Flow Characterization

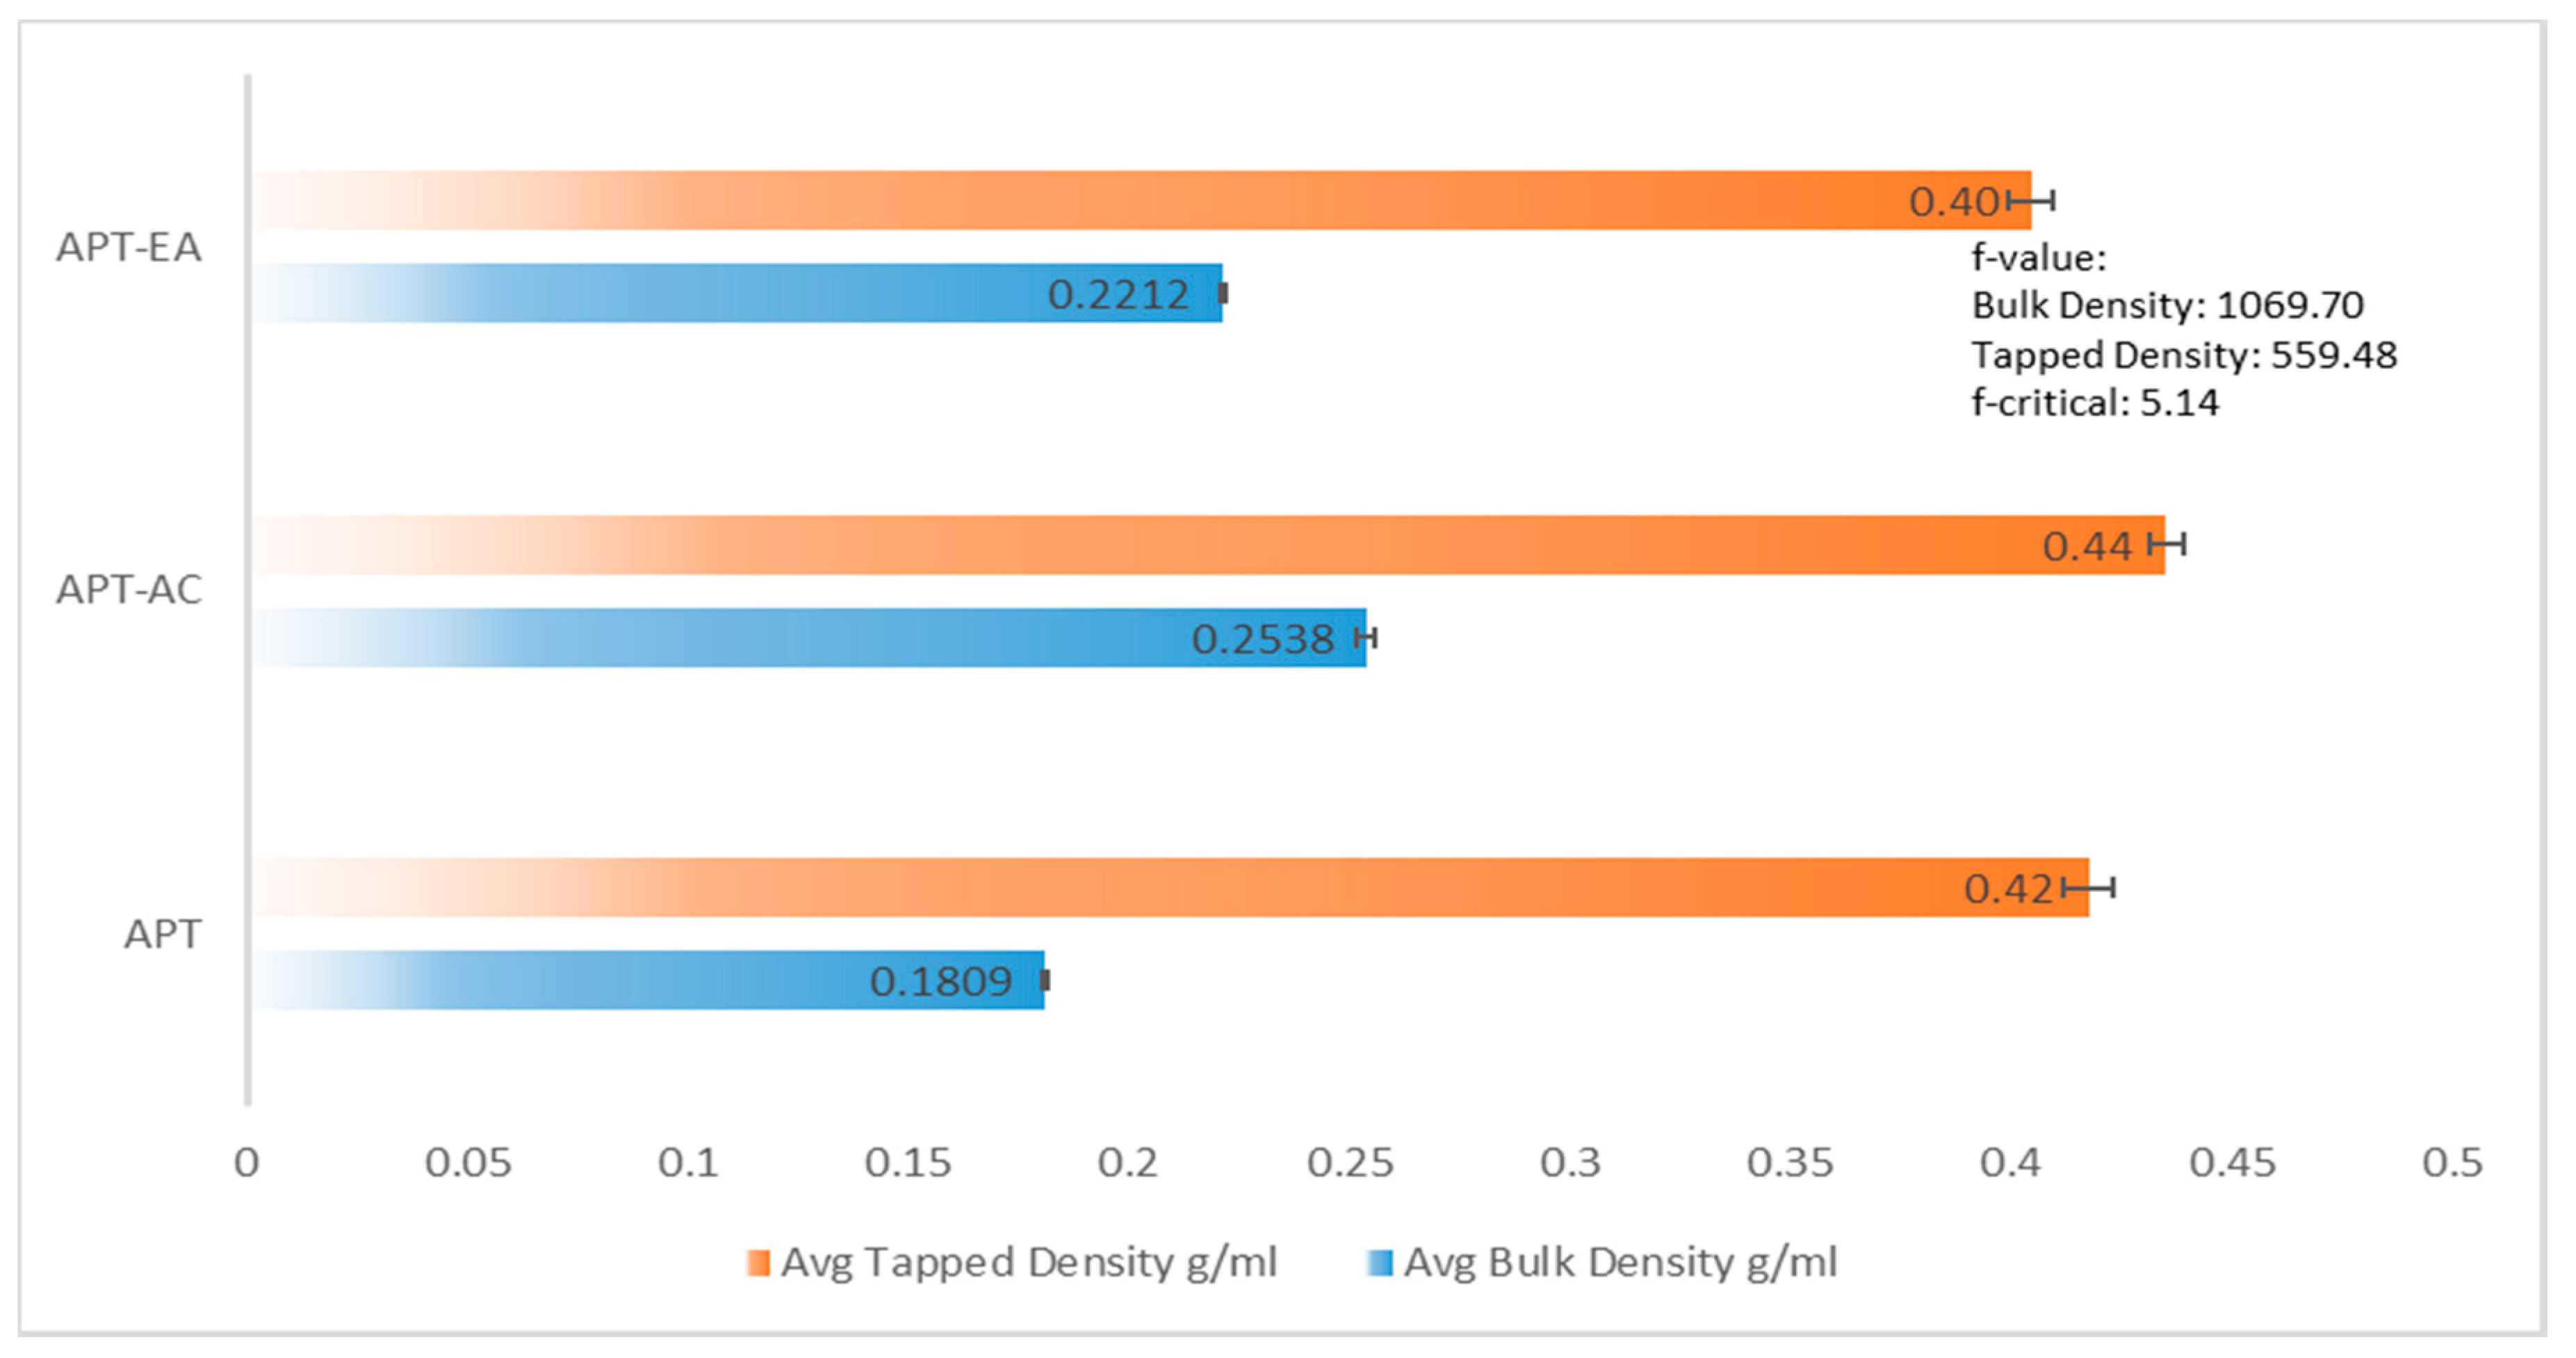
Bulk density, tapped density, Cars index, Housner’s ratio were determined for APT, APT-AC, and APT-EA. Results are presented below in Figure 5 and Figure 6.
APT-AC reflected higher bulk and tapped density than APT and APT-EA indicating better flow and compactibility (p < 0.05). The cohesive flow of APT and APT-EA could be attributed to the different packing geometry which resulted in different contact points and frictional forces between crystals [9]. Car’s index and Hausner’s ratio were found to be lower for APT-AC compared to APT-EA and APT, which reflected better flowability of APT-AC (p < 0.05). Considering all the values, it can be seen that that order for better flow property is as APT-AC > APT-EA > APT.

3.9. Kawakita Plots

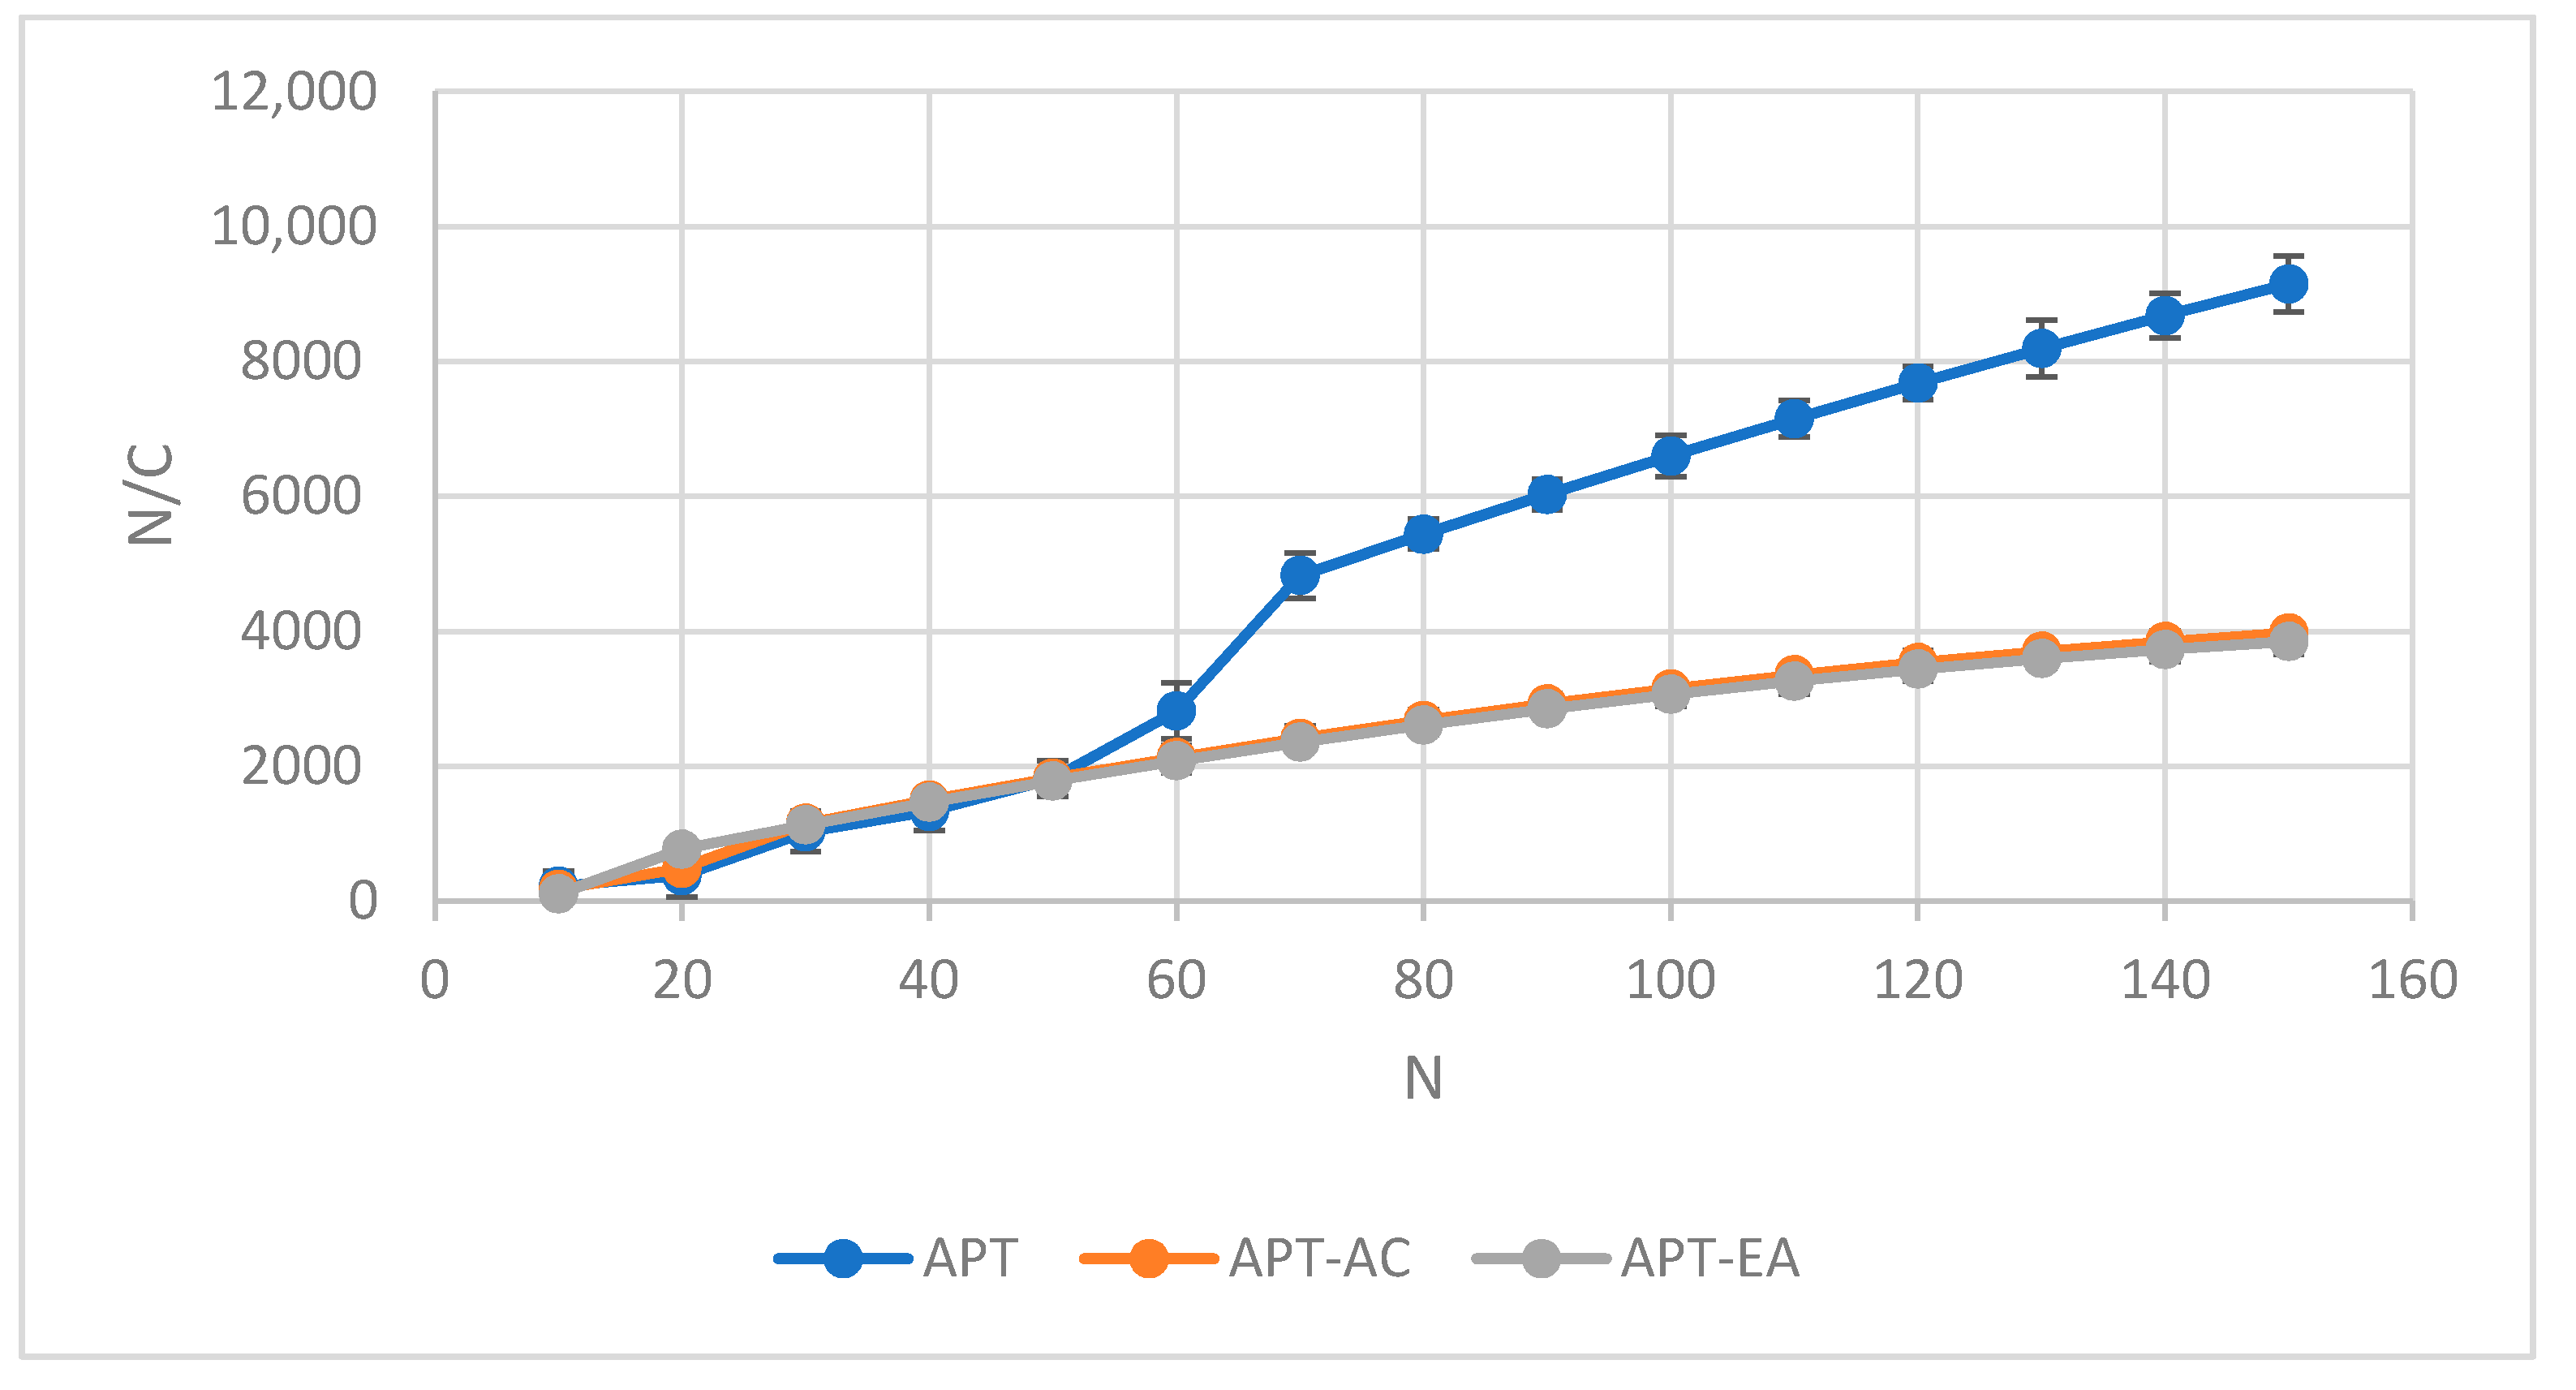
Plots of “N/C” vs. “N” in Figure 7 (where “N” is the number of taps and “C” is the degree of volume reduction) for APT, APT-AC, and APT-EA resulted in a linear relationship. The constant “a” termed as compactibility and “1/b” termed as cohesiveness were calculated from the slope and intercept of the line graph of N/C vs. N and presented in Table 3. A higher value of constant “a” for APT-AC and APT-EA reflected better compactibility whereas a lower value of “1/b” reflected lesser cohesiveness of APT-AC compared to APT and APT-EA (p < 0.05).

3.10. Heckel Plots

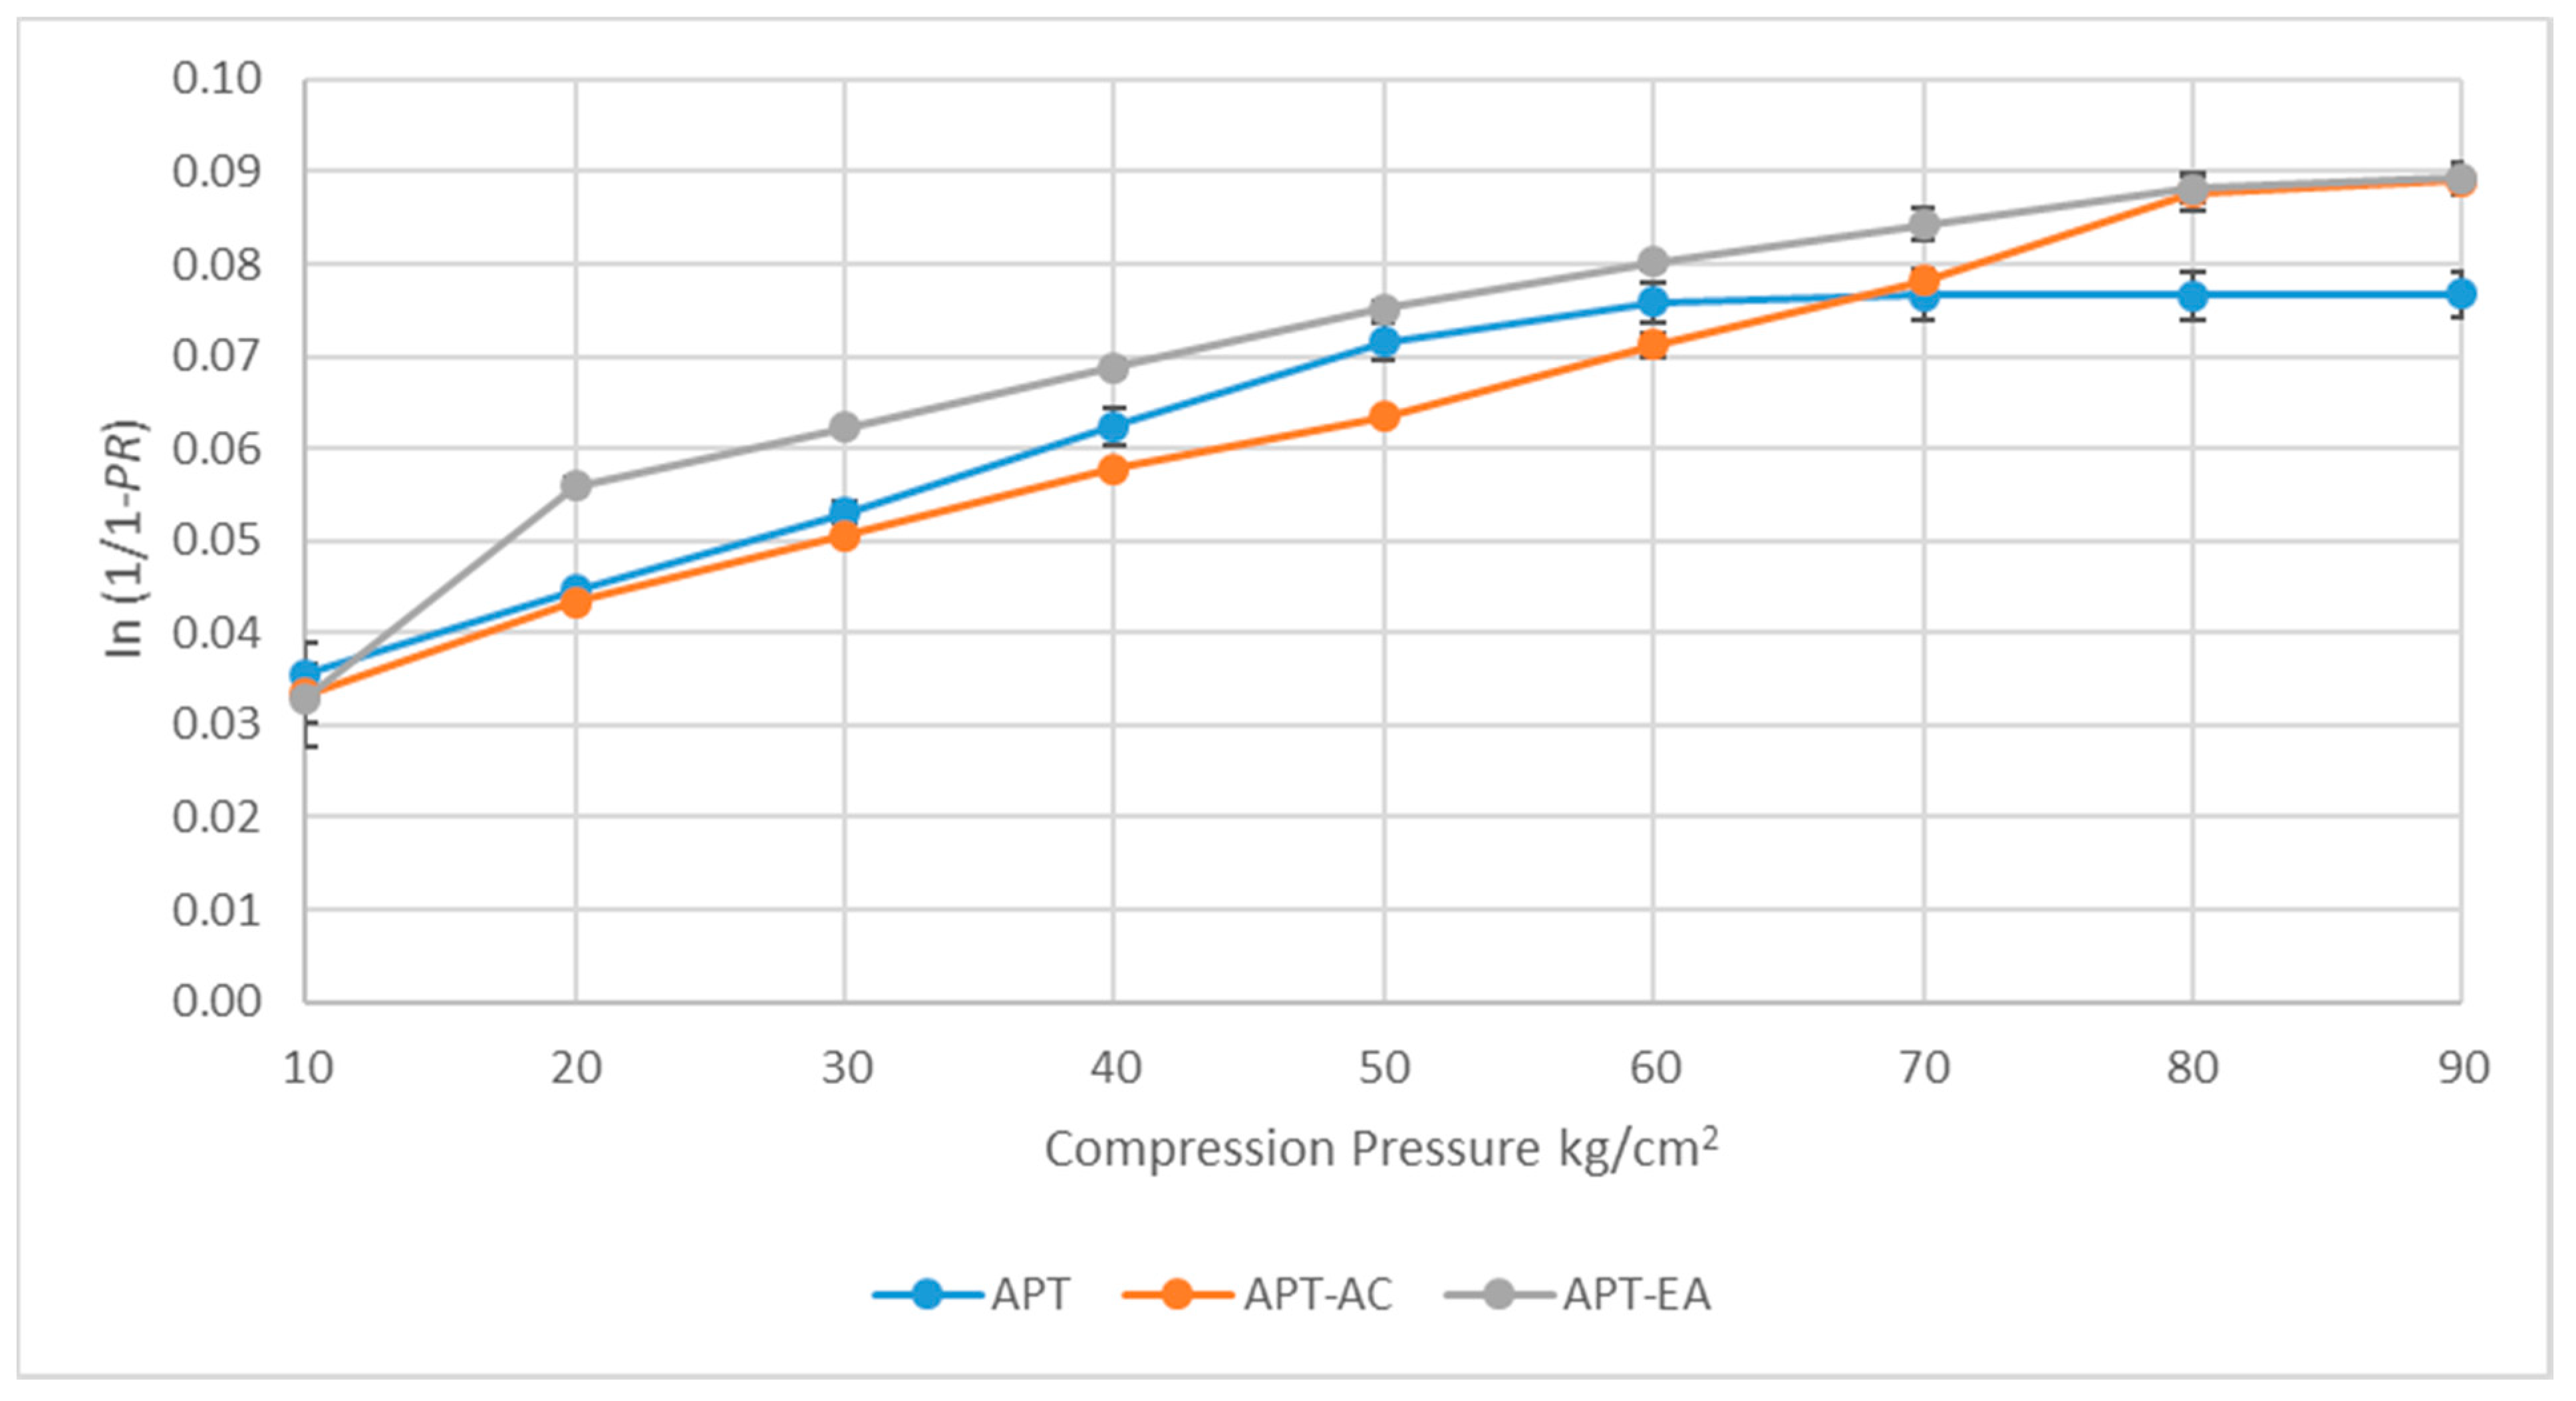
Heckel plot of APT-EA in Figure 8 showed no linearity at the initial stage of compression. This is due to crystal reordering and initial disintegration of crystal habit with a higher aspect ratio, indicating extensive powder densification [22]. A higher value of “A” in APT-EA (Table 4) represents a higher degree of fragmentation (p < 0.05) [23]. When compression pressure increased, APT-EA showed a plastic deformation nature. However, at higher compression pressure, this densification process was halted and APT-EA showed no more linear plastic deformation. In contrast, APT-AC showed plastic behavior at all compression pressures. APT-AC crystals get aligned uniformly and required less fragmentation and rearrangement during die filling due to tabular shape and aspect ratio near to one [8]. Higher slope in both APT-AC and APT-EA indicated higher plastic deformation hence better compressibility compared to APT (p < 0.05) [8,23]. Yield pressure explains the deformation nature of crystal habit. Yield pressure is inversely proportional to the nature of a crystal habit to deform plastically [22]. The mean yield pressure Py was found to be lower for APT-AC compared to APT-EA and APT (p < 0.05). High yield pressure in APT showed poor compressibility. This indicates that APT-AC undergoes plastic deformation more easily than APT-EA and APT.

3.11. Compactibility Assessment

Tensile strength of the compacts prepared from APT-AC was found to be higher than APT-EA and APT indicating good tensile strength over the others (Figure 9). As the compression pressure was increased, tensile strength was found to increase linearly up to 80 kg/cm2 for APT-AC, and 70 kg/cm2 for both APT-EA and APT (p < 0.05). Higher tensile strength indicates the extensive points of contact in modified crystal habits. Whereas lower tensile strength in plain indicates lower inter-particulate contacts [9,22]. In the case of APT-EA and APT, tensile strength was found to decrease with an increase in any further compression pressure which indicates the tendency of capping and lamination [8].

3.12. Dissolution Study

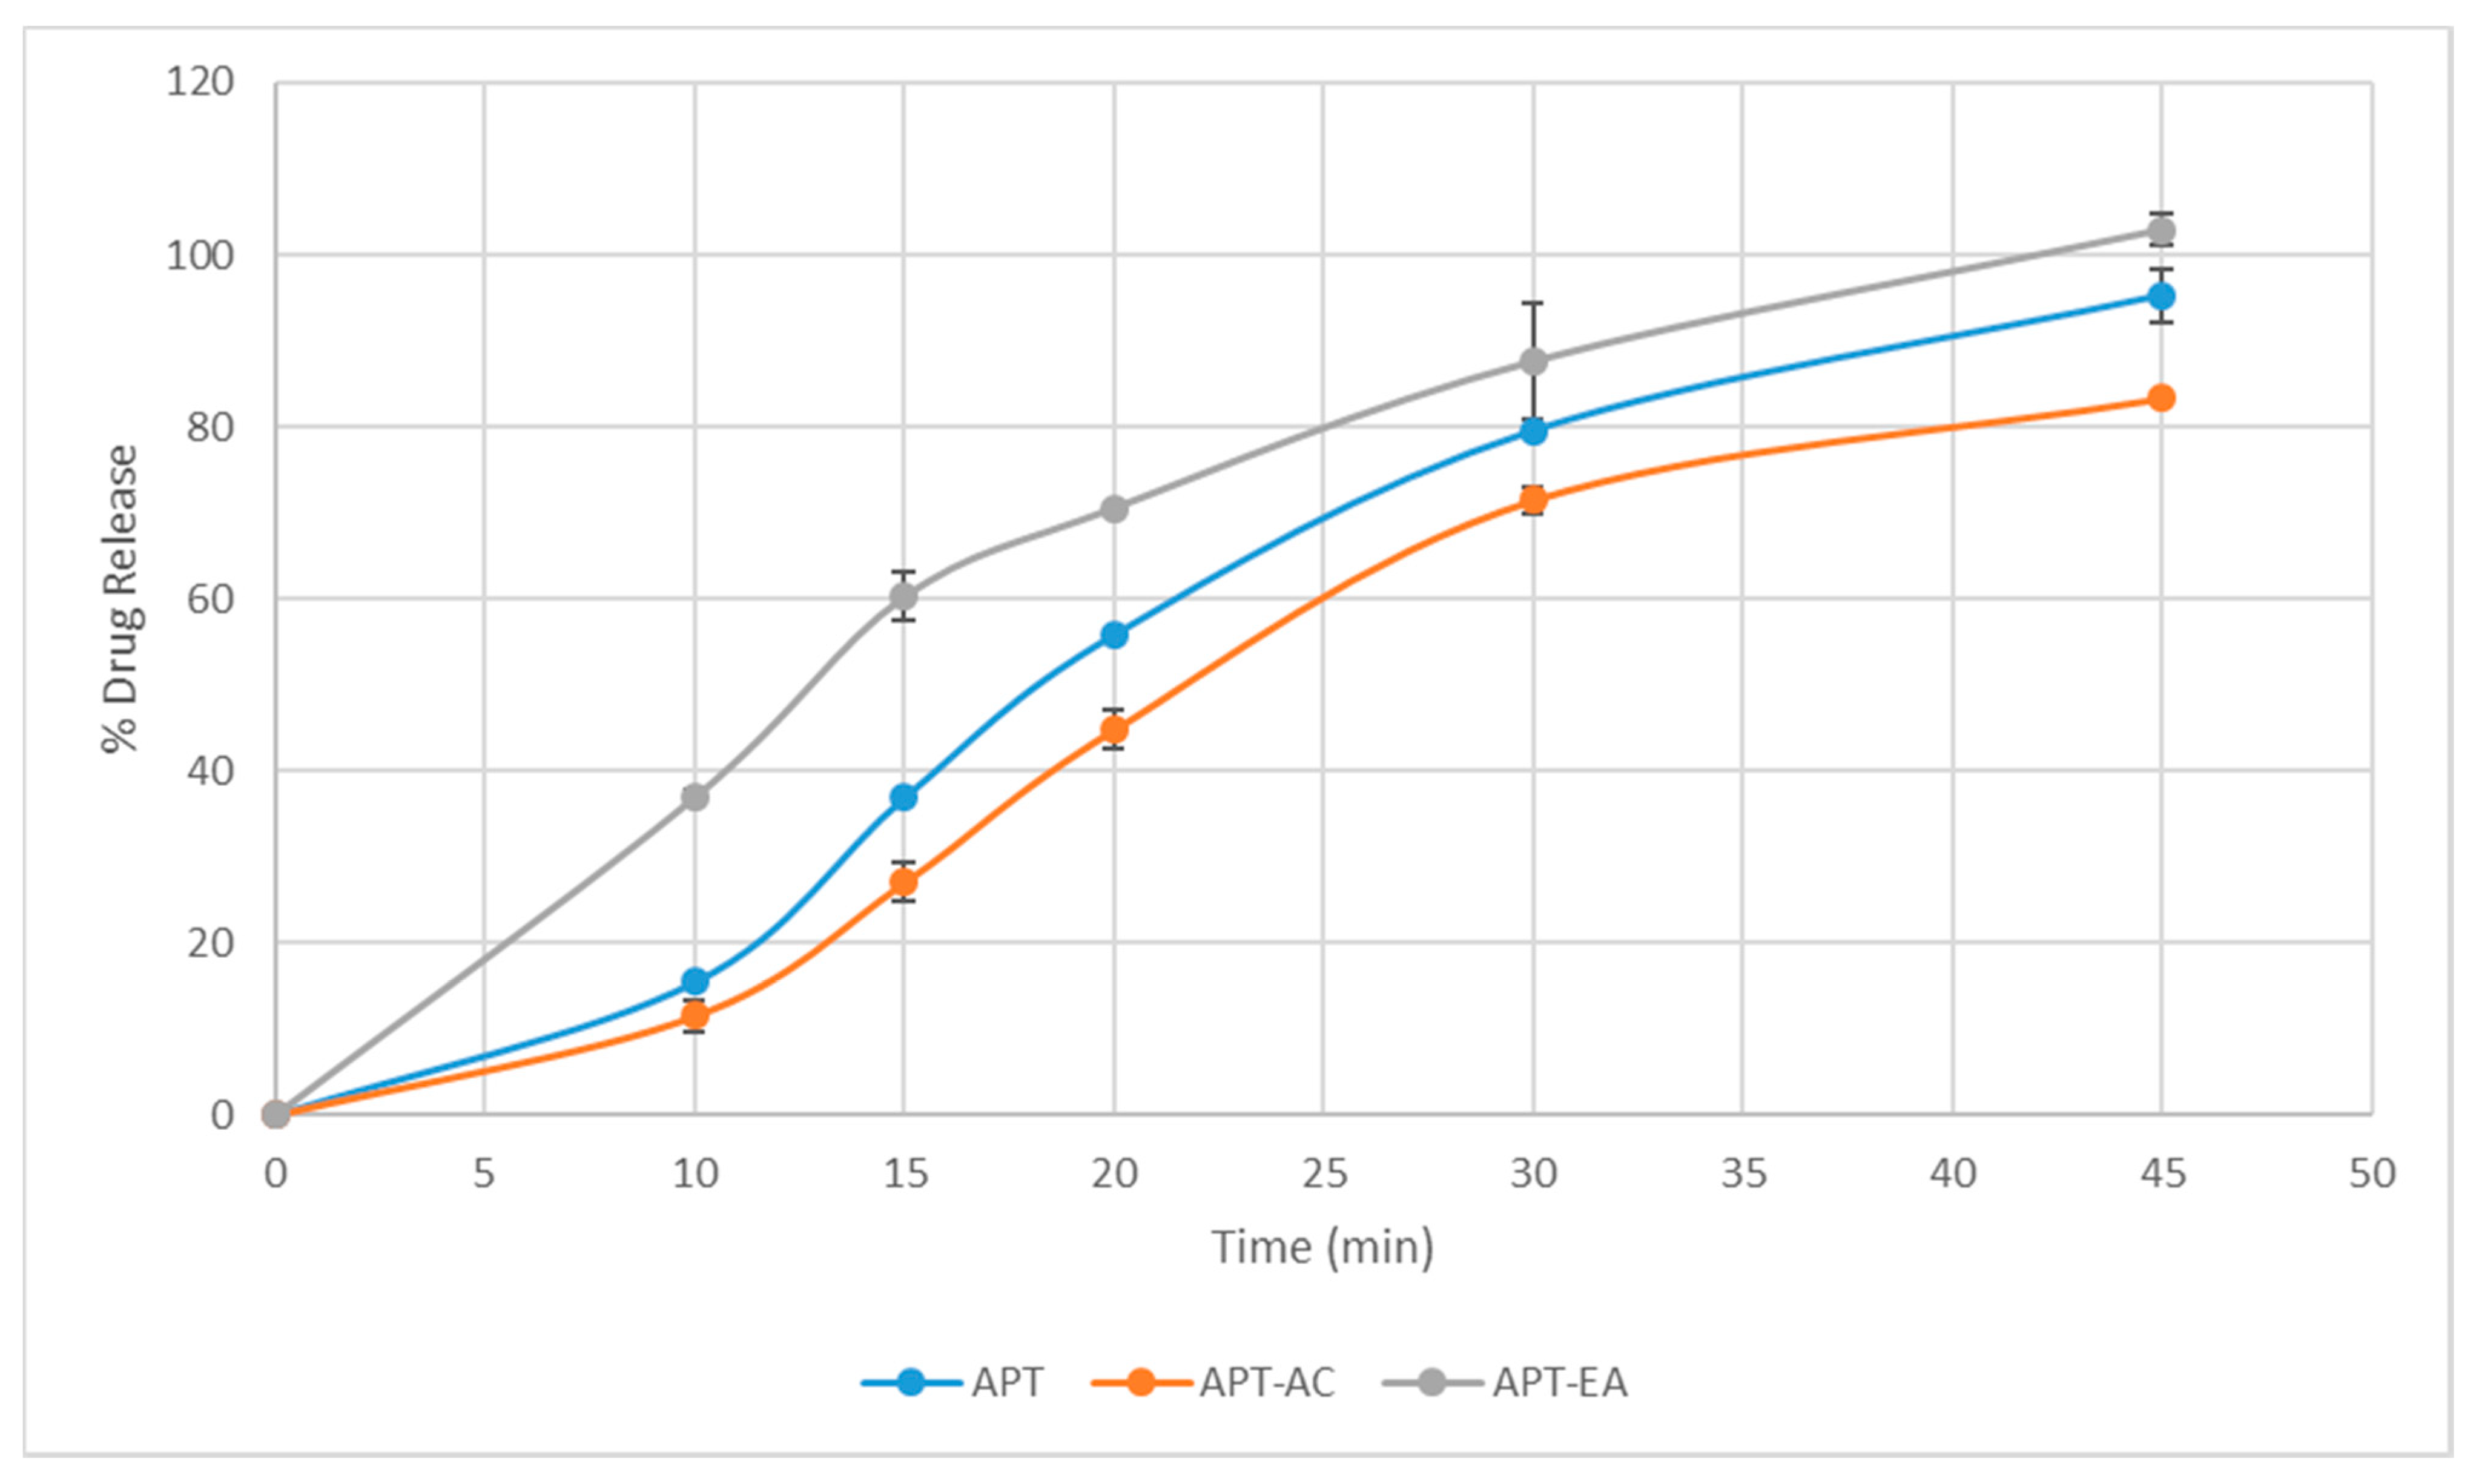
The dissolution profile of the APT, APT-AC, and APT-EA in Figure 10 showed that the APT-EA had a higher, APT had an intermediate, and APT-AC had a lower dissolution profile. In 30 min, time point the percent cumulative drug release for APT-EA was 87.6%, for APT-AC was 71.45%, and for APT was 79.55%. PSD analysis had shown that APT-EA had a larger surface area compared to APT-AC. Surface free energy is a very important and significant parameter for the performance of crystalline molecules [30]. Solvent nature changes the wettability of crystal surface which impacts dissolution [12,14,15]. Internalization of functional groups which are less attracted toward a solvent occurs during crystallization [13]. It can be assumed that a larger surface area has exposed more surface for dissolution and polar groups present on the surface might lead to faster dissolution [31,32]. Hydrophilicity/ hydrophobicity of the crystal surface reflects the presence of functional groups on the surface to form hydrogen bonding with the external molecules [33].

4. Conclusions

Recrystallization with acetone generated tabular crystal habit whereas recrystallization with ethyl acetate generated a long tabular crystal habit. Tabular habit showed better flow properties than long tabular and irregular plate habit. The reason for the better flow of tabular crystals in comparison to long tabular crystals is probably the smaller aspect ratio of tabular crystals. Kawakita analysis also showed that the tabular crystals had better compactibility and lesser cohesiveness. Heckel plots were successful in differentiating the deformation pattern of both crystal habits in which long tabular crystals took time in fracturing and initial rearrangement at lower compression pressure whereas tabular crystals from the very beginning showed plastic deformation. Compactibility assessment showed that the tensile strength is in decreasing order of tabular crystals, long tabular crystals, and irregular plates. Long tabular crystals showed a better dissolution profile than tabular crystals and irregular plates due to higher surface area. Marketed formulations of APT do not mention polymorph selection or preference. APT received for this study was also a mixture of polymorphs. The importance and application of this study are that the crystal habits were recrystallized through different solvents and their impacts on different material attributes were studied which will help in the selection of suitable crystal habits for future development.

Supplementary Materials

The following are available online at https://www.mdpi.com/article/10.3390/app11125604/s1. Figure S1: BFDH morphology APT form 1 (a), APT-AC tabular crystal habit (b), APT-EA long tabular crystal habit (c). Figure S2: FTIR graph of tabular crystal habit. Figure S3: FTIR graph of long tabular crystal habit. Figure S4: FTIR graph of irregular plate crystal habit. Figure S5: Simulated PXRD of APT form I (CCDC number 687301).

Author Contributions

Conceptualization, S.R.D. and M.H.B.; methodology, S.R.D. and M.H.B.; software, D.K.; formal analysis, S.J., B.N., A.K.B., S.D.T., D.K. and P.K.; investigation, S.R.D.; resources, S.J.; B.N., A.K.B., S.D.T., D.K. and P.K.; data curation, S.R.D.; writing—original draft preparation, S.R.D.; writing—review and editing, M.H.B., D.K. and P.K.; visualization, S.R.D.; supervision, M.H.B. All authors have read and agreed to the published version of the manuscript.

Funding

This research received no external funding.

Institutional Review Board Statement

Not applicable.

Informed Consent Statement

Not applicable.

Data Availability Statement

All necessary data have been reported in this article and there are no other data to share.

Acknowledgments

We are grateful to Glenmark Pharmaceuticals for providing API APT with written permission for this research work. We are also grateful to CCDC, UK for providing a free version of the Mercury software and CIF.

Conflicts of Interest

The authors declare no conflict of interest.

References and Notes

  1. Blagden, N.; de Matas, M.; Gavan, P.T.; York, P. Crystal engineering of active pharmaceutical ingredients to improve solubility and dissolution rates. Adv. Drug Deliv. Rev. 2007, 59, 617–630. [Google Scholar] [CrossRef]
  2. Lee, E.H. A practical guide to pharmaceutical polymorph screening & selection. Asian J. Pharm. Sci. 2014, 9, 163–175. [Google Scholar] [CrossRef] [Green Version]
  3. Varshosaz, J.; Ghassami, E.; Ahmadipour, S. Crystal Engineering for Enhanced Solubility and Bioavailability of Poorly Soluble Drugs. Curr. Pharm. Des. 2018, 24, 2473–2496. [Google Scholar] [CrossRef]
  4. Li, Y.; Yao, F.; Shang, C.; Ren, F.; Zhang, J.; Li, Y.; Yang, G.; Lin, R.; Wang, W. Preparation, characterization and in vivo evaluation of pharmacological activity of different crystal forms of ibuprofen. Pak. J. Pharm. Sci. 2019, 32, 2139–2147. [Google Scholar]
  5. Rasenack, N.; Müller, B.W. Crystal habit and tableting behavior. Int. J. Pharm. 2002, 244, 45–57. [Google Scholar] [CrossRef]
  6. Burt, H.M.; Mitchell, A.G. Effect of habit modification on dissolution rate. Int. J. Pharm. 1980, 5, 239–251. [Google Scholar] [CrossRef]
  7. Aziz, M.S.; Gupta, C.; Tyagi, L.K. Development of Novel Crystal Forms of Metaxalone for Solubility Enhancement. Indian J. Pharm. Sci. 2020, 82, 974–980. [Google Scholar] [CrossRef]
  8. Joiris, E. Joiris_1998_PhRes.pdf. Pharm. Res. 1998, 15, No. 7.
  9. Garekani, H.A.; Sadeghi, F.; Badiee, A.; Mostafa, S.A.; Rajabi-Siahboomi, A.R.; Rajabi-Siahboomi, A.R. Crystal habit modifications of ibuprofen and their physicomechanical characteristics. Drug Dev. Ind. Pharm. 2001, 27, 803–809. [Google Scholar] [CrossRef]
  10. Thakur, A.; Thipparaboina, R.; Kumar, D.; Sai Gouthami, K.; Shastri, N.R. Crystal engineered albendazole with improved dissolution and material attributes. CrystEngComm 2016, 18, 1489–1494. [Google Scholar] [CrossRef]
  11. Aisling, L.; Åke, R. Crystal Growth of Single Salicylamide Crystals. Cryst. Growth Des. 2019, 19, 7230–7239. [Google Scholar] [CrossRef]
  12. Tiwary, A.K. Modification of crystal habit and its role in dosage form performance. Drug Dev. Ind. Pharm. 2001, 27, 699–709. [Google Scholar] [CrossRef]
  13. Buckton, G. Surface Characterization: Understanding Sources of Variability in the Production and Use of Pharmaceuticals. J. Pharm. Pharmacol. 1995, 47, 265–275. [Google Scholar] [CrossRef]
  14. Hammouda, Y.E.; El-Khordagui, L.K.; Darwish, I.A.; El-Kamel, A.H. Manipulation of powder characteristics by interactions at the solid-liquid interface: 1-sulphadiazine. Eur. J. Pharm. Sci. 1999, 8, 283–290. [Google Scholar] [CrossRef]
  15. Khan, G.M.; Jiabi, Z. Preparation, characterization, and evaluation of physicochemical properties of different crystalline forms of ibuprofen. Drug Dev. Ind. Pharm. 1998, 24, 463–471. [Google Scholar] [CrossRef] [PubMed]
  16. Tiwary, A.K.; Panpalia, G.M. Influence of crystal habit on trimethoprim suspension formulation. Pharm. Res. 1999, 16, 261–265. [Google Scholar] [CrossRef]
  17. Dohme, M.S. US PIL Emend-Aprepitant Capsules; 2012; Volume 79.
  18. Braun, D.E.; Gelbrich, T.; Kahlenberg, V.; Laus, G.; Wieser, J.; Griesser, U.J. Packing polymorphism of a conformationally flexible molecule (aprepitant). New J. Chem. 2008, 32, 1677–1685. [Google Scholar] [CrossRef]
  19. Crocker Louis, M.J. Polymorphic Form of a Tachykinin Receptor Antagonist. U.S. Patent No. 6096742, 1 August 2000. [Google Scholar]
  20. Yamashiro, M.; Yuasa, Y.; Kawakita, K. An experimental study on the relationships between compressibility, fluidity, and cohesion of powder solids at small tapping numbers. Powder Technol. 1983, 34, 225–231. [Google Scholar] [CrossRef]
  21. USP Chapter 616 Bulk Density and Tapped Density of Powders. US Pharmacop. Conv. 2014, 6, 2014–2016.
  22. Ilkka, J.; Paronen, P. Prediction of the compression behaviour of powder mixtures by the Heckel equation. Int. J. Pharm. 1993, 94, 181–187. [Google Scholar] [CrossRef]
  23. Prakash, S.S.; Niranjan Patra, C.; Santanu, C.; Kumar, P.H.; Jagannath Patro, V.; Vimala Devi, M. Studies on flowability, compressibility and in-vitro release of Terminalia chebula fruit powder tablets. Iran. J. Pharm. Res. 2011, 10, 393–401. [Google Scholar]
  24. Fell, J.T.; Newton, J.M. Determination of tablet strength by the diametral-compression test. J. Pharm. Sci. 1970, 59, 688–691. [Google Scholar] [CrossRef]
  25. Dissolution Test 3. United States Pharmacopeia; USP: Rockville, MD, USA, 2020; pp. 1–3. [Google Scholar]
  26. Garti, N.; Tibika, F. Habit modifications of nitrofurantoin crystallized from formic acid mixtures. Drug Dev. Ind. Pharm. 1980, 6, 379–398. [Google Scholar] [CrossRef]
  27. Turner, T.D.; Hatcher, L.E.; Wilson, C.C.; Roberts, K.J. Habit Modification of the Active Pharmaceutical Ingredient Lovastatin Through a Predictive Solvent Selection Approach. J. Pharm. Sci. 2019, 108, 1779–1787. [Google Scholar] [CrossRef] [Green Version]
  28. Harris, K.D.M. Powder diffraction crystallography of molecular solids. Top. Curr. Chem. 2012, 315, 133–178. [Google Scholar] [CrossRef] [PubMed]
  29. Tremayne, M. The impact of powder diffraction on the structural characterization of organic crystalline materials. Philos. Trans. R. Soc. A Math. Phys. Eng. Sci. 2004, 362, 2691–2707. [Google Scholar] [CrossRef] [PubMed]
  30. Heng, J.Y.Y.; Thielmann, F.; Williams, D.R. The effects of milling on the surface properties of form I paracetamol crystals. Pharm. Res. 2006, 23, 1918–1927. [Google Scholar] [CrossRef]
  31. Heng, J.Y.Y.; Williams, D.R. Wettability of paracetamol polymorphic forms I and II. Langmuir 2006, 22, 6905–6909. [Google Scholar] [CrossRef]
  32. Heng, J.Y.Y.; Bismarck, A.; Williams, D.R. Anisotropic surface chemistry of crystalline pharmaceutical solids. AAPS PharmSciTech 2006, 7. [Google Scholar] [CrossRef] [PubMed] [Green Version]
  33. Williams, D. Particle Engineering in Pharmaceutical Solids Processing: Surface Energy Considerations. Curr. Pharm. Des. 2015, 21, 2677–2694. [Google Scholar] [CrossRef] [Green Version]
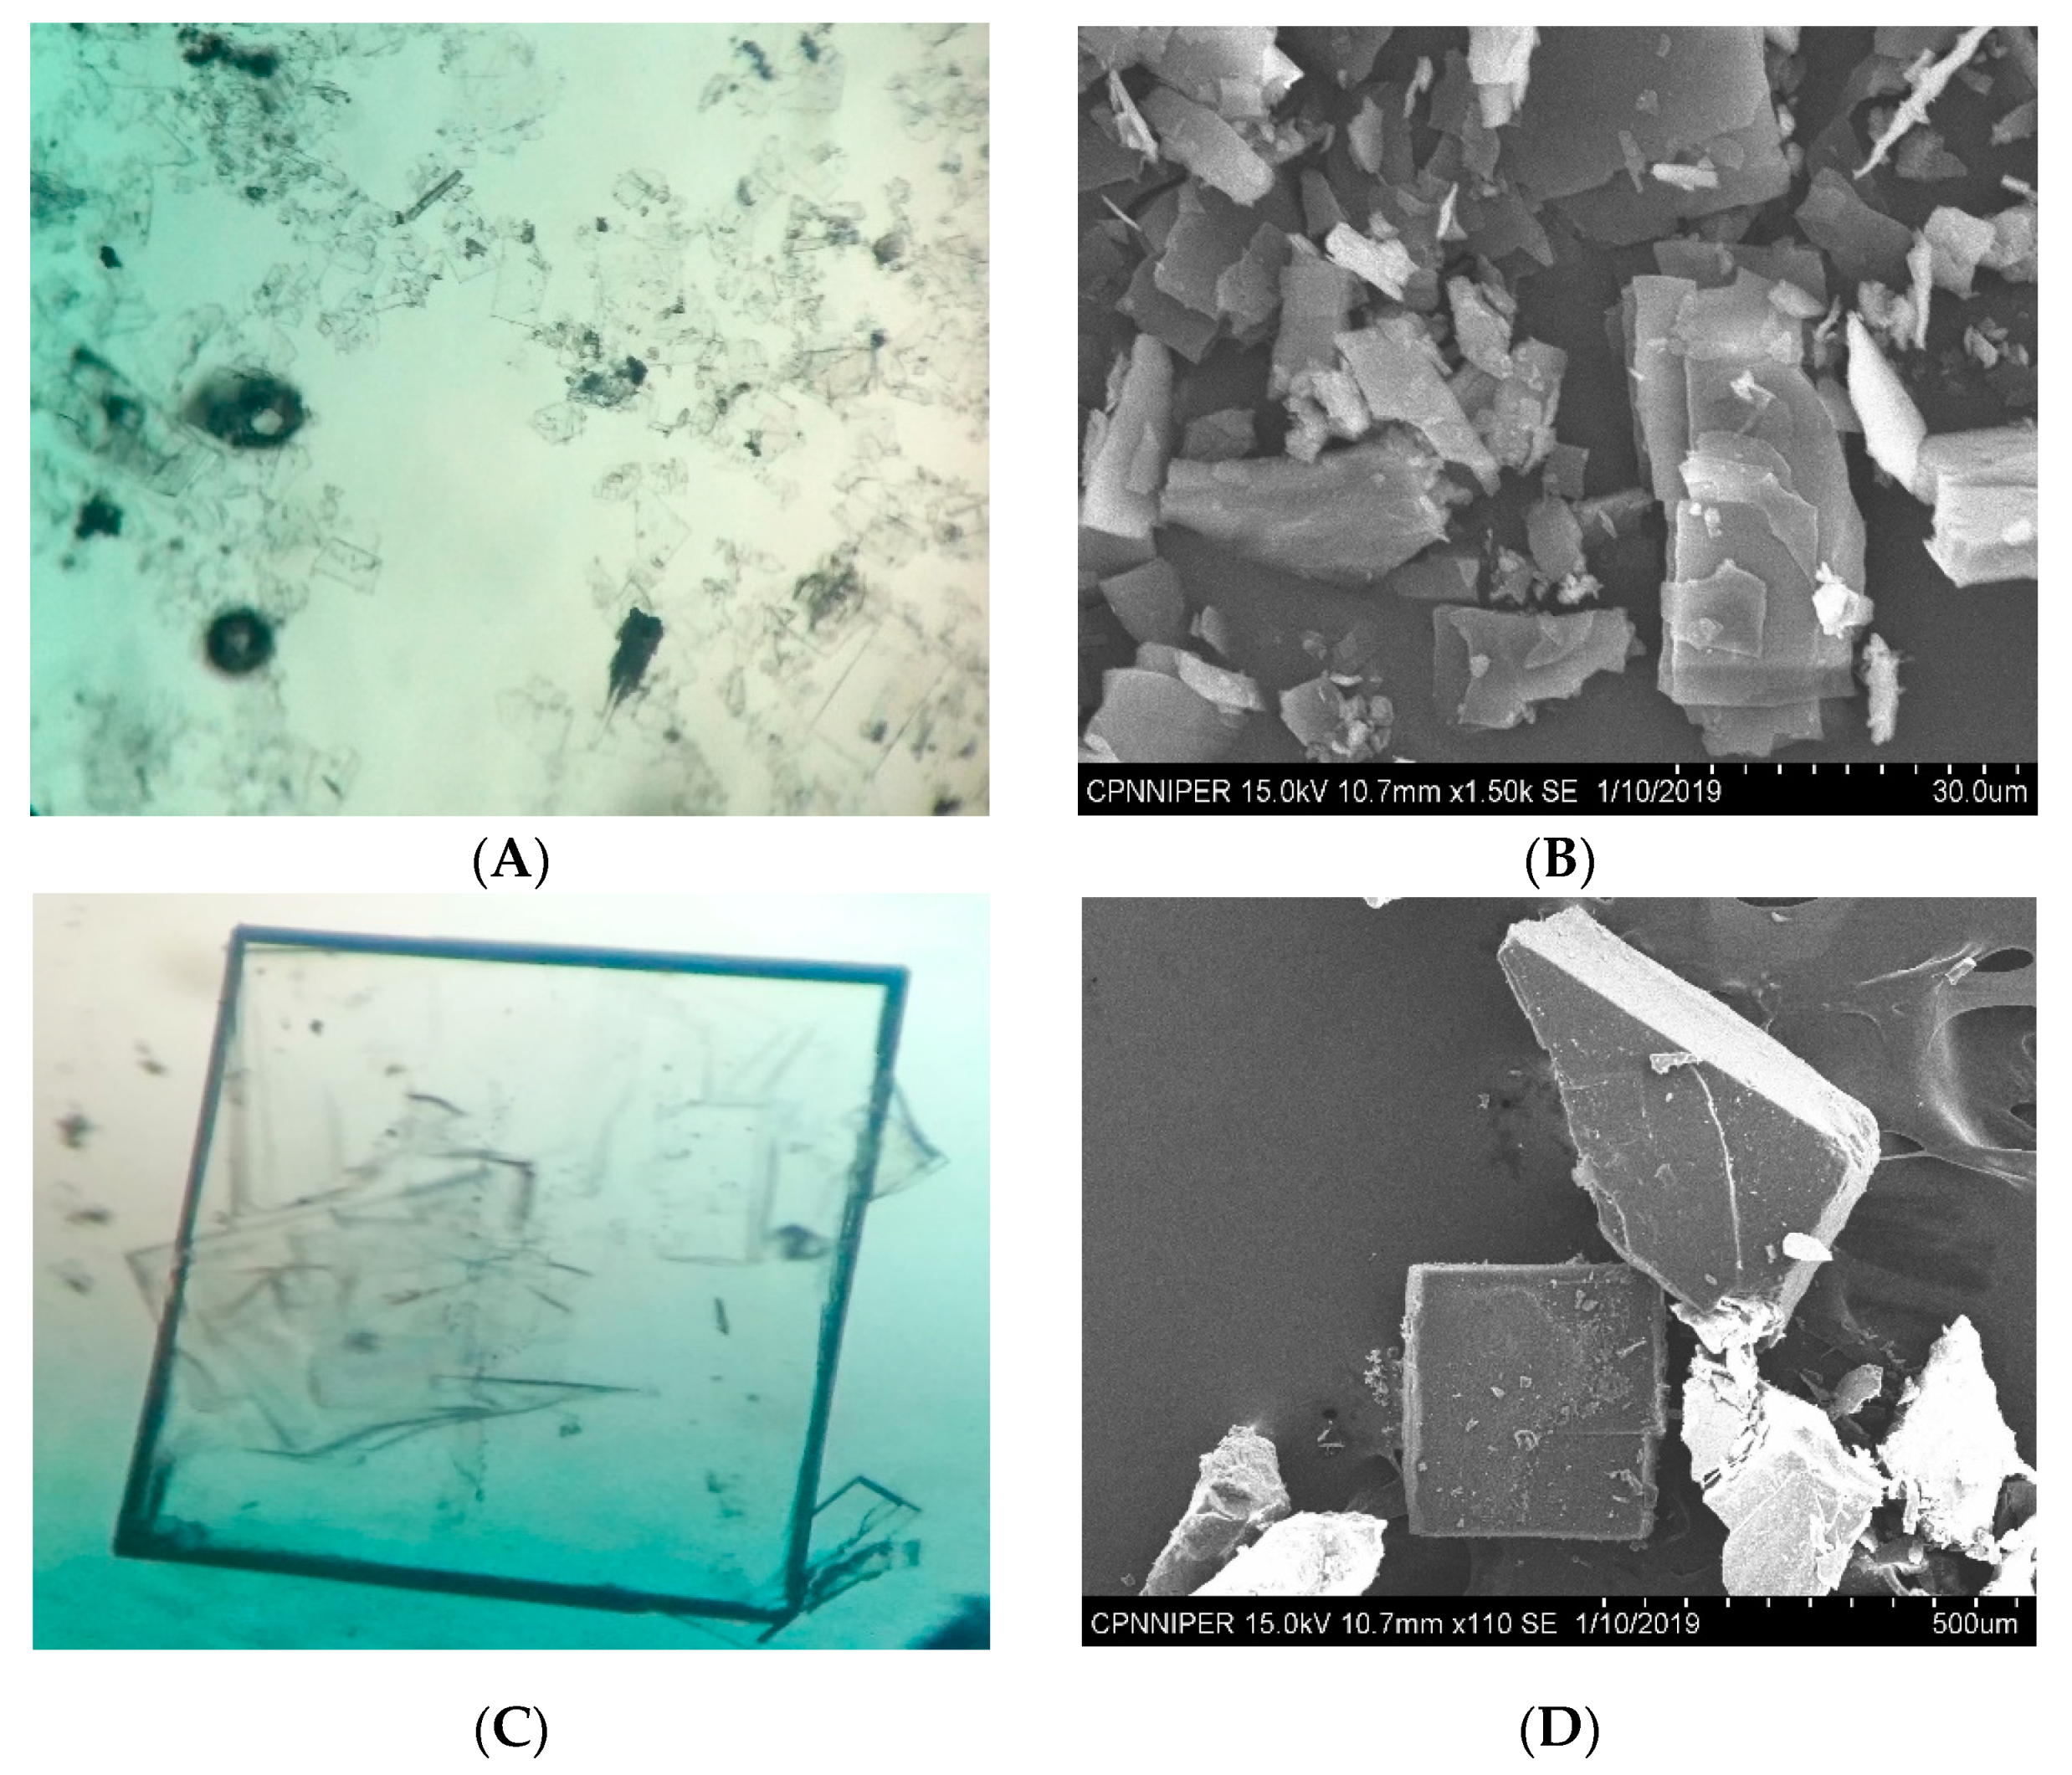
Figure 1. Compound microscope and scanning electron microscope (SEM) comparative images. (A) and (B): APT, (C) and (D): APT-AC, (E) and (F): APT-EA.
Applsci 11 05604 g001aApplsci 11 05604 g001b
Figure 2. DSC thermogram overlay.
Applsci 11 05604 g002
Figure 3. Thermogravimetric analysis.
Applsci 11 05604 g003
Figure 4. Powder XRD.
Applsci 11 05604 g004
Figure 5. Bulk and tapped density comparison. All values were calculated as mean ± SD, n = 3. ANOVA at the p < 0.05 level showed a significant difference.
Applsci 11 05604 g005
Figure 6. Cars Index and Housner’s ratio. All values were calculated as mean ± SD, n = 3. ANOVA at the p < 0.05 level showed a significant difference.
Applsci 11 05604 g006
Figure 7. Kawakita plot.
Applsci 11 05604 g007
Figure 8. Heckel plot.
Applsci 11 05604 g008
Figure 9. Plots of tensile strength against compression pressure. All values were calculated as mean ± SD, n = 3. ANOVA at the p < 0.05 level showed a significant difference.
Applsci 11 05604 g009
Figure 10. Dissolution profile. All values were calculated as mean ± SD, n = 6.
Applsci 11 05604 g010
Table 1. Solubility of APT in various organic solvents.
SolventSolubility (mg/mL)
Methanol25.64
Acetone23.25
Ethyl Acetate14.71
DCM4.07
Chloroform55.55
tert-Butyl methyl etherMilky suspension
Ethanol10.64
Acetonitrile45.45
DMF35.71
DMSO60.2
Table 2. Particle size distribution.
Crystal Habitd10 (µm)d50 (µm)d90 (µm)SpanSurface Area m2/gAspect Ratio
APT-AC 3.93227.041110.6343.9460.71.13
APT-EA 2.58916.20444.2412.5710.9932.27
Table 3. Kawakita analysis.
PowderCompactibility (a)Cohesiveness (1/b)Coefficient of Determination (r2)
APT0.014 ± 0.0000212.81 ± 0.730.9749
APT-AC0.037 ± 0.0001212.01 ± 0.400.9902
APT-EA0.039 ± 0.0004114.82 ± 0.0880.9652
f Value971814.66NA
f critical5.149.55NA
All values were calculated as mean ± SD, n = 3. ANOVA at the p < 0.05 level showed a significant difference.
Table 4. Heckel analysis.
PowderSlope (K)Intercept (A)Yield Pressure (Py)Coefficient of Determination r2
APT0.0005 ± 0.000060.037 ± 0.0071888.89 ± 192.450.8674
APT-AC0.0007 ± 0.000060.030 ± 0.00061369.05 ± 103.100.9919
APT-EA0.0006 ± 0.000060.039 ± 0.00151587.30 ± 137.460.8922
f-value969.779.21NA
f-critical5.145.145.14NA
All values were calculated as mean ± SD, n = 3. ANOVA at the p < 0.05 level showed a significant difference.
Publisher’s Note: MDPI stays neutral with regard to jurisdictional claims in published maps and institutional affiliations.