
Development and Testing of a Dual-Wavelength Sensitive Photopolymer Layer for Applications in Stacking of HOE Lenses


Abstract
1. Introduction
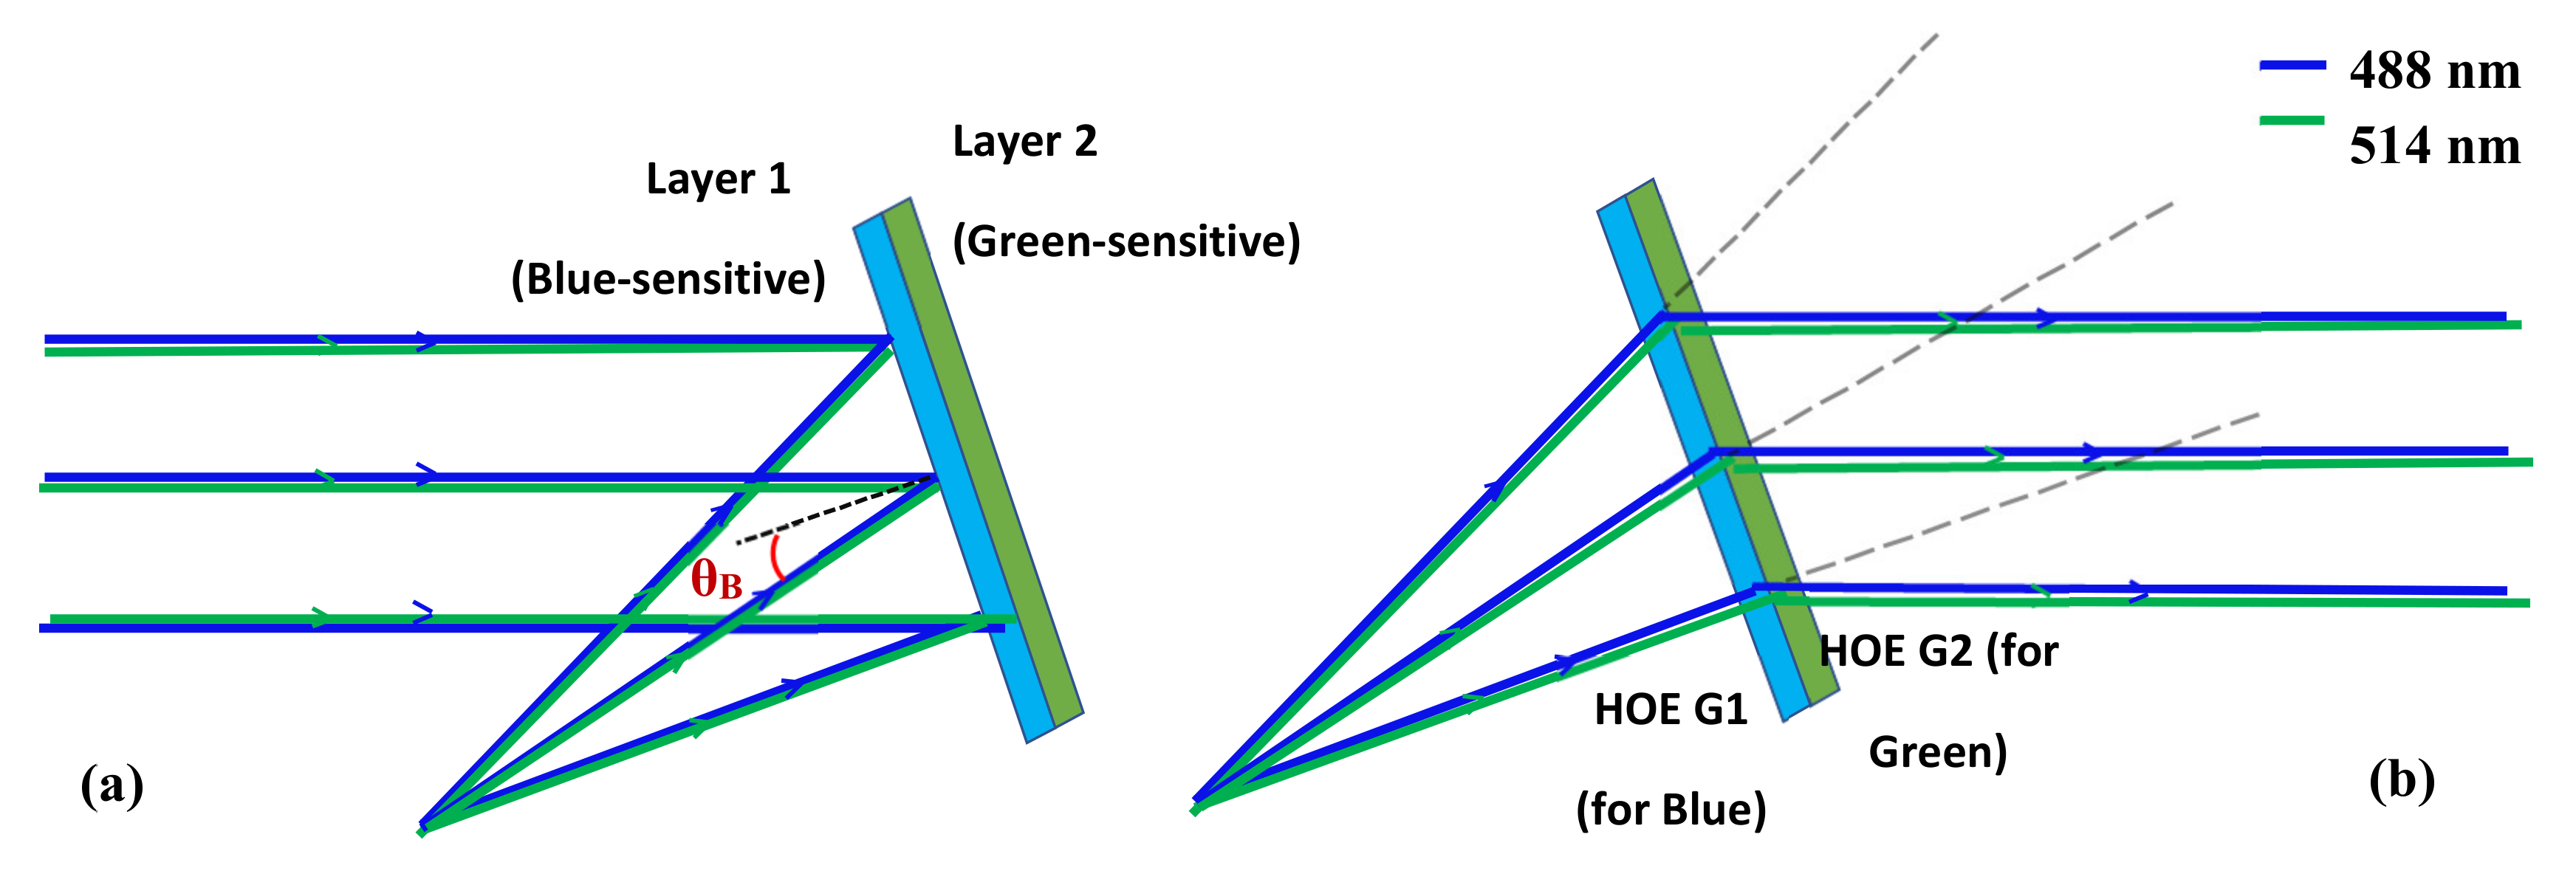
1.1. Concept
1.2. Theory
2. Materials and Methods
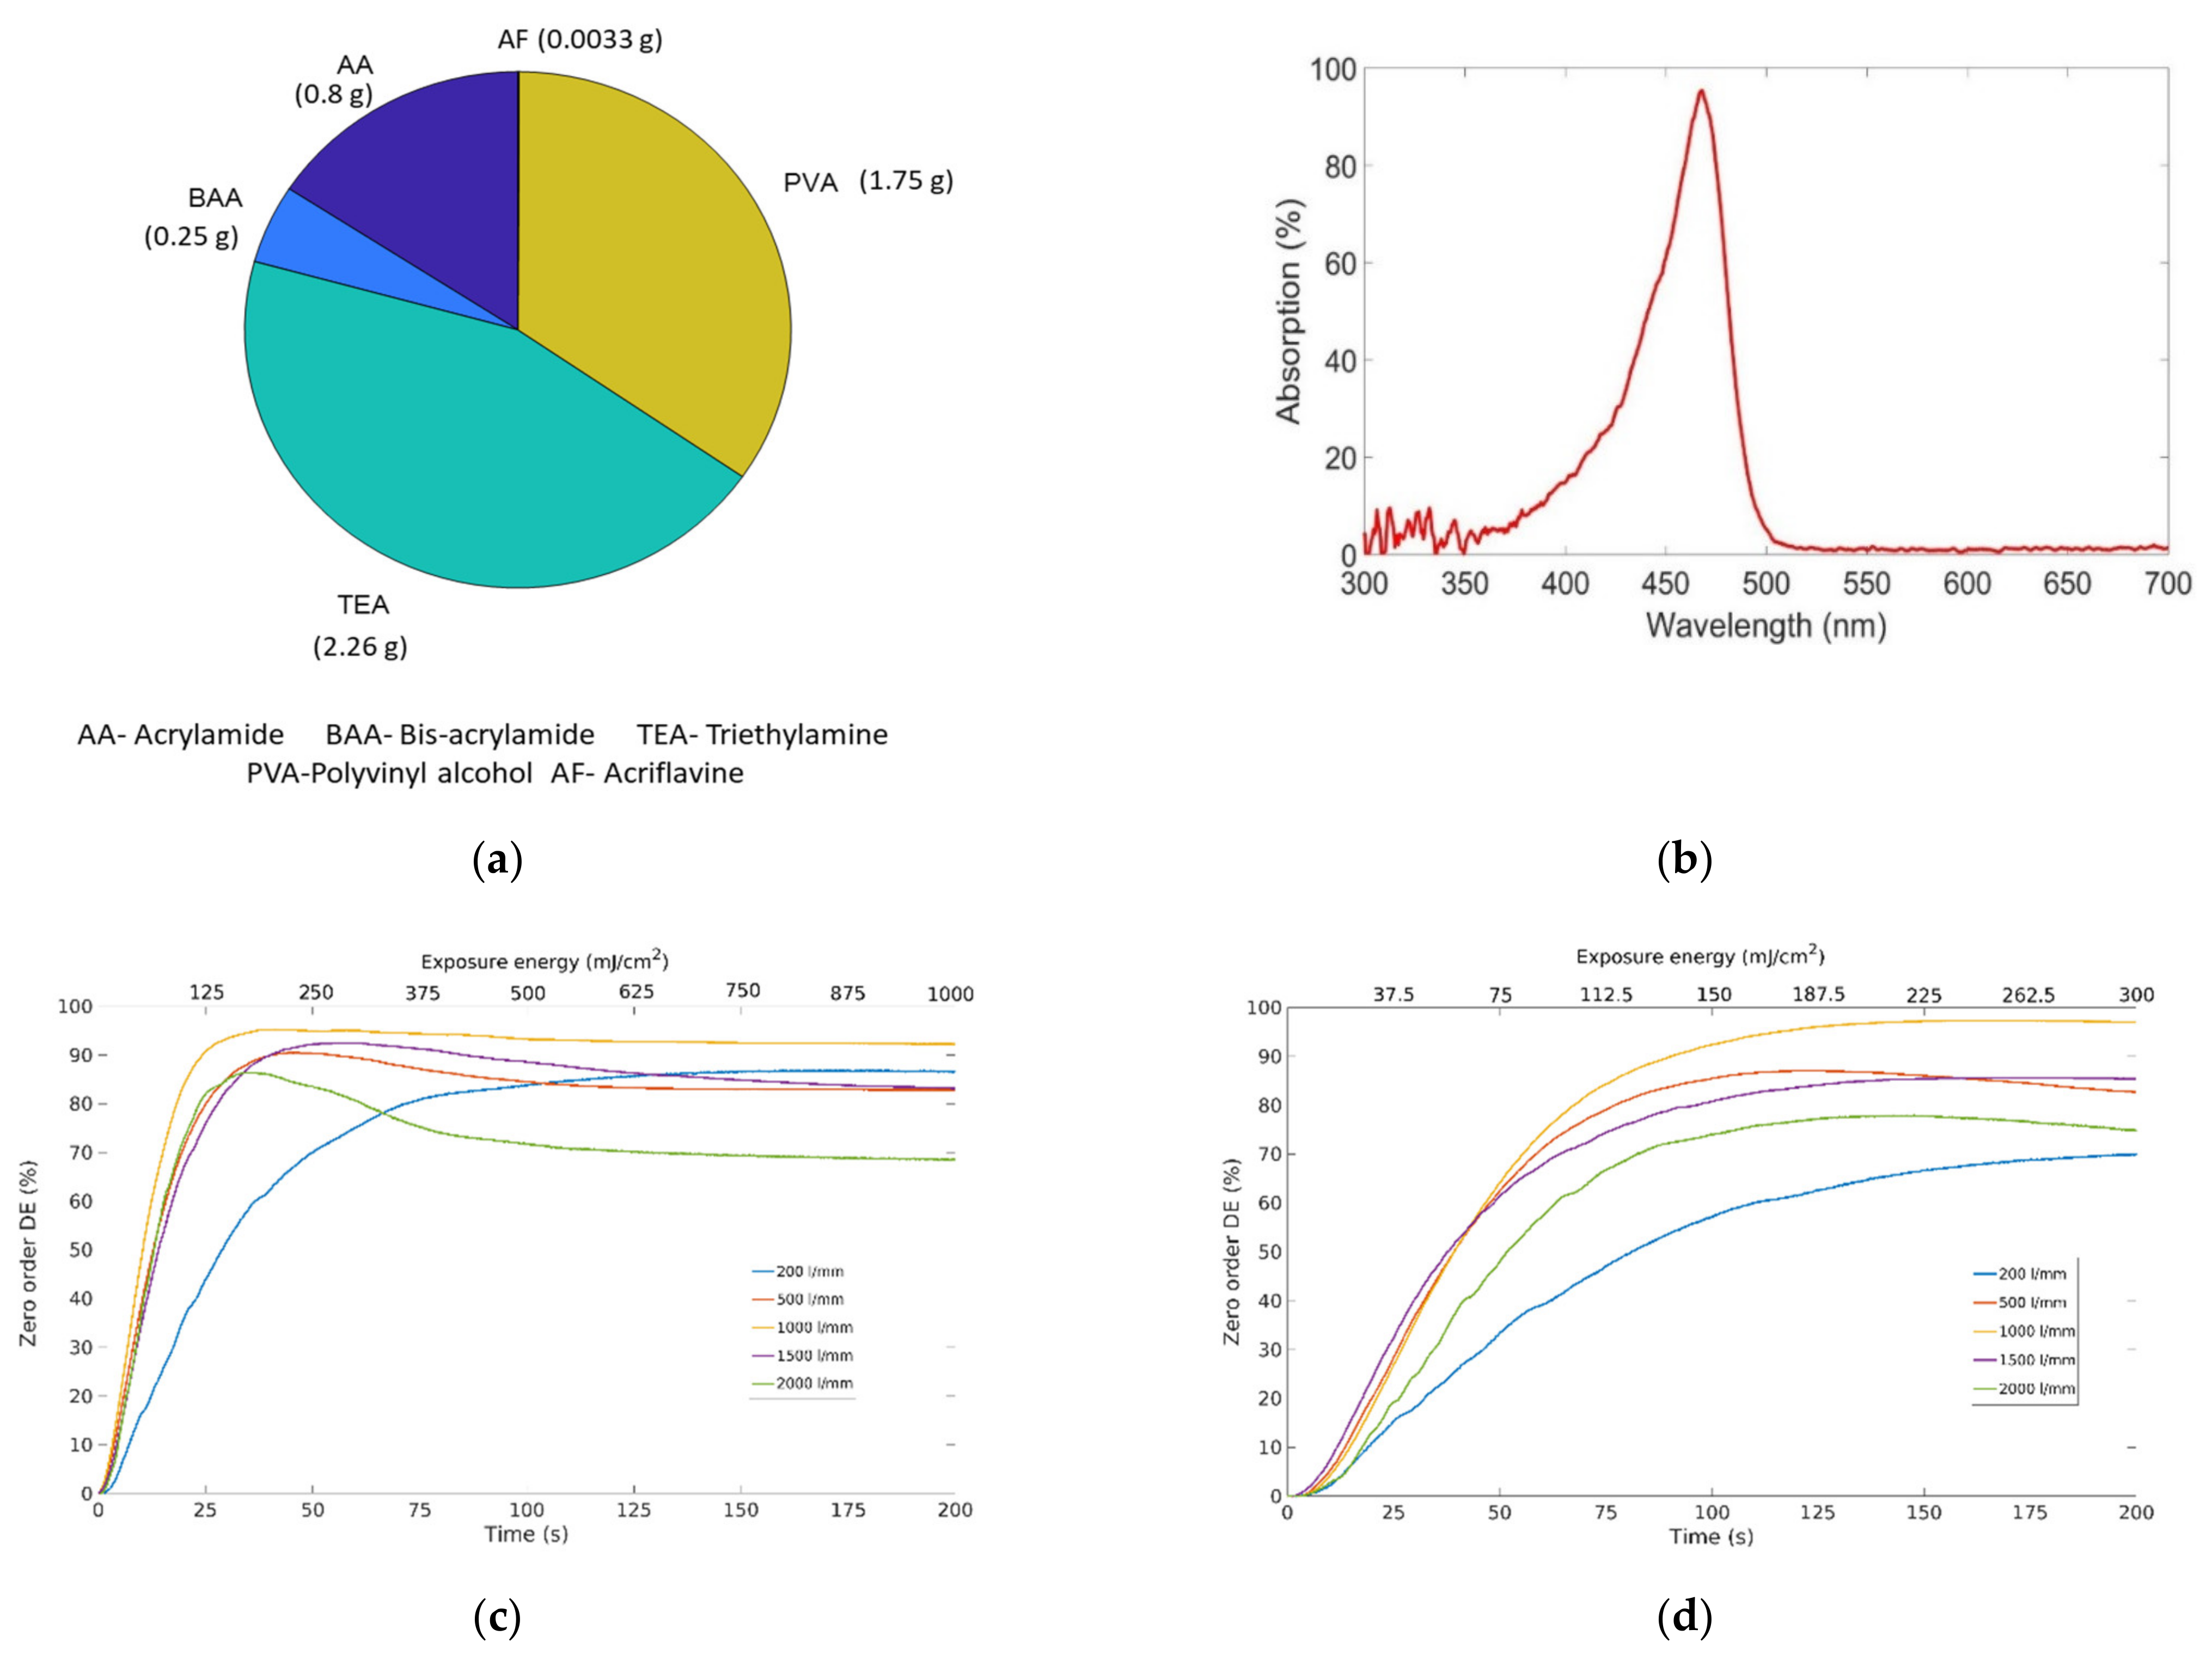
2.1. Materials Preparation
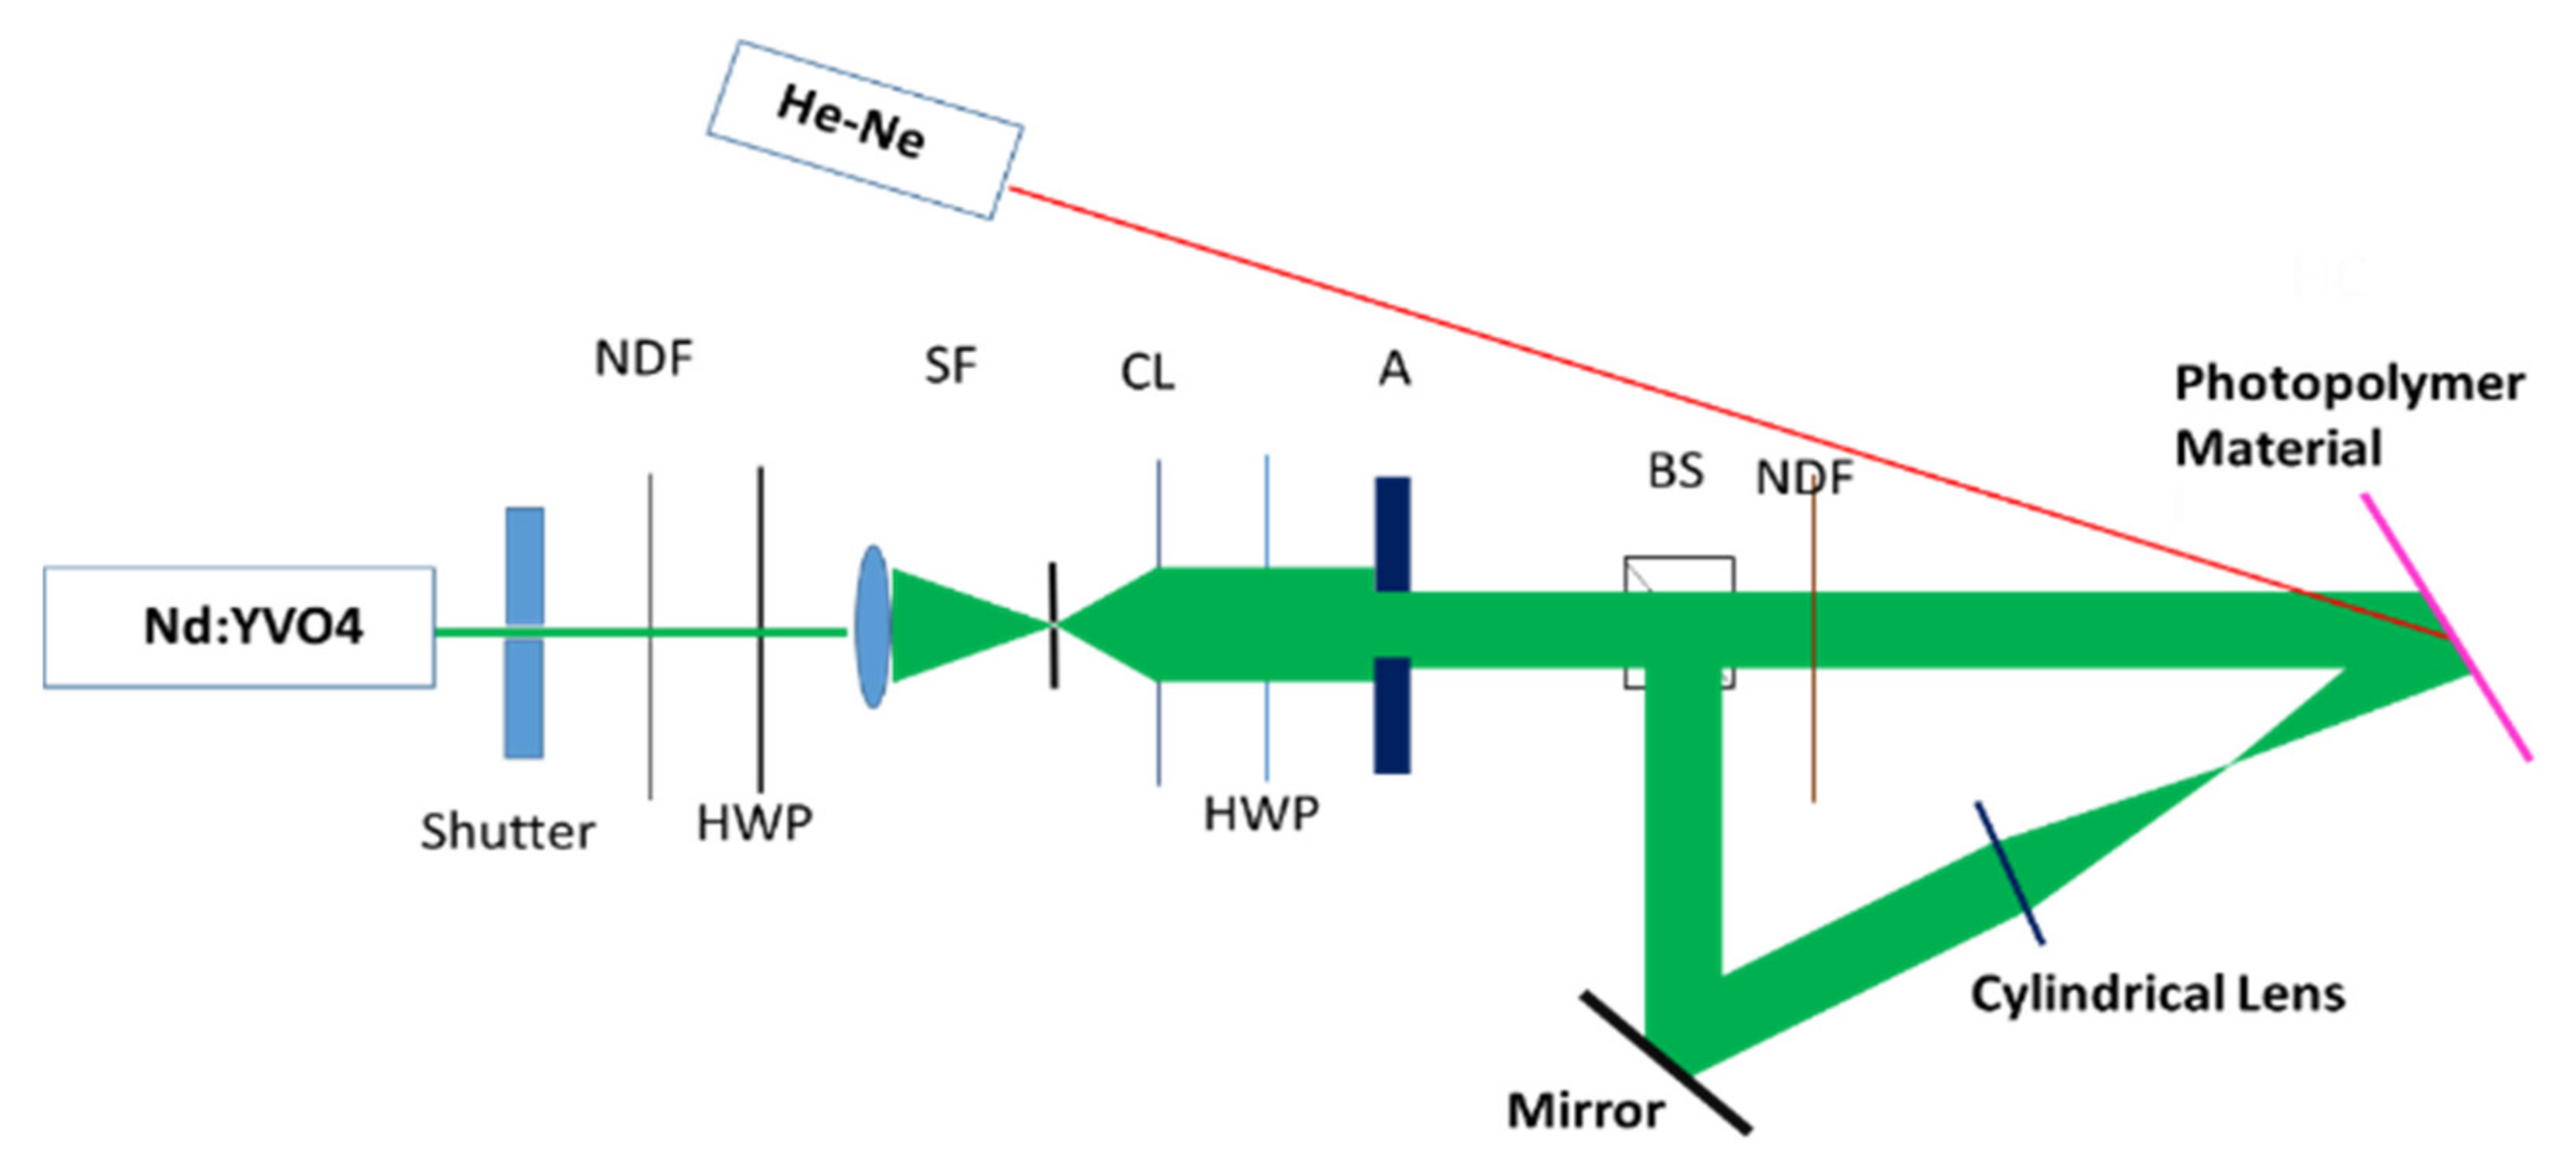
2.2. Optical Patterning: Holographic Recording Setup
2.3. Testing the Recorded Lenses
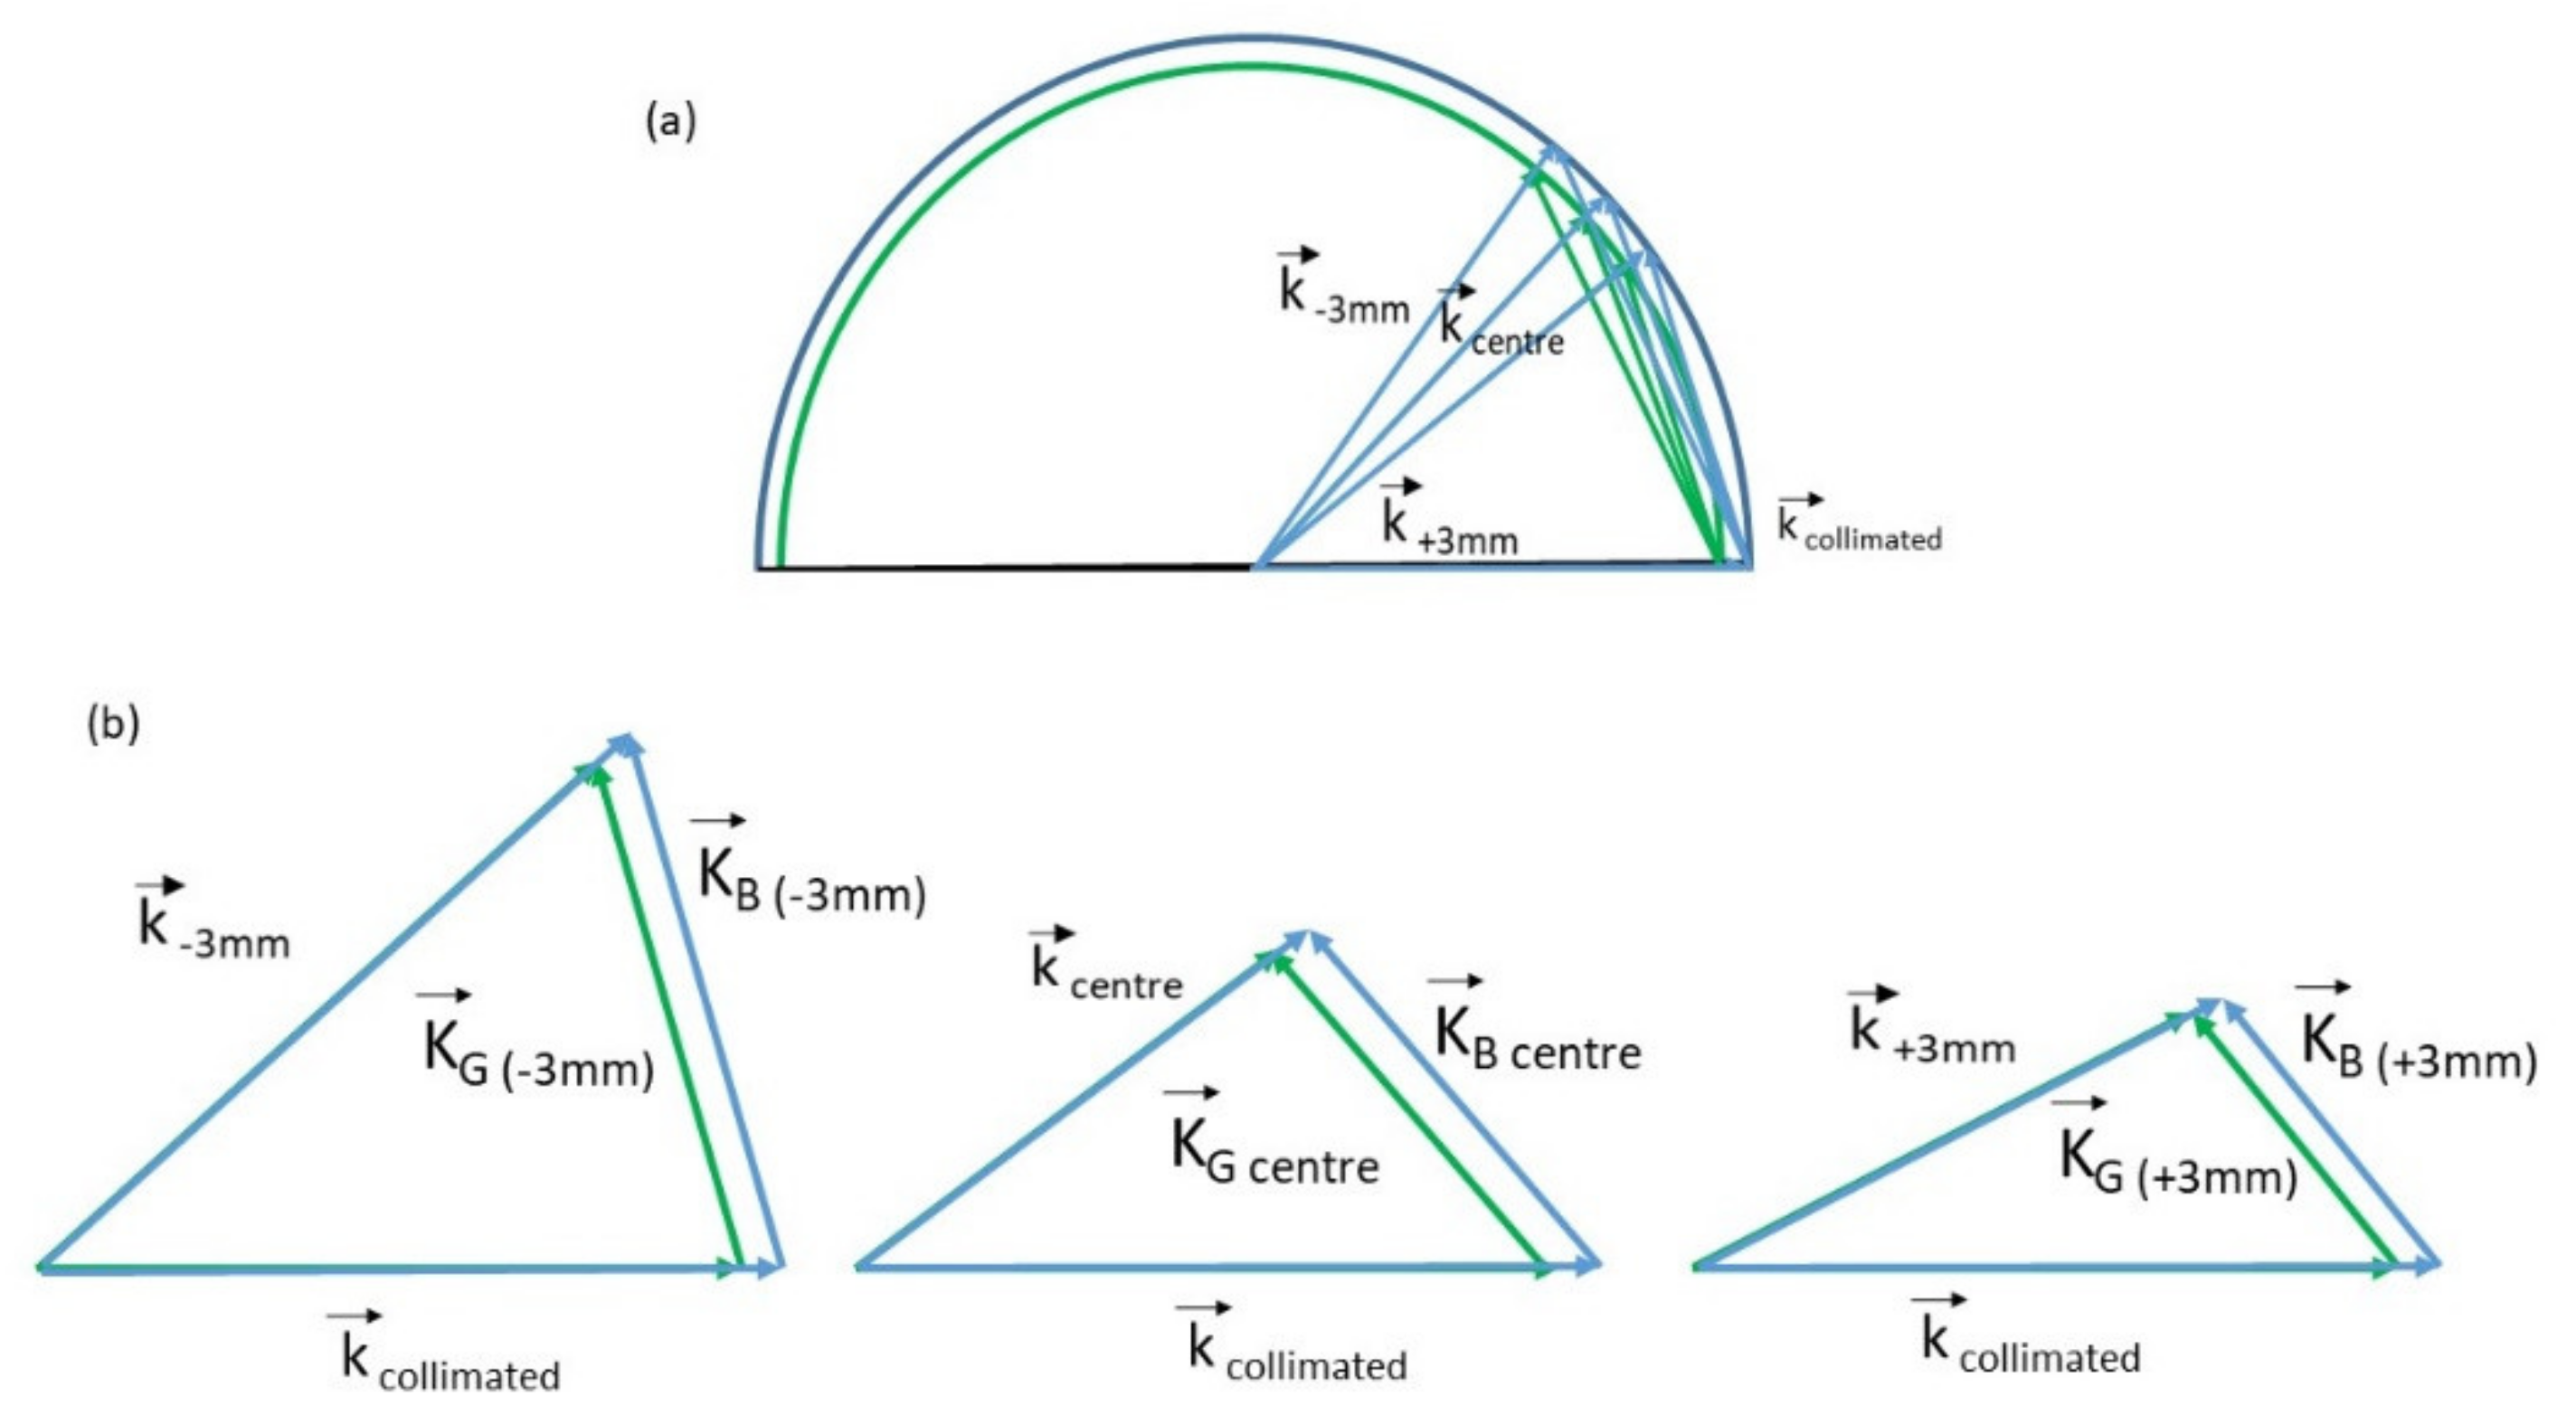
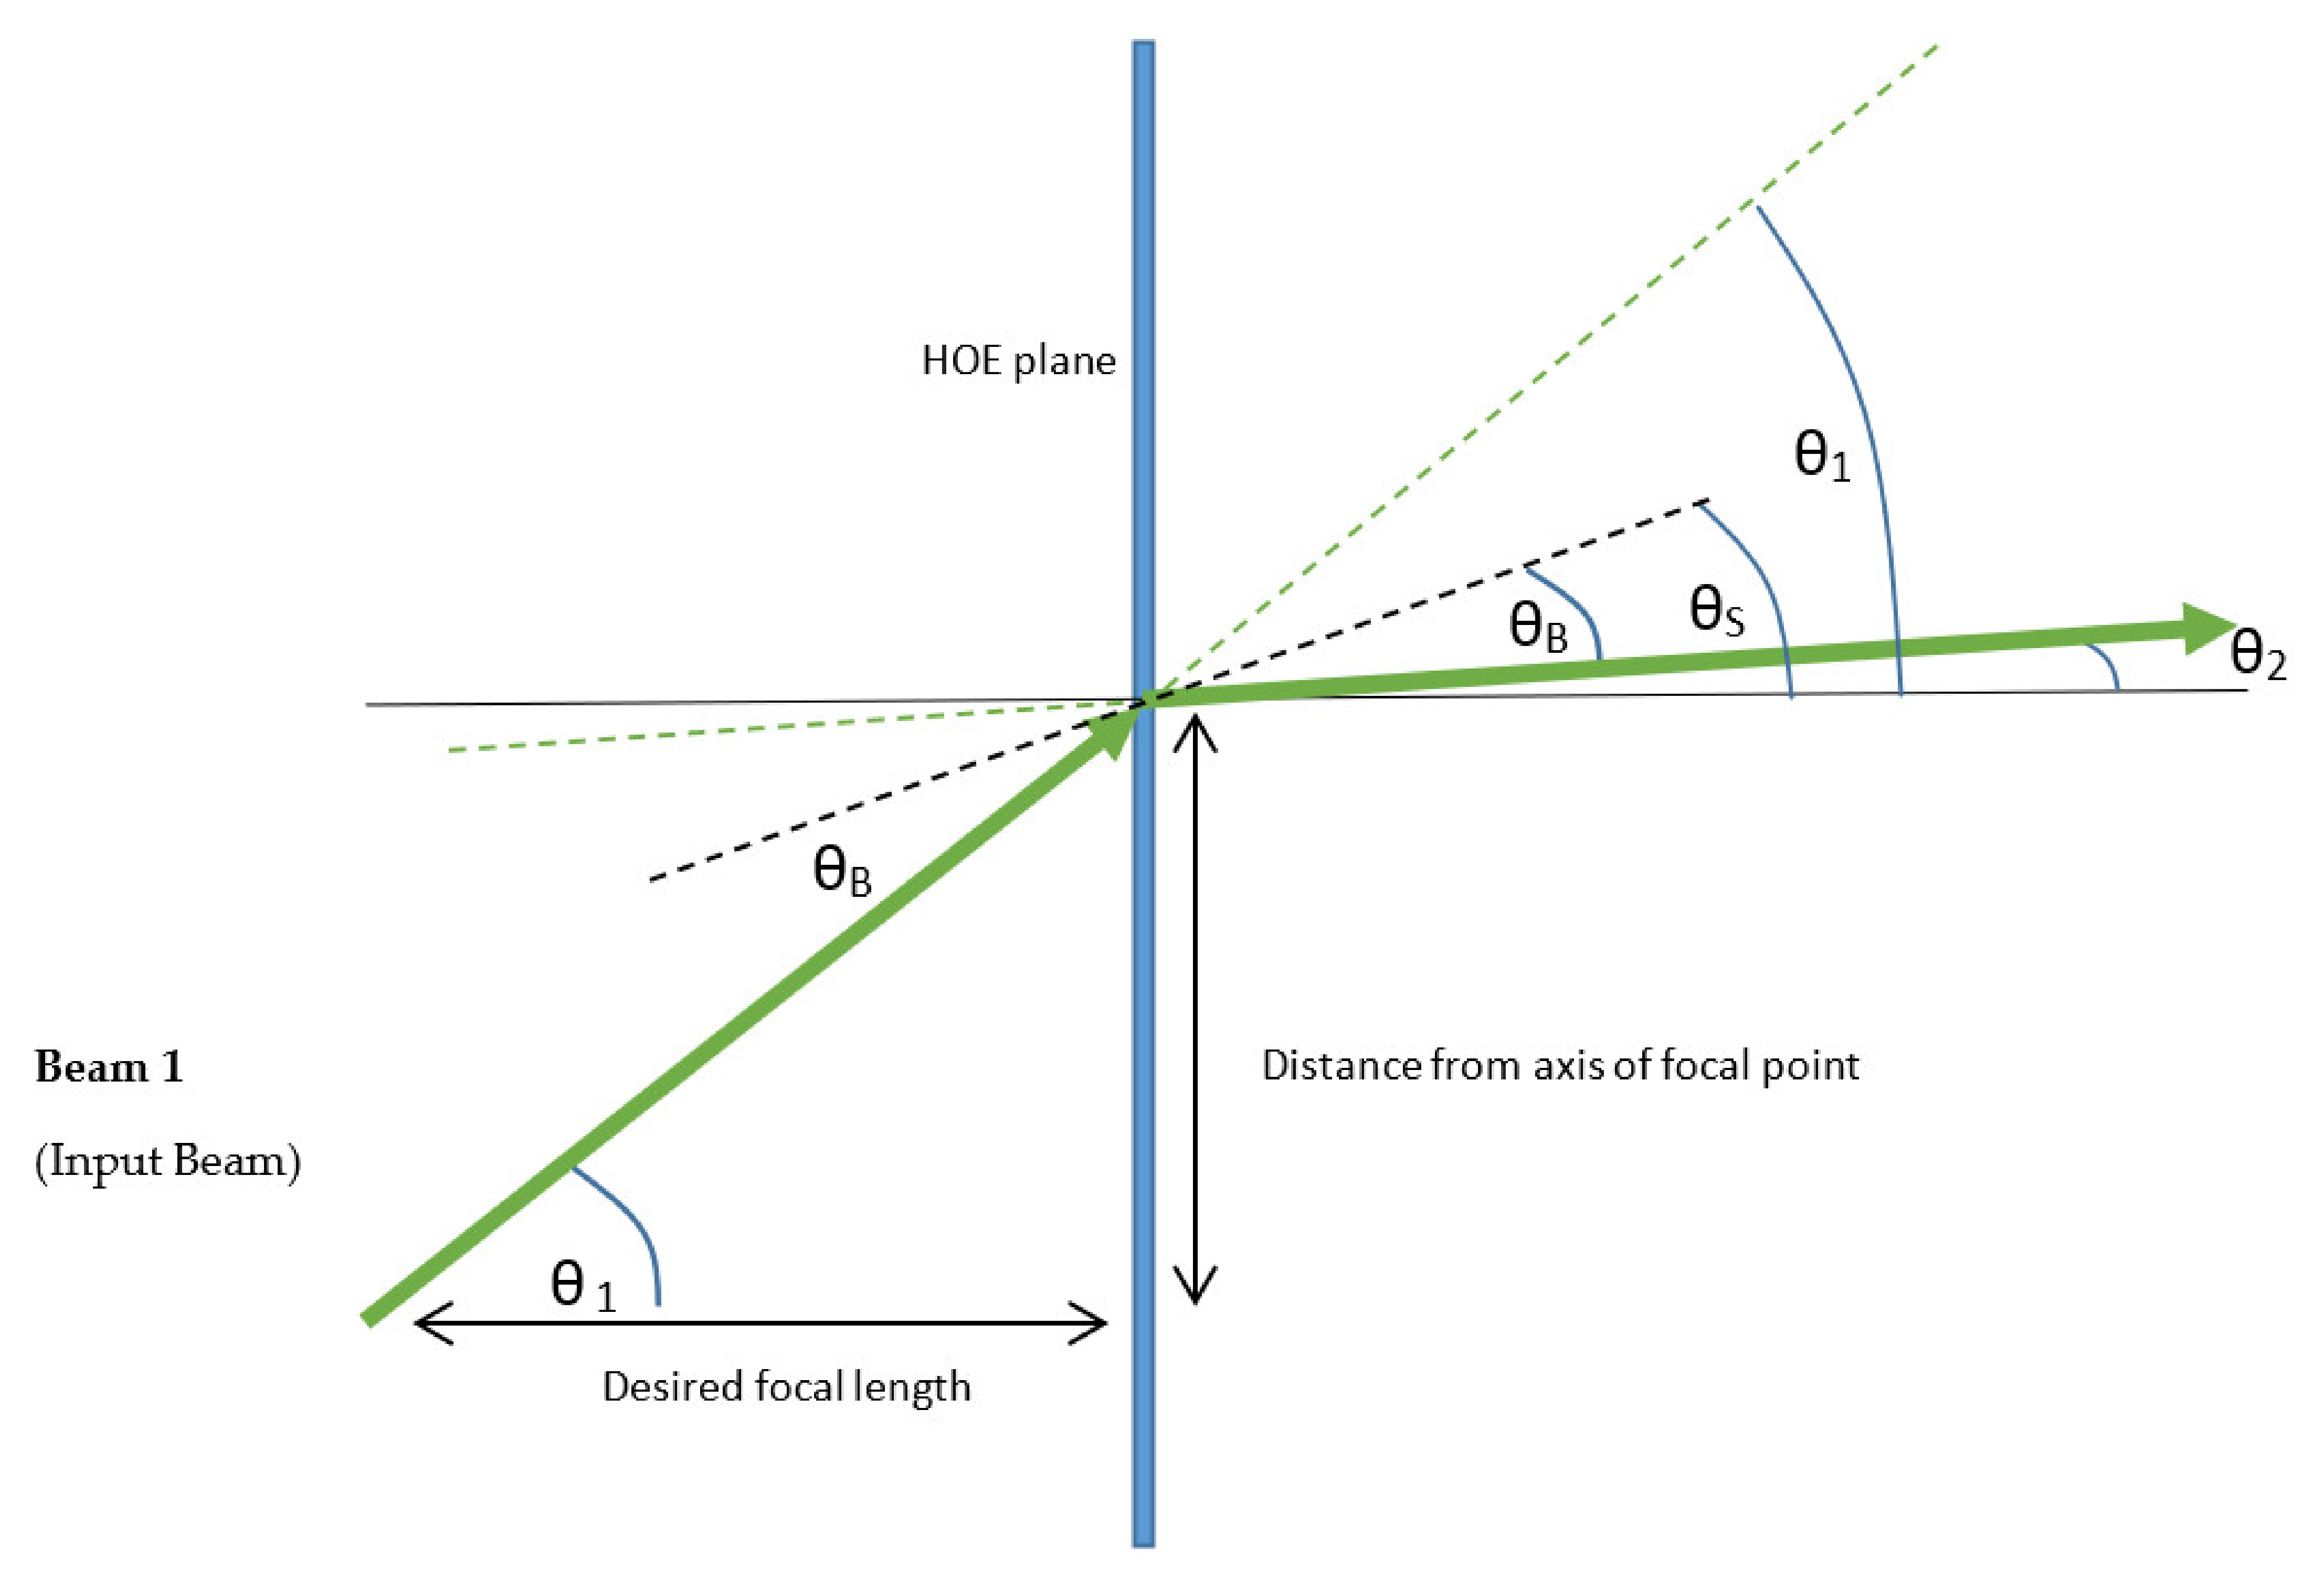
2.4. Modeling the Recorded Microstructure—Calculation of Slant and Spatial Frequency
3. Results
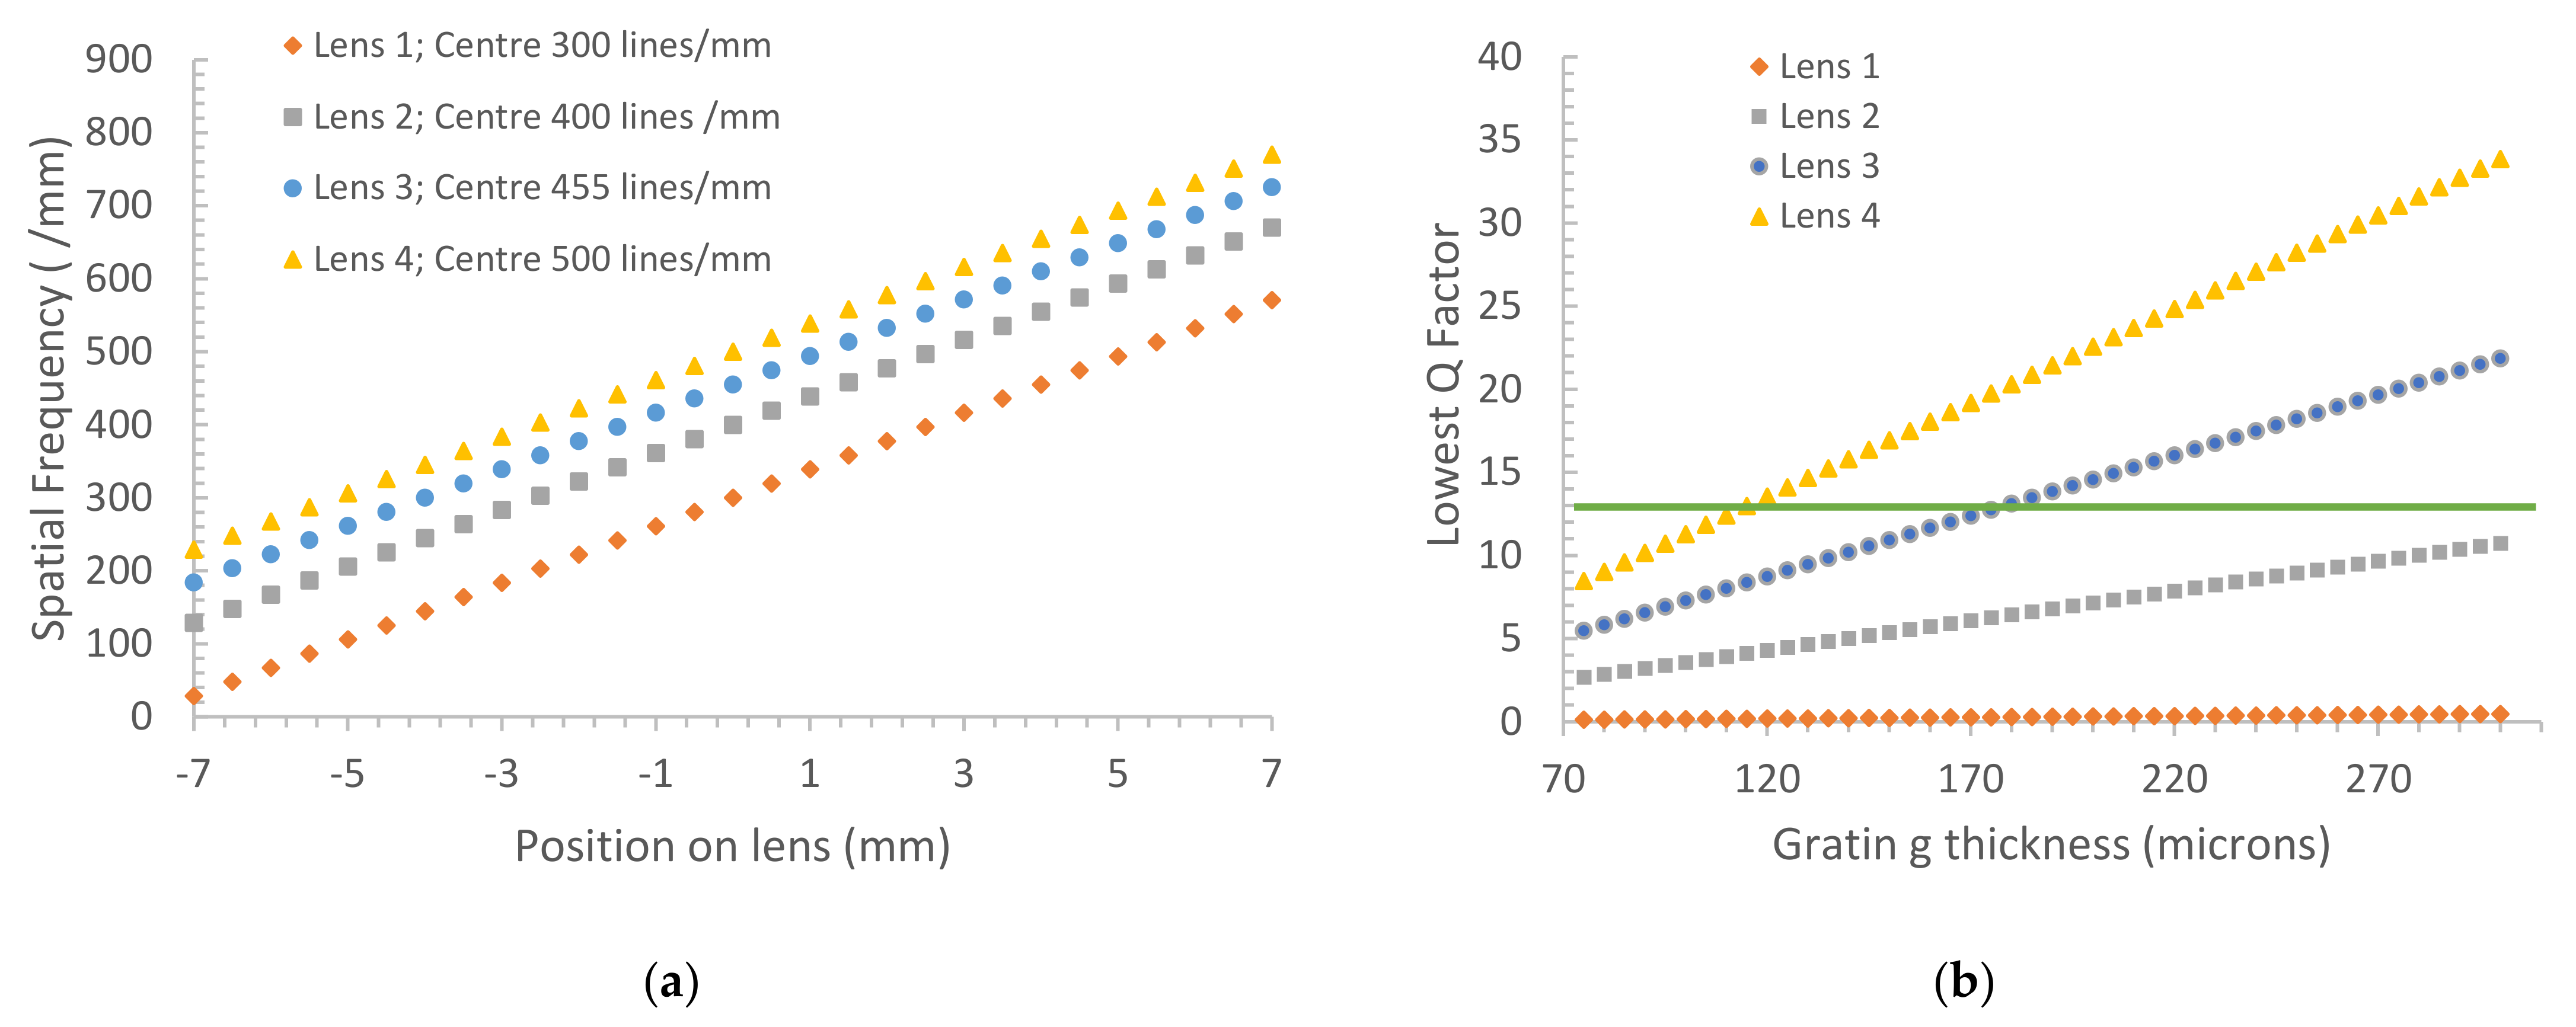
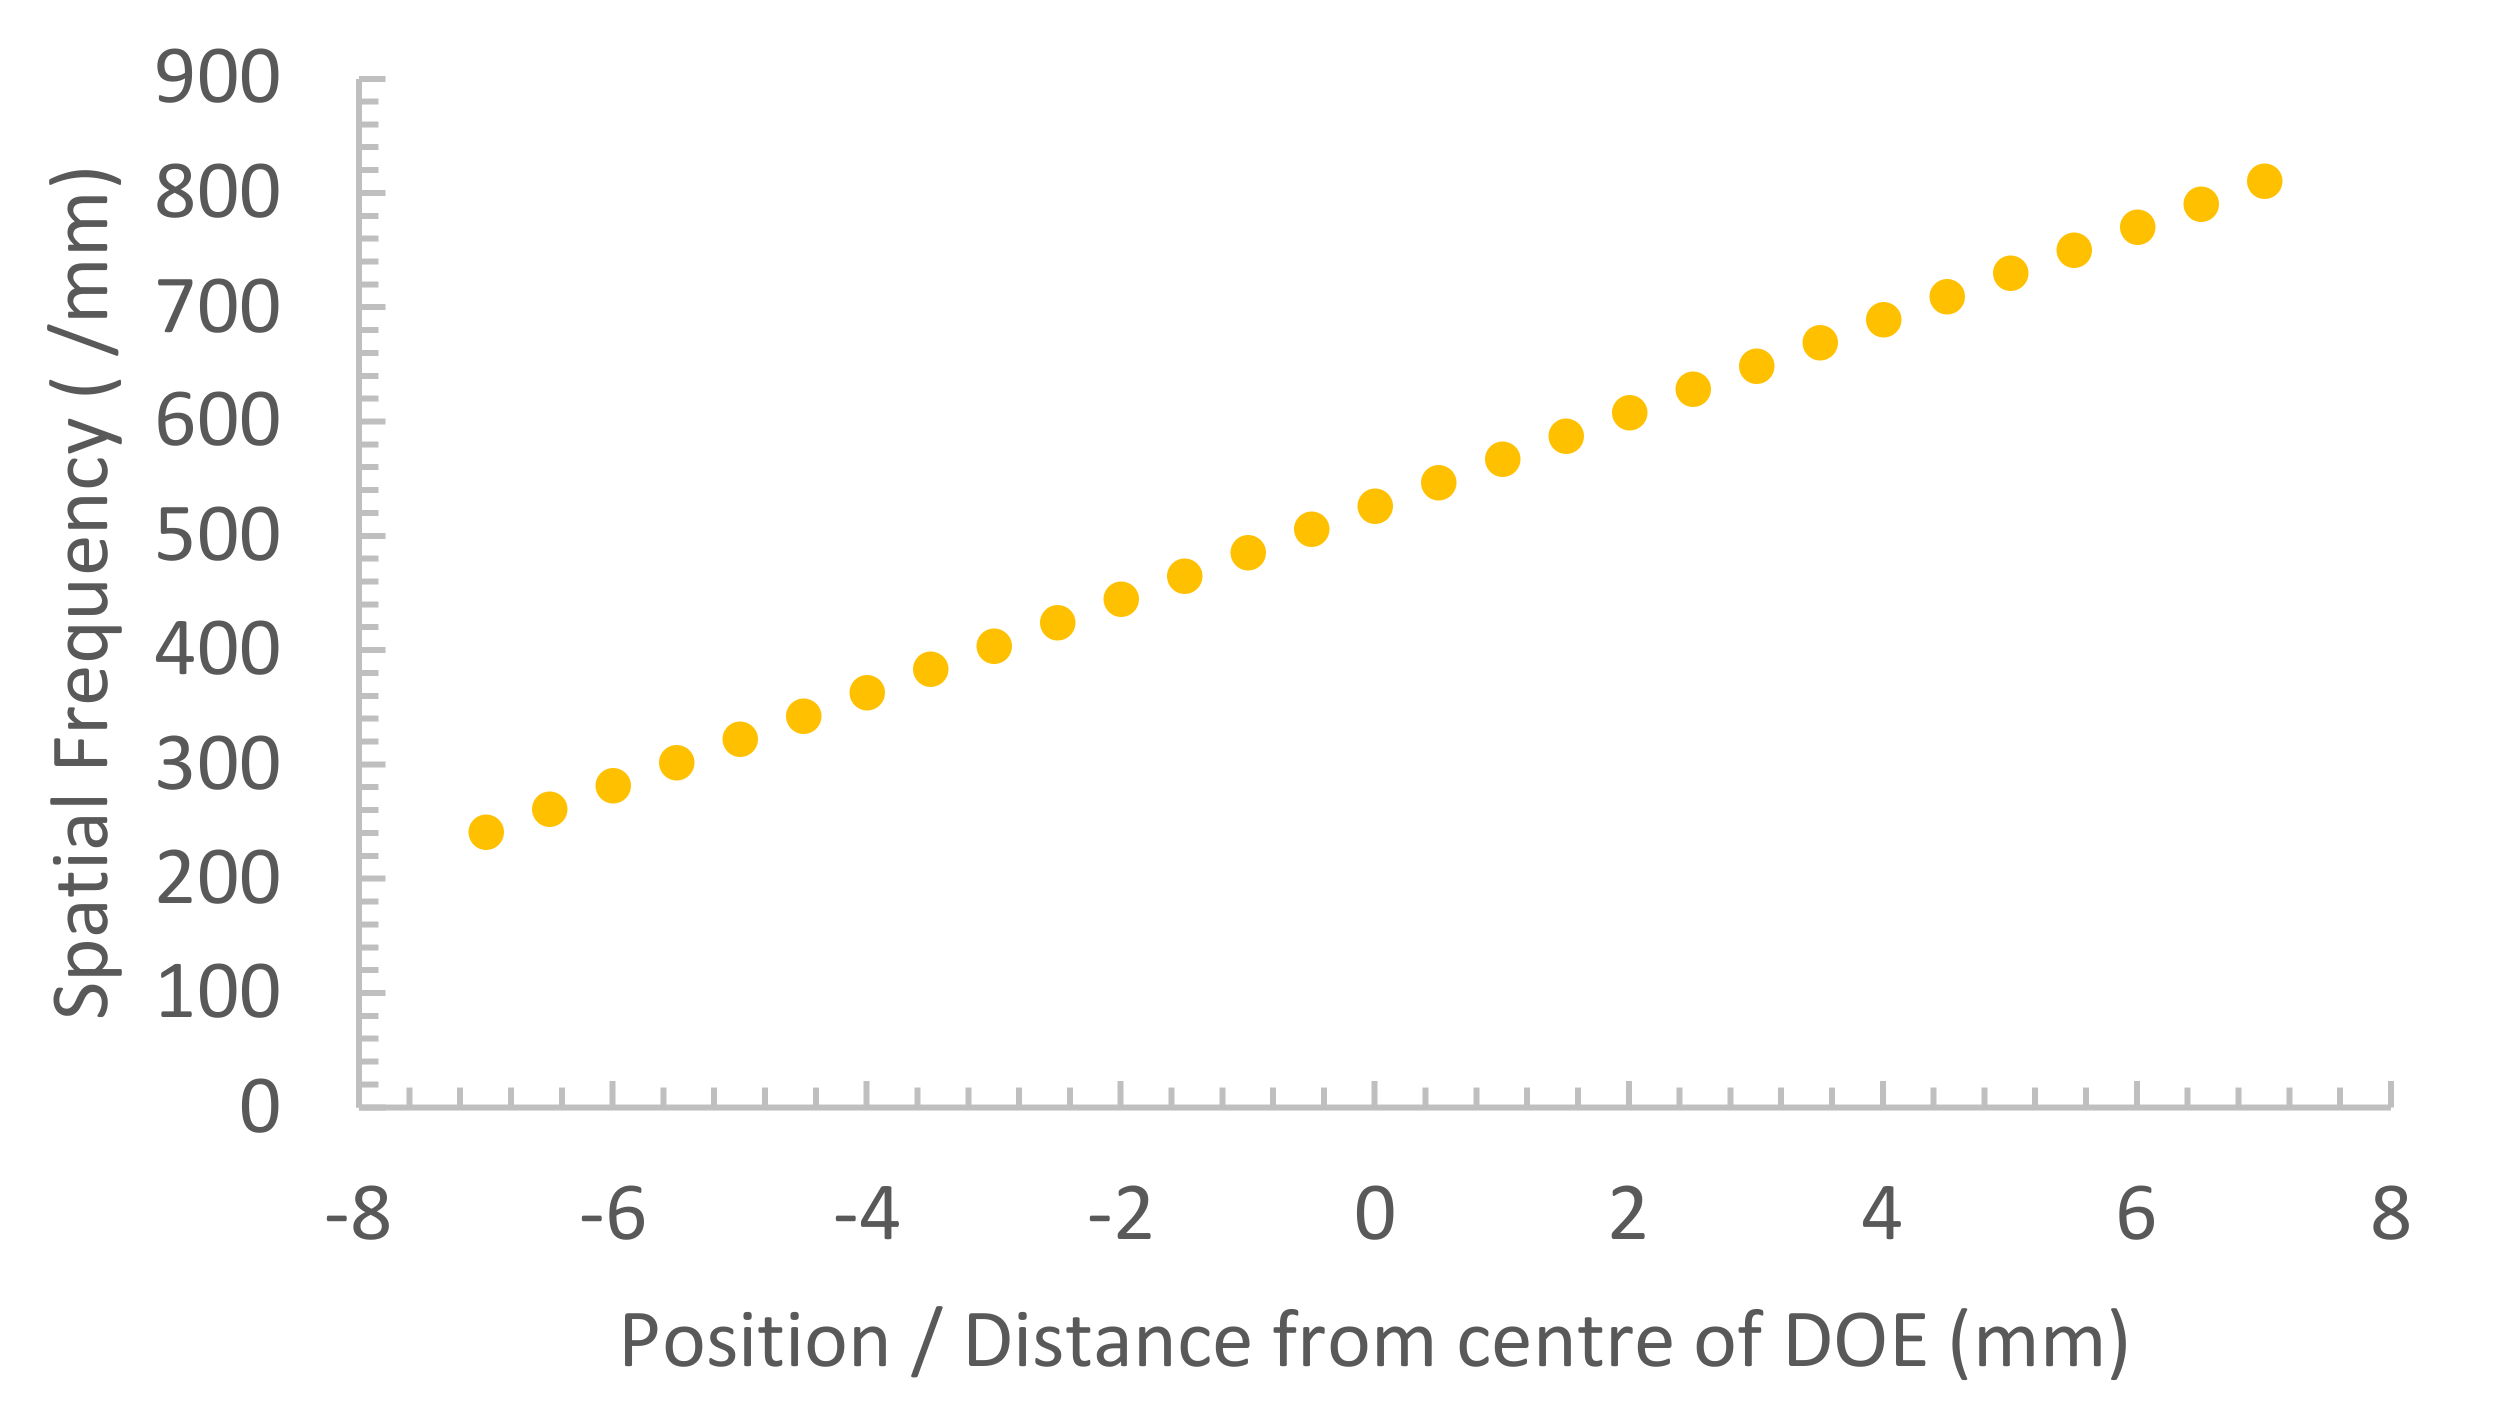
3.1. Modeling and Design of the Diffractive Optical Elements
- Photonic structure: Each grating needs to have a tailored range of spatial frequency and slant to produce correct output angle (at that wavelength) for every point on the diffractive lens (Equations (1) and (2))
- Single diffracted beam: The design needs to ensure that each grating is functioning as a volume grating at all points (to avoid multiple diffracted beams) (Equation (4))
- Grating strength: Each grating must have a specific Refractive Index Modulation to produce high DE for its target wavelength (Equation (3))
- Avoiding crosstalk: Each grating must have a sufficiently narrow angular and spectral selectivity curve so that each grating will only re-direct light of the wavelength that it is designed for.
3.1.1. Green Lens Design
3.1.2. Blue Lens Design
3.2. Optimization of the Acriflavine Based Photopolymer Layer
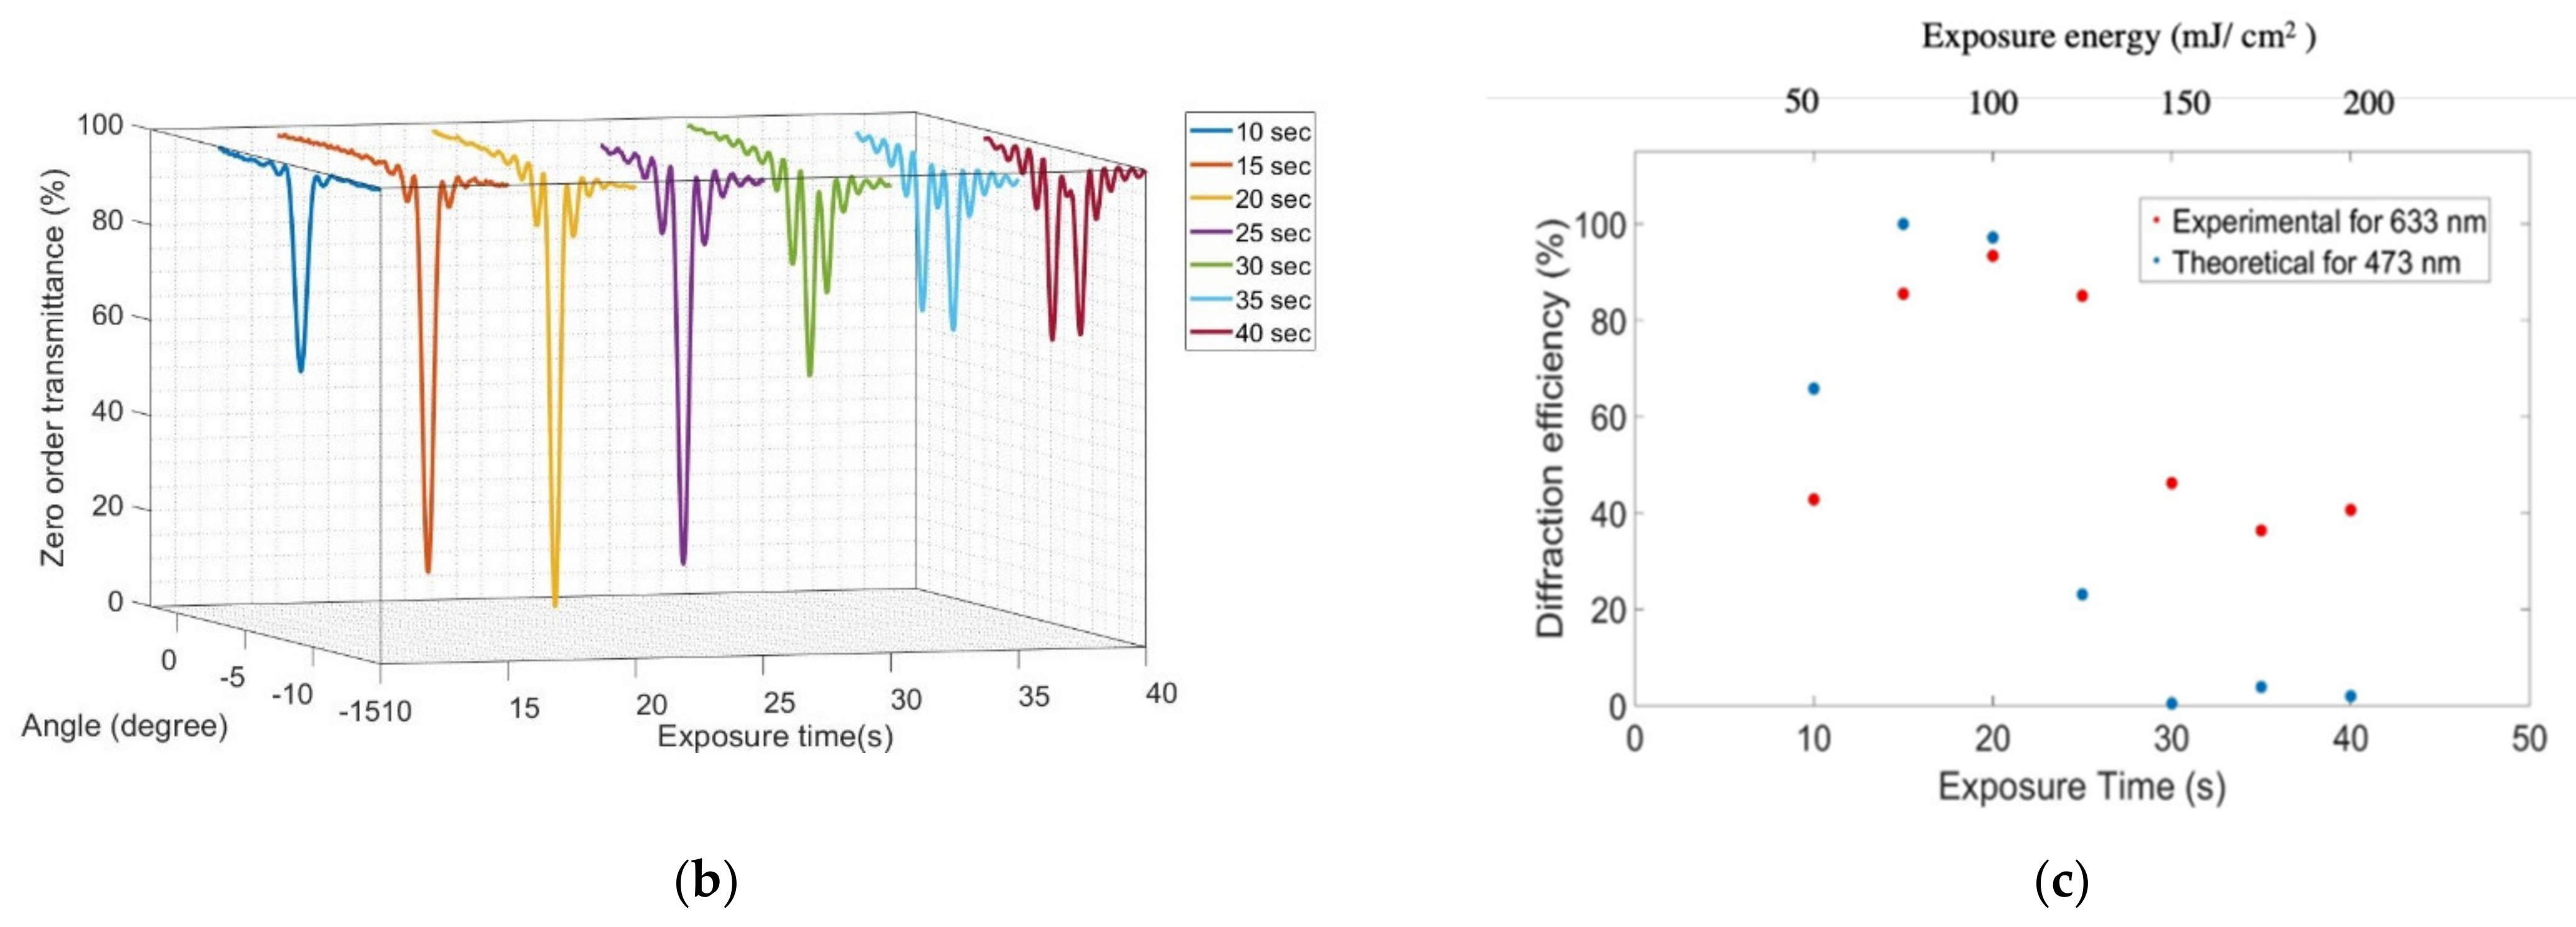
3.2.1. Optimization for Spatial Frequency
3.2.2. Optimization for 150 Micron Thick Layers
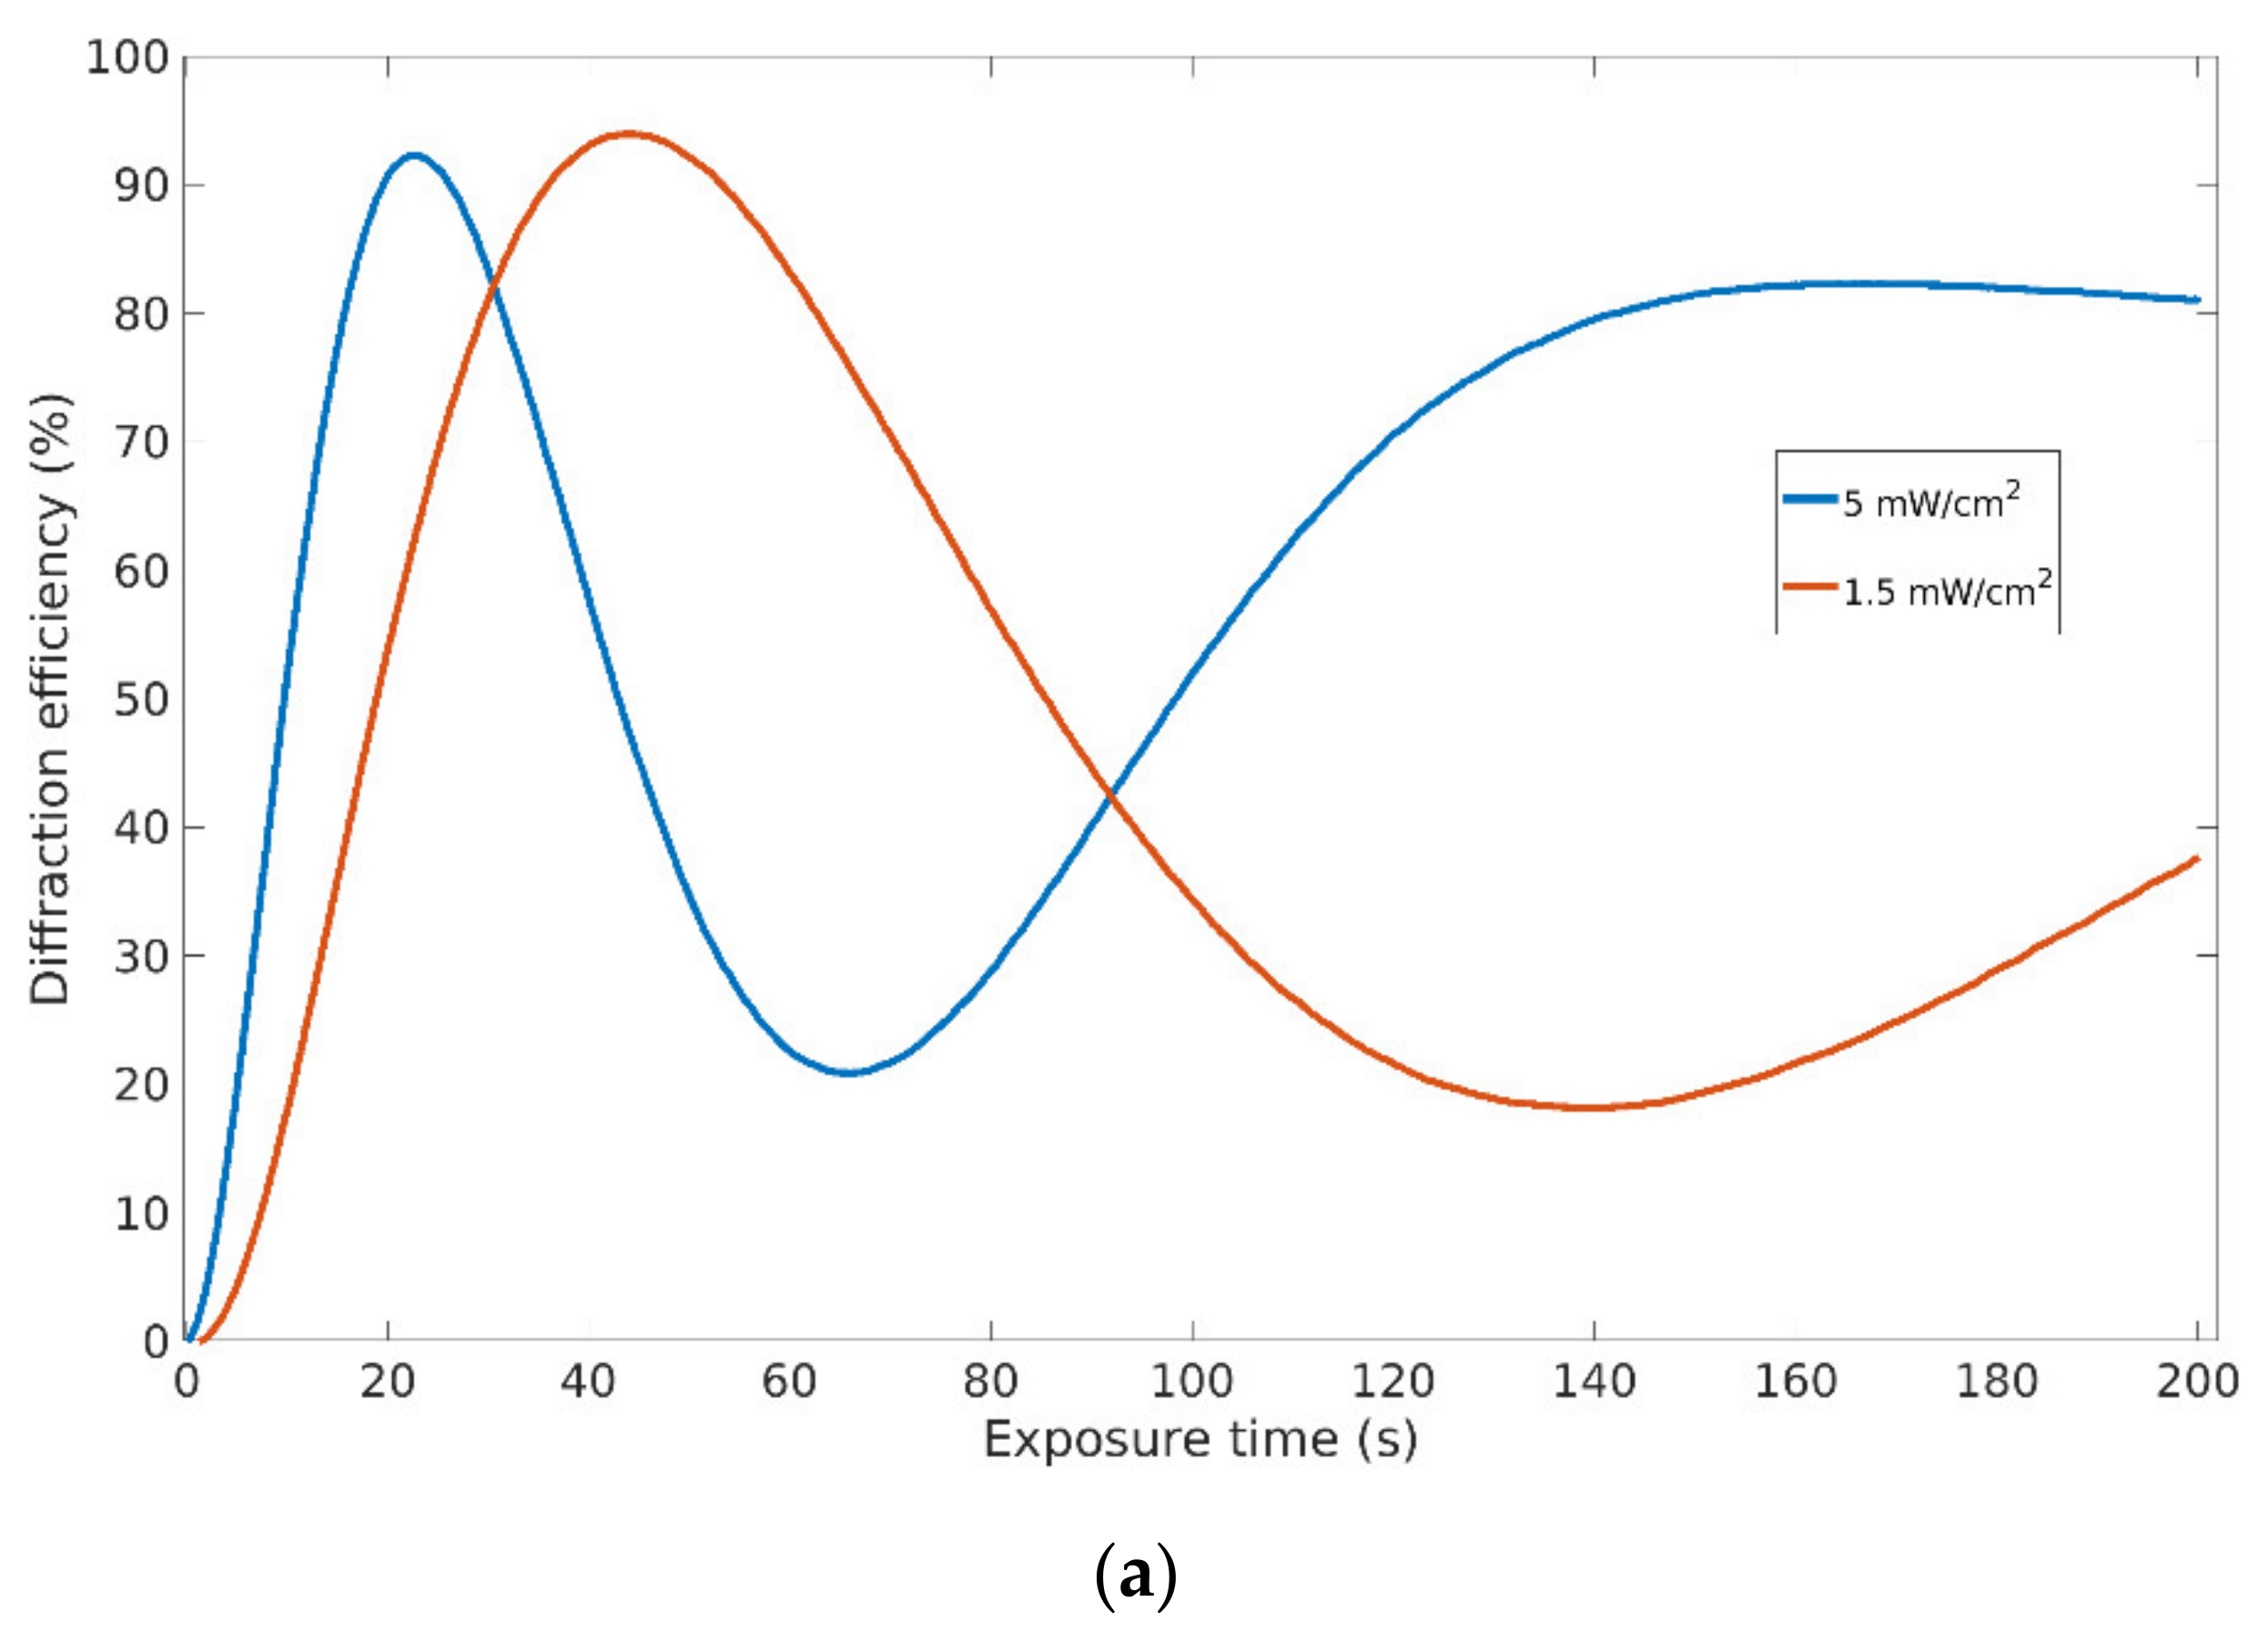
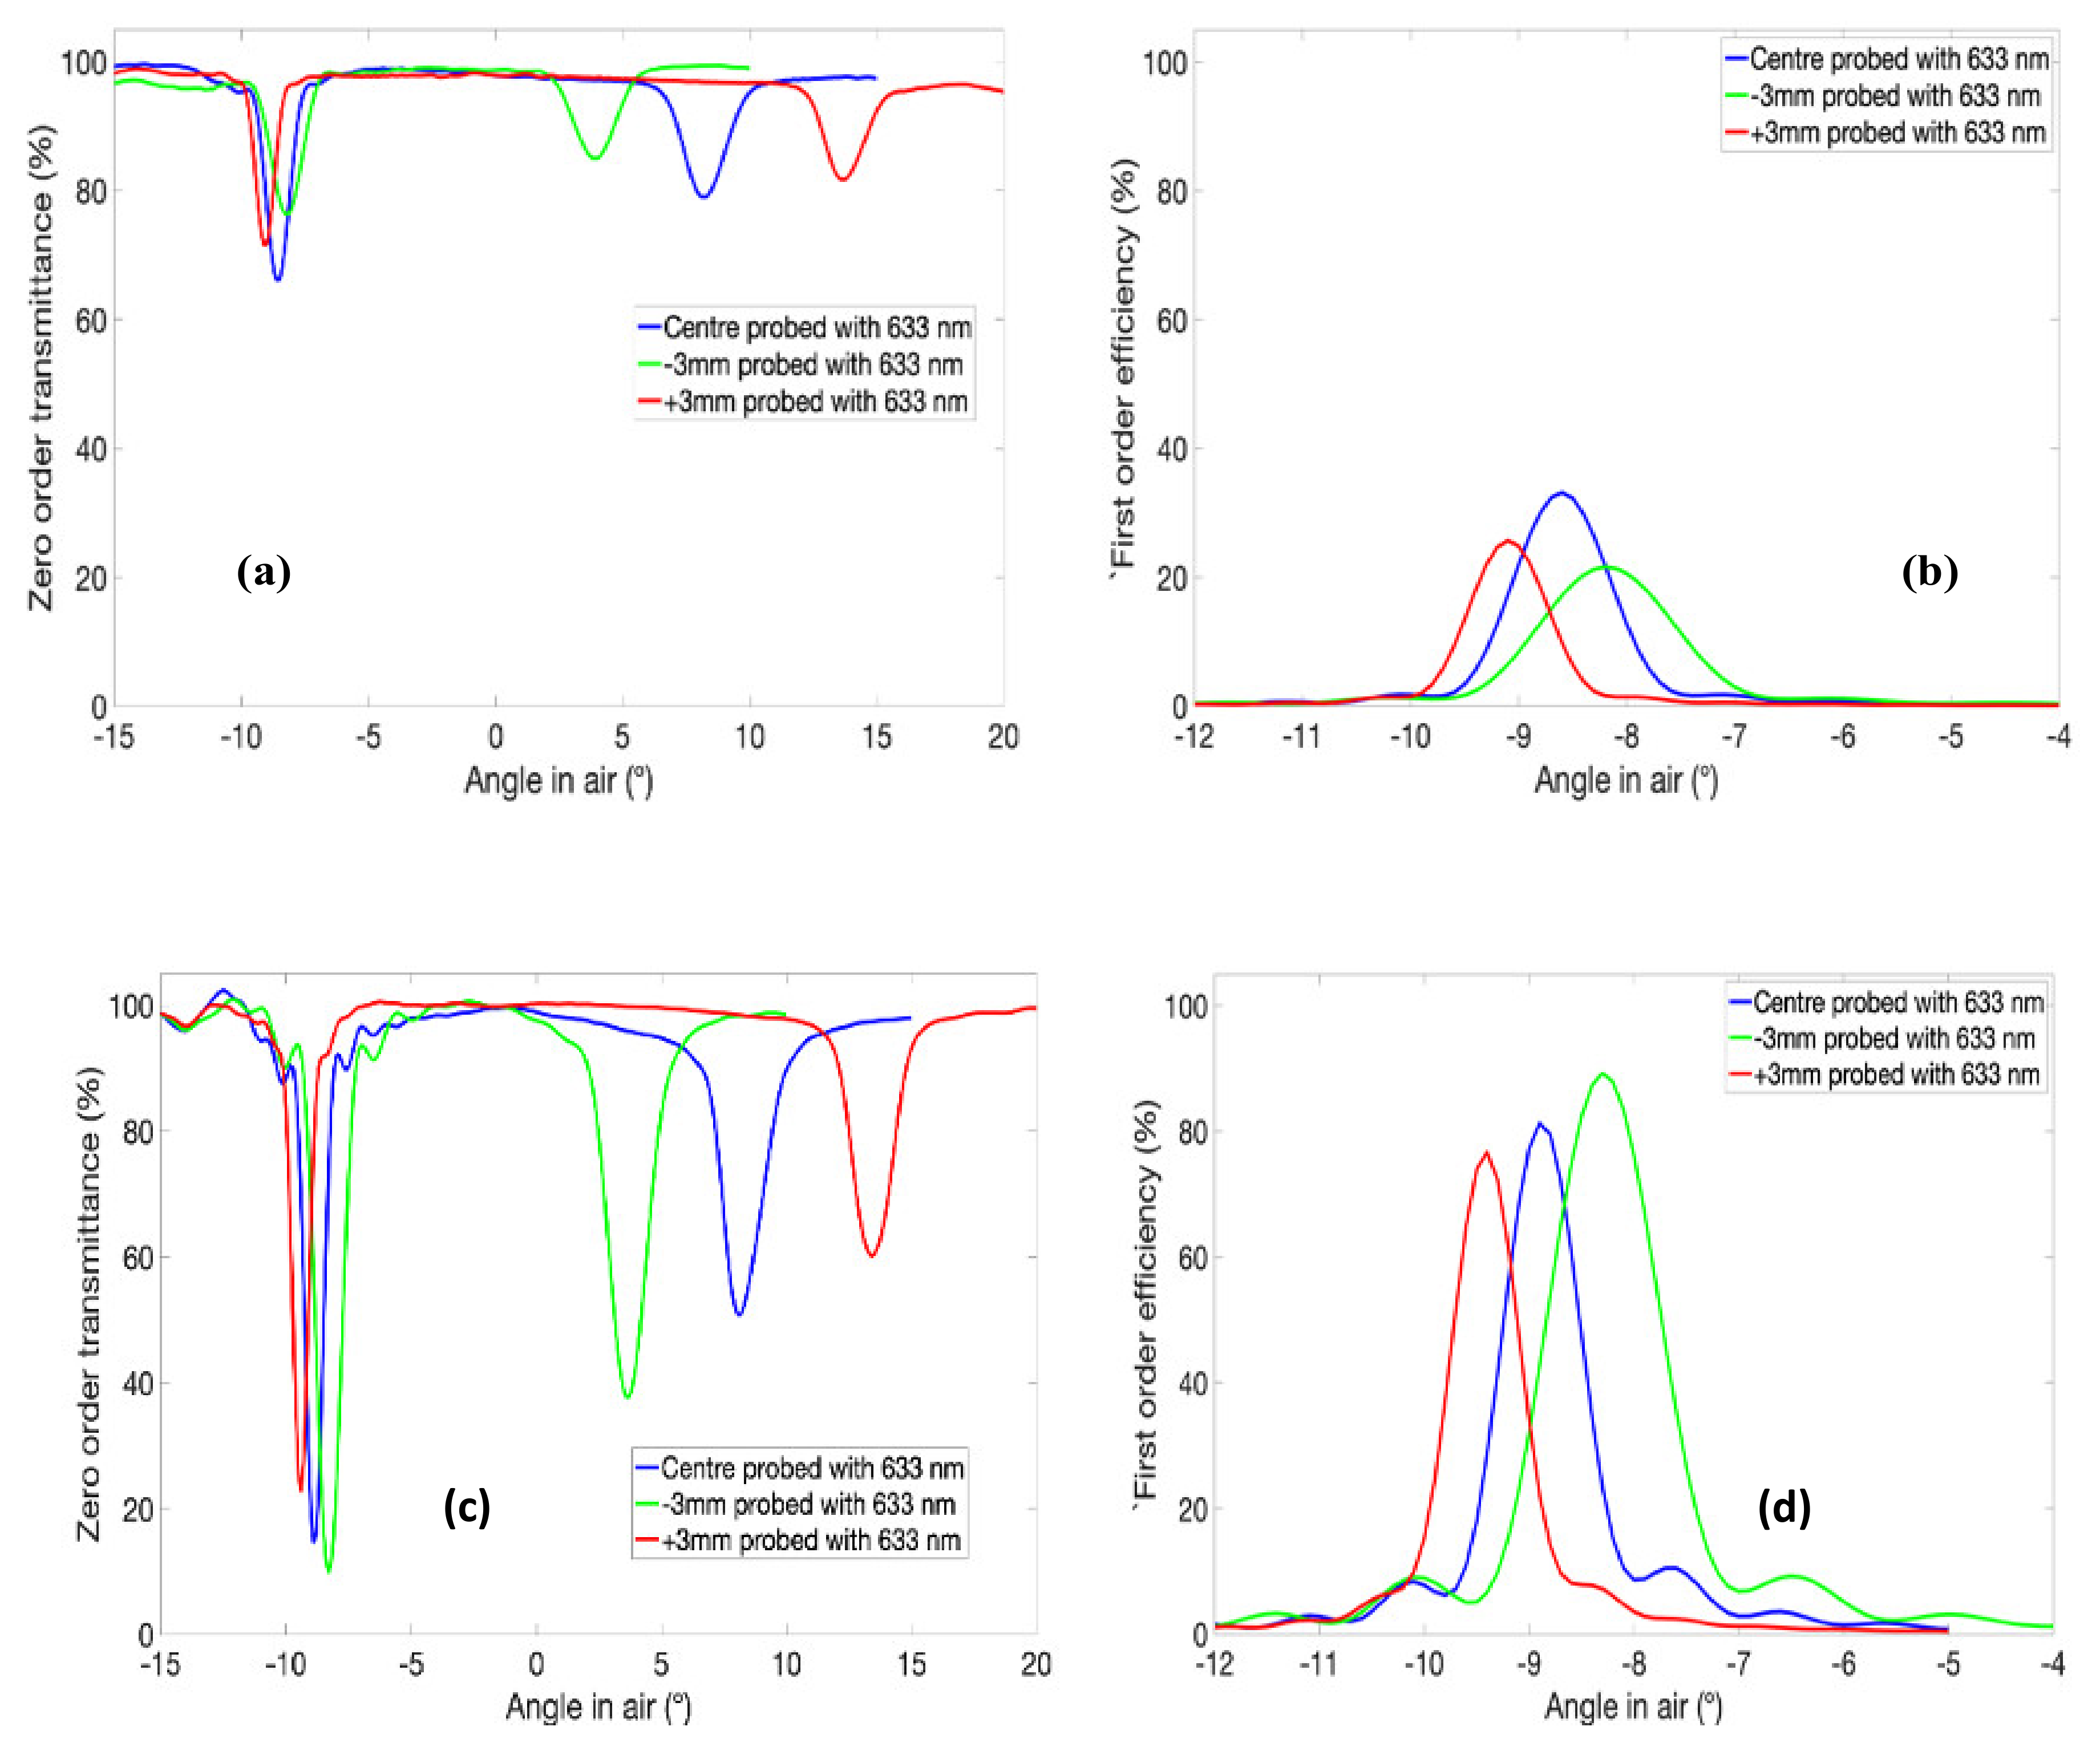
3.3. Optimization of the Holographic Recording Conditions for the Fabrication of Individual Lenses at Blue and Green Wavelengths
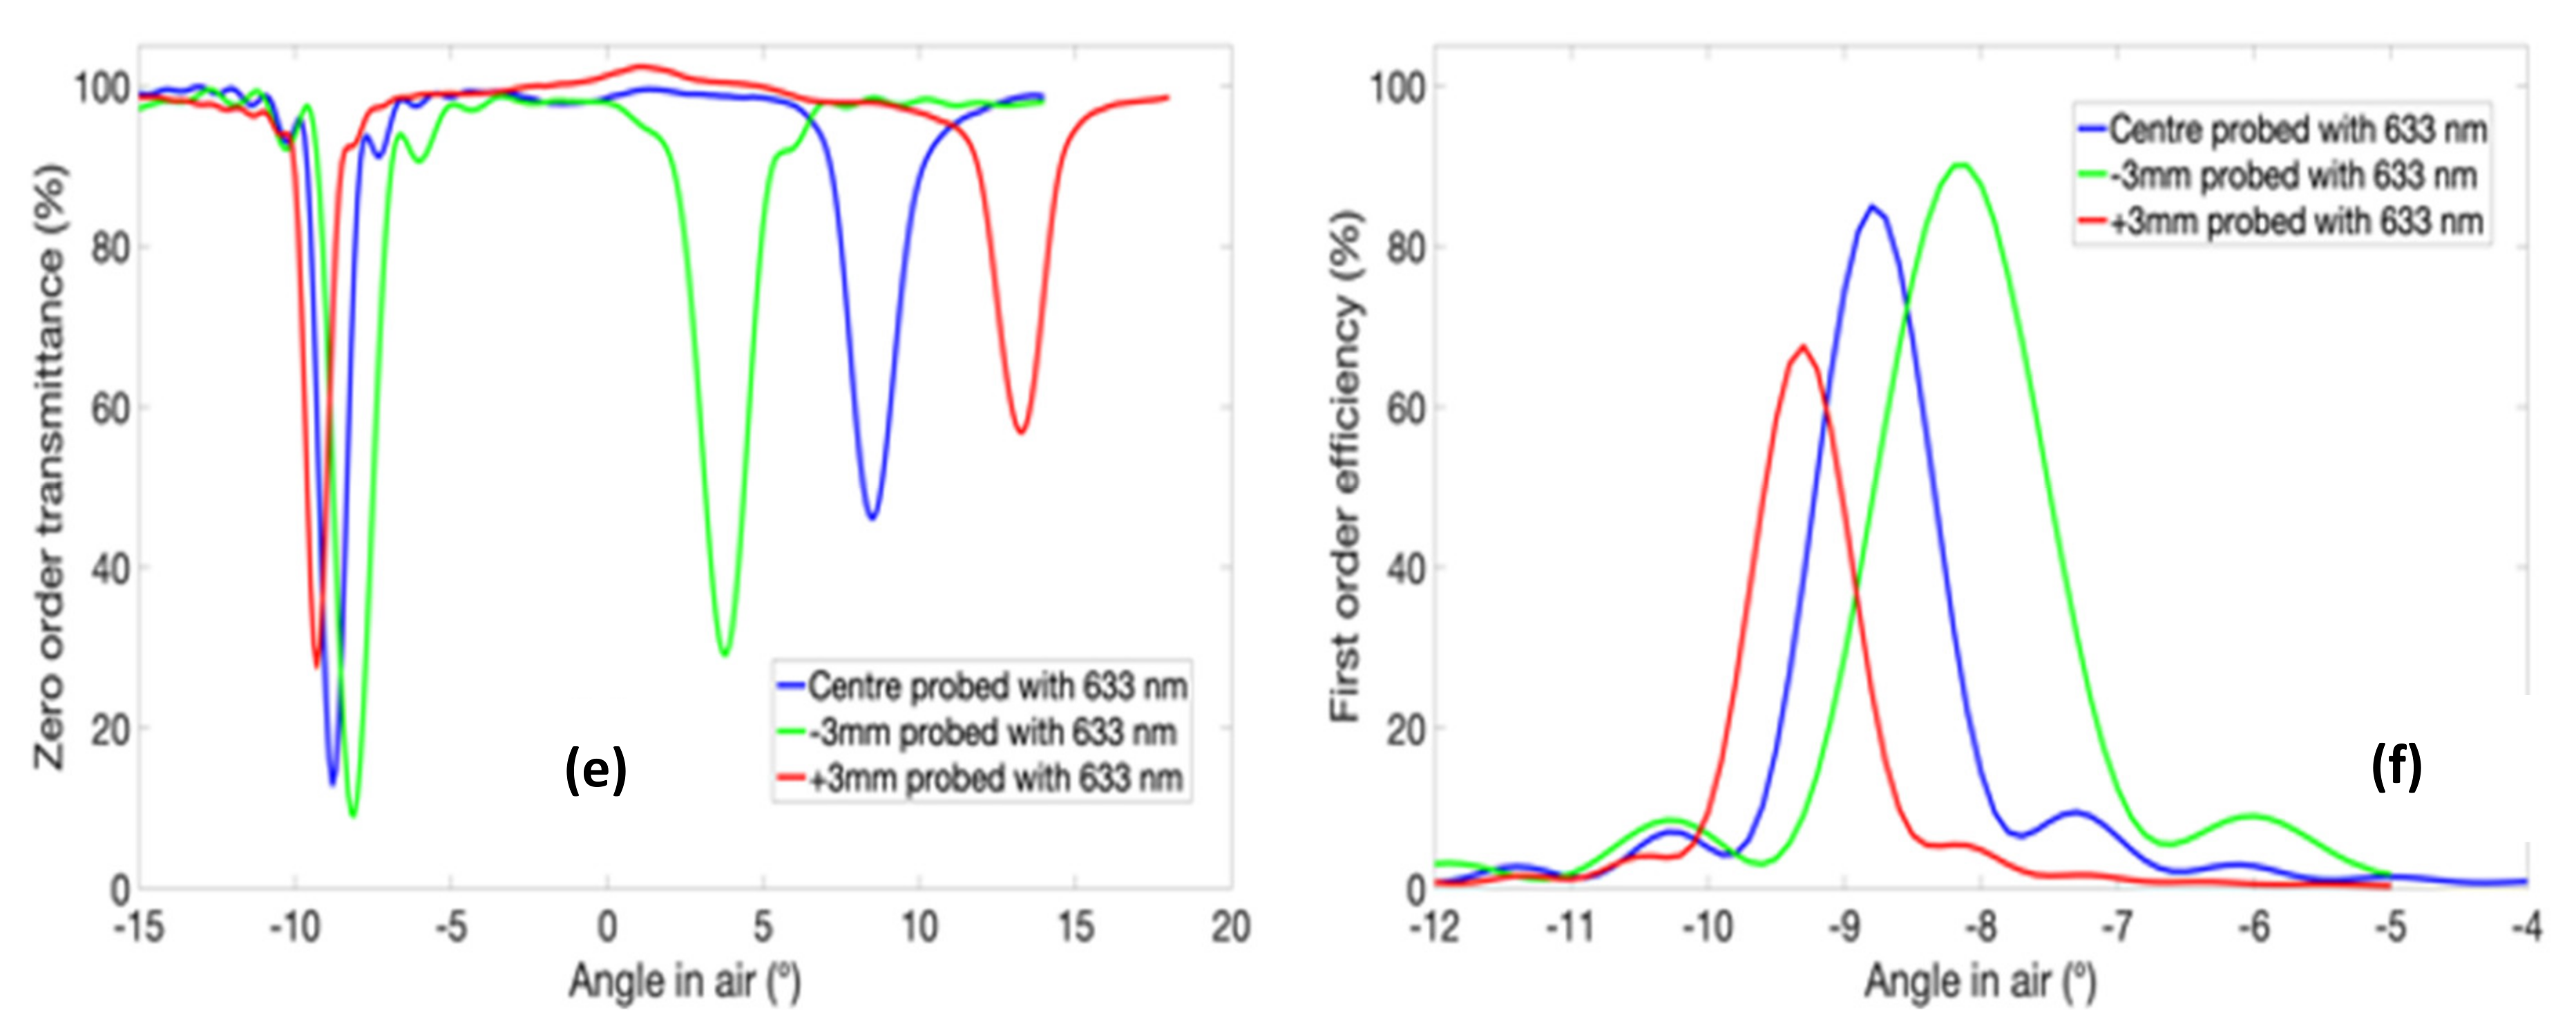
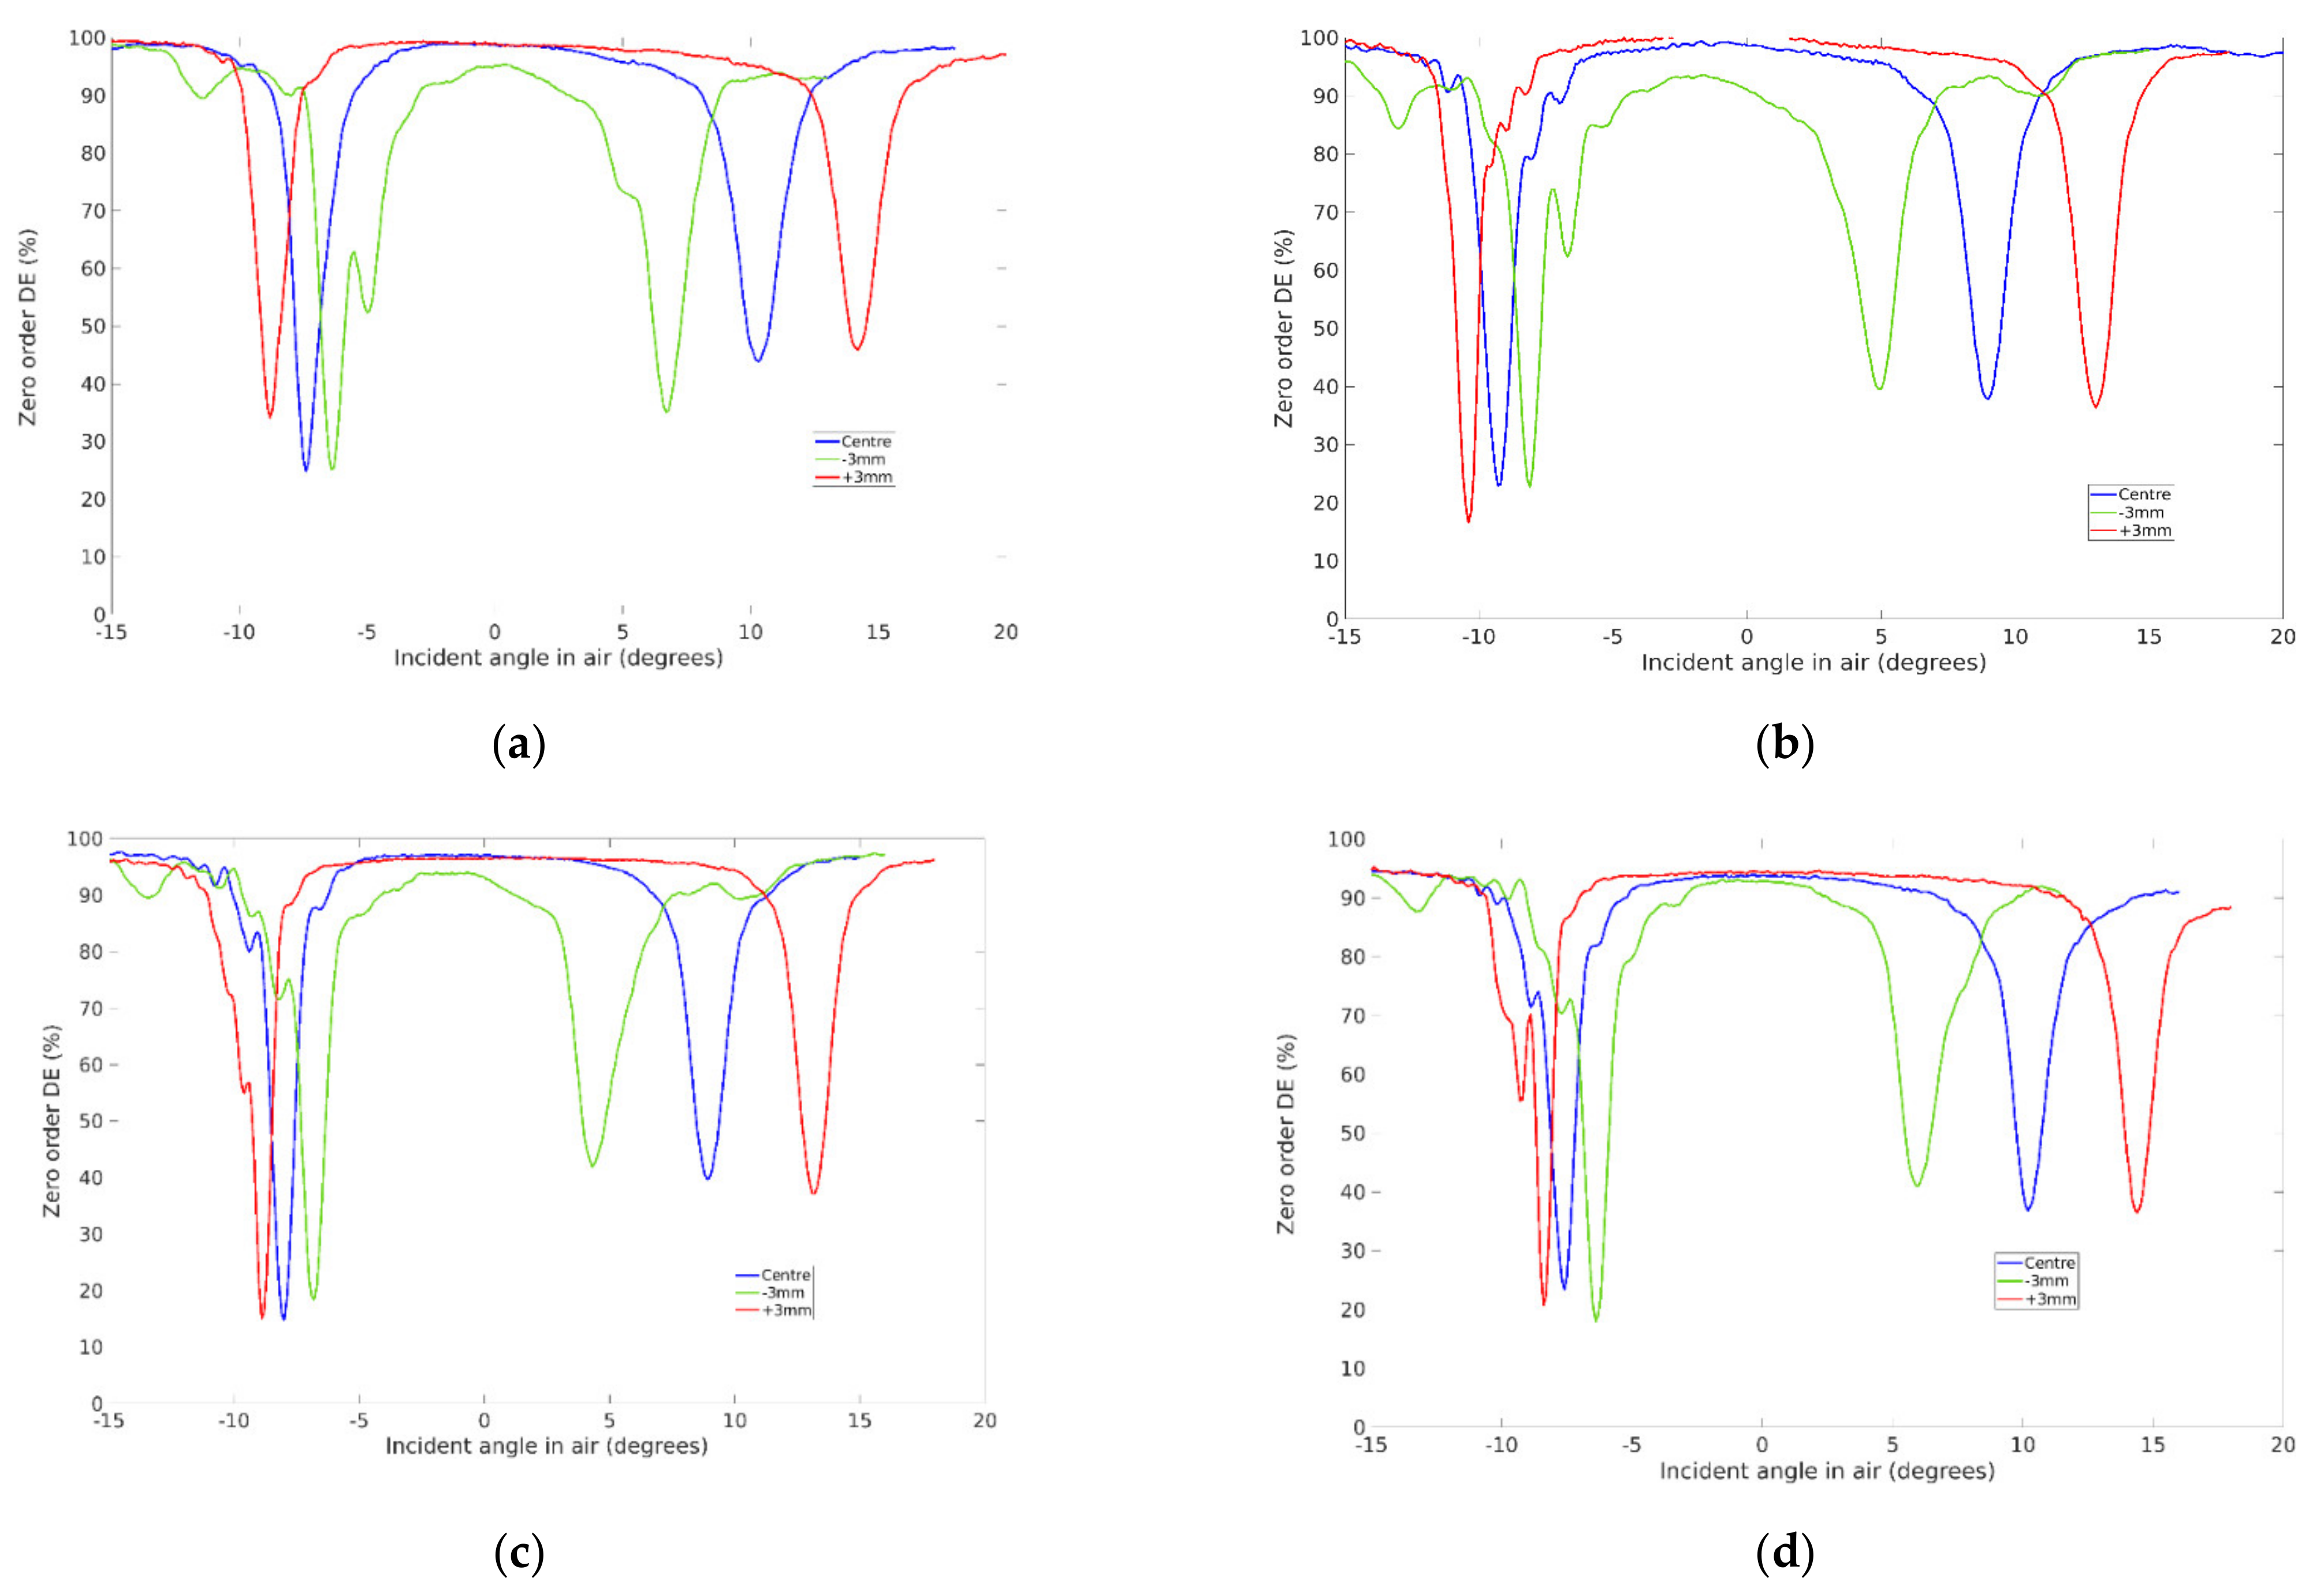
3.3.1. Recording and Characterization of Holographic Lens Designed for 488 nm
3.3.2. Recording and Characterization of Holographic Lens Designed for 514 nm
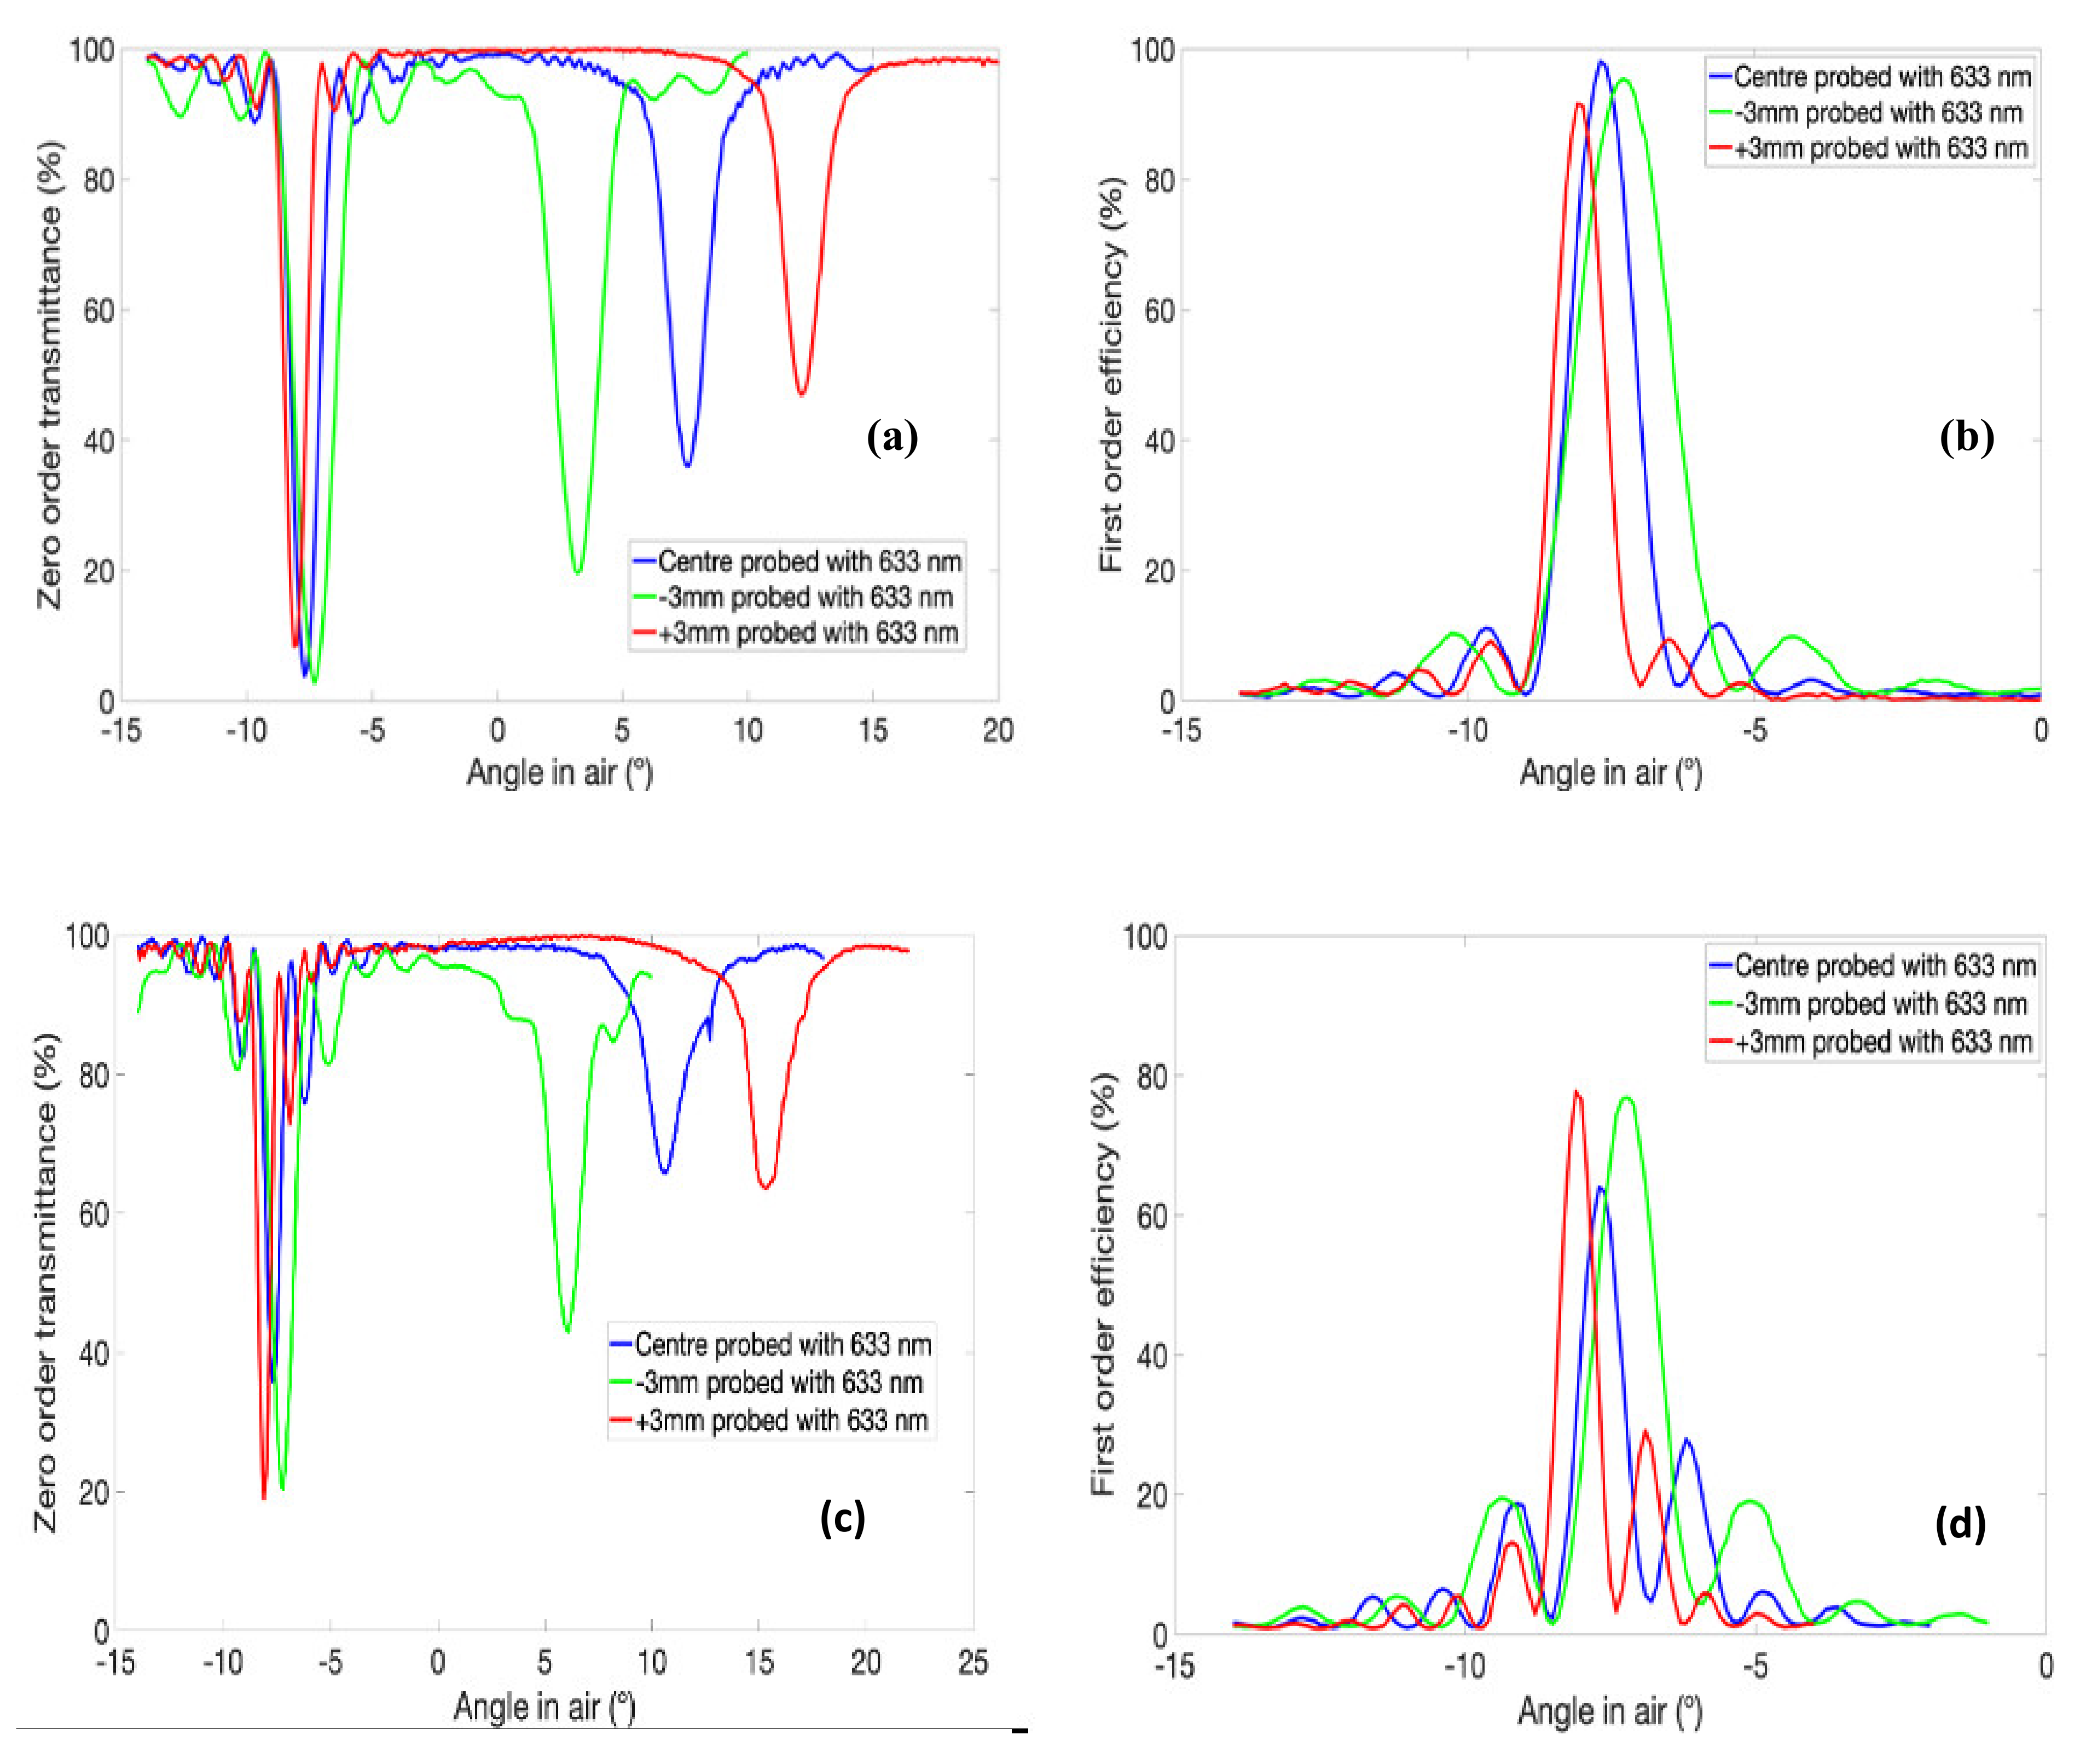
3.4. Two Lenses in Stacked in Dual-Sensitive Photopolymer Layer
4. Discussion
5. Conclusions
Author Contributions
Funding
Acknowledgments
Conflicts of Interest
References
- Kogelnik, H. Coupled Wave Theory for Thick Hologram Gratings. Bell Syst. Tech. J. 1969, 48, 2909–2947. [Google Scholar] [CrossRef]
- Close, D.H. Holographic Optical Elements. Opt. Eng. 1975, 14, 408–419. [Google Scholar] [CrossRef]
- Motogaito, A.; Machida, N.; Morikawa, T.; Manabe, K.; Miyake, H.; Hiramatsu, K. Fabrication of a binary diffractive lens for controlling the luminous intensity distribution of LED light. Opt. Rev. 2009, 16, 455–457. [Google Scholar] [CrossRef]
- Mohammad, N.; Meem, M.; Wan, X.; Menon, R. Full-color, large area, transmissive holograms enabled by multi-level diffractive optics. Sci. Rep. 2017, 7, 1–6. [Google Scholar] [CrossRef] [PubMed]
- Baldry, I.; Bland-Hawthorn, J.; Robertson, J.G. Volume Phase Holographic Gratings: Polarization Properties and Diffraction Efficiency. Publ. Astron. Soc. Pac. 2004, 116, 403–414. [Google Scholar] [CrossRef]
- Bruder, F.K.; Fäcke, T.; Rölle, T. The Chemistry and Physics of Bayfol® HX Film Holographic Photopolymer. Polymers 2017, 9, 472. [Google Scholar] [CrossRef]
- Martin, S.; Akbari, H.; Keshri, S.; Bade, D.; Naydenova, I.; Murphy, K.; Toal, V. Holographically Recorded Low Spatial Frequency Volume Bragg Gratings and Holographic Optical Elements. Hologr. Mater. Opt. Syst. 2017. [Google Scholar] [CrossRef]
- Wang, H.; Wang, J.; Liu, H.; Yu, D.; Sun, X.; Zhang, J. Study of effective optical thickness in photopolymer for application. Opt. Lett. 2012, 37, 2241–2243. [Google Scholar] [CrossRef]
- Bianco, G.; Ferrara, M.A.; Borbone, F.; Roviello, A.; Striano, V.; Coppola, G. Photopolymer-based volume holographic optical elements: Design and possible applications. J. Eur. Opt. Soc. Rapid Publ. 2015, 10, 15057. [Google Scholar] [CrossRef]
- Marín-Sáez, J.; Atencia, J.; Chemisana, D.; Collados, M.-V. Characterization of volume holographic optical elements recorded in Bayfol HX photopolymer for solar photovoltaic applications. Opt. Express 2016, 24, A720–A730. [Google Scholar] [CrossRef]
- Orselli, E.; Zanutta, A.; Bianco, A.; Karafolas, N.; Cugny, B.; Sodnik, Z.; Fäcke, T. Photopolymer materials for volume phase holographic optical elements. In Proceedings of the International Conference on Space Optics Vol. 10562—ICSO 2016, Biarritz, France, 18–21 October 2016. [Google Scholar]
- Han, J.; Liu, J.; Yao, X.; Wang, Y. Portable waveguide display system with a large field of view by integrating freeform elements and volume holograms. Opt. Express 2015, 23, 3534–3549. [Google Scholar] [CrossRef]
- Khan, M.S.; Rahlves, M.; Lachmayer, R.; Roth, B. Polymer-based diffractive optical elements for rear end automotive applications: Design and fabrication process. Appl. Opt. 2018, 57, 9106–9113. [Google Scholar] [CrossRef]
- Marín-Sáez, J.; Keshri, S.; Naydenova, I.; Murphy, K.; Atencia, J.; Chemisana, D.; Garner, S.; Collados, M.V.; Martin, S. Stacked holographic optical elements for solar concentration. In Proceedings of the Photonics Ireland Conference, Cork, Ireland, 3–5 September 2018. [Google Scholar]
- Piao, M.L.; Kwon, K.C.; Kang, H.J.; Lee, K.Y.; Kim, N. Full-color holographic diffuser using time-scheduledmiterative exposure. Appl. Opt. 2015, 54, 5252–5259. [Google Scholar] [CrossRef]
- Shen, Z.; Lan, T.; Wang, L.; Ni, G. Color demultiplexer using angularly multiplexed volume holograms as a receiver optical end for VLC based on RGB white LED. Opt. Commun. 2014, 333, 139–145. [Google Scholar] [CrossRef]
- Avayu, O.; Almeida, E.; Prior, Y.; Ellenbogen, T. Composite functional metasurfaces for multispectral achromatic optics. Nat. Commun. 2017, 8, 14992. [Google Scholar] [CrossRef] [PubMed]
- Hong, K.; Yeom, J.; Jang, C.; Hong, J.; Lee, B. Full-color lens-array holographic optical element for three-dimensional optical see-through augmented reality. Opt. Lett. 2014, 39, 127–130. [Google Scholar] [CrossRef]
- Malallah, R.; Li, H.; Qi, Y.; Cassidy, D.; Muniraj, I.; Al-Attar, N.; Sheridan, J.T. Improving the uniformity of holographic recording using multi-layer photopolymer: Part II Experimental results. J. Opt. Soc. Am. A 2019, 36, 334–344. [Google Scholar] [CrossRef] [PubMed]
- Meka, C.; Jallapuram, R.; Naydenova, I.; Martin, S.; Toal, V. Development of a panchromatic acrylamide-based photopolymer for multicolor reflection holography. Appl. Opt. 2010, 49, 1400–1405. [Google Scholar] [CrossRef] [PubMed]
- Mahamat, A.H.; Narducci, F.A.; Schwiegerling, J. Design and optimization of a volume-phase holographic grating for simultaneous use with red, green, and blue light using unpolarized light. Appl. Opt. 2016, 55, 1618–1624. [Google Scholar] [CrossRef]
- Jauncey, G.E.M. The Scattering of X-Rays and Bragg’s Law. Proc. Natl. Acad. Sci. USA 1924, 10, 57–60. [Google Scholar] [CrossRef]
- Moharam, M.G.; Young, L. Criterion for Bragg and Raman-Nath diffraction regimes. Appl. Opt. 1978, 17, 1757–1759. [Google Scholar] [CrossRef] [PubMed]
- Keshri, S.; Murphy, K.; Toal, V.; Naydenova, I.; Martin, S. Development of a photopolymer holographic lens for collimation of light from a green light-emitting diode. Appl. Opt. 2018, 57, E163–E172. [Google Scholar] [CrossRef] [PubMed]
- Akbari, H.; Naydenova, I.; Martin, S. Using acrylamide-based photopolymers for fabrication of holographic optical elements in solar energy applications. Appl. Opt. 2014, 53, 1343–1353. [Google Scholar] [CrossRef] [PubMed]
- Pramitha, V. A New Metal Ion Doped Panchromatic Photopolymer for Holographic Applications. Ph.D. Thesis, Cochin University of Science and Technology, Cochin, India, November 2011. Available online: dyuthi.cusat.ac.in/purl/2357 (accessed on 1 May 2021).
- Meka, C. Development of Acrylamide Based Photopolymer for Full Colour Display Holography. Ph.D. Thesis, Technological University Dublin, Dublin, Ireland, 2010. [Google Scholar] [CrossRef]


| Surface DOEs | Volume DOEs | |
|---|---|---|
| Fabrication | Multiple steps, including wet processing | Single step (self-processing photopolymers) |
| Protection and Stacking | More difficult since the pattern is on the surface | Easier, the pattern is in the volume |
| Diffraction Efficiency | For sinusoidal profiles theoretical limit 33% | Up to 100% |
| Position on Lens (mm) | Measured Diffraction Angle (Degrees) | Measured Diffraction Angle (Degrees) | Measured Diffraction Angle (Degrees) | Measured Diffraction Angle (Degrees) | Theoretical Diffraction Angle for 633 nm (Degrees) | |
|---|---|---|---|---|---|---|
| Sample 1 | Sample 2 | Sample 3 | Sample 4 | G1 Lens for 488 nm | G2 Lens for 514 nm | |
| −3 mm | 13.1 | 13.1 | 11.2 | 12.4 | 13.4 | 11.9 |
| Center | 17.8 | 18.3 | 16.9 | 17.8 | 18.0 | 16.0 |
| +3 mm | 23.0 | 23.4 | 22.1 | 22.8 | 22.6 | 20.0 |
| Probe Wavelength (nm) | Position on Lens (mm) | Measured Diffraction Angle (Degrees) | Theoretical Diffraction Angle (Degrees) | |
|---|---|---|---|---|
| G1 lens designed for blue 488 nm | G2 lens designed for green 514 nm | |||
| 514.5 | Center | 13.3 | 14.1 | 13.4 |
| −3 mm | 10.0 | 10.5 | 10.0 | |
| +3 mm | 18.3 | 17.8 | 16.9 | |
| 488 | Center | 13.0 | 13.4 | 12.8 |
| −3 mm | 10.3 | 10.0 | 9.5 | |
| +3 mm | 17.0 | 16.9 | 16.0 | |
Publisher’s Note: MDPI stays neutral with regard to jurisdictional claims in published maps and institutional affiliations. |
© 2021 by the authors. Licensee MDPI, Basel, Switzerland. This article is an open access article distributed under the terms and conditions of the Creative Commons Attribution (CC BY) license (https://creativecommons.org/licenses/by/4.0/).
Share and Cite
Keshri, S.; Rogers, B.; Murphy, K.; Reynolds, K.; Naydenova, I.; Martin, S. Development and Testing of a Dual-Wavelength Sensitive Photopolymer Layer for Applications in Stacking of HOE Lenses. Appl. Sci. 2021, 11, 5564. https://doi.org/10.3390/app11125564
Keshri S, Rogers B, Murphy K, Reynolds K, Naydenova I, Martin S. Development and Testing of a Dual-Wavelength Sensitive Photopolymer Layer for Applications in Stacking of HOE Lenses. Applied Sciences. 2021; 11(12):5564. https://doi.org/10.3390/app11125564
Chicago/Turabian StyleKeshri, Sanjay, Brian Rogers, Kevin Murphy, Kevin Reynolds, Izabela Naydenova, and Suzanne Martin. 2021. "Development and Testing of a Dual-Wavelength Sensitive Photopolymer Layer for Applications in Stacking of HOE Lenses" Applied Sciences 11, no. 12: 5564. https://doi.org/10.3390/app11125564
APA StyleKeshri, S., Rogers, B., Murphy, K., Reynolds, K., Naydenova, I., & Martin, S. (2021). Development and Testing of a Dual-Wavelength Sensitive Photopolymer Layer for Applications in Stacking of HOE Lenses. Applied Sciences, 11(12), 5564. https://doi.org/10.3390/app11125564