1. Introduction
Issues related to system reliability due to variability from renewable energy sources have emerged as market penetration has steadily increased. Current countermeasures for the variability of renewables can depend based on market-based decisions or administrative determination. For instance, an SO (system operator) such as ERCOT (Electric Reliability Council of Texas) imposes controllability requirements on renewables regarding their ramp capabilities, which can be interpreted to be administrative measures [
1]. However, in the case of PJM (Pennsylvania–New Jersey–Maryland), renewables are eligible to receive negative bids when required from the SO, which is a market-based method of the variability control [
2].
The other market-based measure for variability control is improving on the resource controllability through the aggregation of non-dispatchable resources up to similar capacities to dispatchable resources in the system. A DER (distributed energy resource) currently refers to such a resource type promoted by the major SOs with high penetration of renewables [
3]. From the perspectives of the major SOs, a DER has been demonstrated to be one of the most cost-effective measures for variability control. PJM, which is the major SO in the United States, have also alleviated market regulations for DERs, enabling DERs to participate in the ORM (operating reserve market), and therefore requiring strict control reliability: DRRs (demand response resources) [
4,
5,
6]. Furthermore, DERs in Germany are currently officially capable of providing SRL (Sekundärregelliestung) and TRL (Tertiärregelliestung), as long as the DER passes the prequalification tests with the same technical criteria required for the conventional resources. One of the major types of DER participating in both systems consists of BESS and non-dispatchable renewables, as a BTMG (behind-the-meter-generator) coordinated together [
7,
8,
9].
The other market type for DERs in coordination with the variability control is settlement for the storage system with multipliers, and this market exists not only in South Korea, but also elsewhere. For instance, in Washington State, a market with settlements as pilot projects, BESSs coordinated with renewables were eligible for credit multipliers because those BESSs were demonstrated to be capable of charging and discharging during the off-peak and the peak periods. Likewise, states with a high penetration of WPGs, such as New Jersey, Kansas, California and Montana, have acknowledged that the contribution of BESSs in coordinated operation with wind power generation resources should be included properly into market settlements, considering that the initial investment cost for a BESS in coordinated operation with such a resource is high [
10].
Although there have been concerns that contributions from the BESS as a DER for variability control should be properly reflected in the market, there have only been a few voices promoting the greater incentives of BESSs coordinated with renewables, unless those participate in voltage control or ORM. Recently, it has been asserted that incentives after the contribution of the BESSs to the grid stability should be introduced to accurately evaluate the contributions. One crucial reason for the incentive is the profitability of the BESS, because the initial investment costs of a BESS are not negligible [
11].
In South Korea, similar types of resources have been included in the REC (Renewable Energy Certificate) market, with multipliers available for the AOs with BESSs coordinated with renewables. The primary purposes of the market could be variability control through resource coordination, considering phenomena such as duck curves and the availability of greater opportunities of profitability for the AOs to draw voluntary participation in the market [
12,
13]. However, due to the windows specified for market settlements with the multipliers, the AOs have to schedule their resources to be operational regardless of the system conditions indicated by the SMP (system marginal price), by discharging energy stored in the BESSs during the multiplier window; prices of the REC up to profitable levels were eligible for the first 3 years [
14].
Moreover, because the municipal energy corporation mandated the order for the AOs to install BESSs to improve coordination, with nominal capacity up to 10% of the wind power generator, concerns on the initial investment cost were opined from the AOs [
15]. The other measure introduced in the REC market was the settlement system via long-term contracts for the same fixed price for the contract periods, represented by the sum of the SMP and the REC prices, to hedge price volatility from the REC and provide greater opportunities for the AOs to manage their BESSs more responsively with regard to the SMP, but receiving less REC revenue from the multipliers [
16]. However, because capacities of BESSs installed with WPGs were not significant compared to capacities of the coordinated WPGs, and the capacity factor of a PV generator coordinated with a BESS was not as high as expected, the policies were not persuasive enough.
The other problem from the SO’s perspective, caused by the BESSs coordinated with renewables, is the fire issue [
17,
18]. In 2021, in accordance with the fire event warnings disclosed by the investigation committee of the government, a fire broke out due to improper safety measures, cell defects, lack of control over the operational environment, and installations made by the manufacturers [
19,
20,
21]. In addition, one of the fire incidents broke out while the BESS was in operation and in idle status after fully charged [
22]. One of the plausible contributors to the ignition was the operation of over-charging and discharging the BESS, while the BESS had its own internal problems with its cells, causing a short circuit [
23]. Therefore, as measures to control fires, the government has mandated dockets to the AOs to operate their BESSs according to SoC restrictions, manage the discharge schedules, and introduce systematic control algorithms considering the reliability criteria [
24]. Consequently, stakeholders from the AOs’ perspectives have opined that these reliability obligations could decrease the profitability in the market [
25].
The contributions of this paper are organized as follows:
Generating a mathematical and structured model for an assessment of deterministic economic feasibility for renewables—BESS coordination considering the REC multipliers;
Scheduling of the renewables, considering the reliability constraints in accordance with the market settlement;
Comparison of the effects of the presence or absence of structured scheduling methods considering the reliability constraints, from the AO’s perspective;
Monitoring the operating pattern of the BESS in response to SMP.
2. Optimization without Consideration of the Reliability Criteria
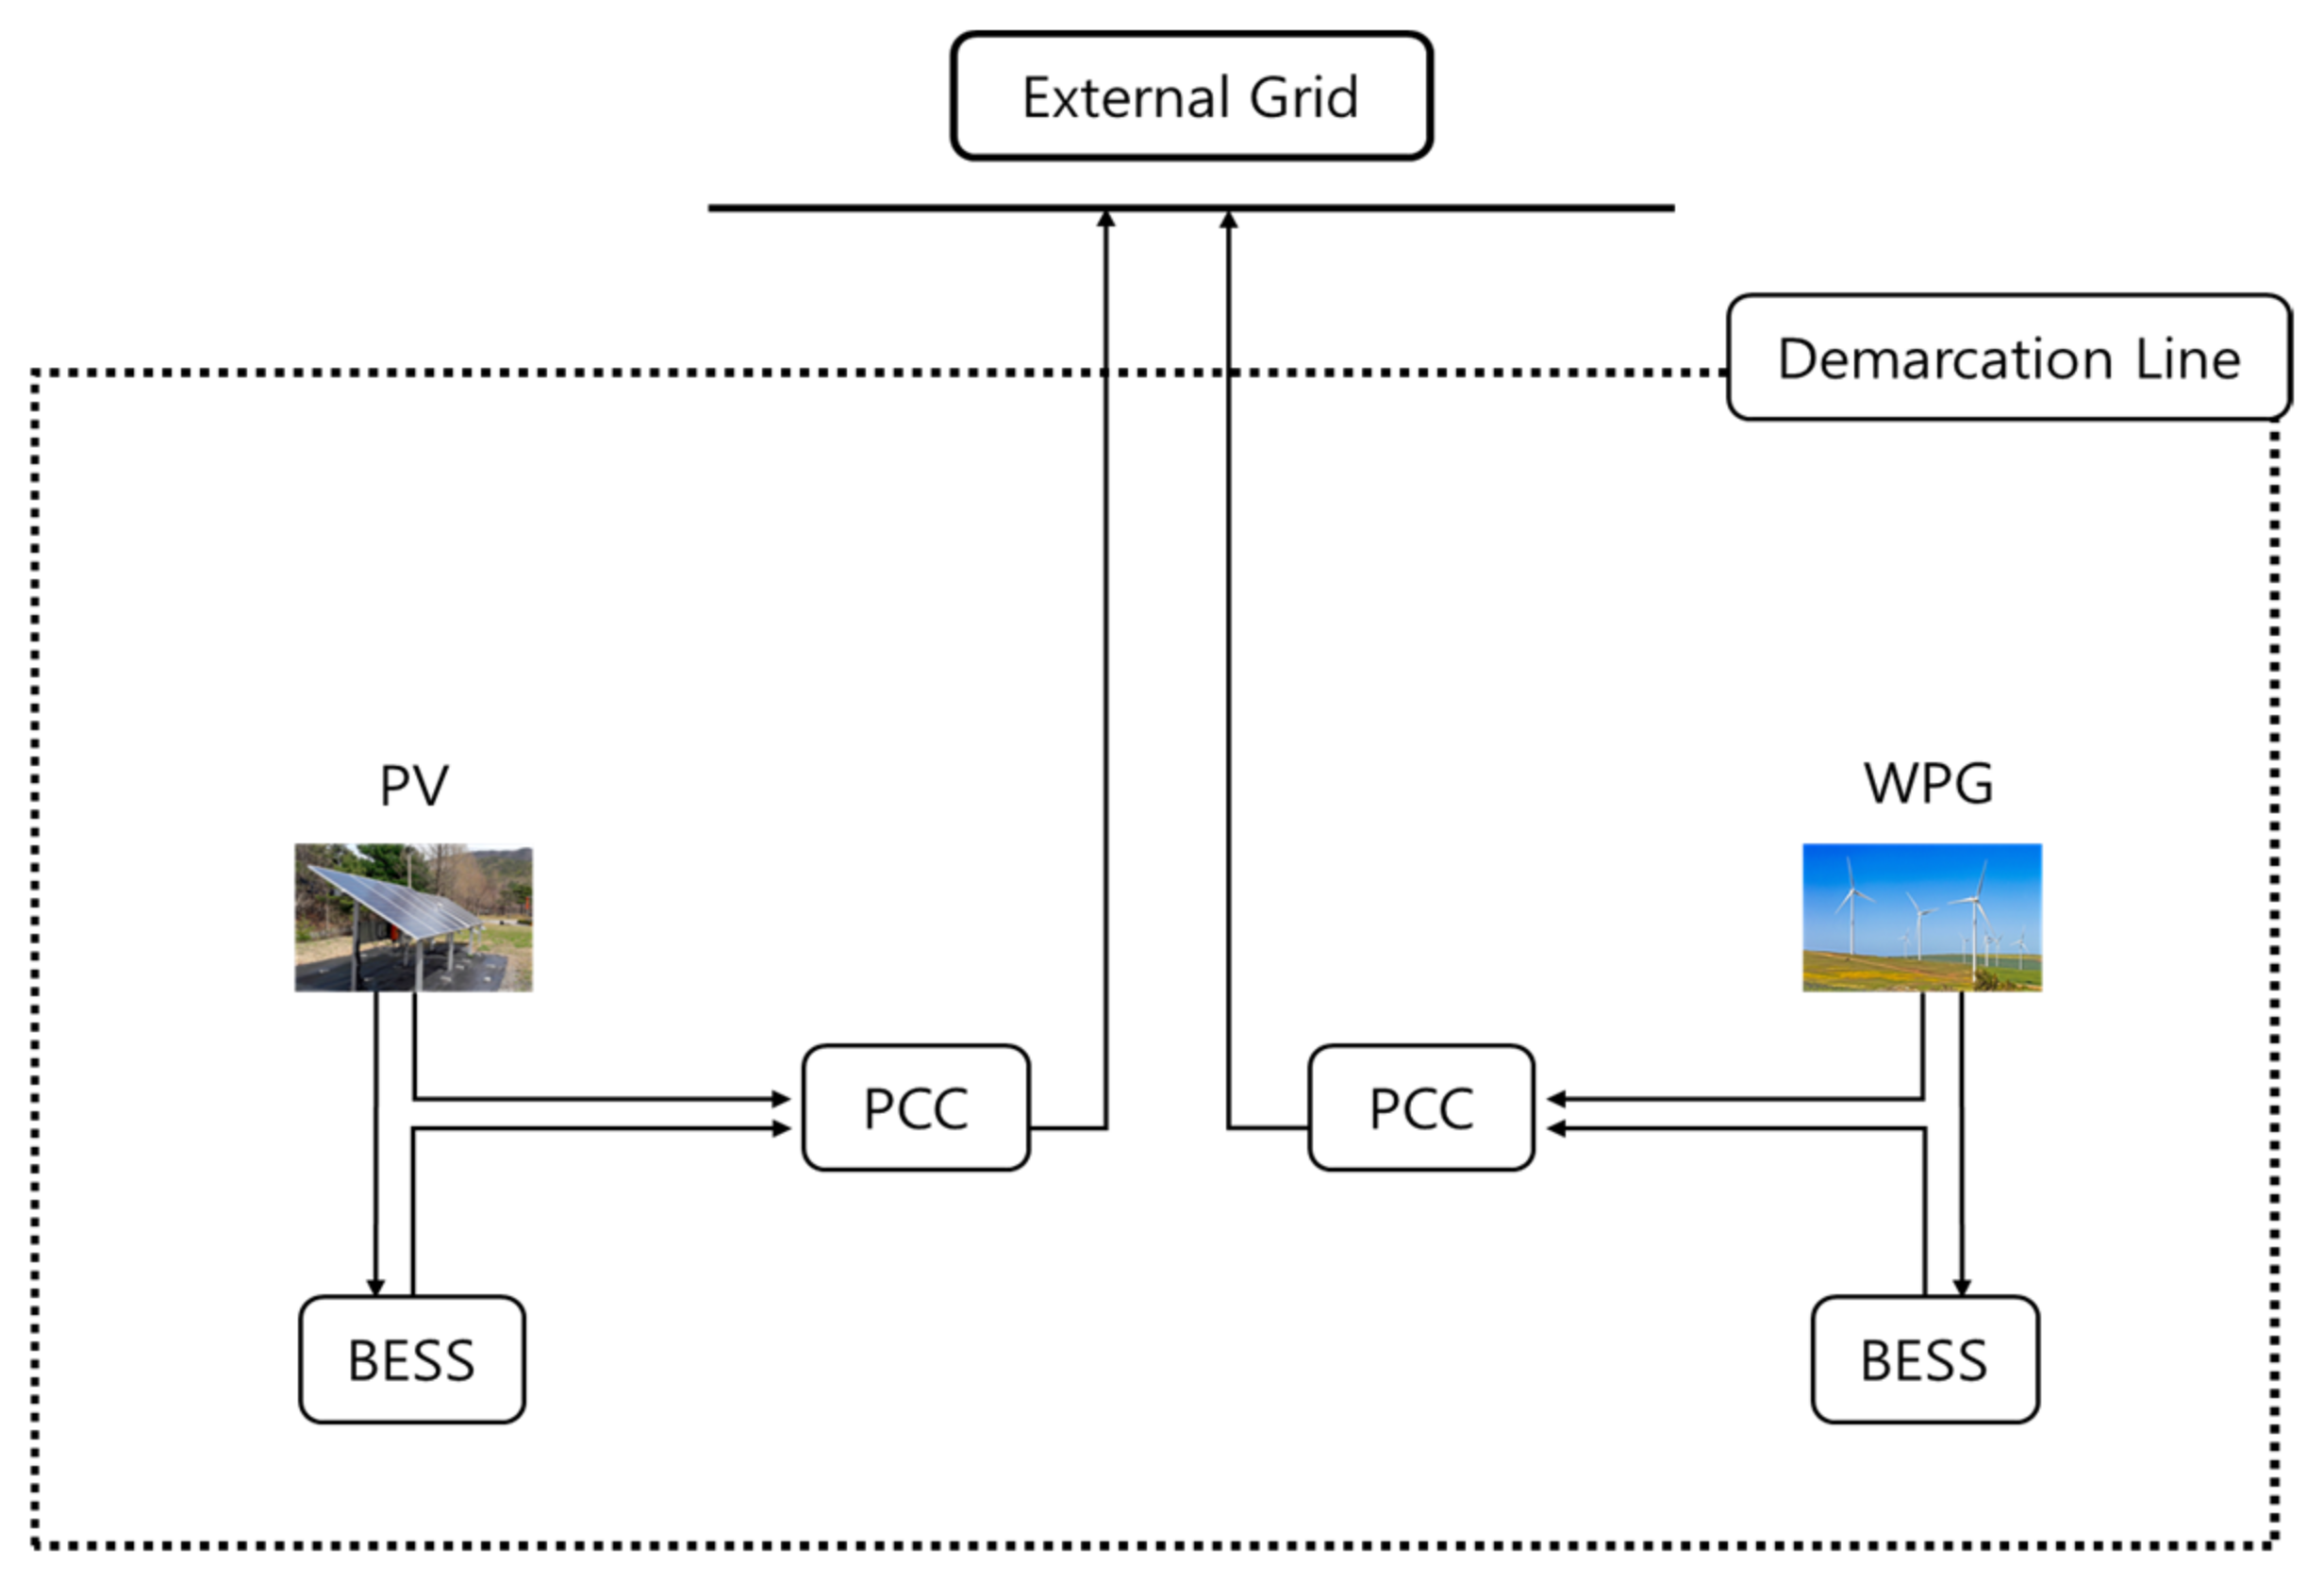
Considering that the future perspectives of the DER market will be revised in South Korea in October 2021, which will also review the availability of resources aggregated by BESSs and renewables, the resources in one of the power complexes were selected for this study, as illustrated in
Figure 1.
Currently, the DER in the complex does not contribute to the REC market via long-term contract with a fixed SMP and price of the REC. Thus, profit maximization is designed to allow the BESS to operate at its discretion with greater flexibility. Excluding emergency generators, the resources eligible for participation in REC markets are the WPG, the PV coordinated with a BESS, and the WPG coordinated with a BESS. In this operating scheme, BESSs are only dedicated to receive charge from the renewables when coordinated to do so. The total power injected into the external grid can be measured at each PCS installed.
Considering the market settlement of the REC by KPX (Korea Power Exchange), an AO is eligible for two revenue streams. One refers to the SMP revenue, which is the total power injected and measured at the PCS. The other refers to the stream from the REC multiplier when it is discharged during the applicable windows. The scheduling system in the targeted site consists of only coordination between the WPG and the BESS, without flexible operating schedules of the BESS, which has fixed periods of operation. Furthermore, the BESSs in the site are operational without profit maximization, and it therefore has been fully discharging once it is charged.
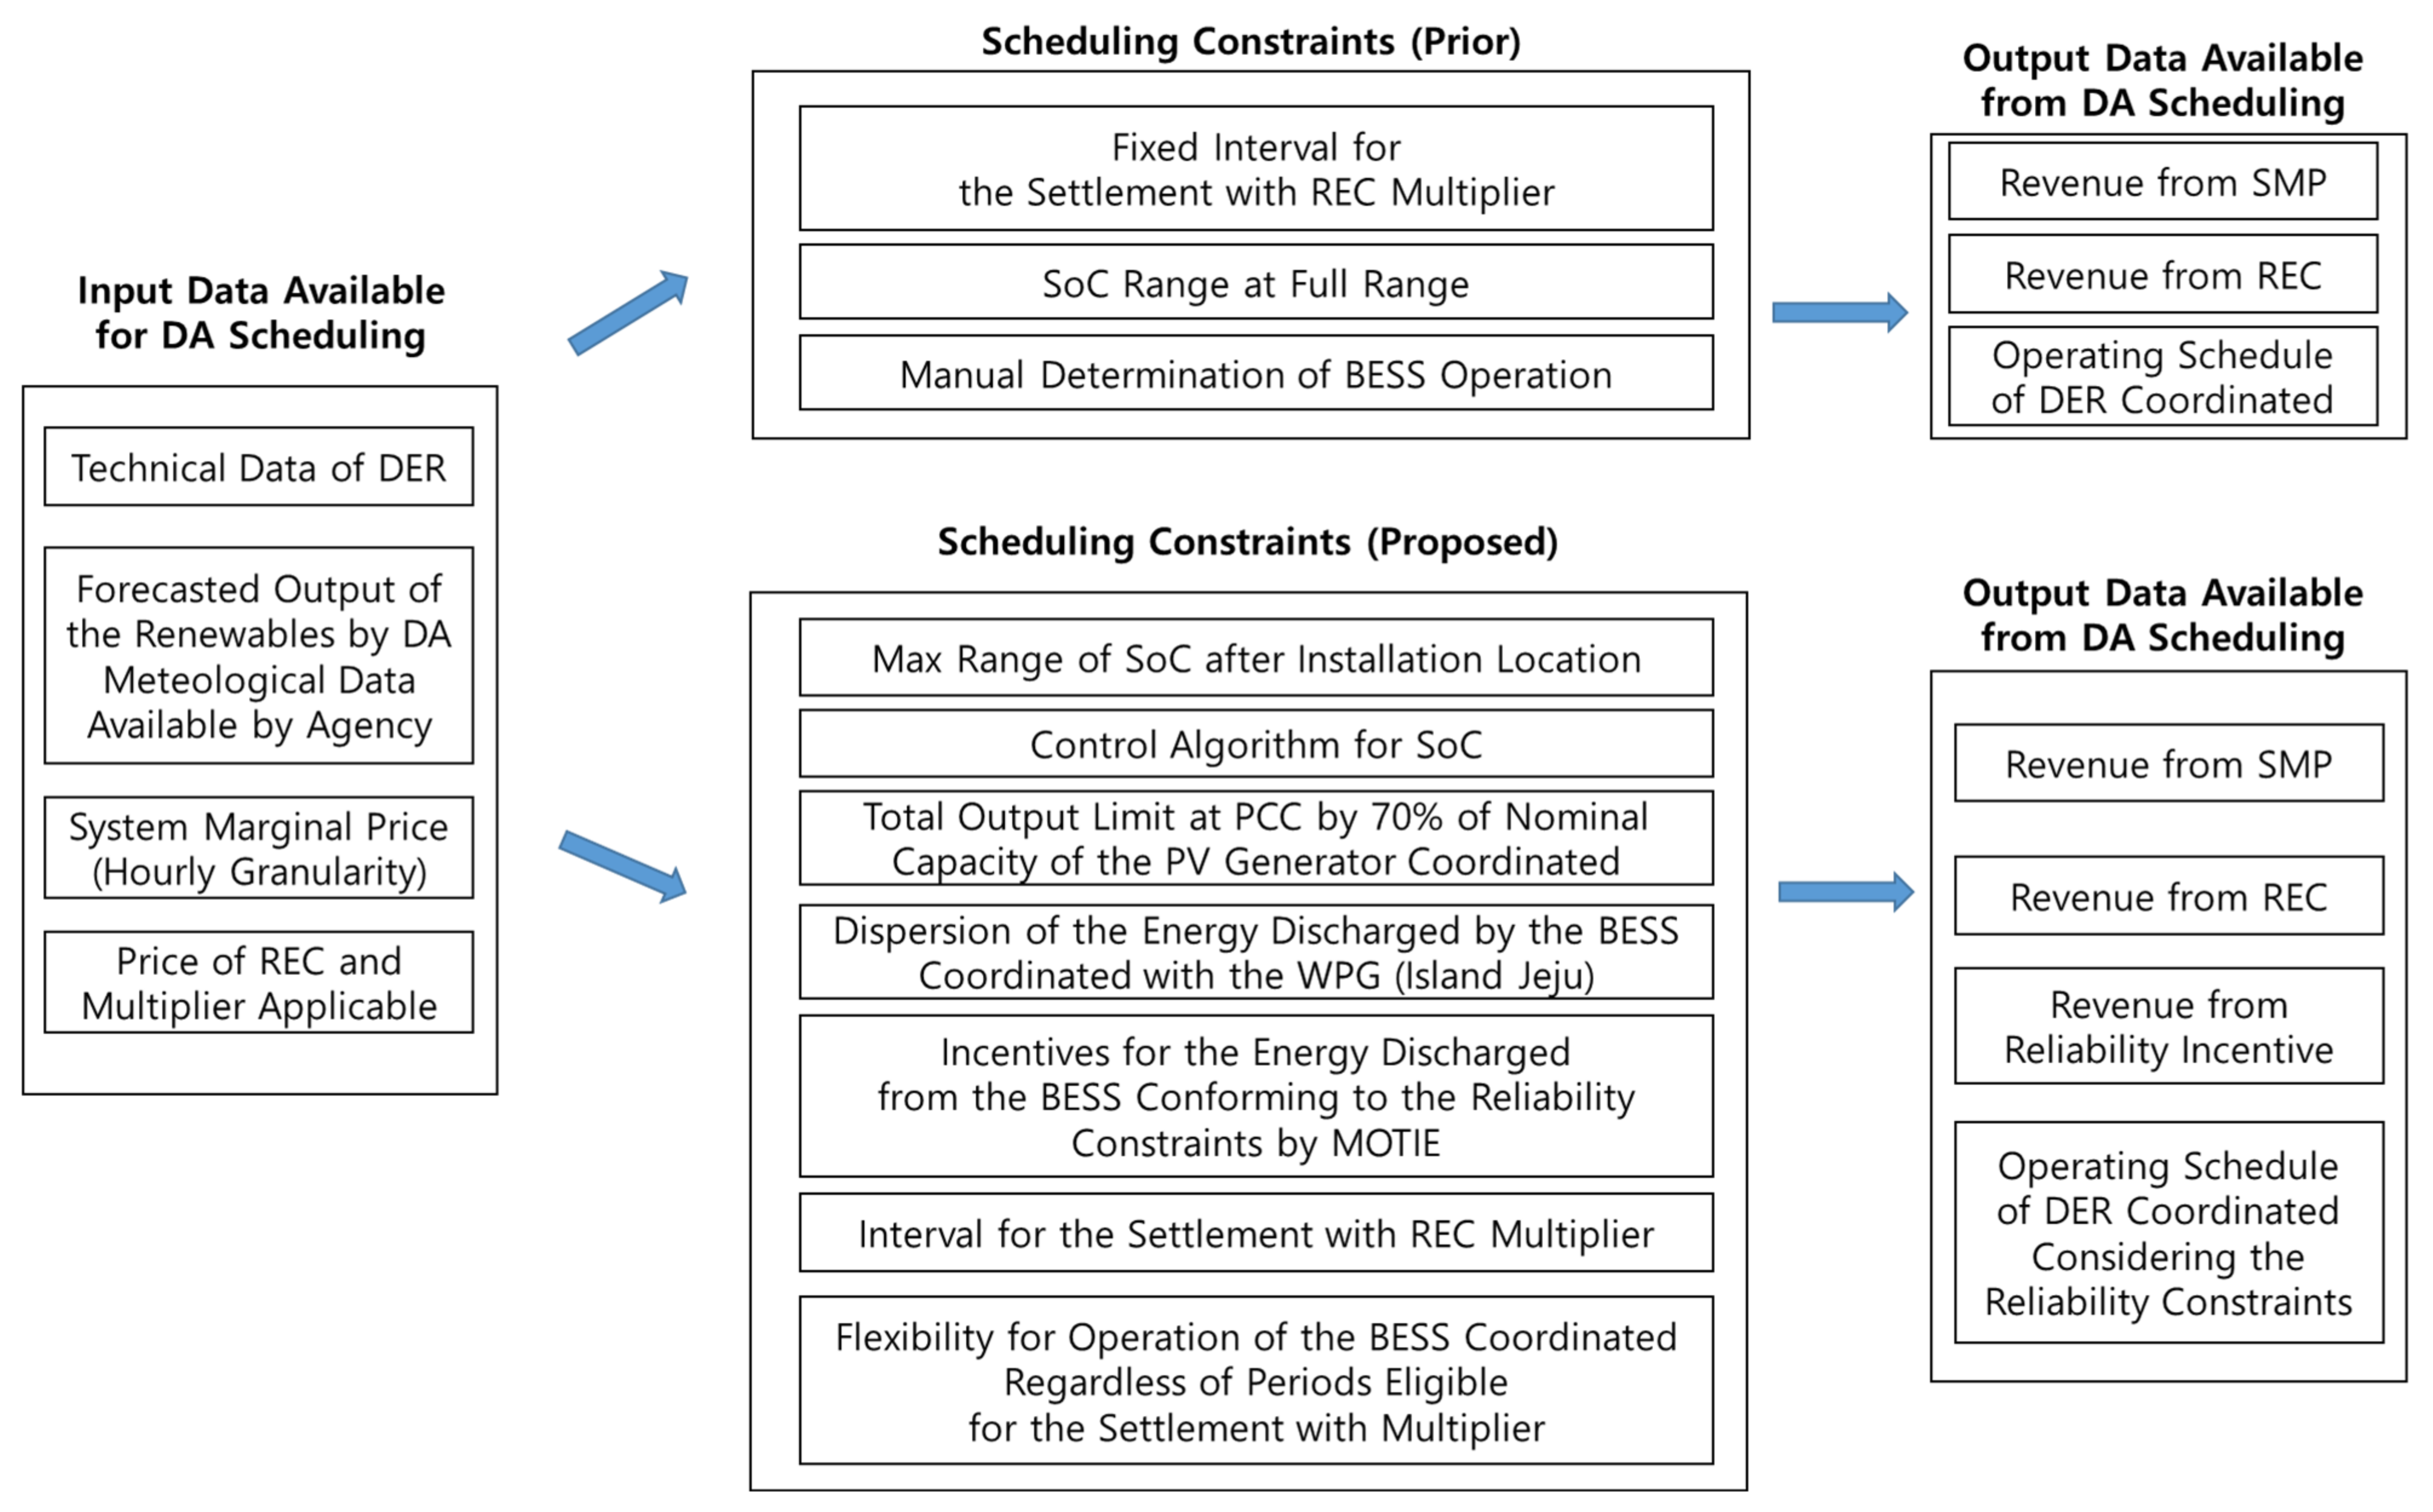
Figure 2 illustrates a comparison between the prior scheduling method and the scheduling method proposed. As mentioned in the Introduction, reliability constraints were added to the prior scheduling methods.
The input variables for the model proposed are the same as the variables required for the prior scheduling methods, because the data required for DA scheduling in the local ISO were restricted to be the SMP determined one day ahead by the SO settlement team, the output forecast based on the data publicly available from the state weather forecast agency, prices of the REC, the multiplier after types of DER have been coordinated, and the technical data of the DER which differs between installations.
One of the major differences between systems is the flexibility of the BESS coordination. The BESS scheduled by the scheduling method proposed was programmed to charge and discharge during the intervals where it would not be eligible for settlement of the REC with the multiplier, considering the total revenue to be generated from all the scheduling intervals, whereas BESSs scheduled in previous methods have operated in accordance with fixed intervals.
This model assumes that the wind farm operator is not responsible for controlling resource variability because there are no penalties or incentives dependent on fluctuating wind power generation in the current policy. The major technical reason for coordinating renewables is to not to curtail the output of the resources, and clearly confirming the contribution from the BESS. Another reason is due to economic issues from the perspective of profit, because it is more profitable from the AO’s perspective to leave renewables continuously contributing to the market without curtailments under current settlement mechanisms, unless the renewables have been registered to be dispatchable resources for the local SO.
2.1. Objective Functions and Constraints for Market Settlement without Reliability Criteria
Based on the current operations, the objective function for profit maximization can be formulated as Equation (1).
represents the revenue from coordinated operation between the PV generator and the BESS.
denotes the revenue from coordinated operation between the WPG and the BESS with a scheduling algorithm.
2.1.1. Mathematical Model of the Revenue Stream from a Resource Portfolio with a WPG and BESS
The profit from resource coordination between the WPG and the BESS can be mathematically represented as follows:
The
term represents the energy measured at the point of common coupling in the portfolio with the WPG and the BESS.
,
,
and
represent the energy eligible for an REC settlement without and with the multiplier, the multiplier for the portfolio with the WPG and the price of the REC in the bid.
,
and
represent the O&M cost due to its operation, the energy discharged from the BESS, and the energy charged into the BESS from the WPG, respectively.
The output eligible for SMP revenue can be expressed as Equation (4) above.
, the output metered at the coupled point, is the sum of the energy injected into the external grid from the renewable represented by
; the BESS is represented by
, which excludes the energy charging the BESS.
Equation (5) represents the energy eligible for
without the multiplier. The energy eligible for the multiplier is the total energy generated from the WPG during all the scheduling periods.
Equation (6) represents the energy eligible for an REC settlement with the multiplier for the portfolio with the WPG and the BESS. The variable TD represents the seasonal interval specified by the SO which indicates the periods eligible for the multiplier; therefore, energy can be discharged from the BESS in accordance with the market settlement for the AO and coordinated with the WPG.
2.1.2. Mathematical Model of the Revenue Stream from a Resource Portfolio with a PV and BESS
The profit from resource coordination between the PV generator and the BESS can be mathematically represented as follows:
represents the energy measured at the point of common coupling in the portfolio with the PV generator and the BESS.
,
,
and
represent the energy eligible for the REC settlement without and with the multiplier, the multiplier, and the price of the REC in the bid.
,
and
represent the O&M cost due to its operation, the energy discharged from the BESS, and the energy charging the BESS from the PV generator.
The output eligible for the SMP revenue can be expressed as Equation (9).
, the output metered at the coupled point, is the sum of the energy injected into the external grid from the renewable, represented by
, and the BESS, represented by
, excluding the energy charging the BESS, which is represented by
.
Equations (10) and (11) represent the energy eligible for and . In the market settlement for the multiplier for the DER with a BESS and a PV generator, the energy discharged from the BESS is represented by , which is charged by the PV generator from 1000 to 1600 and is eligible for the multiplier. Thus, the conditions for the BESS to discharge are separately designed, considering a scheduling window for the time charging, which is represented by . The energy ineligible for the multiplier is represented by , which excludes the energy eligible for the multiplier, to avoid dual compensation.
2.1.3. Operating Constraints of the BESS with the Renewables without Reliability Constraints
The BESS can charge and discharge power within its state of charge (SoC) limit at the manufacturers’ discretion. Hence, the SoC of the BESS with the PV generator and the BESS with the WPG, represented by
and
, respectively, is limited by the minimum and maximum SoC levels:
Equations (14) and (15) represent management of the SoC through continuous scheduling periods. The efficiency coefficients represented by
and
are the efficiency when charging and discharging, respectively.
The coordinated BESS cannot be simultaneously charged and discharged. Thus, the binary control variables for charging and discharging, represented by
,
,
and
in each portfolio as the constraints, can be expressed as follows:
The energy to be discharged and charged is represented in Equations (18)–(21), indicating the output constraints for each resource portfolio, specified at the manufacturers’ discretion.
3. Optimization with Consideration of the Reliability Criteria
In accordance with dockets from the reliability commission of MOTIE (Ministry of Trade, Industry and Energy) in South Korea, the reliability constraints were amended to prevent the BESS from overloading; the constraints were mandated as in
Table 1.
The other reliability constraints referring to the renewables were organized as in
Table 2. The total output measured at its PCC could not exceed 70% of the nominal capacity of the renewables installed or coordinated. Otherwise, the AO became ineligible for the weighted settlement with the energy multiplier discharged from the coordinated BESS.
The incentive criteria were mandated as in
Table 3. In accordance with the incentive settlement amended by the reliability commission, the eligible AOs for the incentive were those AOs with operating standards or logics adhering to the reliability criteria mandated.
Depending upon the installation site, the additional incentive varies. For the resources coordinated and installed outside the structure, the maximum SoC was limited to 90%, and 3% of the additional incentives could be added to the energy discharged regardless of the scheduling periods.
3.1. Objective Functions and Constraints for Market Settlement with Reliability Criteria
As stated above, the AOs not violating the reliability constraints were eligible for incentives due to the energy discharged. Thus, the objective functions for the coordination of PV-BESS and WPG-BESS can be re-formulated as Equations (20) and (22).
3.1.1. Mathematical Model of the Revenue Stream with Reliability Constraints, and Therefore Incentives, from a Resource Portfolio with a WPG and BESS
The objective function for profit maximization of the portfolio with the WPG and the BESS can be modified as follows:
As presented in Equations (23) and (24), the revenue streams from the SMP and the REC with the multiplier, represented by
and
, respectively, include an additional incentive for the energy discharged from the BESS, denoted by
, considering the factor,
, and noting that the BESS is installed outside.
3.1.2. Mathematical Model of the Revenue Stream from a Resource Portfolio with a PV and BESS
The objective function for profit maximization of the portfolio with the PV generator and the BESS is modified as follows:
As presented in Equations (26) and (27), the revenue streams from the SMP and the REC with the multiplier, represented by
and
, respectively, include the additional incentive for the energy discharged from the BESS, denoted by
, considering the factor,
, and noting that the BESS is installed outside.
To enable flexible operation responsive to the SMP, as well as opportunities during the multiplier periods, the variables
and
were added to the BESS in fixed operation, as presented in Equations (28) and (29).
3.1.3. Mathematical Model of Coordination Considering the Reliability Constraints
The limit on the output measured at the PCS was the maintained within the specified range, as stated in
Table 3. Thus, by introducing a coefficient representing installation outside the structure,
:
In accordance with the new reliability constraints, the SoC of the BESS must be maintained within the specified range, as stated in
Table 3. Thus, by introducing the coefficient representing installation outside the structure,
:
4. Case Study and Discussion
In previous scheduling systems, the scheduling methods were separated into two categories individually, considering the profit from SMP and the REC and did not involve flexible variables for the BESS to charge and discharge when considering the entire window eligible for scheduling: the reliability constraints are also now outdated. Thus, in this simulation, the reliability constraints were considered as the aforementioned criteria in
Section 3.
4.1. Simulation Environment
4.1.1. Technical Specification of the Resources
The technical specifications of the resources coordinated in the site are summarized in
Table 4. The WPGs in the site consisted of two separate 1.5 MW WPGs which were registered in the EMS as a single aggregated resource. Data reflected in the operation related to the coordinated model were required to simulate the coordinated wind farm model with the BESS, as shown in
Figure 1. The key parameters for coordinated model operation are presented in
Table 4.
Each BESS and PCS installed on the site were manufactured by LG-Chem, with a degradation period of 3 years. The SoC in the out-factory state was measured to be 2162 kWh. However, considering the degradation periods, the SoC was considered to be 1963 kWh. The reliability constraints for the range of the SoC were set according to the reliability criteria which have been in effect since February 2020. The initial SoC for the simulations were postulated to be the minimum eligible SoC for safe operation, as specified by the manufacturers, to formulate the same environment as in the real situation.
4.1.2. Generation Profile of the Coordinated Renewables
Considering the settlement interval eligible in the current market system, hourly generation histories from the PV and the WPGs were used for the simulation.
Table 5 presents the peak periods in effect by the SO in South Korea.
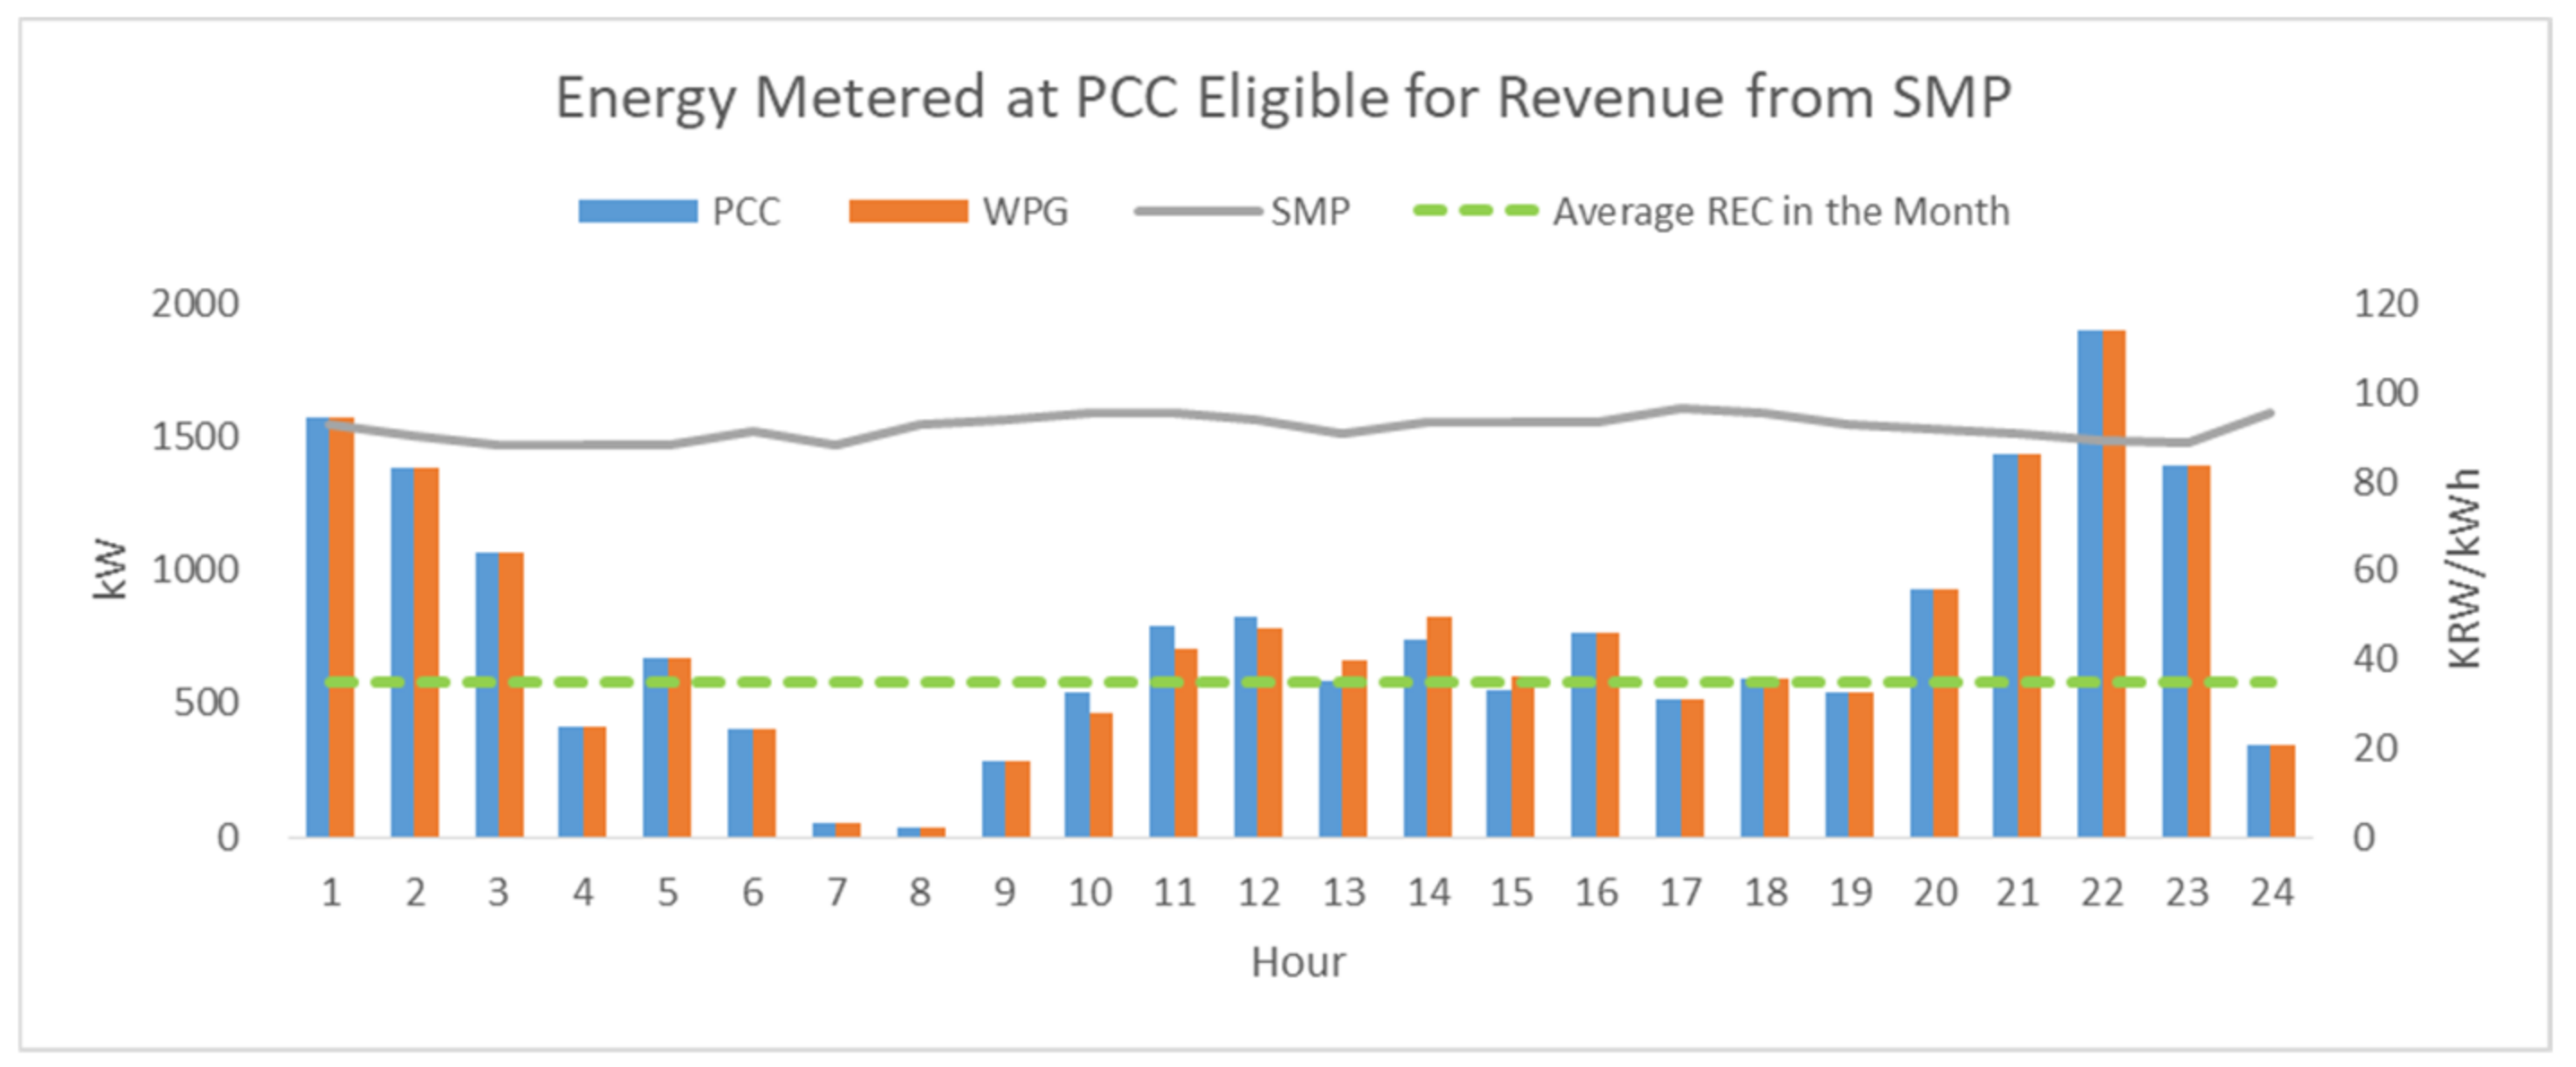
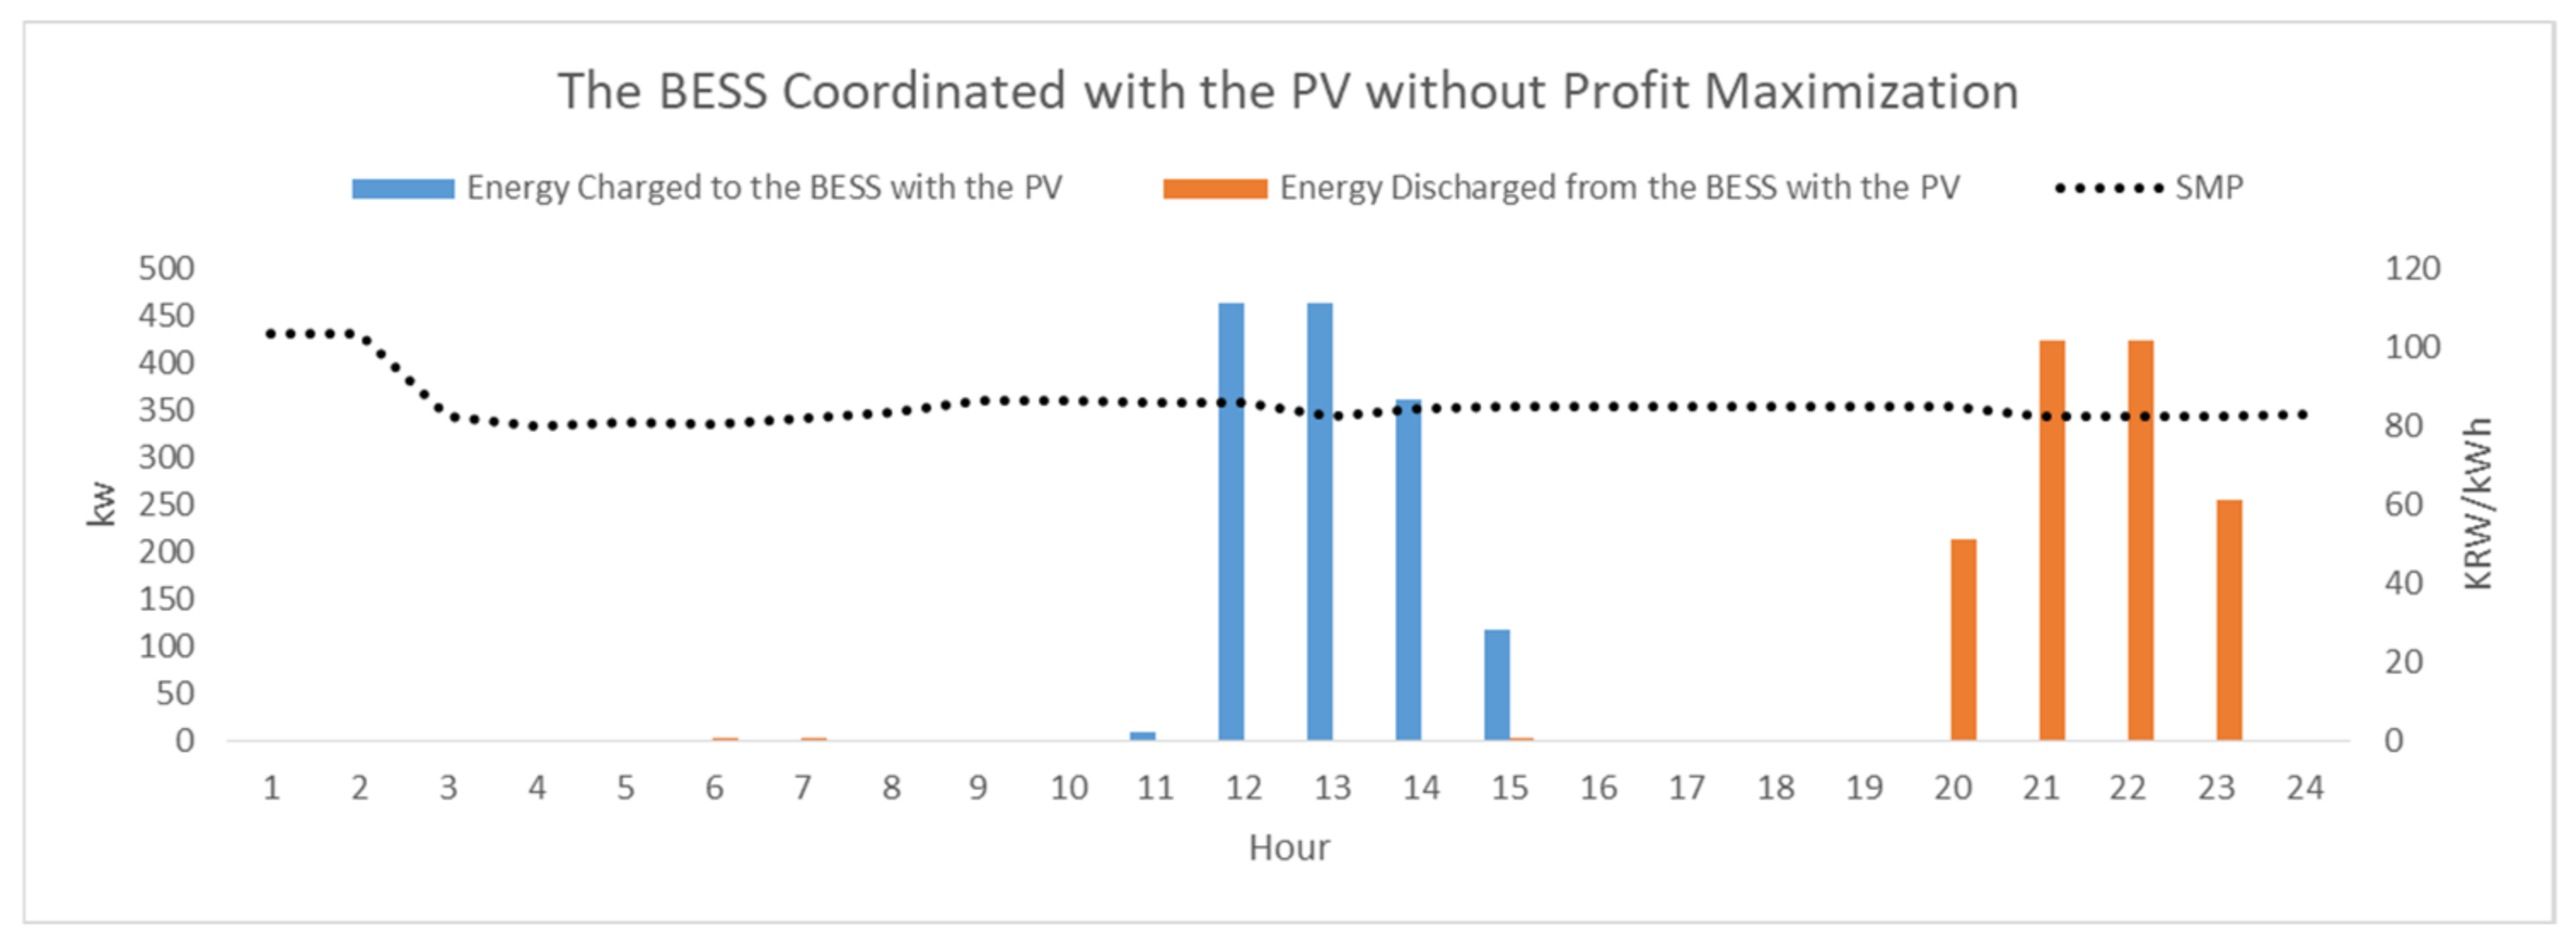
The BESS coordinated with the WPG has also not been in operation considering profit maximization thus far. As illustrated in
Figure 3, the BESS discharged only during the interval specified by the SO eligible for the multipliers, without considering any other chances for profit maximization. Moreover, it can be observed that the charging operation of the BESS was scheduled without consideration for the opportunities for the greater revenue, charging when the SMP is greater, as illustrated in
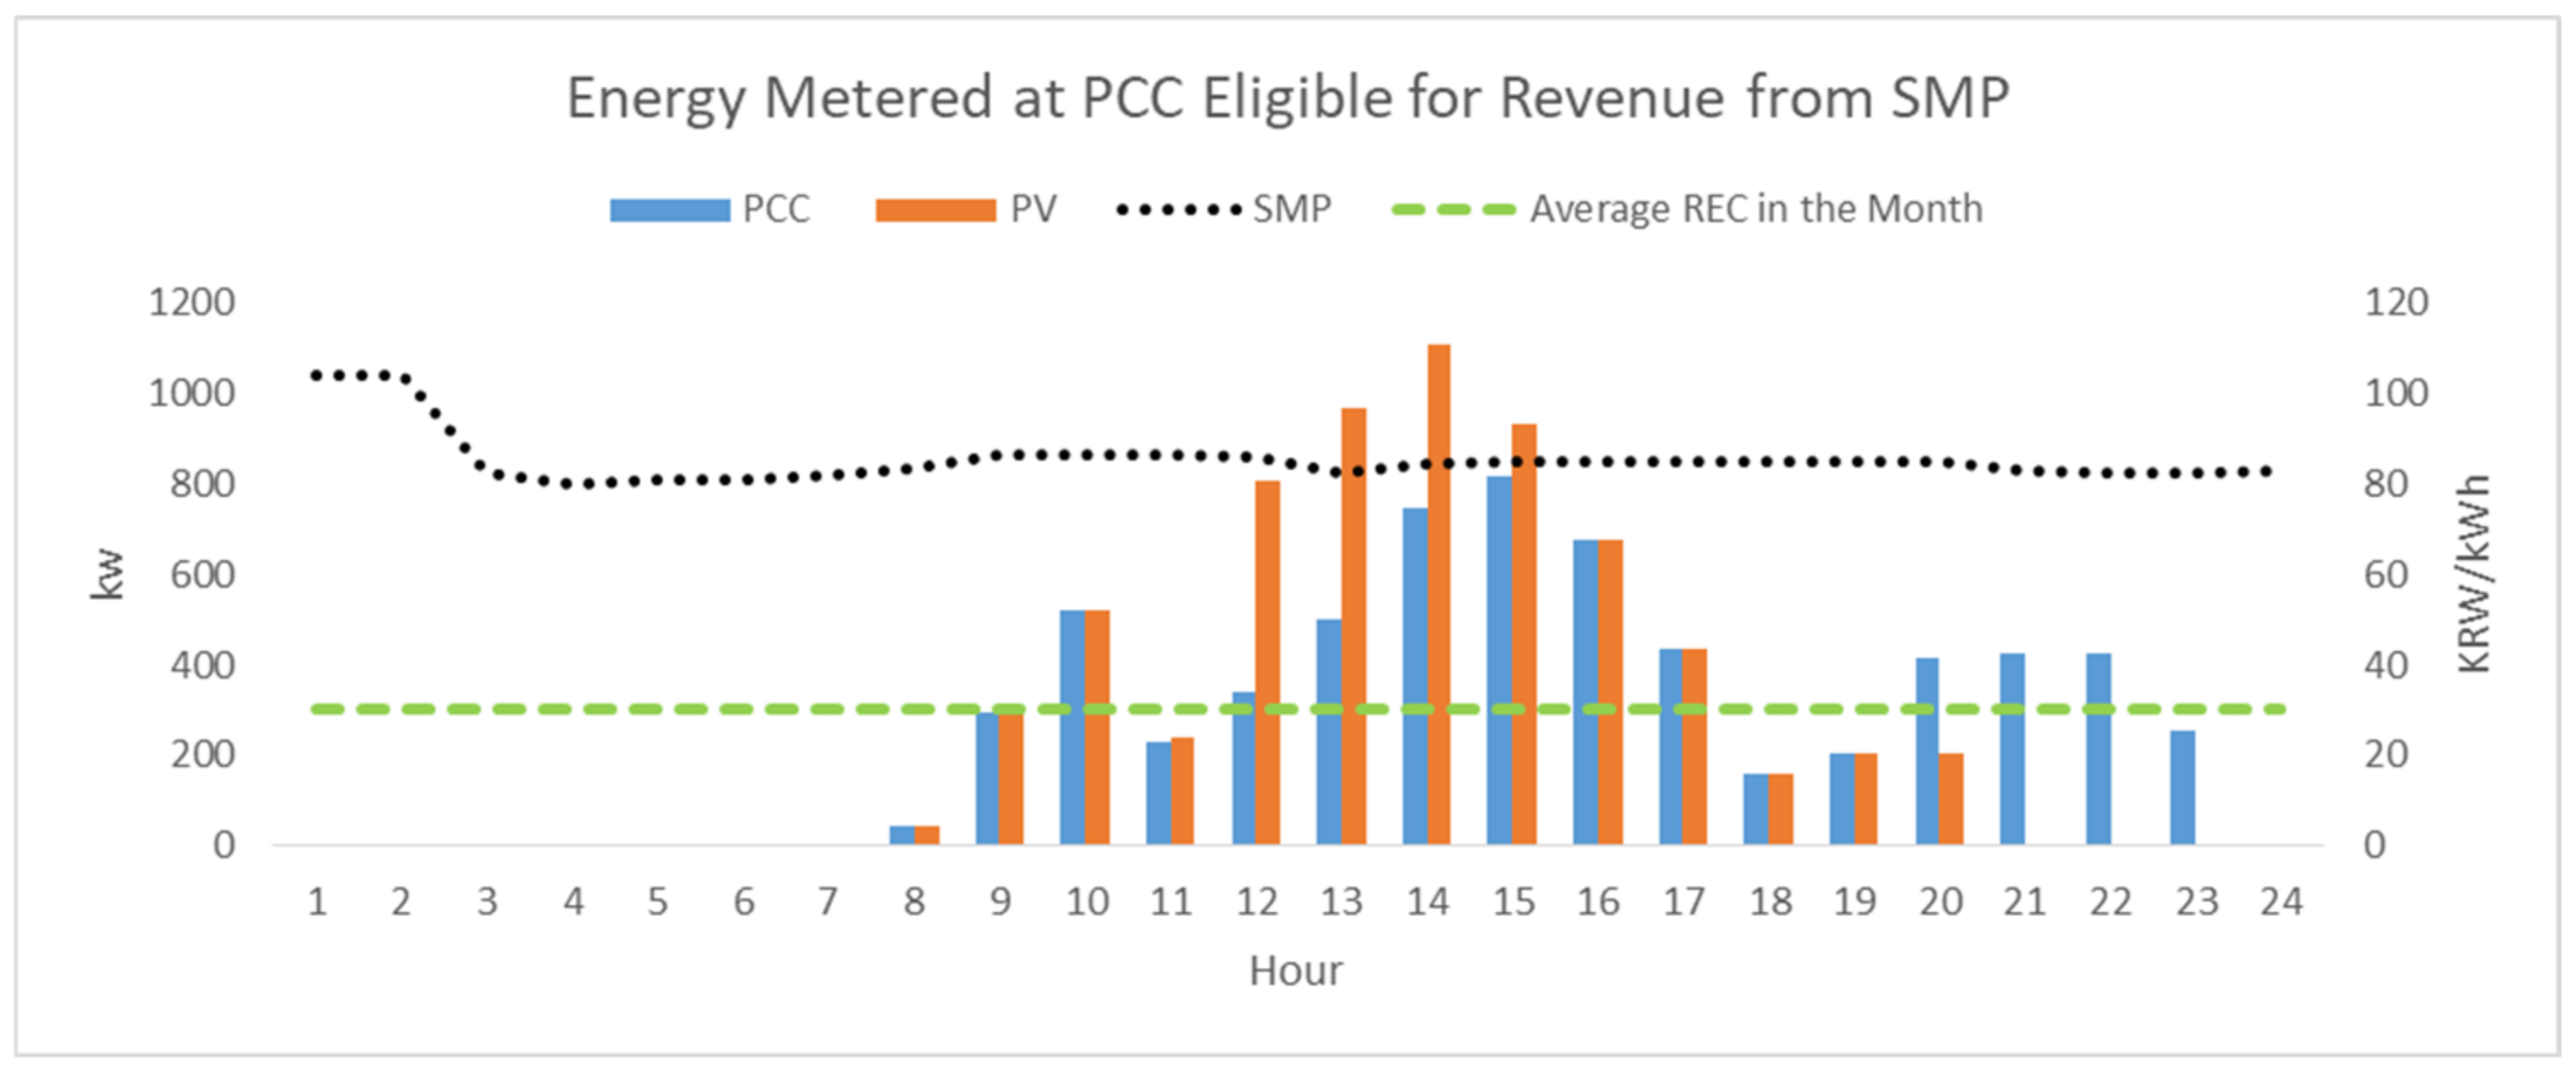
Figure 3. In
Figure 4, it can be observed that the DER did not respond to the system as intended, with virtually no coordinated control of the renewables.
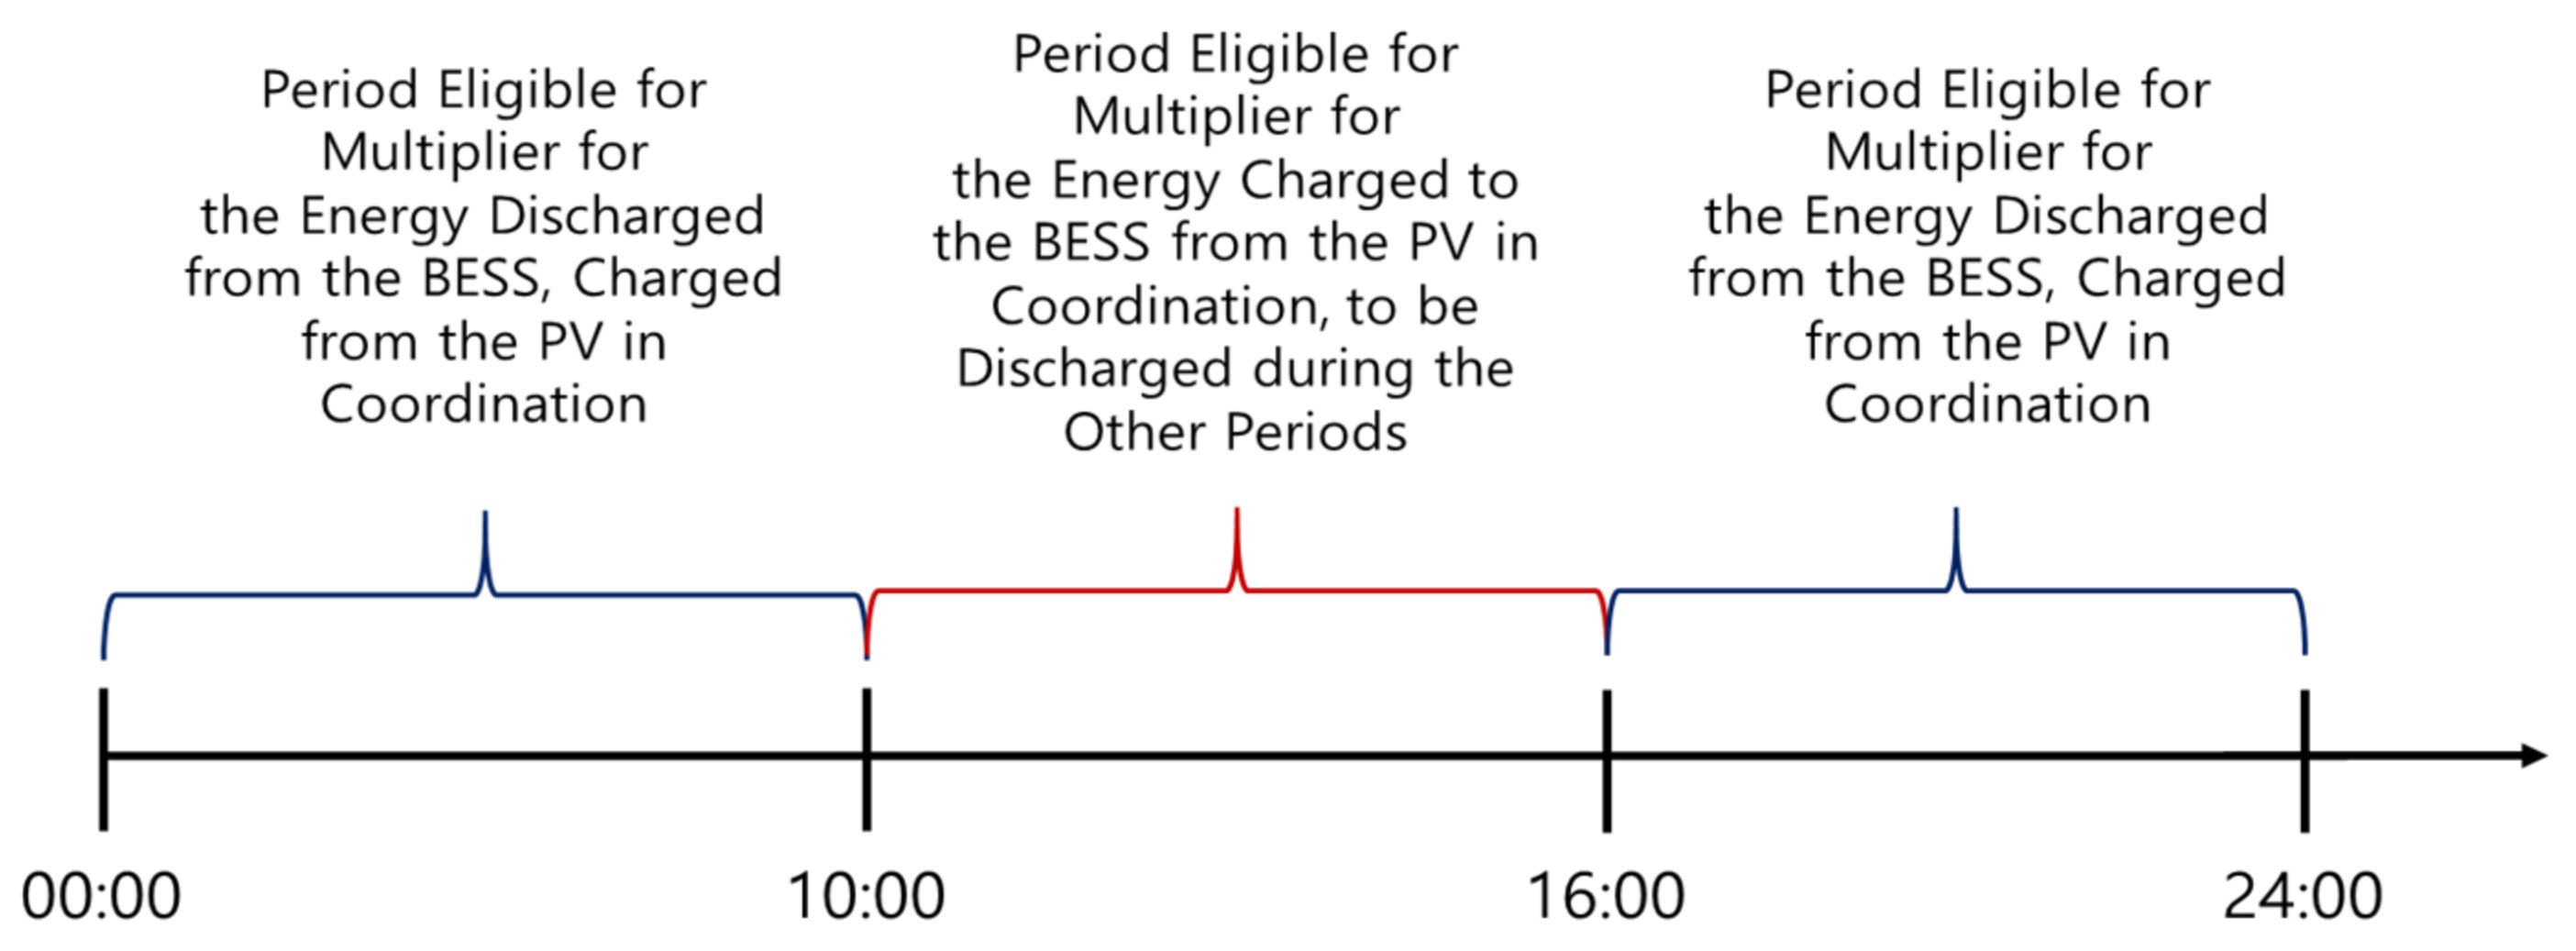
Figure 5 shows the DA scheduling windows considering the multipliers. The multiplier is only eligible for energy generated the PV during the specified window, from 10:00 a.m. to 16:00 p.m., and which is discharged during the other windows, indicated in red and blue, regardless of the seasonal peak periods.
Figure 6 and
Figure 7 are illustrations of the participation methods currently in effect in the subject site. The BESS with the PV device has been programmed to charge and discharge only during the windows determined at the operator’s discretion, without the reliability constraints on the SoC. In
Figure 6 and
Figure 7, it can be observed that the only parameters influencing profit maximization were SMP and REC. However, since the price of the REC for one day remained the same during the scheduling intervals, the SMP and the cost of the operations were the volatile variables influencing profit maximization. However, despite the SMP ahead of 2300 h was greater, the BESS was scheduled to discharge in the hours with lower1a SMP with greater operating costs, discharging multiple times unnecessarily as illustrated in
Figure 6 and
Figure 7.
Hence, in an effort to demonstrate differences between results from the proposed scheduling methods and the methods employed prior to the study, days with abnormal patterns of SMP publicly available by the local SO in each season were selected as the simulation cases.
4.1.3. Prices of the REC
Prices of the REC selected in the case studies were historical data of the reference prices publicly available as shown by
Table 6 below. The reference prices were publicized one year after the subject date; therefore, the reference price publicized in the year 2019 and the exchange rate on the subject date were considered in the simulations.
4.2. Case Study
4.2.1. Scenarios
The proposed MILP (mixed-integer linear programming) optimization parameters were implemented in MATLAB Optimization Toolbox. The branch and bound algorithm was terminated after reaching a 0% duality gap. The purposes of the study were to determine the effects of various cases on profit maximization, considering the presence and absence of the criteria presented in
Table 7.
The cases in the study consisted of scenarios in the presence and absence of flexibility, incentive, and reliability criteria. The flexibility scenario demonstrated the effectiveness of the scheduling algorithm, compared with the previous operations. The scenario with the incentive demonstrated the effect of the incentives on the gross revenue. The purposes of the reliability criteria were to determine whether they influenced the gross revenue, as opined in 2020 by the current AOs in South Korea.
4.2.2. Input Data
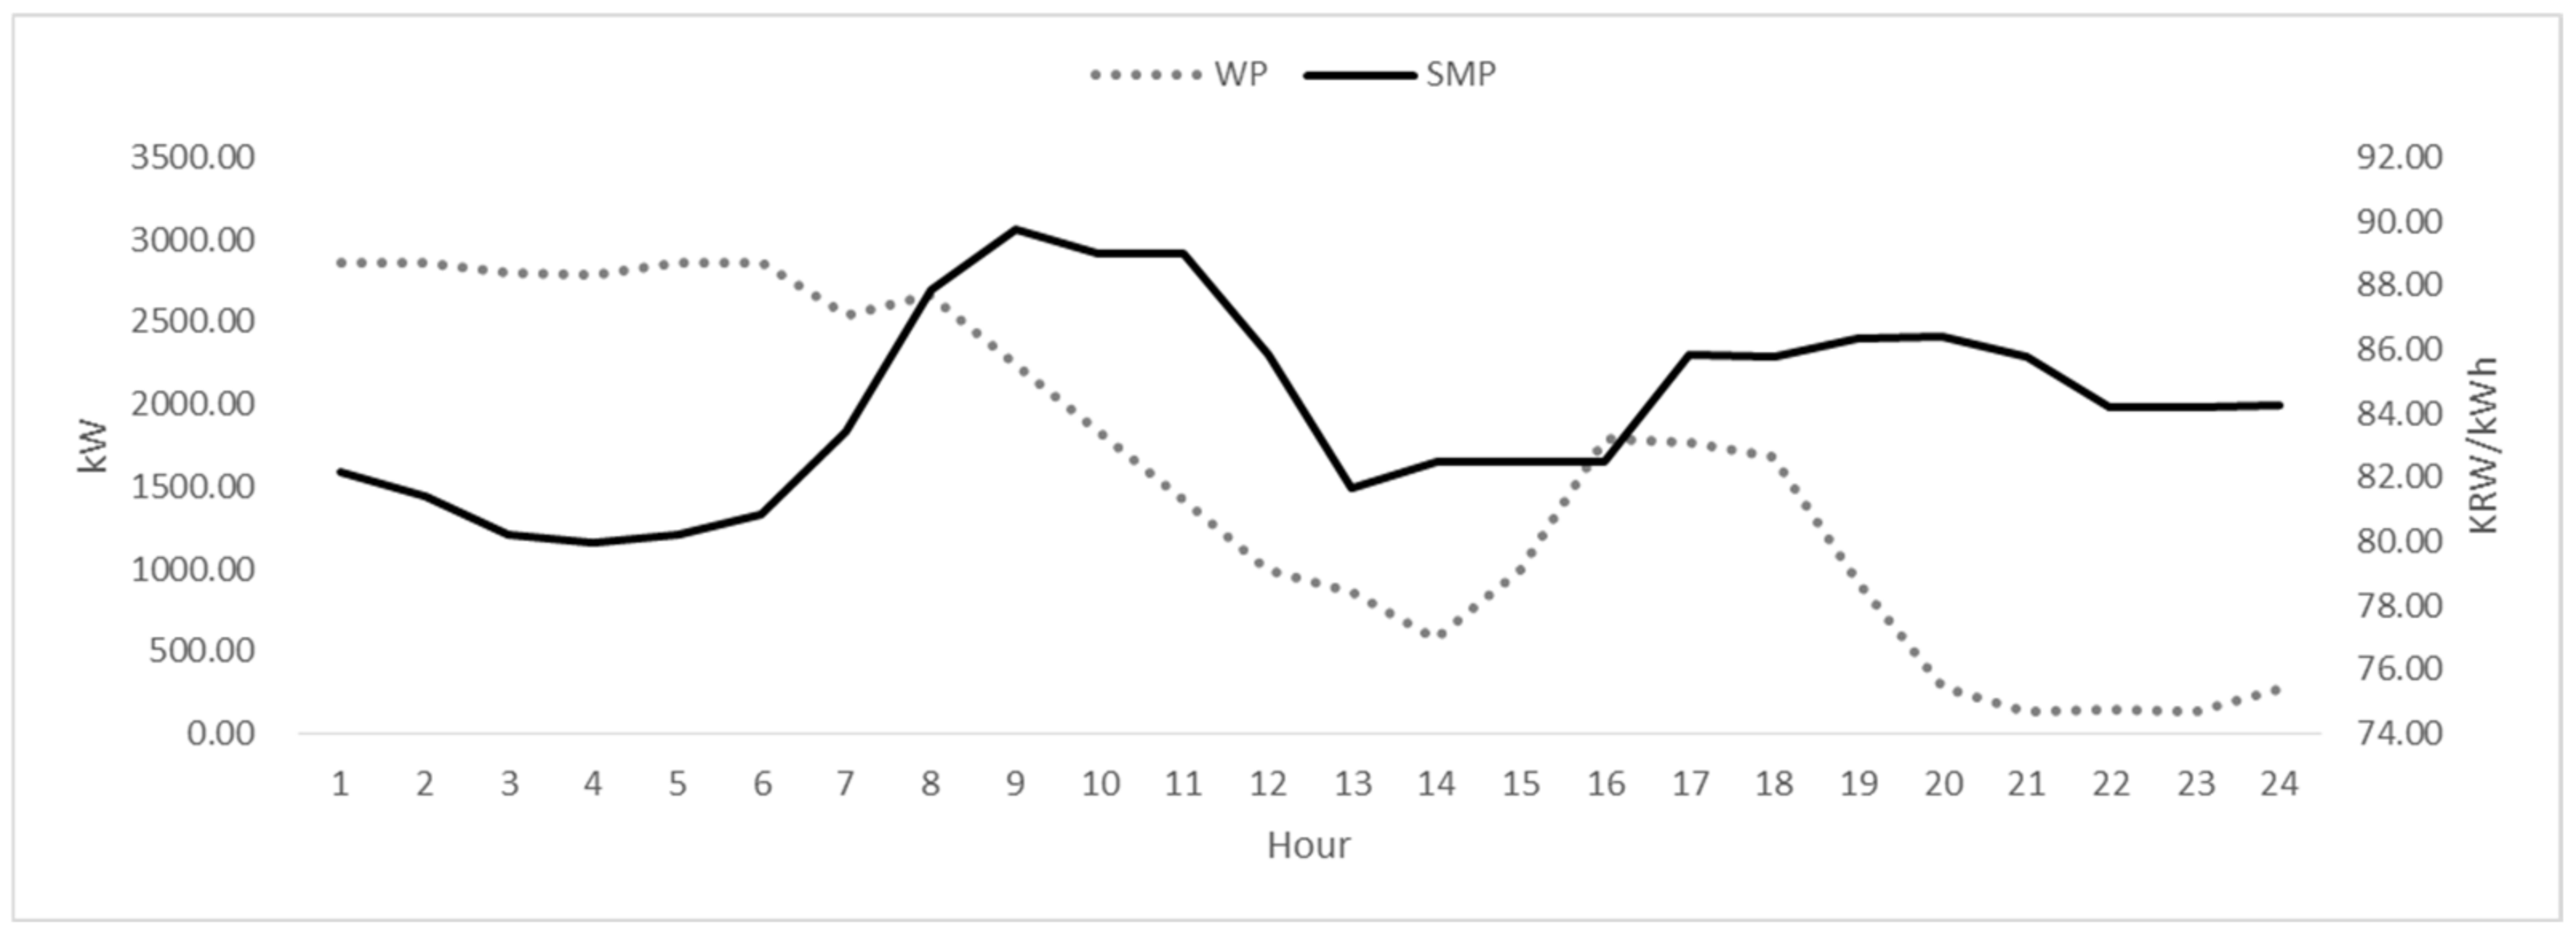
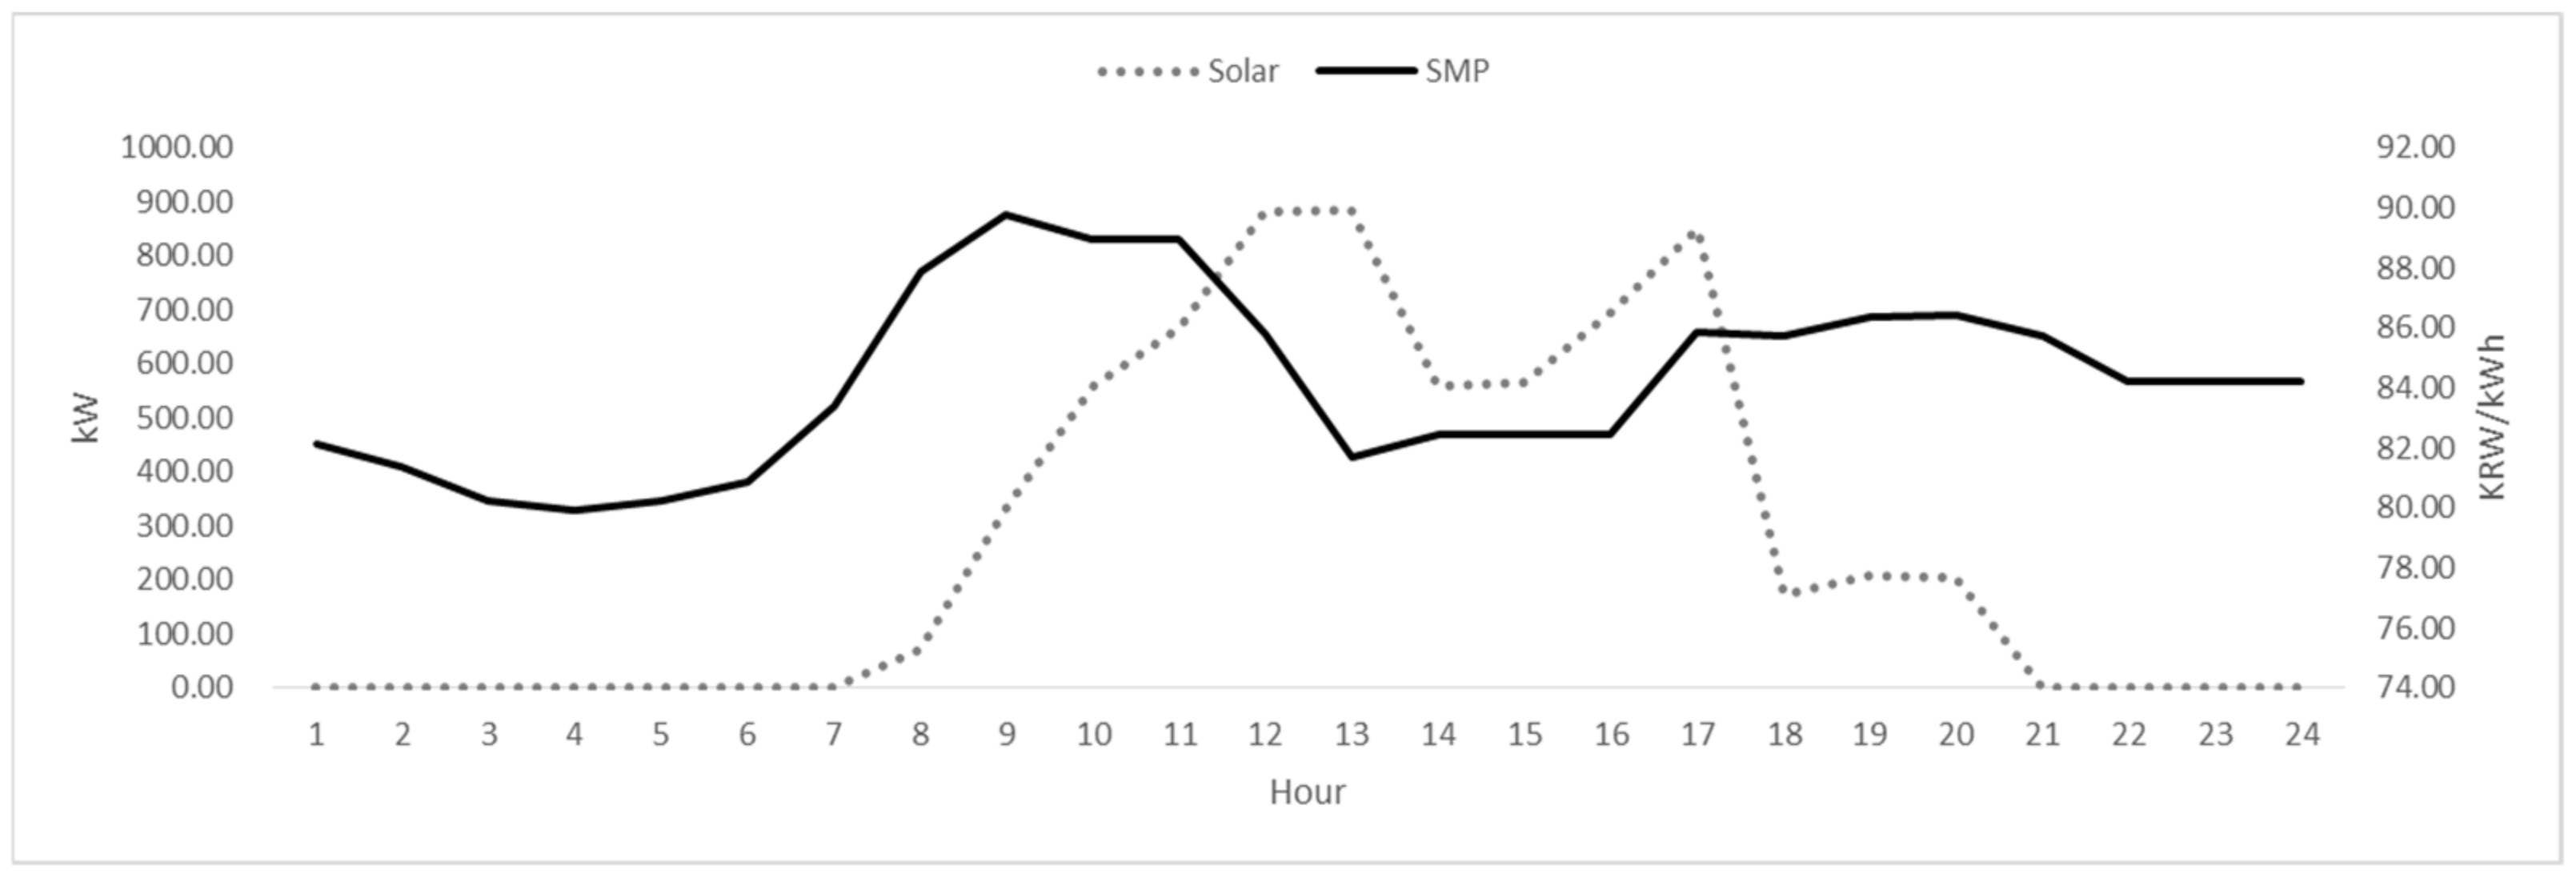
Considering that the purpose of a market with an REC multiplier is to draw the energy to be discharged from the BESS when desired by the SOs, a day with significant fluctuations of the SMP was selected, as illustrated in
Figure 8 and
Figure 9, to confirm whether the BESS contributed to the balancing operation as intended, because windows with high and low SMP represent the system condition whether the reserve margin is low or sufficient.
5. Numerical Results
The primary purpose of this study was to demonstrate the effectiveness of the structured operation compared to non-structured operation, from the AO’s perspective as market participants, numerical results relative to changes in the gross revenue were compared.
5.1. Base Case—Intraday Operation without Structured Algorithm
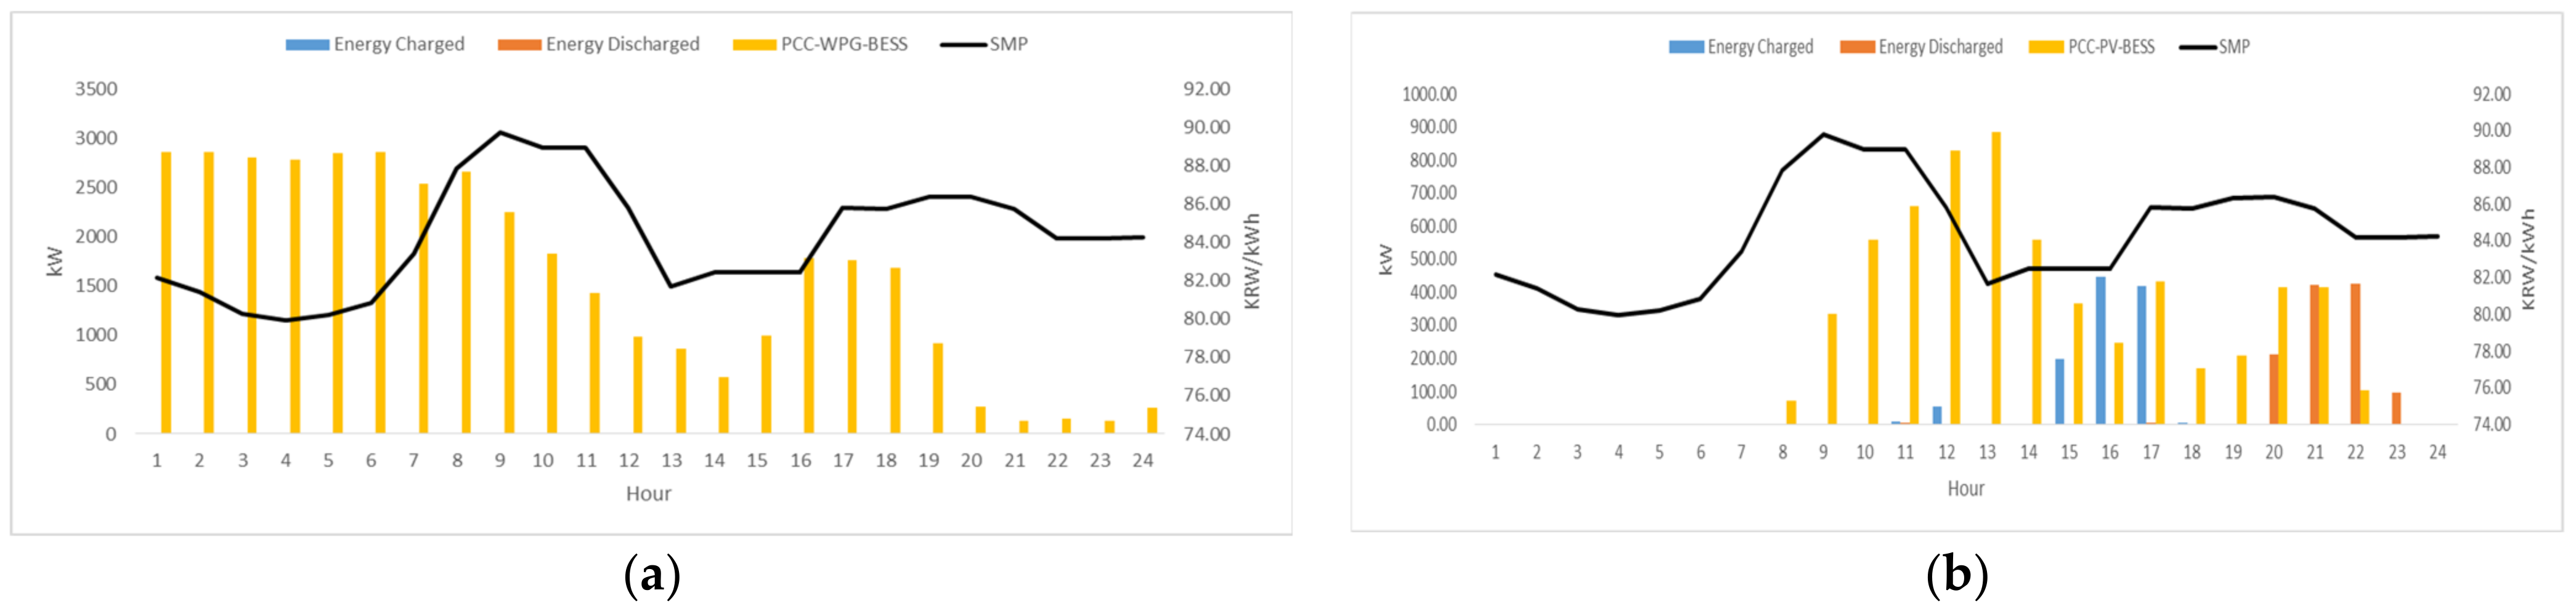
Figure 10 illustrates the prior coordination without considering profit maximization.
Figure 10a illustrates the coordination between the WPG and the BESS, and
Figure 10b illustrates the coordination between the PV and the BESS. It is noticeable in
Figure 10b that the BESS in the portfolio with the PV has not been scheduled considering patterns of SMP, although only during the fixed interval, because the BESS discharged at 2300 when the SMP was less. Moreover, the BESS did not operate for the entire scheduling window, because the system was set to consider just the revenue from the SMP without any flexibility.
The total energy discharged from the BESS coordinated with the PV was calculated to be 1157 kWh, and the energy charged during the window between 10:00 and 16:00 was calculated to be 1127 kWh. Without the scheduling algorithm, the BESS with the PV was not scheduled to discharge at 20:00, despite the highest SMP of KRW 86.40/kWh, which would have generated the greatest revenue for the BESS to charge from the PV.
Table 8 represents the revenue generated from both of portfolios. In the case of revenue from the portfolio with the WPG, the revenue from REC5 was determined to be null, because the BESS did not operate, and the operator’s discretion was to pursue only the SMP revenue.
5.2. Case 1—Effect after Introduction of Profit Maximization without Incentive
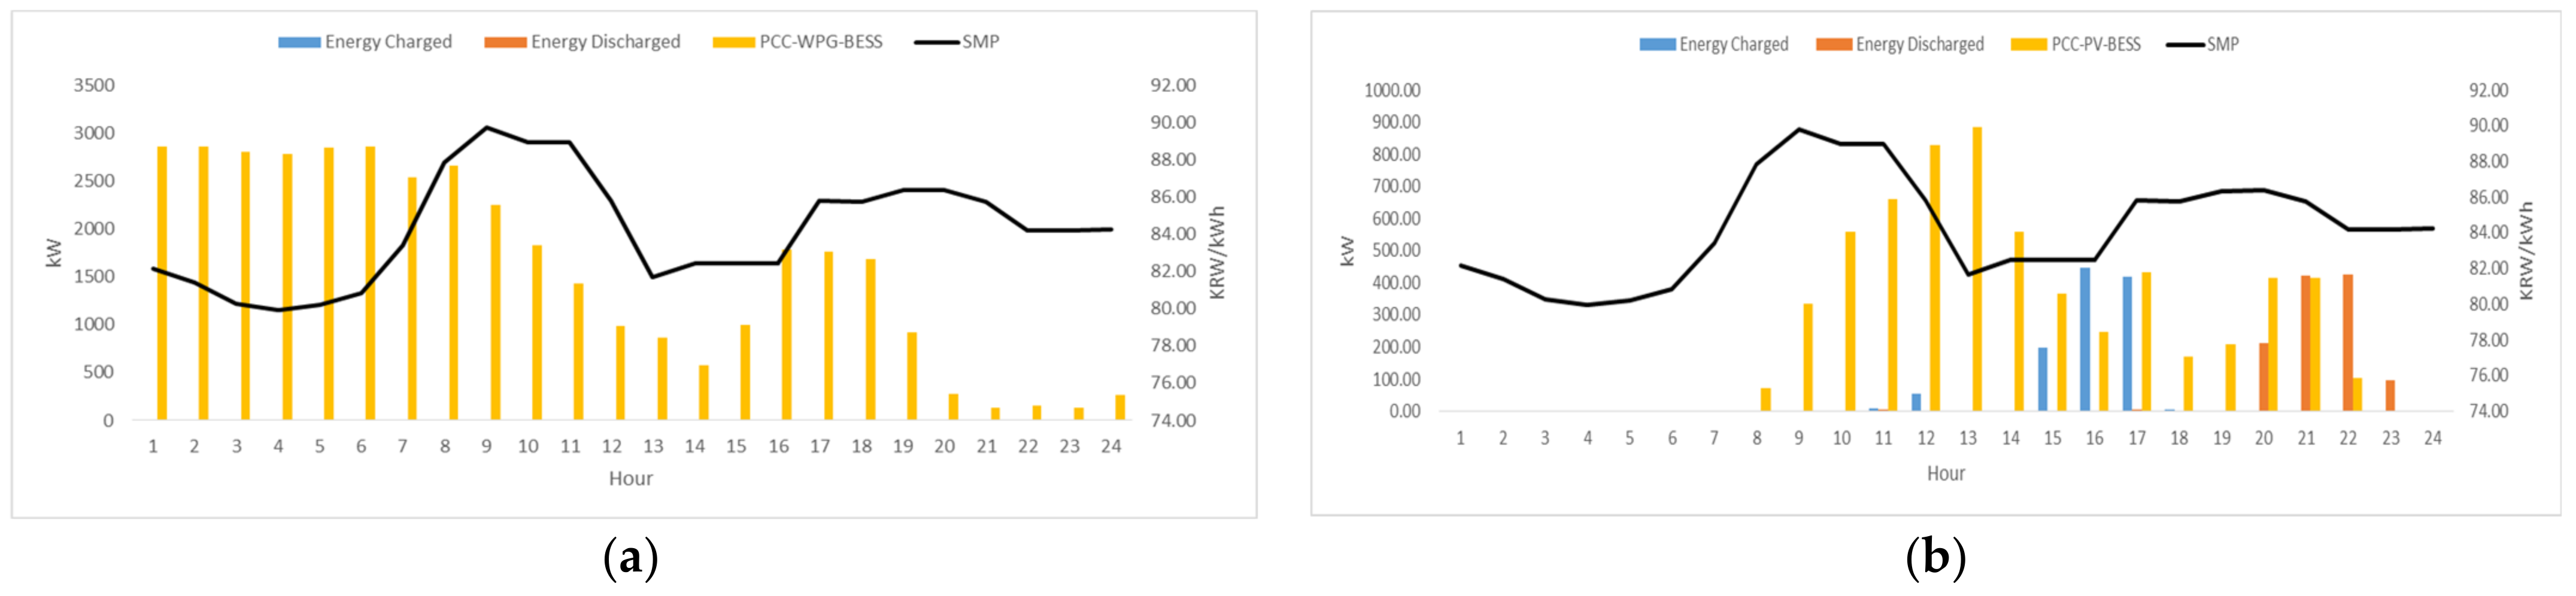
Figure 11 illustrates the coordination between the PV and the BESS after the introduction of profit maximization. Compared to the former operation without the maximization algorithm, the BESS coordinated discharge after the opportunities of the profit maximization, regardless of the interval set previously.
Compared to the prior scheduling methods and considering the fixed windows as illustrated in
Figure 11a,b, the BESS coordinated with the renewables via the profit maximization was scheduled, taking into account the gross profit from the resource portfolio in the demonstration site. As illustrated in
Figure 11c, the BESS was scheduled to be charged within the tolerance of the PCS, therefore minimizing the operation cost and maximizing the SMP revenue from the coordinated renewable. Likewise, the BESS with the PV also operated and avoiding unnecessary actions, causing greater operating cost with consideration of the SMP patterns, as illustrated in
Figure 11d.
Table 9 and
Table 10 compare the revenue generated from the portfolio in the subject complex. The total revenue from the portfolio with the PV and the BESS increased by 14.25%, simply by introducing the control algorithm. Furthermore, the SMP revenue and the total revenue from the portfolio with the WPG and the BESS also increased by 25.57% and 0.62%, respectively, because the scheduler also considered the settlement with the multipliers, whereas the previous scheduling method was used to pursue revenue from the SMP only.
5.3. Case 2—Profit Maximization with Reliability Constraints by the Commission without Incentive
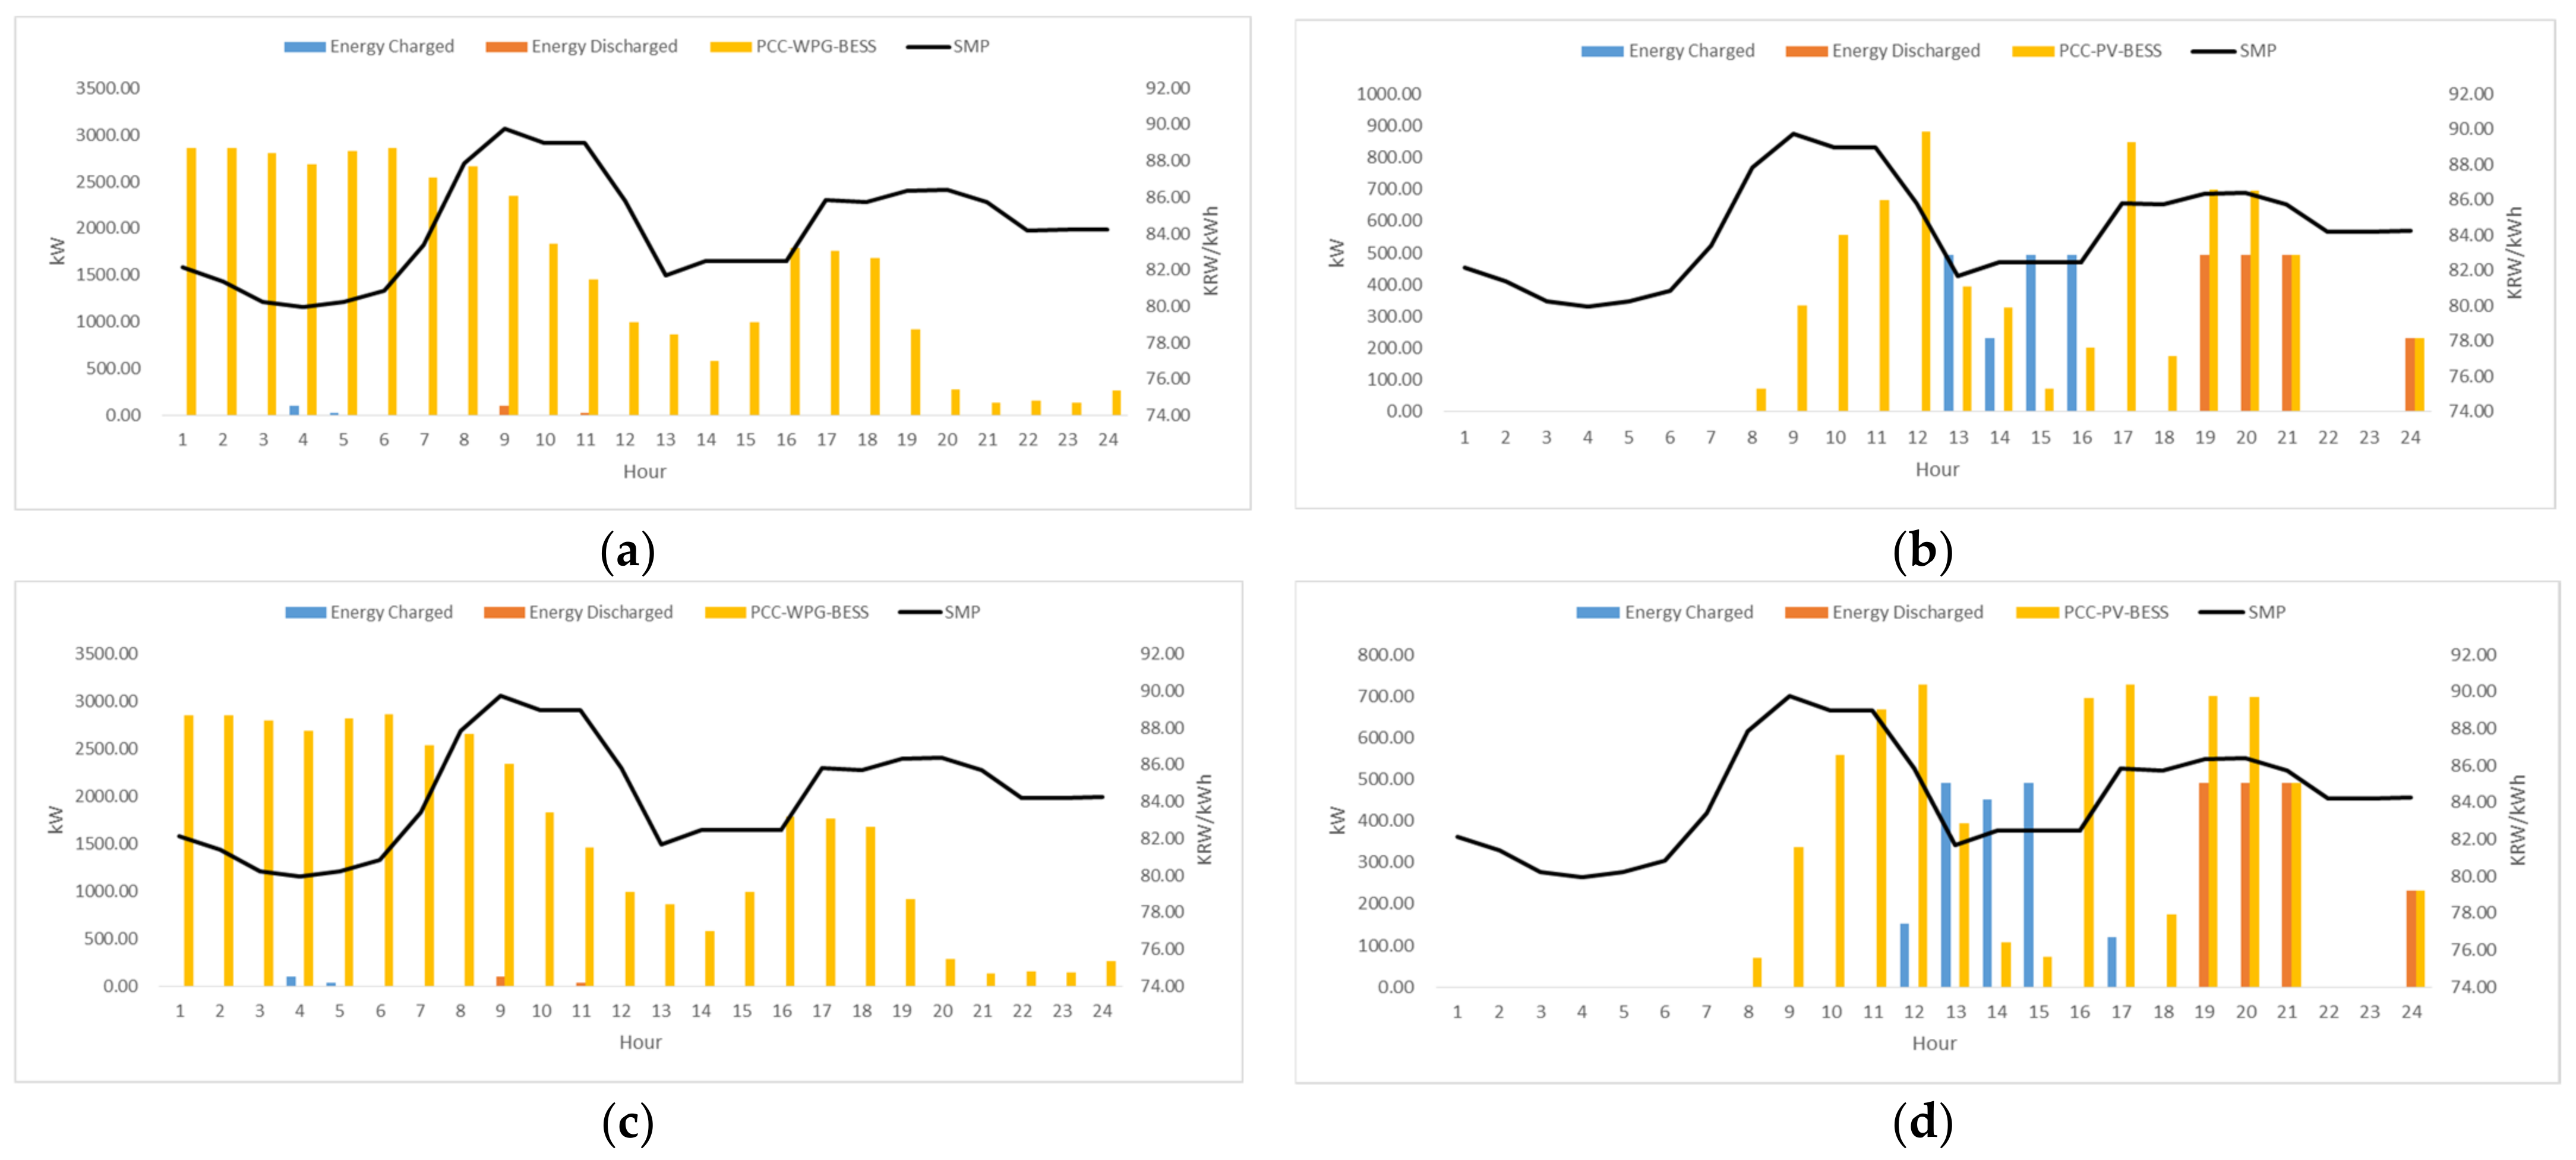
Figure 12 illustrates operations of the BESS coordinated with the renewables, considering the reliability constraints imposed by the reliability commission without additional incentives for energy discharged from the BESS.
As presented in
Figure 12d, after implementation of the reliability constraint, the BESS discharged the energy, considering a 70% reliability constraint on the output. In the figure, it can be observed that the BESS tended to charge the discharge energy more frequently throughout the charging periods, forcing the BESS to discharge greater energy during the off-peak periods, as intended. Compared to the energy charged and discharged in the former case, the total energy from both operations was the same, calculated to be 128.64 kWh and 1707.81 kWh, despite the reliability criteria limiting the output at the PCC by 70% of the nominal capacity of the PV, and the fact that the schedule for the charging operation was shifted backwards for the periods with lower SMP.
Figure 12c presents the scheduling result from the coordination between the WPG and the BESS. As also presented in
Table 11 and
Table 12, without and with implementation of the reliability constraints, there is virtually no difference in the revenue between the operating schedules from the perspective of the revenue streams.
The revenues generated from the intraday operations represented in
Table 11 and
Table 12 without and with the reliability constraints. Despite the reliability constraint limiting the output measured at the PCC by 70%, the revenue from REC1 and REC5 virtually did not differ. The revenue from SMP was the only stream which exhibited differences, because the imposed constraint and decreased revenue by 0.16%.
Furthermore, from the perspective of increasing the total revenue, even though reliability constraints on the output were imposed, compared to the former scenario, the total revenue of the portfolio with the PV and the BESS from SMP and varied only 0.16% and 0.062% compared to the former revenue, implying that the reliability constraint does not significantly influence the revenue, unless the utilization factor of the PV itself in the site continuously exceeds 70% and the SMP is greater than prices of the REC.
5.4. Case 3—Profit Maximization with Reliability Constraint and Incentives by the Committee
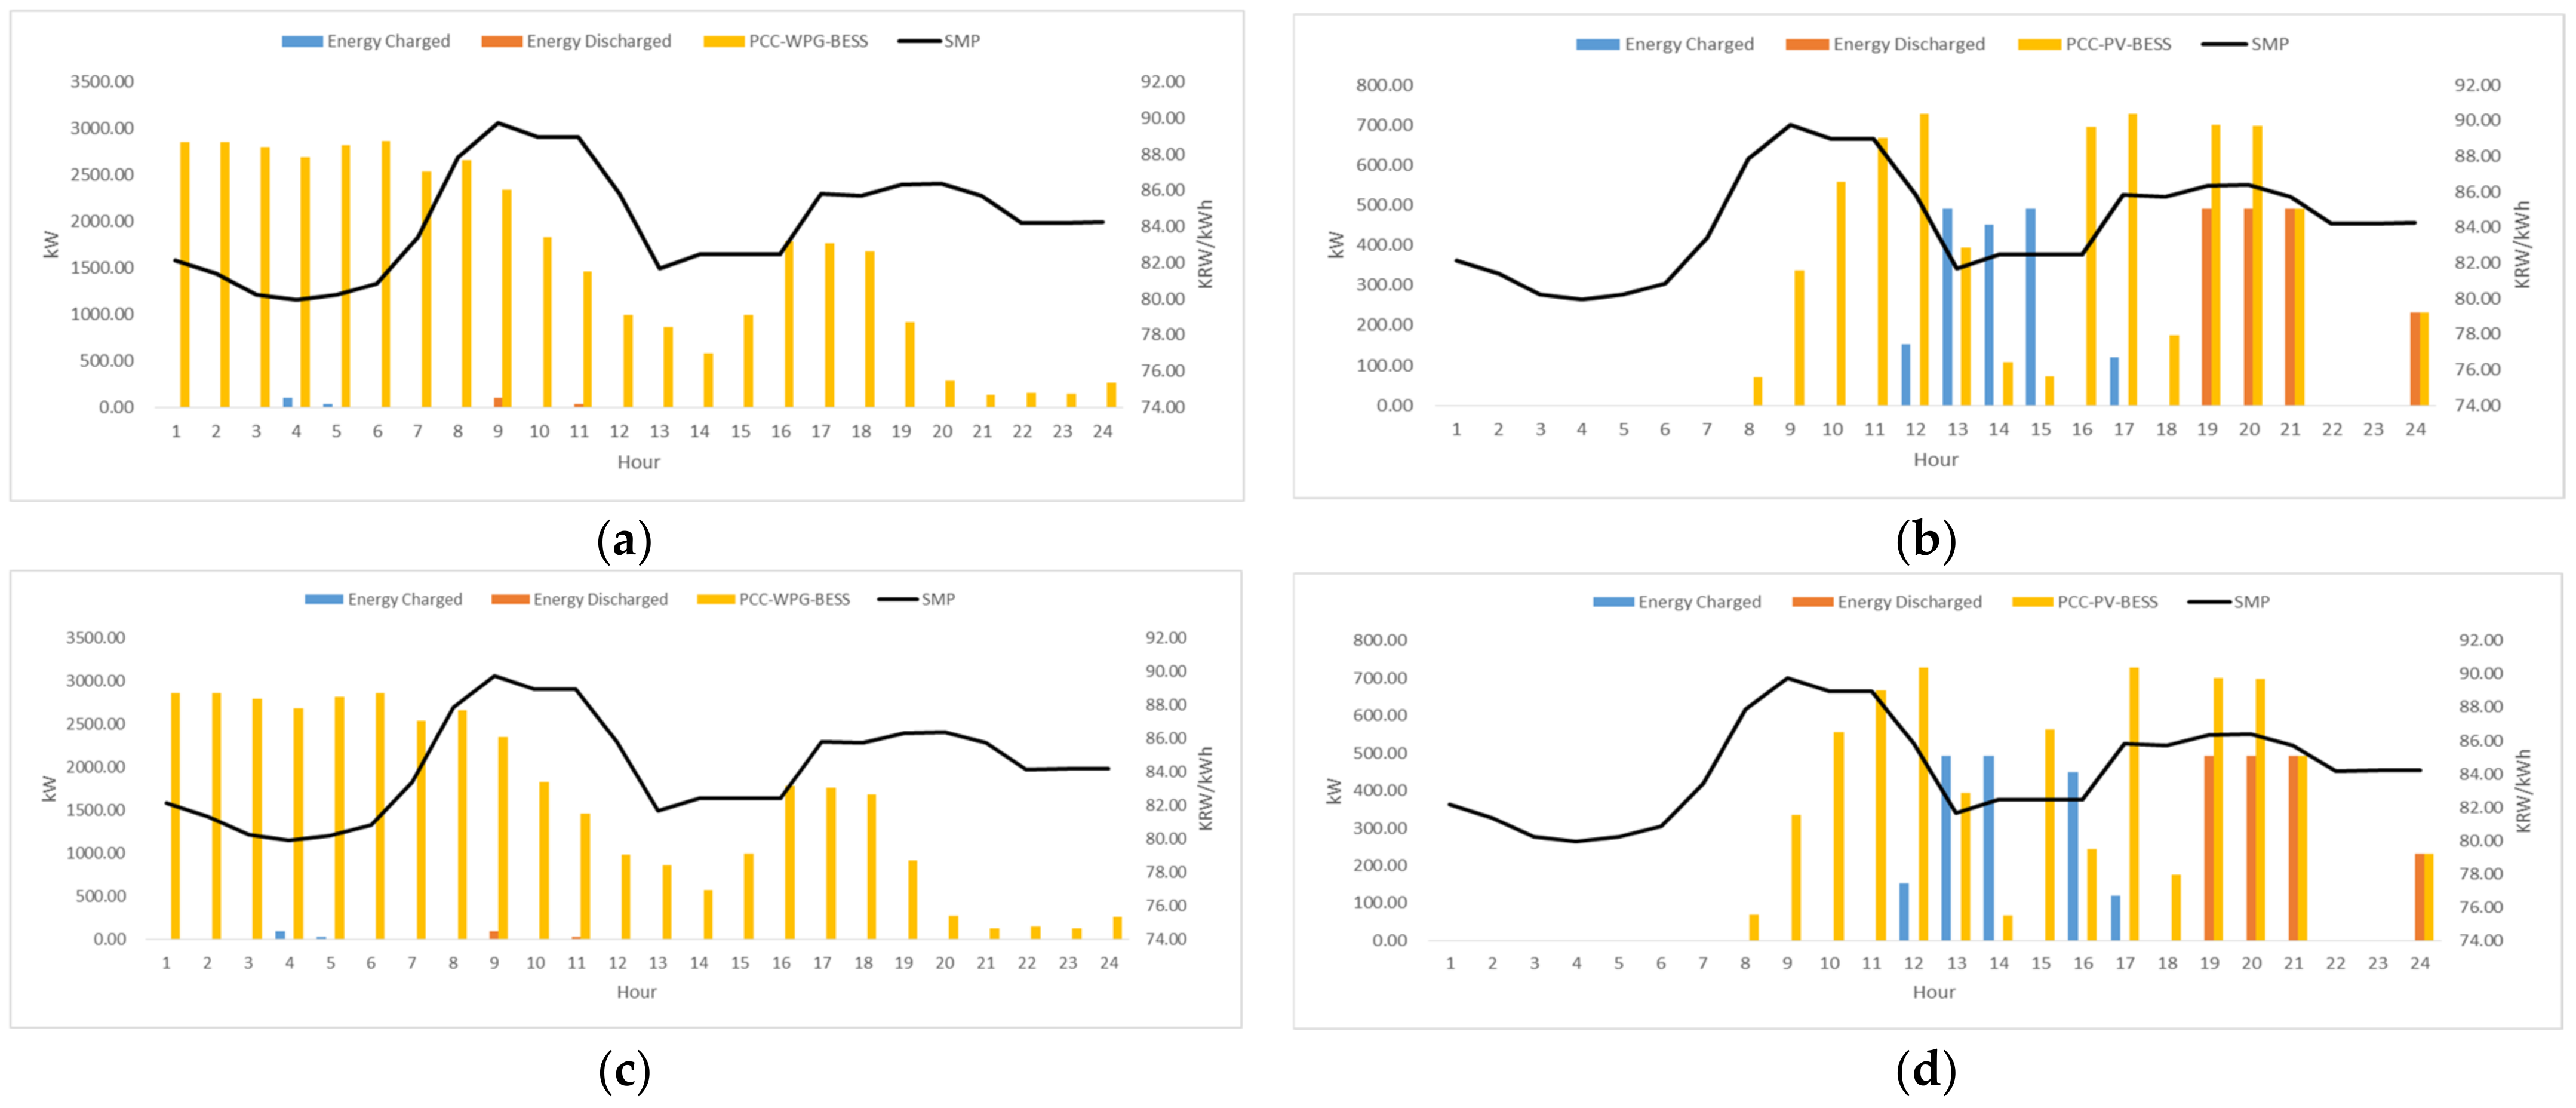
Figure 13 illustrates operations of the BESS coordinated with the renewables, considering the reliability constraints imposed by the reliability commission and the additional incentives for the energy discharged from the BESS.
As presented in
Figure 13d, due to the additional incentives introduced for the energy discharged from the BESS, the BESS coordinated with the PV discharged considering patterns of the SMP, because the SMP was greater than the price of the REC during the interval when the BESS was scheduled to discharge.
Table 13 and
Table 14 presented a comparison of the revenue generated from the profit-maximized portfolio without reliability incentives to the revenue generated from the profit maximization with incentives; the difference in the revenue from SMP was calculated to be approximately 0.77% for the portfolio with the PV and the BESS, whereas the revenue from REC1 and REC5 did not change at all. In the case of the revenue generated from the portfolio with the BESS and the WPG, the revenue from the SMP with and without the reliability incentives varied by 0.01%, and no difference occurred between the revenues from REC1 and REC5. Thus, effects of the reliability incentive did not influence the scheduling results from the revenue’s perspective.
5.5. Correlation between SMP and Output Control
Table 15 presents the correlation after the constraints were implemented. As demonstrated by simulation in the base case, the output coordination of the resource portfolio with the PV and BESS seemed to consider patterns of SMP on the day, because the correlation between them was determined to be 0.4113.
However, as illustrated in
Figure 10b, this was because the seasonal peak period from 09:00 to 12:00, which had the greatest SMP, coincided with outputs of the PV, because the case reflected the current control scheme with a fixed interval for BESS operation and virtually no output control.
In the case of the portfolio with the WPG and the BESS in the base case, the correlation between them was determined to be −0.3014, indicating that management of the output control at the PCC was conducted in contrast to the purpose not only from the SO’s perspective, but also from the AO’s perspective. However, after the control algorithm was introduced, the output control considered patterns of SMP on the day, which was indicated by the greater correlation of 0.2034.
The correlations determined between Case 2 and Case 3 by the resource portfolio with the PV and the BESS did not exhibit significant differences. One of the plausible reasons for the change in the pattern of the output control is the introduced reliability constraint, because the schedule of the BESS had to be shifted due to the maximum output limit. However, because an incentive for energy discharge from the BESS was introduced in Case 3, the output control was managed with greater sensitivity to patterns of the SMP, whereas the correlation with the resource portfolio with the WPG and the BESS did not significantly improve due to the negligible capacity of the BESS installed.
Table 16 presents the correlations derived from scheduled operations of the BESS. Although the absolute energy scheduled during the eligible scheduling periods for each operation of the BESS was the same, excluding the result from the base case, it is possible to confirm that decision periods of when to charge or discharge the BESS contributed to improvements of the output control. For instance, from the results of the coordination of both resource portfolios, the BESS in each resource portfolio was demonstrated to charge when SMP was low, as indicated by the negative correlation with greater magnitude as the control algorithm and the constraints were introduced.
6. Conclusions
In this paper, MILP-based scheduling methods for the portfolio management of DER in South Korea are presented, considering the REC, incentives after energy discharge and conformity of the reliability constraints, and influences in the revenue streams. Currently, AOs participating in the REC market as DER are required to perform DA scheduling for participation with hourly granularity. Thus far, AOs have been scheduling their resources in fixed intervals without considering controlling the BESSs during other time windows ineligible for multipliers, causing fire issues from undesirable operation that have been considered to be one of the major barriers to developing the REC market in South Korea. Thus, constraints on the output at the PCC, time and management of the SoC have been imposed since the year 2020 by the reliability commission.
However, based on our simulation results, it was demonstrated that the reliability criteria do not significantly influence the revenue streams, considering that the capacity factor of a PV generator is not greater than 70%. The differences in the revenue after implementation of the reliability constraints were calculated to be 0.06% with the output limit at the PCC, and less than 0.3% with the reliability incentive. Thus, the major factor for profit maximization from the AO’s perspective is concluded to be the introduction of structured control logic which improves the revenue streams of the portfolio with the BESS and the PV by 14.25%, and output constraints at the PCC shift the operation pattern of the BESS to the desired intervals. In the case of the portfolio with the BESS and the WPG, due to the negligible size of the BESS installed, there was no significant change in the revenue stream in each case. However, from the perspective of the control schemes, the BESS coordinated with the WPG operated considering patterns of SMP, as intended for its primary purpose, and demonstrated via the correlations.
Furthermore, it was possible to confirm that the BESS discharged not at its full ramp rate considering the reliability constraint imposed, whereas it formerly discharged at its maximum ramp rate immediately, regardless of the patterns of the SMP. Considering the results determined from the AO’s perspectives, the reliability constraints currently in effect are therefore concluded not to be significant environmental variables influencing the coordination, but induce greater discharging operations during off-peak periods to a certain extent.


