1. Introduction
In the early 1950s, light coagulation was introduced as an outstanding optical therapeutic tool for remote tissue manipulation to prevent retinal detachment after retinal break formation [
1]. The resulting technique is known today as laser photocoagulation (LPC) and is widely used as a treatment modality. In addition to its application for retinal detachment, LPC was found to be beneficial for ablative treatment of diabetic retinopathy [
2], diabetic macular edema [
3], central serous retinopathy [
4] and other retinal pathologies. In LPC, millisecond laser-pulsed irradiation is absorbed by tissue pigments and converted to heat, causing photothermal denaturation. The delicate multi-layer retinal structure, consisting of the retinal pigment epithelium (RPE), Bruch’s membrane, choriocapillaris and the otherwise healthy overlying neuroretina, including the sensitive photoreceptor cells, are collaterally damaged by laser pulses in the millisecond range, due to the relatively slow heating process and the relatively fast heat dissipation into the directly unheated neighboring tissue. This indirect heating resulting from excessive power in turn leads to scotoma, reduced night vision and disruption of the retinal anatomy through scarring [
5,
6]. Therefore, it is not possible to use LPC near the fovea because of the high risk of permanent loss of central vision [
7,
8]. These disadvantages have led to the development of new laser treatment modalities, which aim to produce specific therapeutic results without damaging photoreceptors and the neural retina by selectively acting on target structures. Among these treatment techniques, selective retina therapy (SRT), which targets only the prismatic retinal pigment epithelial cell monolayer, is particularly suitable [
9]. The treatment is intended to selectively destroy a portion of defective RPE cells and utilize the regenerative abilities of the epithelium to recover its original structure. The targeted apoptotic RPE cells are cleared by phagocytosis, while extracellular debris is cleared by macrophages. Migration and proliferation of healthy neighboring RPE cells follow [
10,
11]. The stimulation of RPE cell migration is hypothesized to finally lead to improved metabolism at the target sites [
9], which has been reported to have beneficial effects for patients suffering from RPE-related retinal diseases such as central serous chorioretinopathy [
12]. The basis for this selective RPE damage is provided by the intracellular melanosomes, which despite the <10 µm thickness of the RPE monolayer [
13], absorb about 50% of the incident light in the green spectral range. Within the thermal confinement of SRT, peak temperatures initiate microsecond-lifetime microbubble formation (MBF) on the melanosome’s surface [
14]. The rapid mechanical expansion and collapse of these microbubbles causes RPE cell-wall disruption, followed by immediate or delayed cell death [
15].
Nevertheless, in practice, achieving selective RPE cell damage without damaging the surrounding tissue via heat diffusion is challenging due to the RPE’s strongly varying melanin concentration. A successful SRT application is essentially based on the following two factors: first, the applied laser pulse duration, and second, accurate real-time energy dosing that depends on radiant exposure and local RPE absorptivity.
Regarding pulse durations, different experiments have shown that RPE cell death coincides with MBF for laser pulse durations up to 50 µs [
16,
17]. Lee et al. were able to show that, in the case of 1, 5 and 10 µs laser pulse duration, more than 95% of dead cells were associated with MBF, whereas the ratio decreased to 65% and 45% for longer 20 and 40 µs pulses, respectively [
18]. This suggests that pulse durations longer than 20 µs delineate the limit of thermal confinement for SRT; beyond this, the technique appears impractical even with the use of real-time dosimetry. By contrast, SRT laser pulses in the microsecond time regime (1.7 µs, 5 µs) appear favorable compared to nanosecond pulses (8 ns, 200 ns) in preventing unintentional retinal damage [
19,
20]. Recent clinical studies have shown promising results using SRT with a series of 15 to 30 pulses, at 1.7 µs pulse duration and repetition rates of 100 Hz [
12,
21,
22].
For clinical SRT application, energy dosing (i.e., absorption-corrected radiant exposure) is essential. In order to conserve photoreceptor integrity, SRT irradiation must be kept within a small treatment window close above the MBF threshold, so as to avoid insufficient or excessive exposure that would result in negligible or negative effects. This threshold varies both between patients and within retinal regions of individual patients, because of the optical transmission differences and light absorption variability at the fundus due to the localized melanosome density [
5]. Furthermore, by definition, the treatment window of SRT limits induced tissue damage to the RPE within, and thus is undetectable during visual inspection of the fundus. Currently, selective RPE damage caused by microsecond laser irradiation is only detectable with biochemical methods such as fundus fluorescein angiography (FFA). This has two major drawbacks: first, it is invasive—due to the intravenously injected dye—which introduces a risk of anaphylactic shock, and second, it has a significant delay, since FFA can only be performed post-SRT-treatment (and only once per day). Hence, several approaches for real-time MBF detection and real-time laser exposure control for individual lesions (feedback-controlled irradiation) are under development. Methods such as measuring the increased reflectance at the bubble surface via backscattered light or capturing the ultrasonic emission of vaporization to detect the appearance of MBF have been successfully tested [
17,
23].
An alternative dosimetry approach is to use spectral-domain optical coherence tomography (SD-OCT) simultaneously with SRT to observe MBF formation. This method was described first by Steiner et al., who indirectly detected tissue effects of laser pulses as signal changes in time-resolved SD-OCT A-scans (M-scans), which correspond to a change in the local reflectivity of tissue [
24,
25,
26]. The detailed origin of this signal loss is still debated, but the currently favored hypothesis explains it as “coherent fringe washouts” resulting from the axial motion of the retina due to MBF. This coherence decorrelation is assumed to result from rapid fluctuations of the spectral phase, which are faster than the integration time of the detector and therefore larger than 2π within the acquisition time of the interferometric measurement (typically 10 to 30 µs). Successively, the time-averaged heterodyne signal—the spectral fringe pattern—diminishes, while the homodyne components—the spectral shape—are almost unaffected. This behavior indicates that neither the local nor the overall reflectivity is altered, and sensor overexposure can be ruled out as an origin of the phenomenon. Stronger changes, caused by fast variations in reflectance, i.e., as expected from larger quickly expanding or collapsing microbubbles with their high refractive index jumps between gas and fluid, also result in a loss of the homodyne signal. However, MBF also affects the homodyne spectral shape at the MBF-location, while the resulting sonic vibrations spread out laterally and axially for multiple tens of micrometers, thereby forming an enlarged volume of rapid oscillations where OCT signals get cloaked. The resulting significant sensitivity advantage of the OCT-approach compared to direct reflectance sensing potentially enables irradiation-effect estimation even at levels beneath the cell-lethality threshold.
Based on this model, using signal changes of SD-OCT M-scans, Kaufmann et al. were able to precisely predict RPE lesions post-treatment in ex vivo porcine eyes [
27,
28]. Furthermore, Kaufmann et al. showed that SRT in ramp mode, combined with fast algorithm-based SD-OCT treatment termination, could provide reliable SRT dosing and prevent overtreatment. Recently, Lee et al. were able to show the same effect of abrupt signal changes with a slightly different OCT acquisition scheme, which utilized a wavelength scanning radiation source termed “swept-source” (SS-OCT) [
29]. These authors also aimed to extract local temperature information from speckle variations, to support the hypothesis that this occurred due to strictly localized heating of melanosomes without major temperature increases in neighboring regions [
29].
With this tool for monitoring stress at the cellular scale, the optimal pulse parameters leading to the desired cellular damage can be explored in more detail. To enable automated, highly reliable, selective RPE-level laser treatment, with maximum clinical control, it is necessary to further analyze how well the OCT signal can predict different biological outcomes. The aim of the current work was therefore to investigate the range of pulse durations (from 2 to 20 µs) in more detail with respect to the threshold radiant exposure for RPE cell damage. A fluorescence-based vitality stain (calcein-AM-assay, median effective dose for RPE cell damage: ) was used directly after laser irradiation. The fluorescence change index of cell damage was compared with fringe washouts observed in SD-OCT M-scans (median effective dose for fringe washouts: ). If the threshold for fringe washouts equals the threshold for RPE cell damage, then the damage can be assumed to be primarily thermomechanical, and thus likely to result in the desired selective RPE damage. Such knowledge may allow the pulse duration regime for SRT to shift to higher pulse durations.
To test the hypothesis that SD-OCT has the potential to be used for real-time dosimetry of RPE cell damage, a specially designed system [
30] was employed to investigate OCT M-scan fringe washouts during microsecond laser irradiation. Successively, the therapeutic window required to achieve a selective effect in the RPE was examined to investigate if it could be expanded from 1.7 µs—as previously used in Q-switched laser systems (i.e., R:GEN, Lutronic, Gyeonggi-do, Korea)—to longer pulse durations, which would allow the use of smaller, better controllable and more flexible SRT laser sources.
2. Materials and Methods
2.1. Treatment and Monitoring System
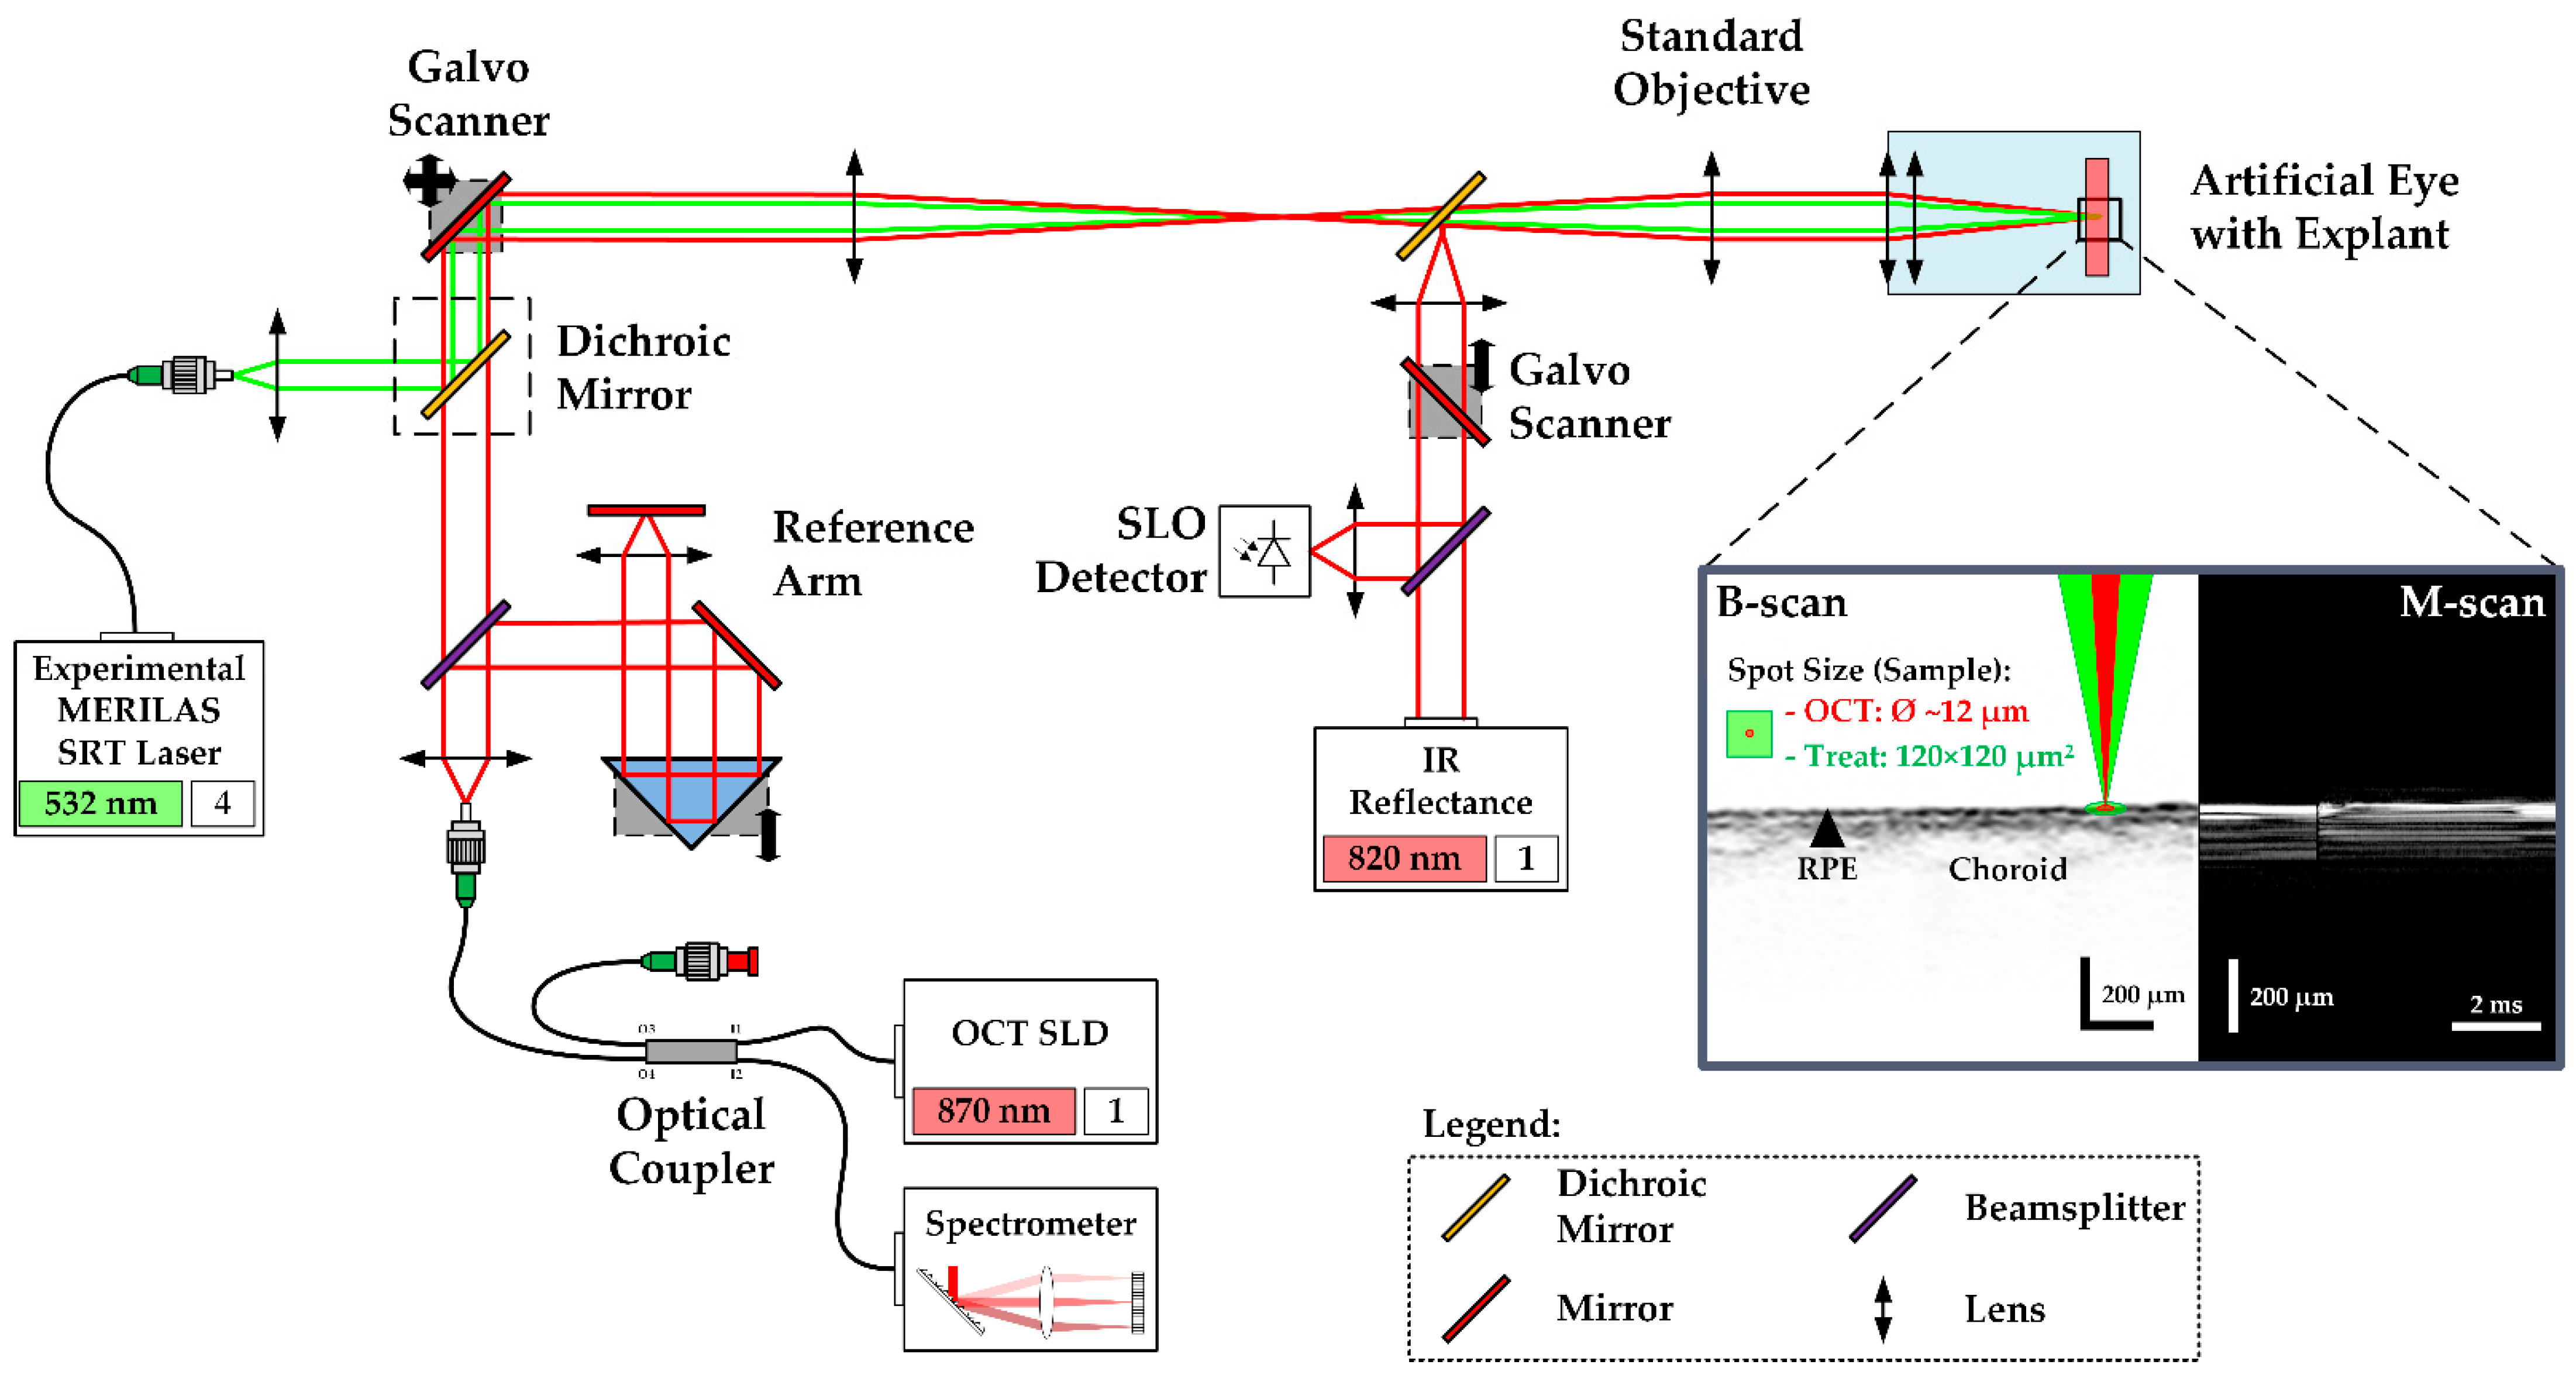
The so-called Spectralis Centaurus system (HuCE-optoLab, Bern University of Applied Sciences, Biel, CH) was used for the experiments. It consists of an opto-mechanically upgraded commercial diagnostic imaging platform (SPECTRALIS HRA+OCT, Heidelberg Engineering, Heidelberg, DE) and is extended with an experimental SRT laser (modified MERILAS 532 shortpulse, Meridian, Thun, CH). The system utilizes SD-OCT as widely used for diagnosis of retinal diseases by capturing cross-sectional and volumetric images (B- and C-scans). It features the ability of intervention planning via a coaxially integrated confocal scanning laser ophthalmoscope (cSLO). Furthermore, it can be operated in the so-called M-scan mode (motion mode) to measure time-resolved sequences of A-scans at the point of the therapy laser application, thereby revealing depth-resolved temporal signal fluctuations, e.g., tissue movements during laser exposure (
Figure 1).
The experimental SRT laser utilizes optically pumped semiconductor laser (OPSL) technology and emits light at 532 nm wavelength, with a peak power of 30 W. It can be operated in two different modes: CW mode and SRT mode. In CW mode, the laser operates like a conventional LPC laser, which was used to create marker lesions on the sample. In SRT mode, the laser emits single pulses or bursts of laser pulses of 2 to 20 µs pulse duration at a repetition rate of 100 Hz. The laser radiation is transmitted via a square core multimode fiber into the camera head of the system, to laterally homogenize the beam profile, where it is combined with the OCT laser beam by a dichroic mirror as depicted in
Figure 1. The projected top-hat square beam profile measured 120 × 120 µm
2 on the RPE-choroid-sclera explant’s surface. Prior to the tissue experiments, the top-hat square beam profile was rated regarding its spatial intensity modulation factor (IMF). The IMF describes the ratio of maximum to mean radiant exposure over the beam profile and was first introduced by Framme et al. in 2002 as a speckle factor [
31]. IMF = 1 corresponds to perfectly homogenous, top-hat radiant exposure. To calculate the IMF, the treatment laser beam was imaged with a magnification of 9.81 onto a beam analyzer camera (BC 106 VIS, Thorlabs Inc., Newton, NJ, USA)) behind the laser aperture of the system. An IMF = 1.3 was determined, which indicates a high-quality top-hat beam profile [
32].
The diagnostic imaging part of the system is based on spectral-domain (SD), also called Fourier-domain (FD) OCT, which allows high-speed and high-resolution imaging of the retina with an interferometric high-speed spectrometer, enabling simultaneous acquisition of a depth or amplitude mode (A) scan. The super-luminescence diode of the SD-OCT laser emits infrared radiation centered at 870 nm wavelength and 73 nm (840–913 nm) spectral bandwidth. The OCT system is operated at a rate of 33 kHz and 30.3 µs per A-scan integration time. In B-scan mode, the beam scans across the retina, producing a cross-sectional image. For volumetric, three-dimensional retinal imaging (C-scan), up to 768 orthogonally equally spaced B-scans are acquired sequentially.
In the experiment, treatment laser exposures for the creation of RPE lesions were correlated to signal variations in SD-OCT M-scans, consisting of 256 sequentially recorded A-scans (at 7.76 ms total acquisition time per M-Scan). For each lesion, seven consecutive M-scans were recorded, which leads to time-resolved records of 37.24 ms duration. The treatment laser was triggered to emit at the first third of the M-scan time period. The OCT beam waist with a diameter of 12 µm was adjusted to the center of the treatment spot.
2.2. Treatment Pattern and Irradiation
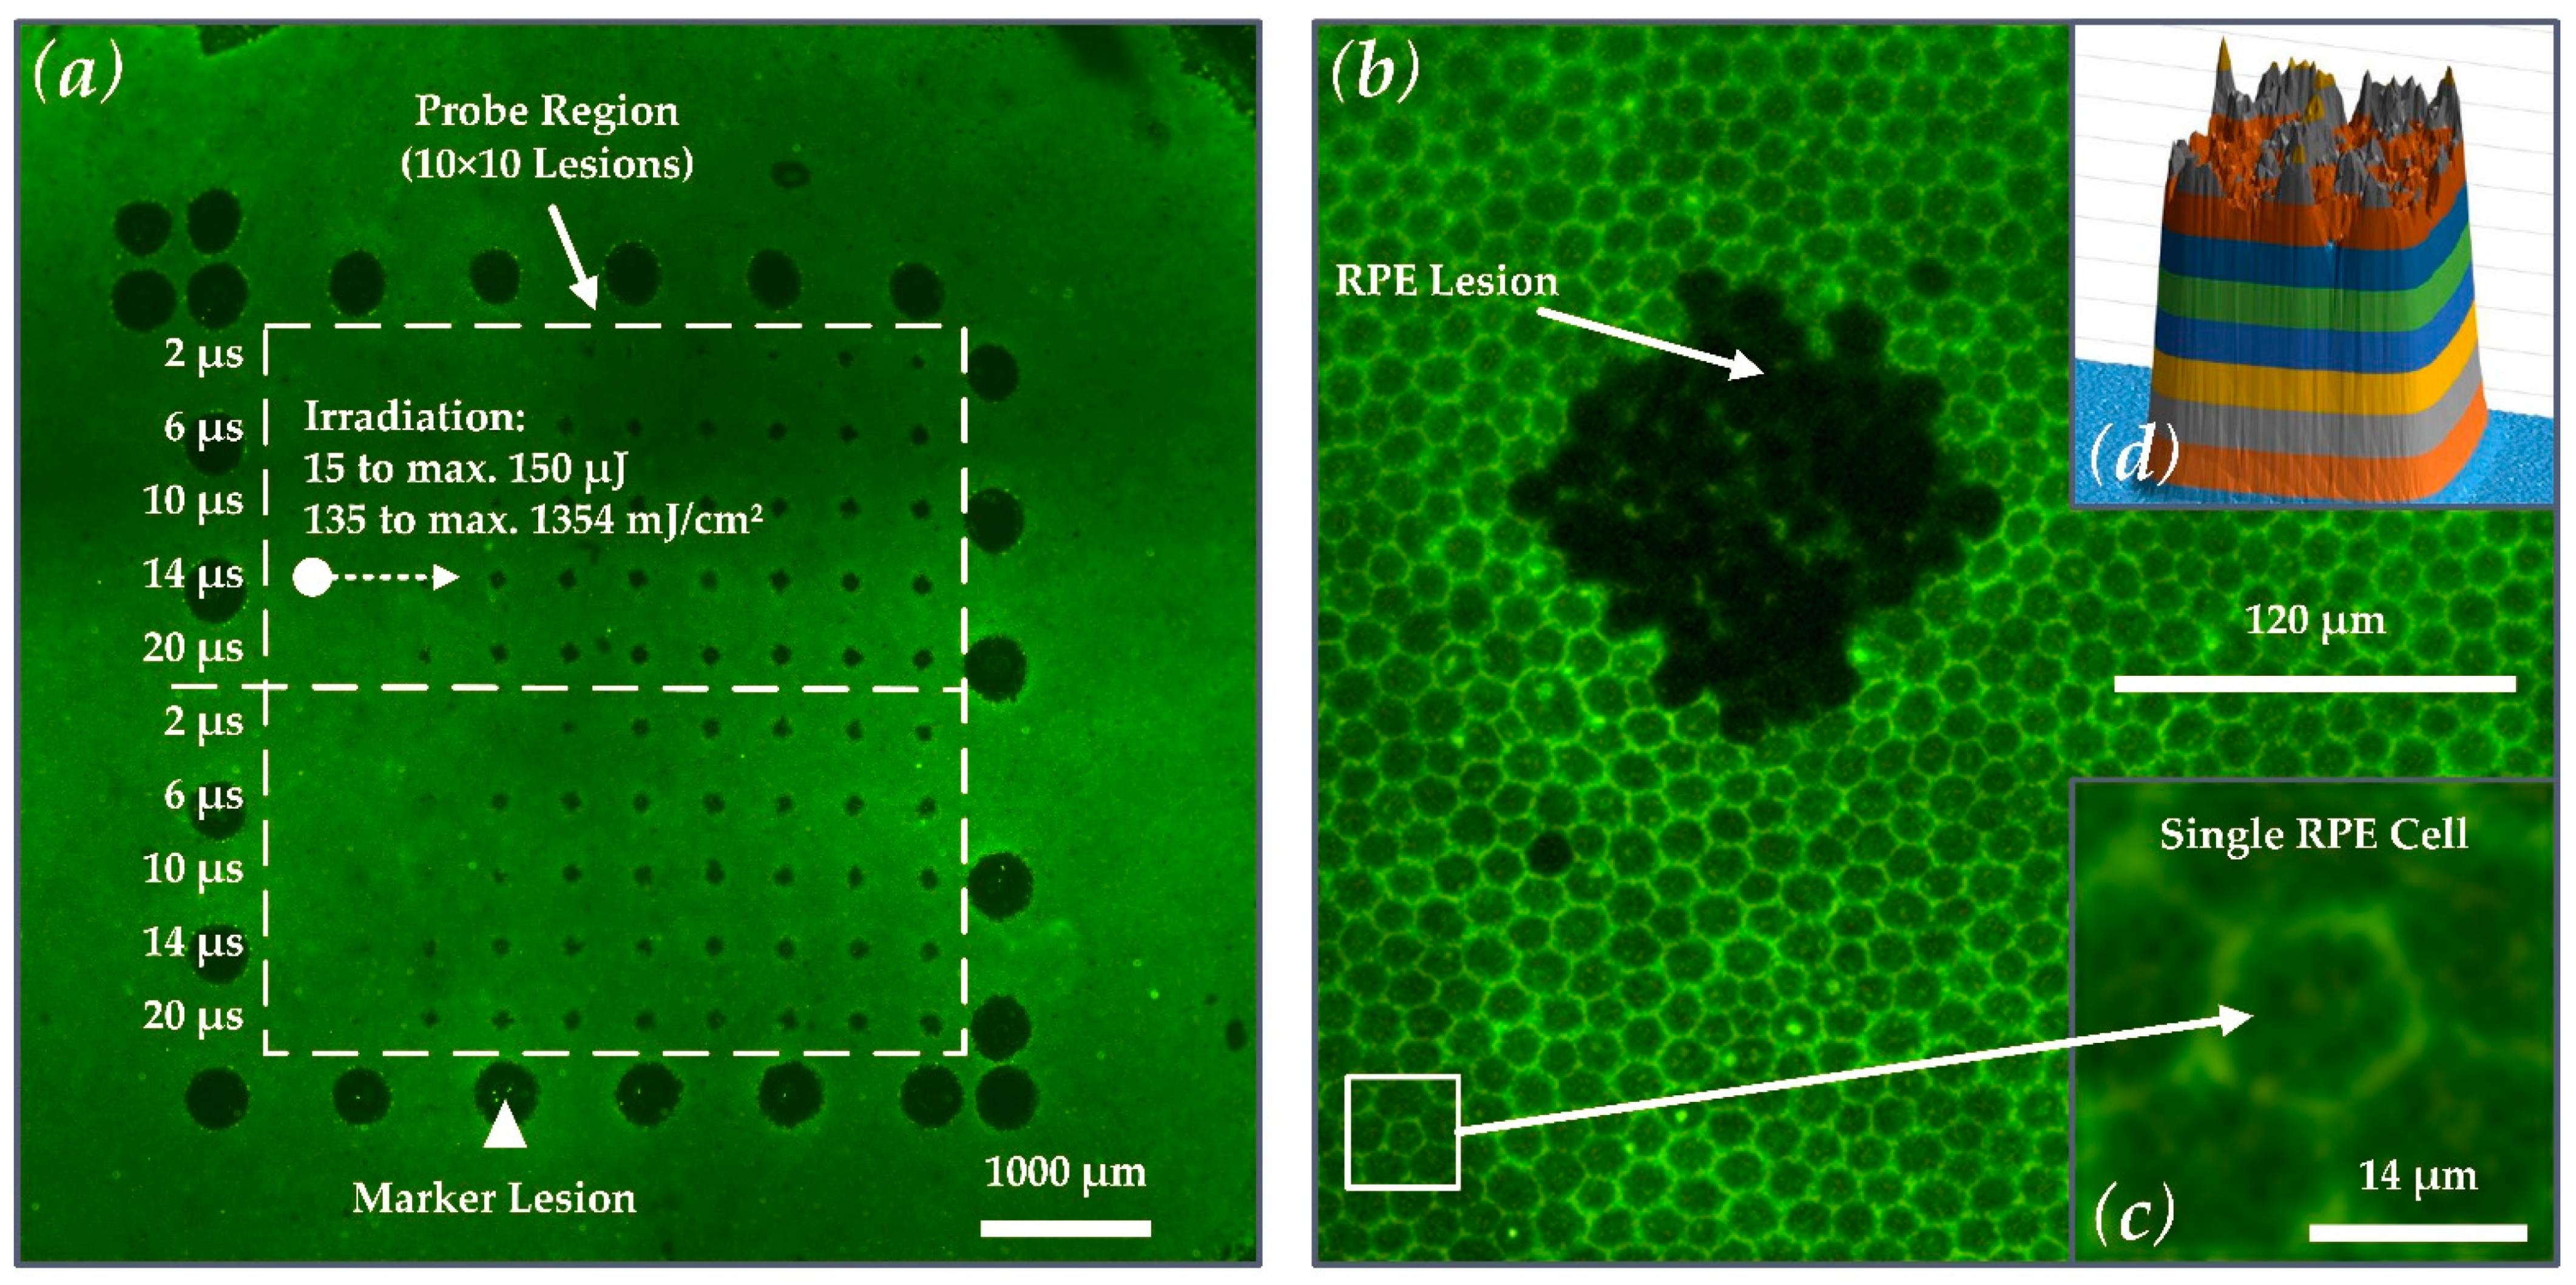
As depicted in
Figure 2a, the outer rim of the laser test pattern contained 25 LPC marker lesions. These marker lesions were applied in CW mode (200 ms pulse duration and 200 mW pulse power). The marker lesions served as an orientation guide in the evaluation process of the RPE explant. The microsecond laser probe region was placed inside the demarcation frame consisting of a pattern of 10 × 10 lesions. Laser pulses with durations of 2, 6, 10, 14 and 20 µs with increasing energy were applied. The exact radiant exposure values for each lesion can be found in
Table A1 in
Appendix A. The pulse energy was measured with a calibrated energy meter (J-10MB-LE, Coherent, Santa Clara, CA, USA) prior to the experiments in front of the laser aperture of the system. The energy meter has a measurement accuracy of 2.8% at 532 nm. The radiant exposures reported in this work were calculated using the following equation (using a spot size on the explant of A = 120 × 120 µm
2 (
Figure 2b) and an IMF of 1.3):
Figure 2a shows that the pulse duration was increased from top to bottom (2 to 20 µs), and the radiant exposure was increased from left (135 mJ/cm
2 ≙ 15 µJ) to right (maximum: 1354 mJ/cm
2 ≙ 150 µJ at 20 µs). Every laser setting appeared twice within the pattern to investigate reproducibility due to local variability in the RPE melanin distribution. The useful range of target energies for each pulse duration within the treatment pattern was pre-evaluated by multiple RPE explant tests.
2.3. Explant Preparation and Artificial Eye
In total, 13 RPE-choroid-sclera explants from enucleated porcine eyes were processed. The samples were stripped from anterior parts of the eye, lens and vitreous body and maintained in a Dulbecco’s Modified Eagle Medium (DMEM, high glucose, Merck KgaA, Darmstadt, Germany) mixed with 10% porcine serum, 1 mM sodium pyruvate and antibiotic antimicrobial agents on a heating plate at 37 °C during the test day. This method of tissue preparation has been previously described by Miura et al. [
34].
For irradiation, the RPE was retained in a customized artificial eye (Medical Laser Center Lübeck, Lübeck, Germany), kept at room temperature and placed in front of the laser system. It consisted of a cuvette for phosphate-buffered saline (PBS) solution, an explant holder, an integrated hard lens as cornea at the front (BC 7.8 mM, PAUL, Wöhlk, Schönkirchen, Germany) and a double-convex lens (32016, Edmund Optics Ltd., York, UK) as crystalline lens replacement with 65 dpt of optical power.
2.4. Calcein-AM Assay and Binary Evaluation of the RPE Damage
The viability of the RPE cells was tested by a calcein-AM assay directly after microsecond laser irradiation. Calcein-AM diffuses into the cell and is converted by intracellular esterases into calcein that fluorescents under blue light. Dead cells exhibit no esterase activity and therefore show no fluorescence. The RPE-choroid-sclera explants were incubated with 3 mM calcein-AM in PBS for 15 min. at room temperature. The viable-lethal analysis was conducted using a fluorescence microscope (Eclipse Ti-E, Nikon, Tokio, Japan) and a FITC-filter (excitation wavelength: 465–495 nm, dichroic for 505 nm, barrier filter at 515–555 nm). The cellular calcein-fluorescence assay had a binary outcome. In the case of visible SRT-induced damage, lesions were evaluated with 1 and in the case of no damage with 0. Visible damage was defined as a cluster of at least three non-fluorescing RPE cells in the exposure region, which appear dark in fluorescence microscopy. RPE damage exposure thresholds were determined via Probit-Plot analysis. The calculation was performed with Origin 2018 (OriginLab Corporation, Northampton, MA, USA) utilizing the Levenberg Marquardt iteration algorithm to fit with a χ
2-tolerance-value of 1 × 10
−9 within up to 400 iteration steps. The Probit-fit provides the irradiation threshold (ED
50-value). An ED
50 irradiation value means that 50% of treatments at this irradiation level depict RPE lesions. ED
15 and ED
85 values were calculated to visualize the width of the fitted normal distribution in a logarithmic covariant basis [
35]. Post-processing of the fluorescence microscopies was accomplished with the Fiji image processing package distribution of ImageJ [
36].
2.5. Binary Evaluation of M-Scan Fringe Washouts
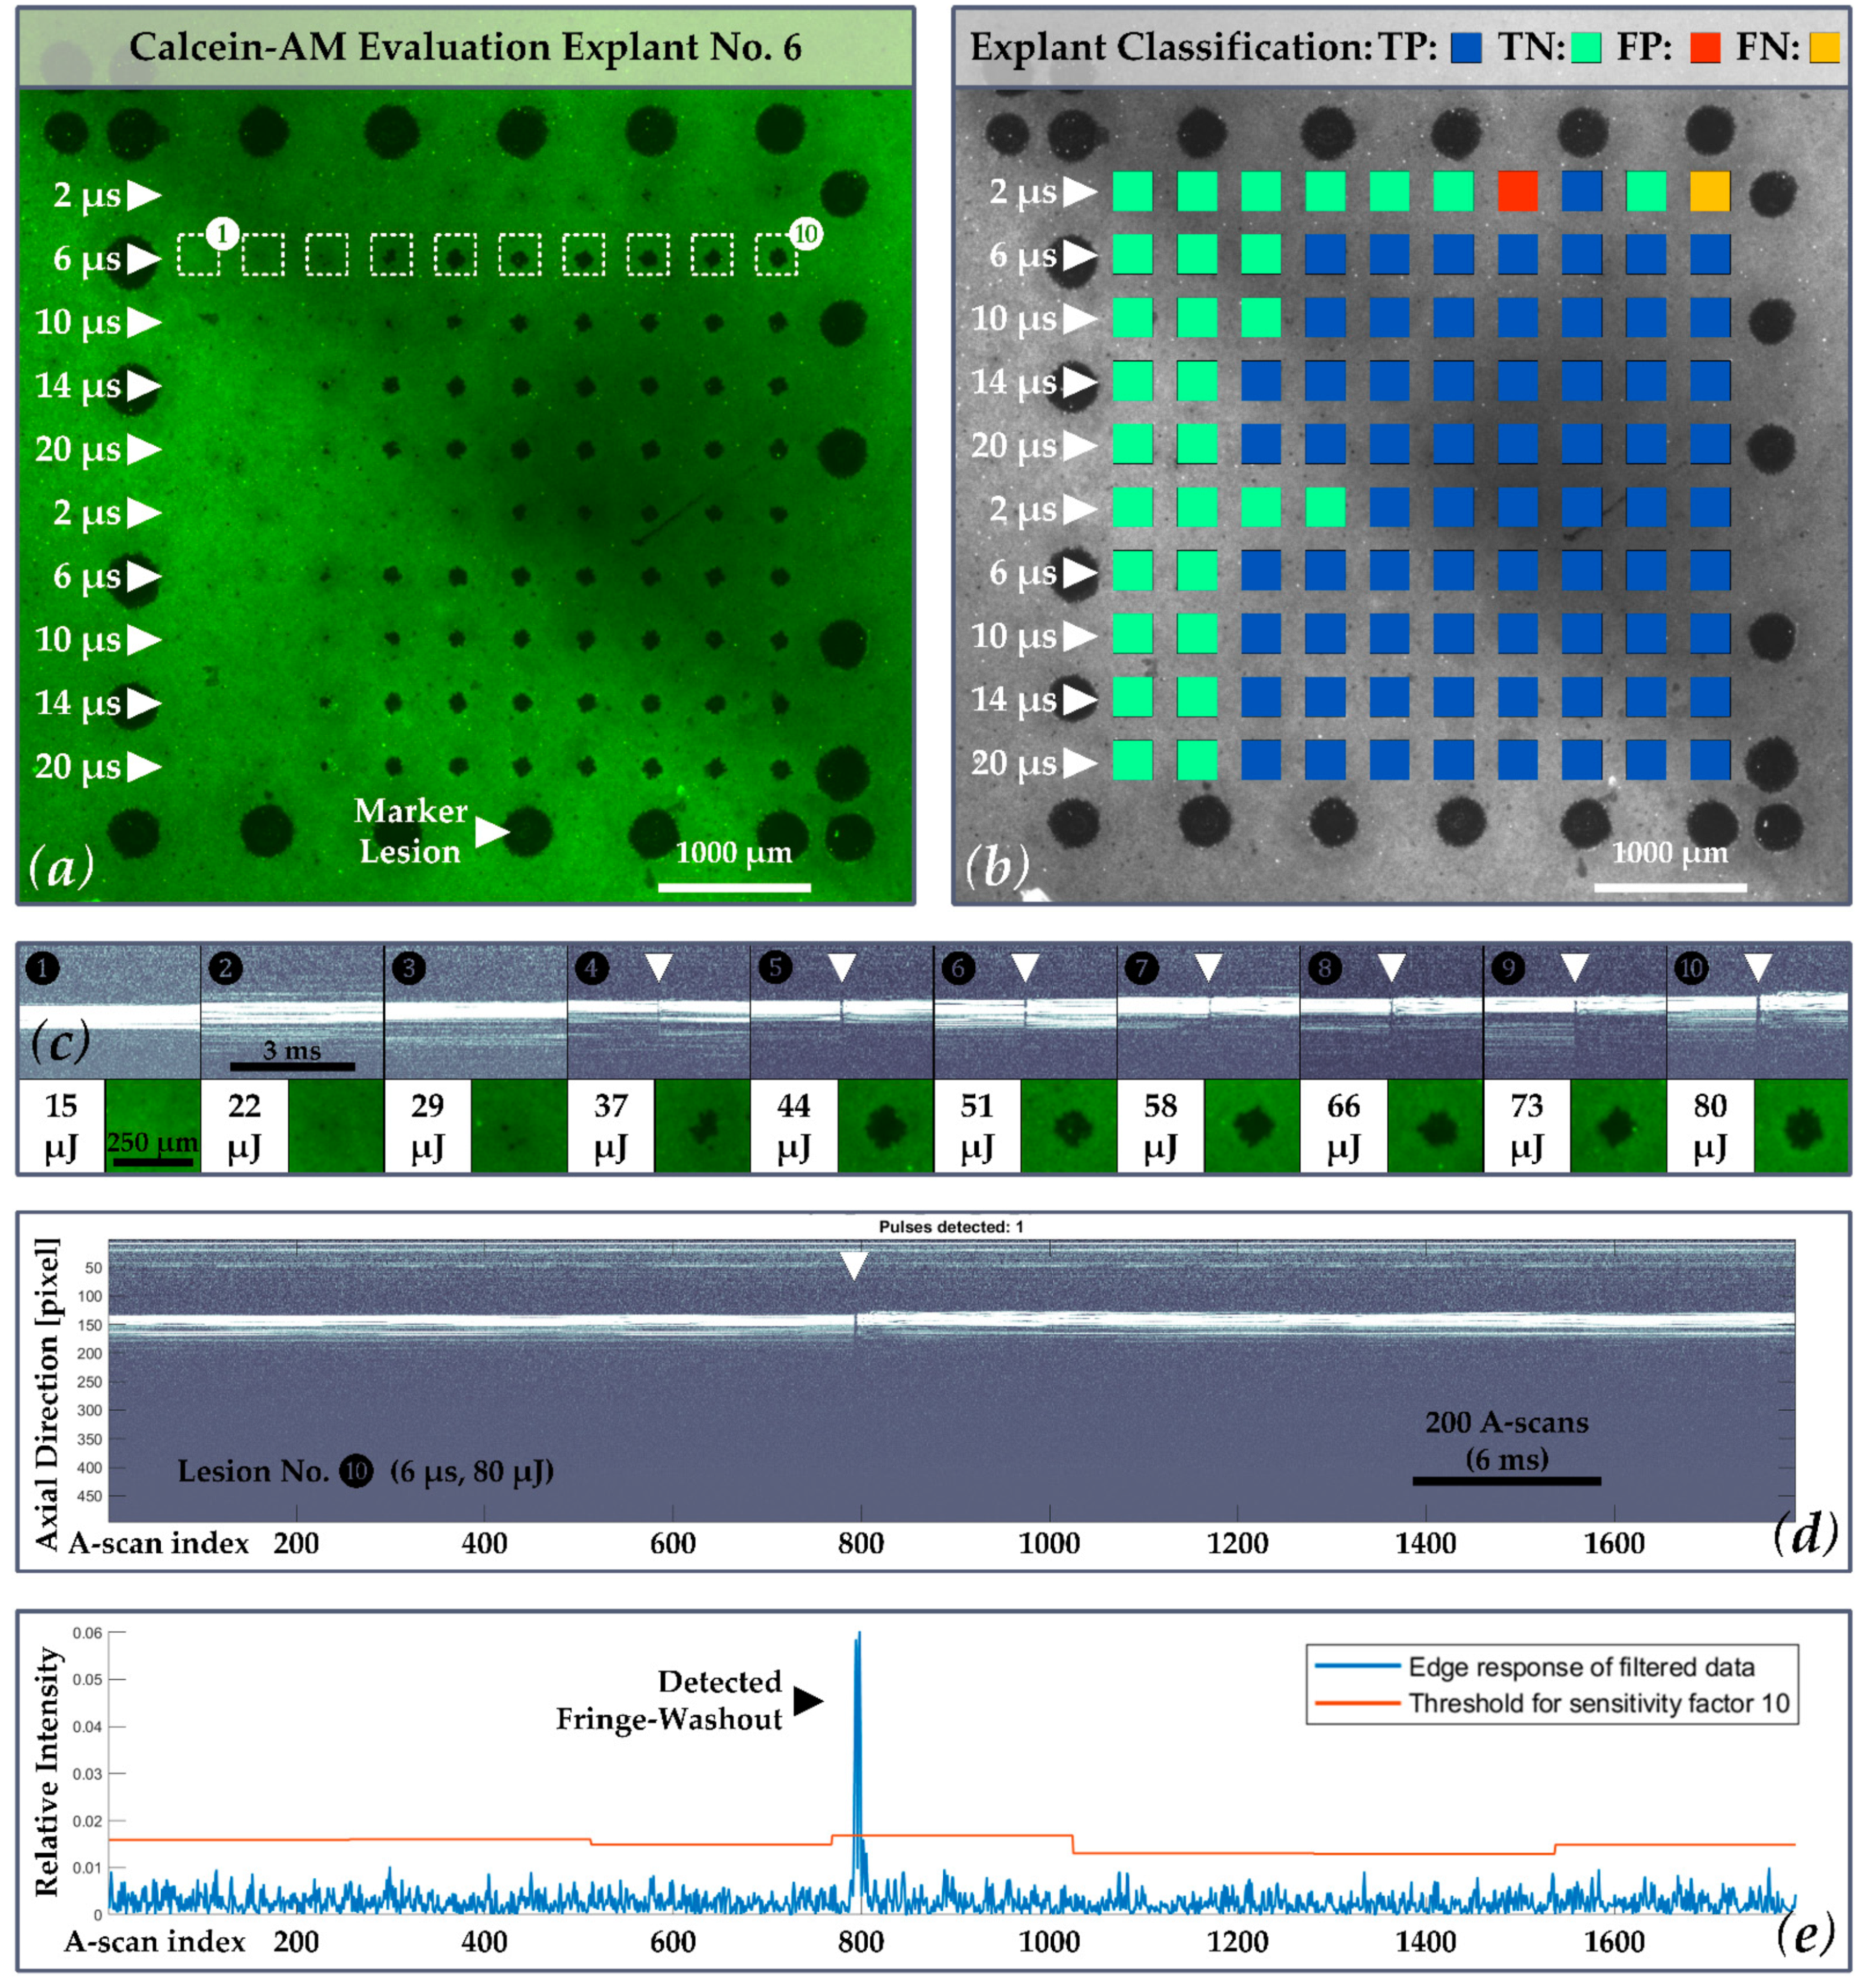
The SD-OCT M-Scans were examined for fringe washout using an automated OCT dosimetry algorithm. In the evaluation, which took place post-treatment, the automated OCT dosimetry algorithm detects fringe washouts in three basic steps, whereas each M-scan is processed separately (
Figure 3). First, the algorithm performs an intensity scaling and gamma correction for contrast enhancement and sums up the intensity values of each A-scan within the M-scan. Second, the data are convolved with a dedicated filter kernel to create a peak response to possible fringe washouts. Third, a dynamic threshold that adapts to noise and intensity differences is applied to the processed M-scans to identify fringe washouts based on the peak response from step two. According to the equation depicted in step No. 3. in
Figure 3, the threshold (
T) is based on a central tendency measure (
M) of the processed M-scan signal, a dispersion measure (
D) of the central tendency and a sensitivity factor (
κ) referred to as the
κ-value. The sensitivity factor describes that the value of the peak (fringe washout) must be
κ times the dispersion D away from the central tendency Μ [
37].
In view of a future in vivo application, the
κ-value was defined as a variable parameter that statically modulates the response and that must be selected manually by the operator. This will give the dosimetry algorithm a certain flexibility to adapt to different anatomical and optical eye conditions of patients. To check which algorithm setting could be suitable for future in vivo applications, the M-scan data were analyzed for fringe washouts with different
κ-values. Therefore, all acquired M-scans were evaluated with
κ-values ranging from 6 to 40 (
κ = 6, 9, 10, 11, 12, 13, 14, 15, 20 and 40). The selection of this range is based on previous Matthews correlation coefficient classifications [
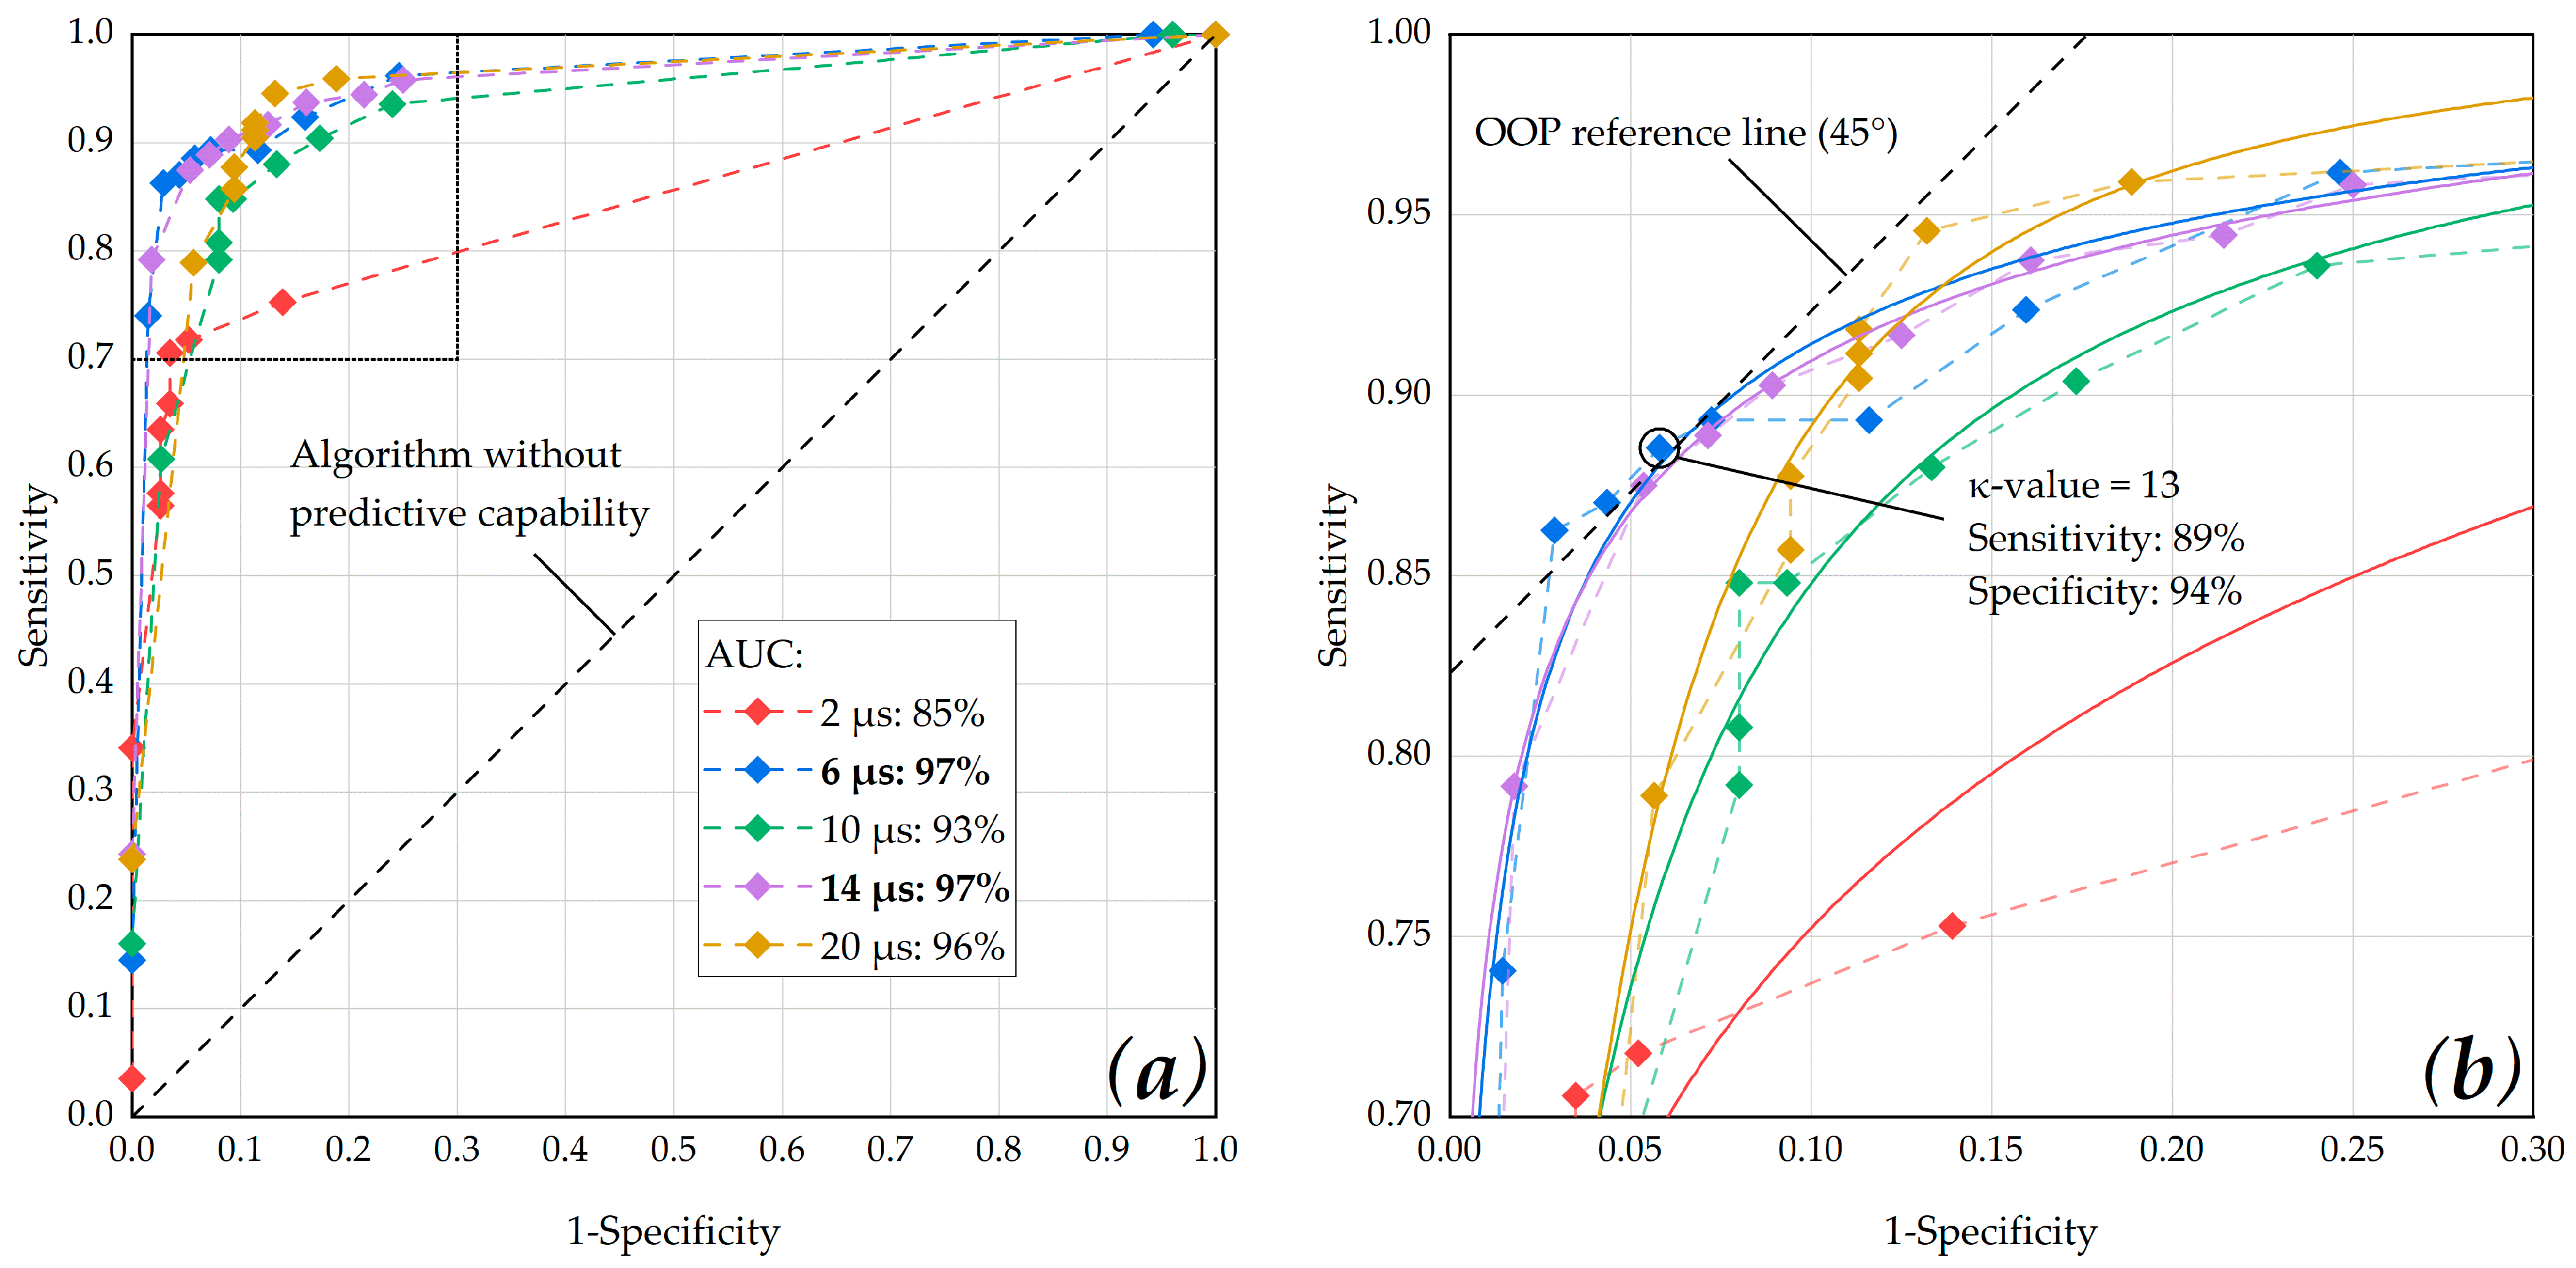
37]. The outcome of the M-scan evaluation was compared to the binary calcein-AM evaluation of the porcine RPE-choroid-sclera explants and classified by using the confusion matrix presented in the following section. Statistical measures were then analyzed via a receiver operating characteristic (ROC) curve. The ROC of an algorithm shows its performance as a tradeoff between selectivity and sensitivity, with the optimum performance in the top-left corner of the graph. Therefore, we used the ROC curve to determine the dosimetry algorithms optimal
κ-value by checking the optimal operating point (OOP) for each pulse duration. Furthermore, we calculated the area under the ROC curve (AUC) in order to determine for which pulse duration, the dosimetry algorithm showed the best overall performance.
2.6. Statistical Evaluation of OCT M-Scan and Calcein AM Data
The ground truth for the statistical evaluation is based on the binary calcein-AM evaluation of the porcine RPE-choroid-sclera explants and the hypothesis that RPE lesions due to MBF lead to fringe washouts in SD-OCT M-scans.
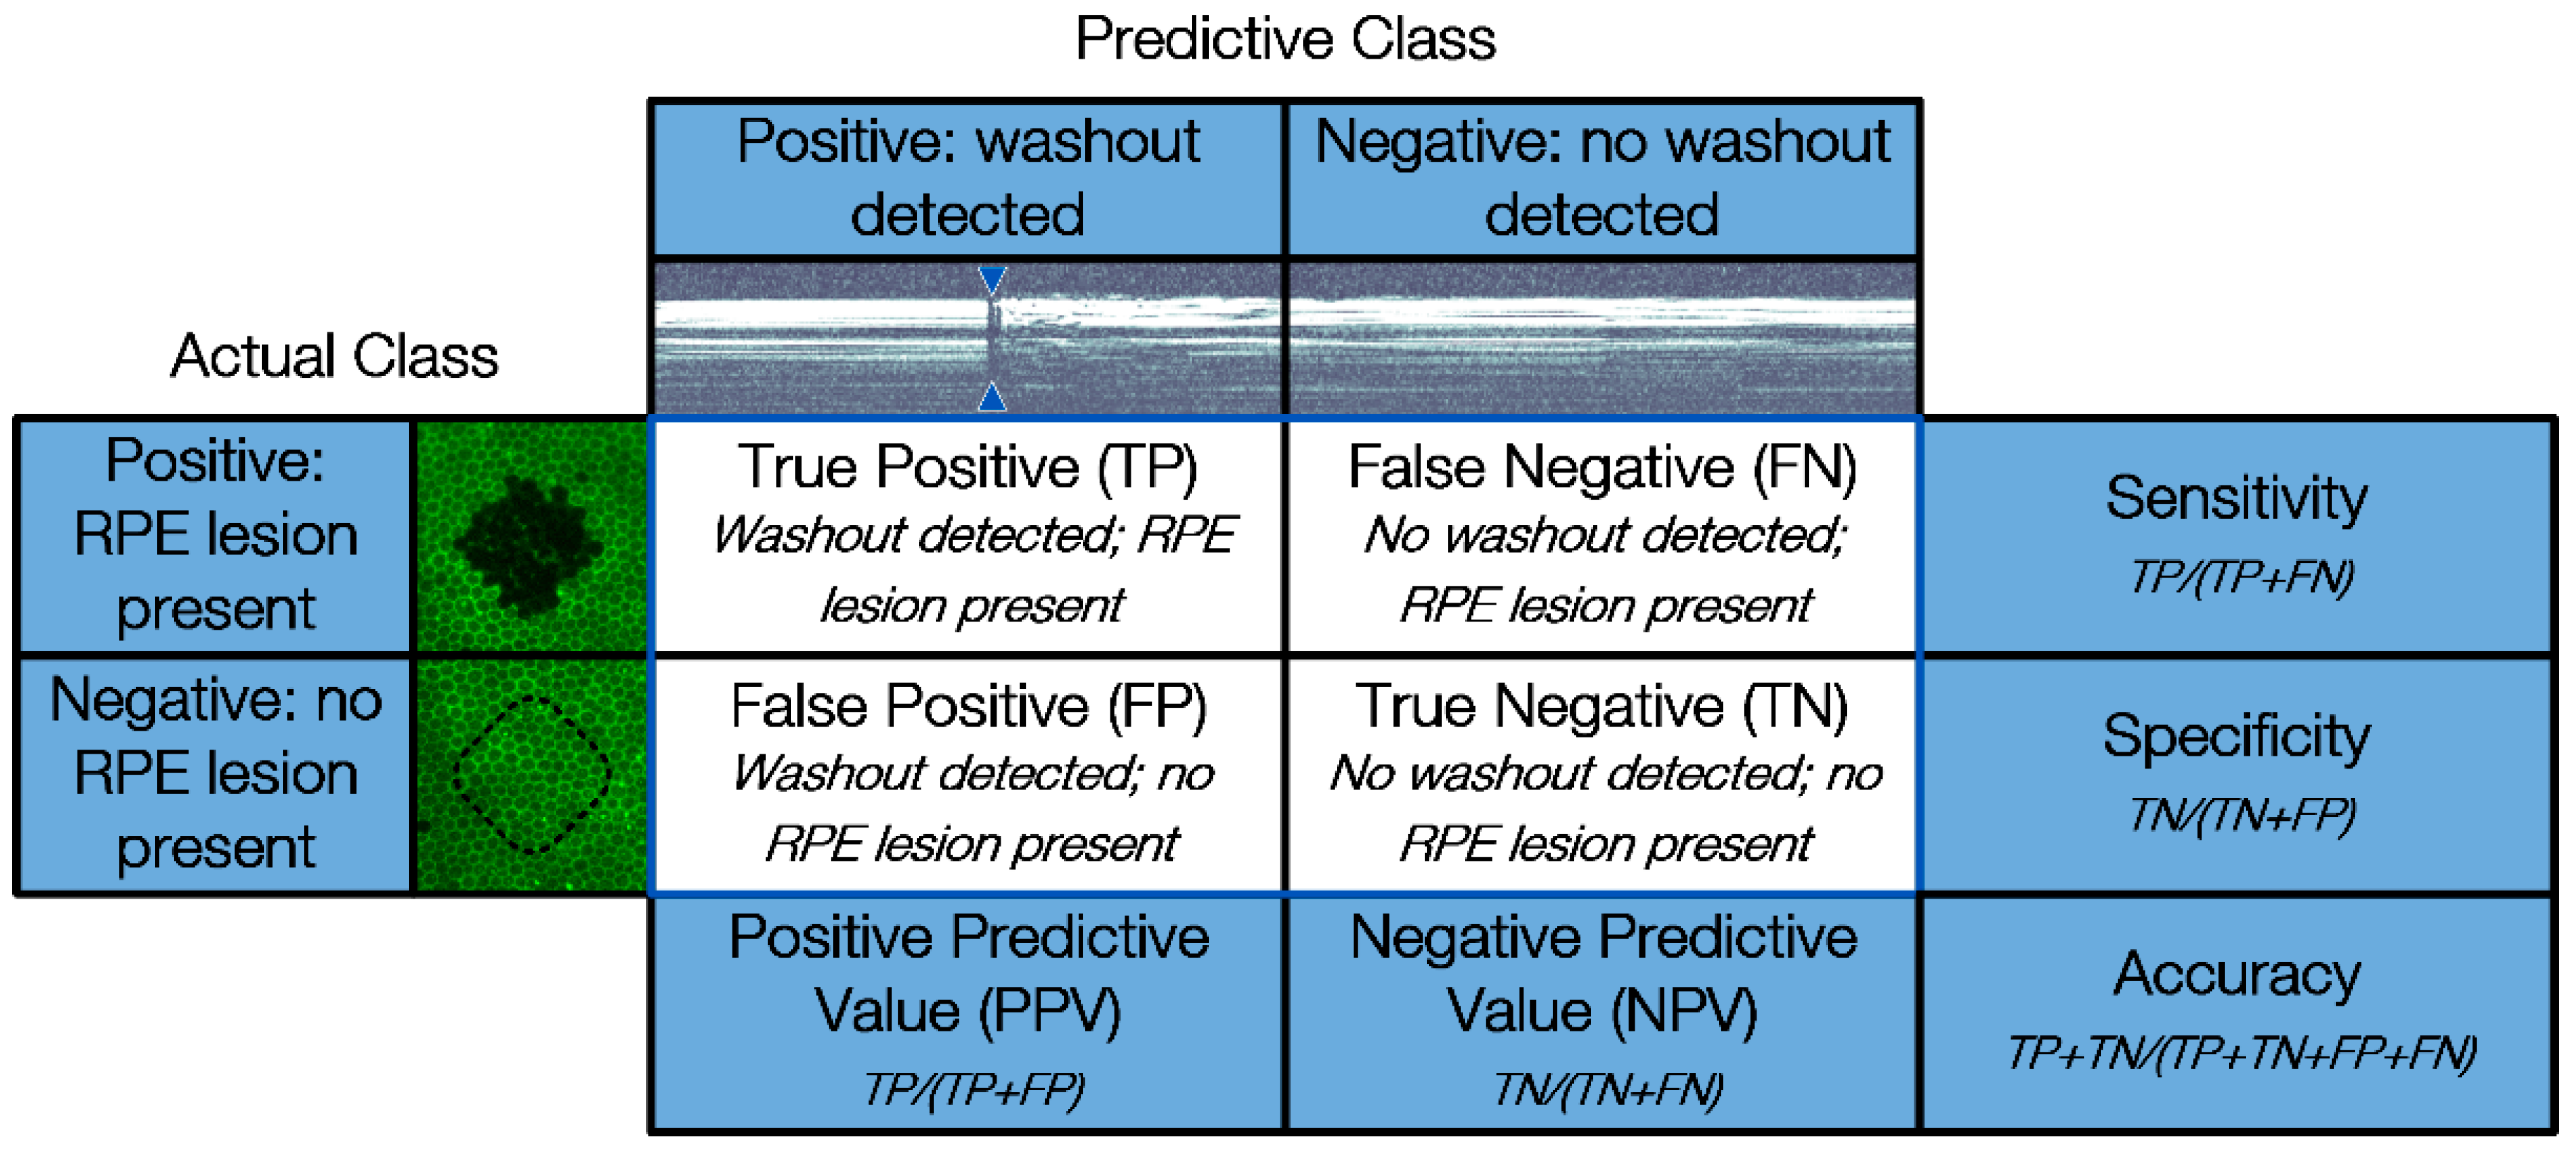
For statistical evaluation, the occurrence of fringe washouts (Predictive Class) is compared to the damage outcome on the explants (Actual Class) by using a confusion matrix. The confusion matrix shown in
Figure 4 features four cardinalities: true positive (TP), true negative (TN), false positive (FP) and false negative (FN). Positive and negative refer to the prediction made by SD-OCT M-scans of whether an RPE lesion was created, based on the presence of fringe washouts, while true and false evaluate the correctness of this statement.
Based on the four cardinalities of the confusion matrix, several statistical measures can be derived to present the overall device performance in a straightforward fashion. In our case, the sensitivity, specificity, accuracy, positive predictive value (PPV) and negative predictive value (NPV) were calculated.
4. Discussion
We tested the hypothesis that SD-OCT has the potential to predict RPE cell damage after microsecond laser exposure. The Spectralis Centaurus system and an experimental SRT laser [
30] were used to investigate OCT M-scan fringe washouts during microsecond laser irradiation by using laser pulses in the range of 2 to 20 µs.
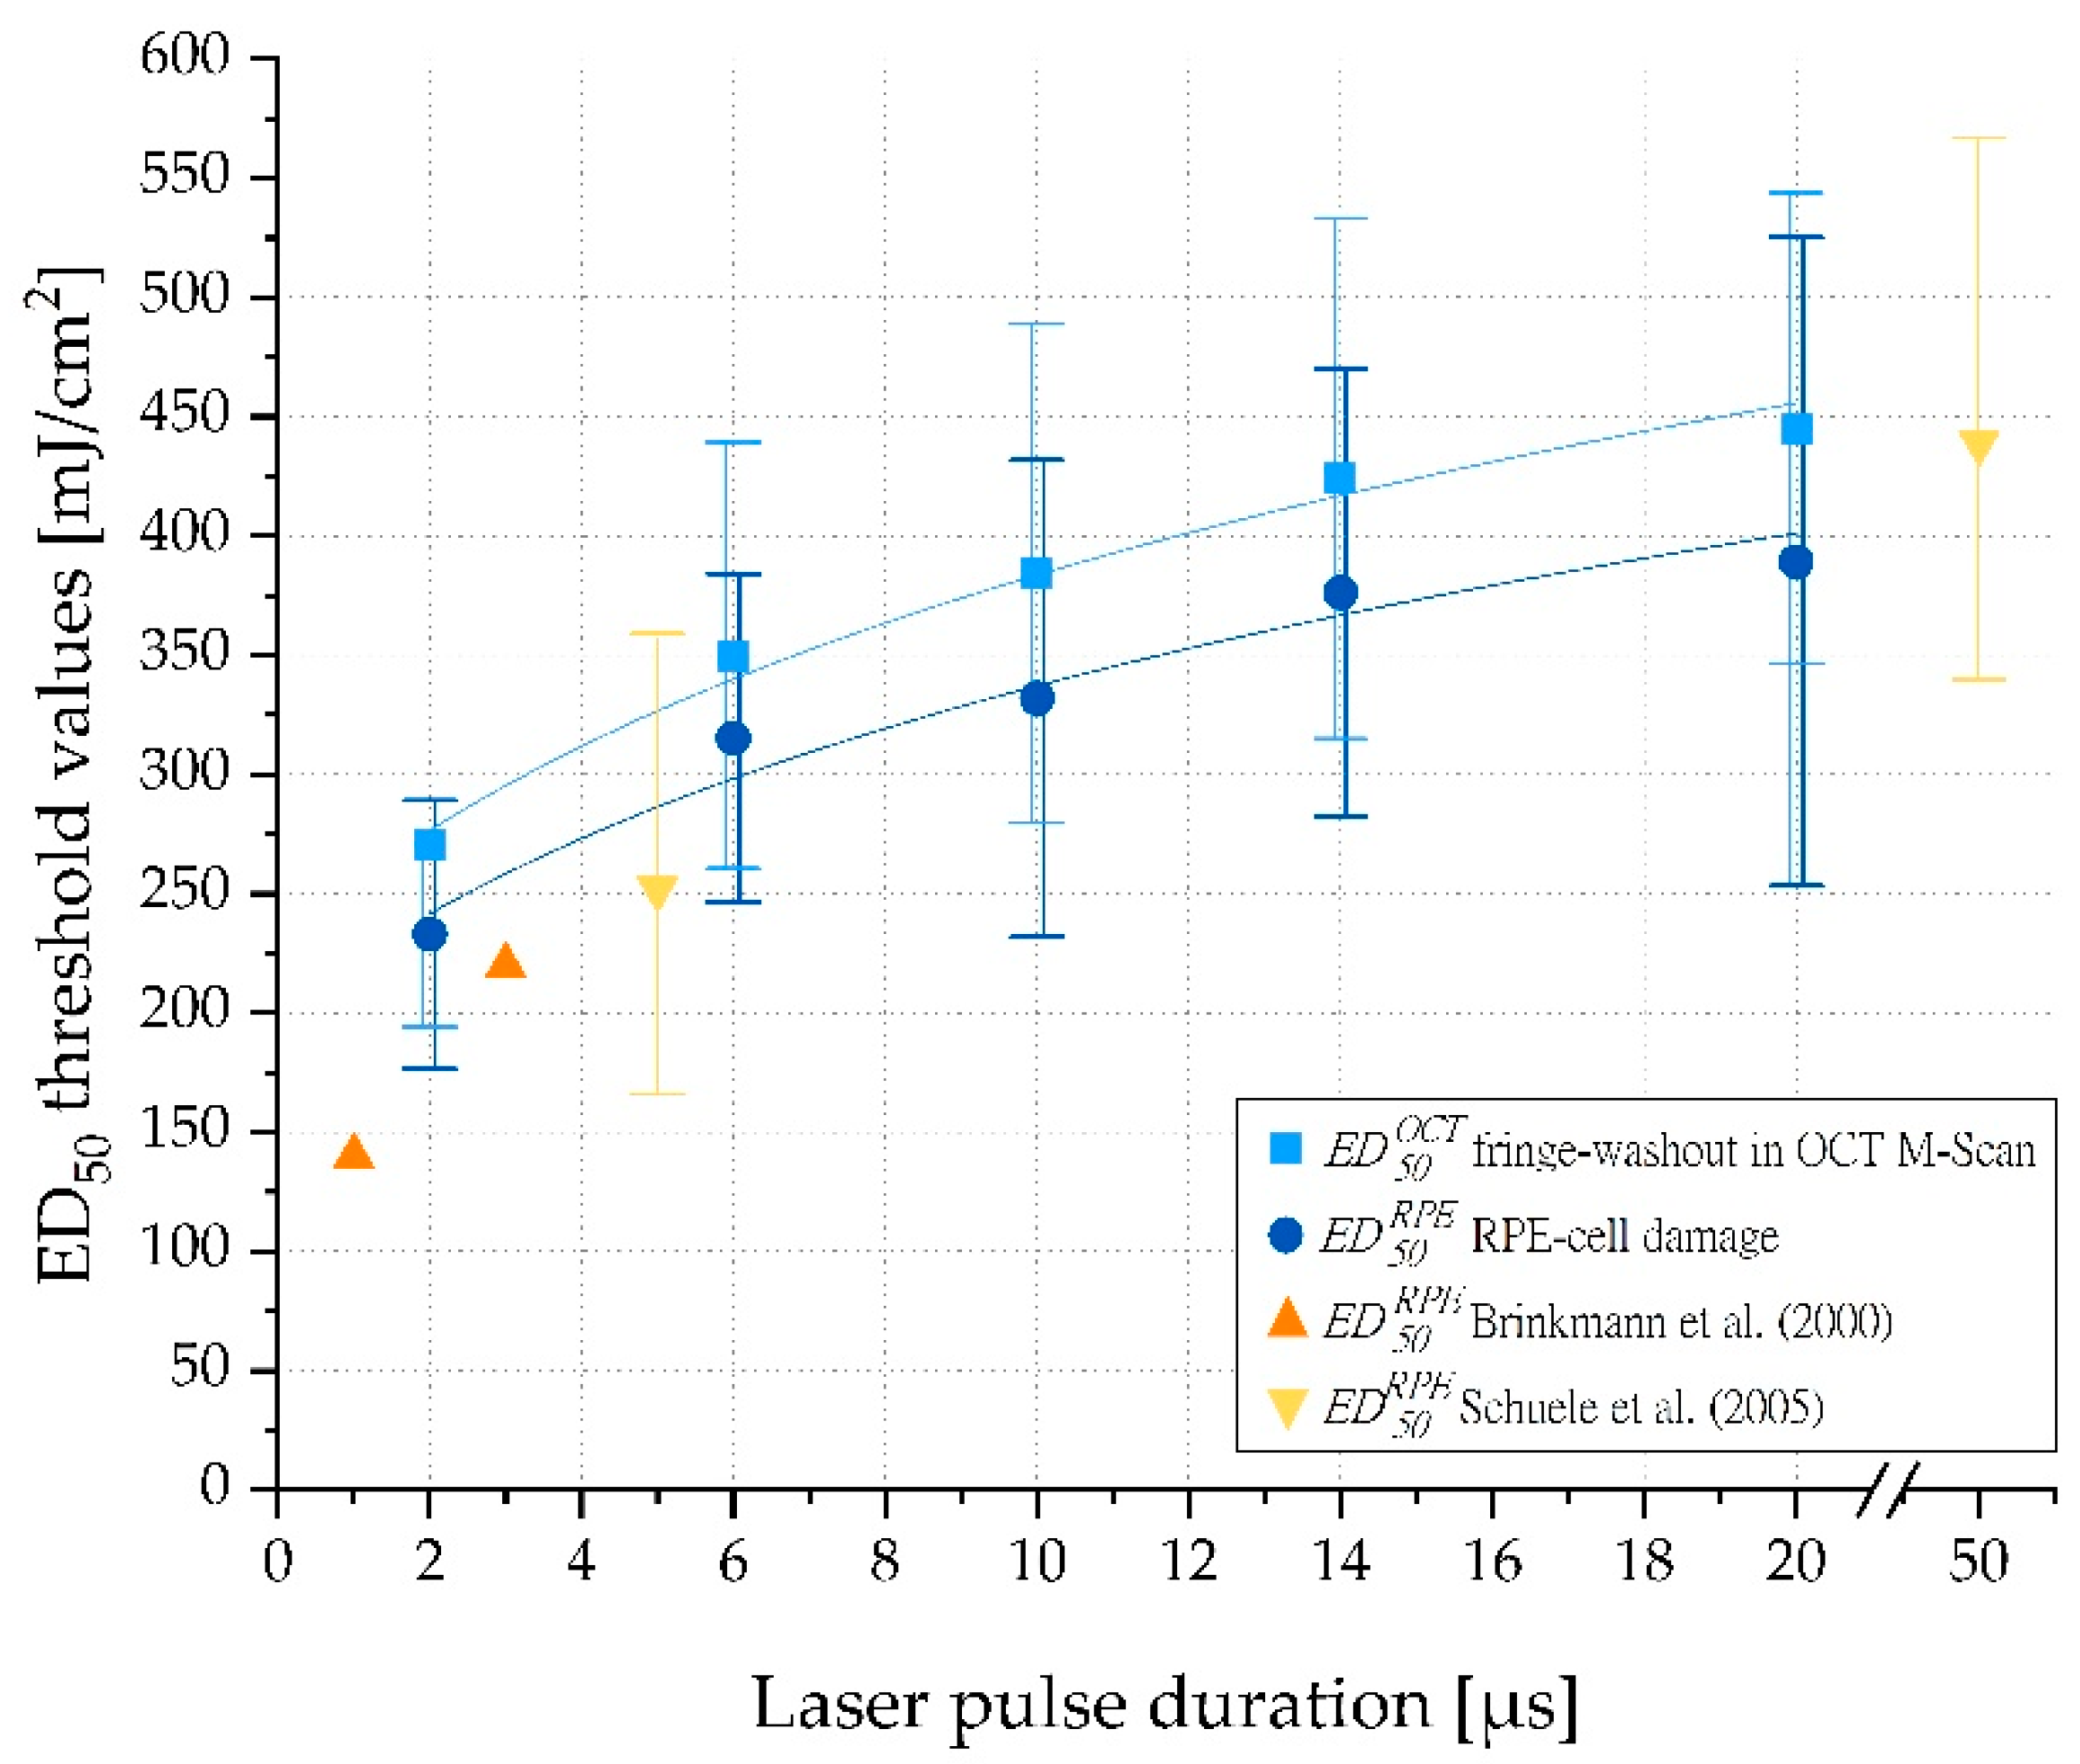
As reported by Brinkmann et al. [
38] and Schuele et al. [
39], we confirmed that RPE radiant exposure damage thresholds increase with increasing pulse duration (
Figure 6). Furthermore, our results for porcine RPE damage exposure thresholds were in good agreement with data of 1 and 3 µs laser pulses reported by Brinkmann et al. and 5 and 50 µs laser pulses found by Schuele et al. Recently published mean RPE damage exposure thresholds on lightly pigmented porcine eyes reported by Seifert et al. for laser pulses of 2 to 50 µs duration are also consistent with our findings for 2 µs pulses. However, for longer pulses, up to 20 µs pulse duration, the damage exposure thresholds reported by Seifert et al. were significantly higher than those we observed. This is consistent with the theory that for short pulses, particle absorption by single melanosomes dominates, while for longer pulses, the lower bulk absorption by melanosomes plays a major role [
40]. In principle, absolute values should always be considered as rough guide values only, as they can vary greatly and the whole concept of a laser system that compensates for differences in melanin concentration across individuals or across species variations argues against the use of an optimum fixed absolute value.
Regarding evidence for the selectivity of longer pulse durations up to 20 µs, the results of Schuele et al. are particularly relevant. These authors showed that MBF is the dominant origin of RPE cell damage for pulses up to 50 µs duration [
39]. Lee et al. reached a similar conclusion [
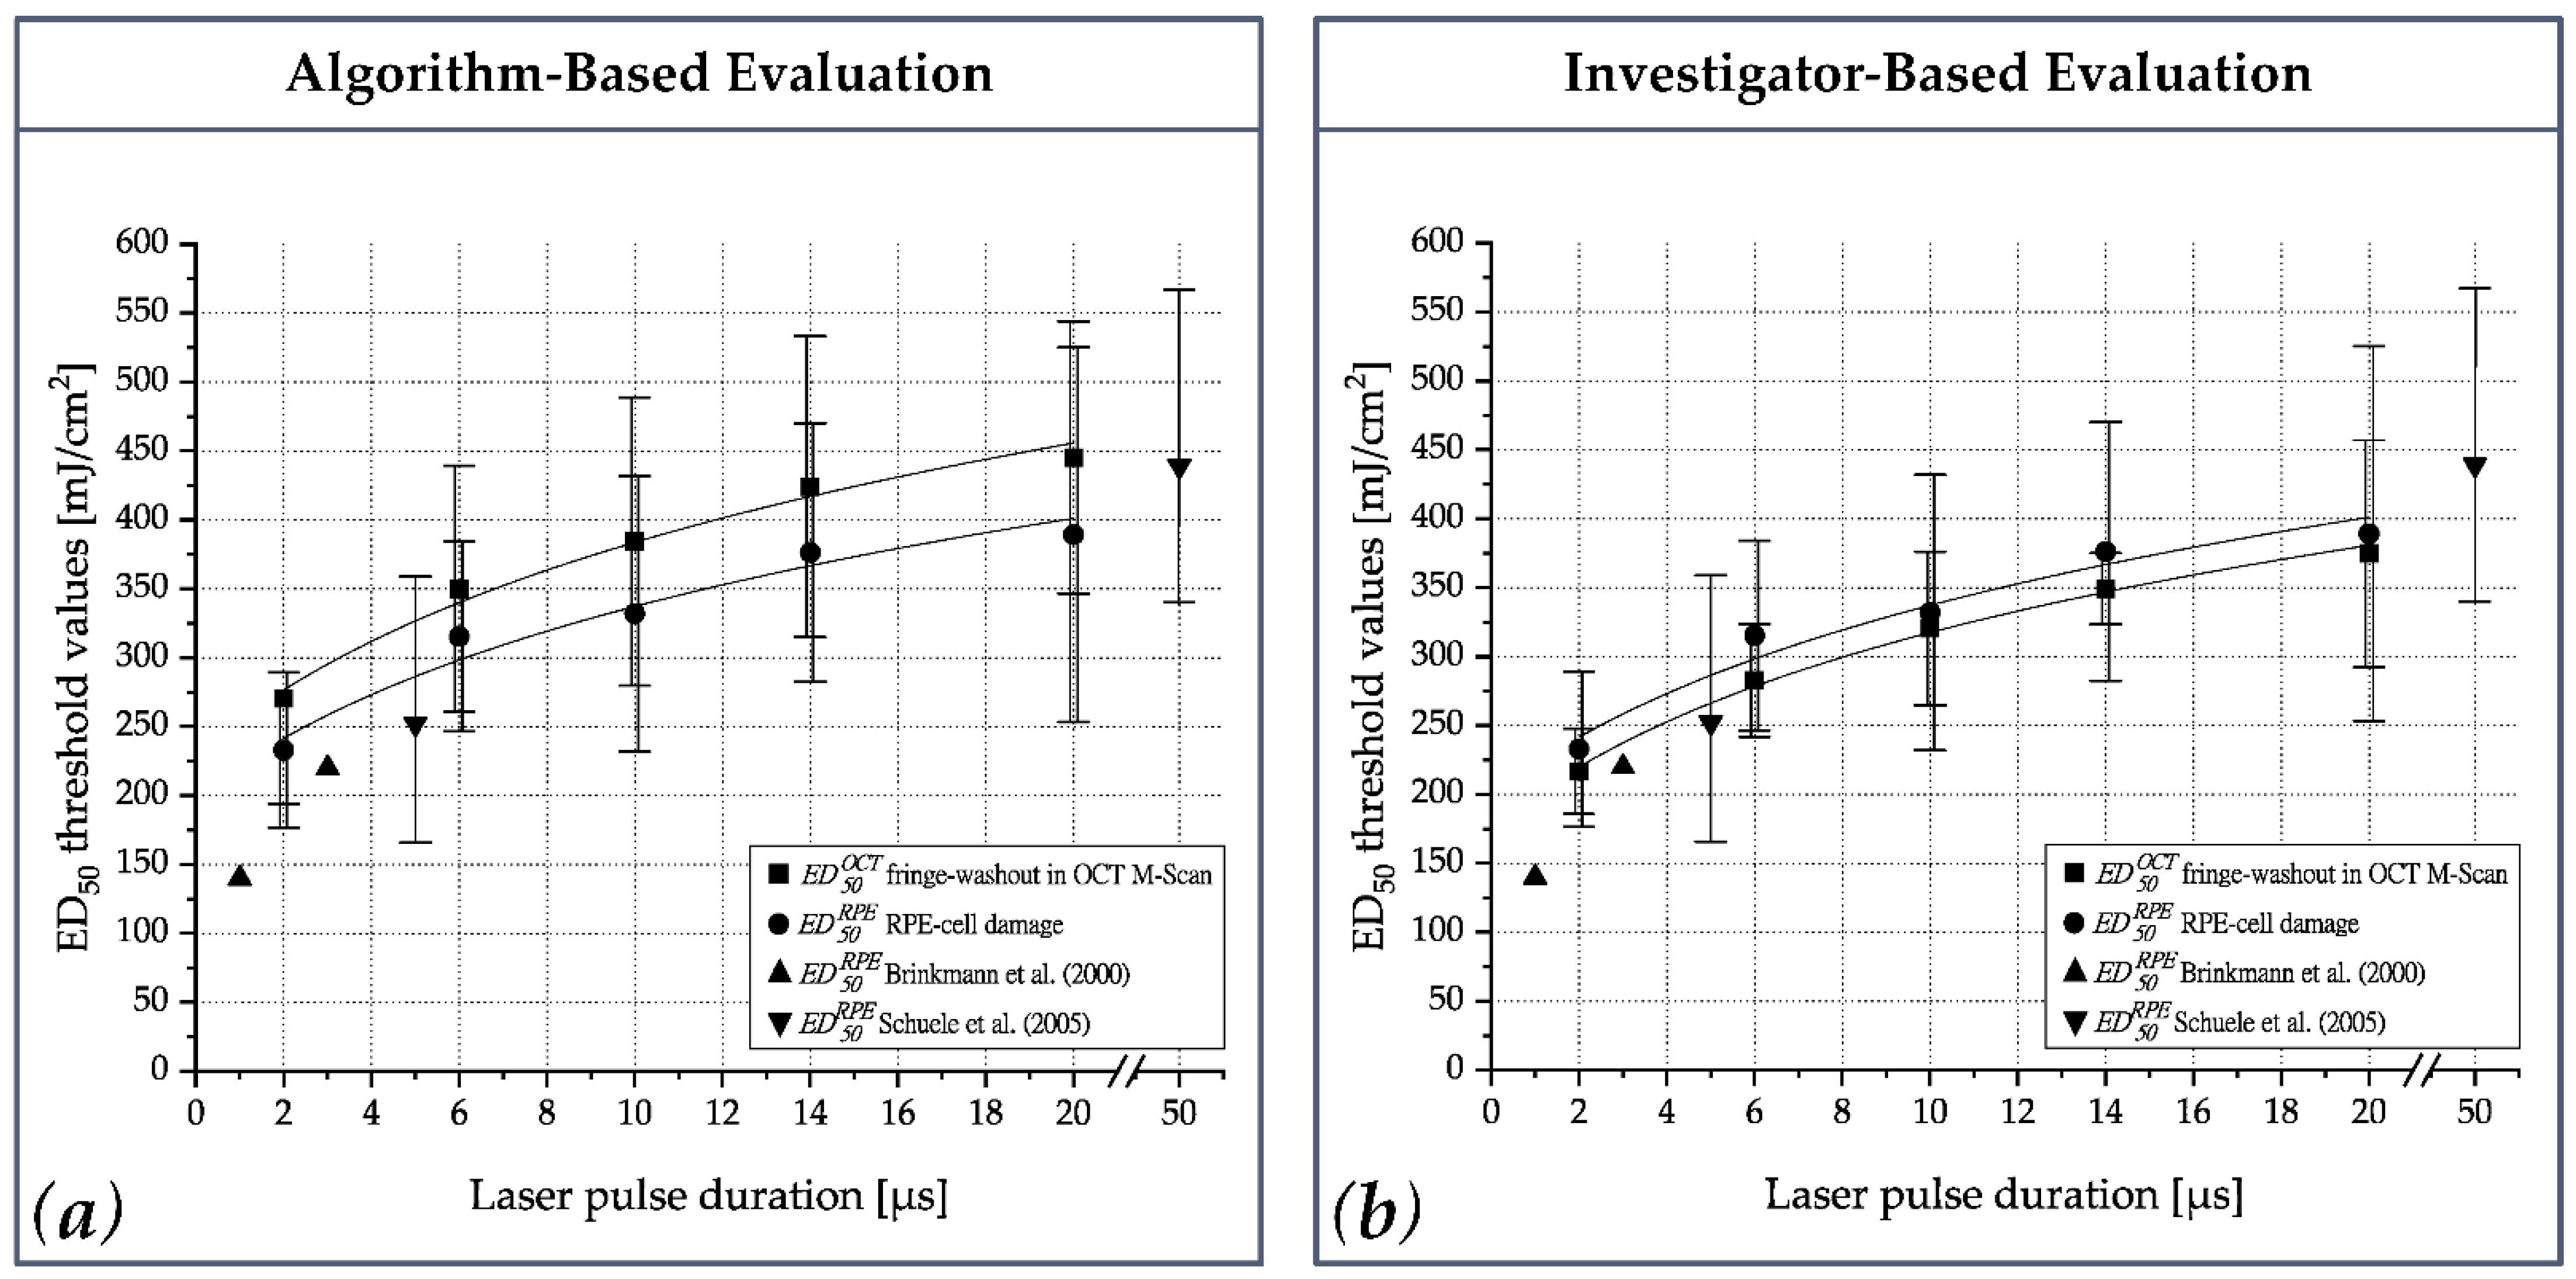
18]. Consequently, the transition for MBF-based to pure thermal RPE cell damage can thus be assumed to be in the range of 20 to 50 µs. Our results substantiate that thresholds for both RPE cell damage and OCT fringe washouts are approximately the same (
Figure 6 and
Figure A1b). Therefore, it can be inferred that RPE cell damage up to a pulse duration of 20 µs is predominantly caused by MBF, and thus reliable dosimetry can be performed by monitoring localized MBF to enable SRT. In addition, OCT also detects vibrations in the proximity of the MBF and is sensitive enough to detect subliminal changes.
The results of the calcein-AM assay underline the necessity of dosimetry for ophthalmoscopically sub-visible laser therapies, such as SRT. In accordance with Schuele et al., we observed a large difference between the ED
15 and ED
85 values (e.g., 10 µs:
,
,
), which is due in part to the high inter- and intra-individual melanin density variations in the different RPE samples [
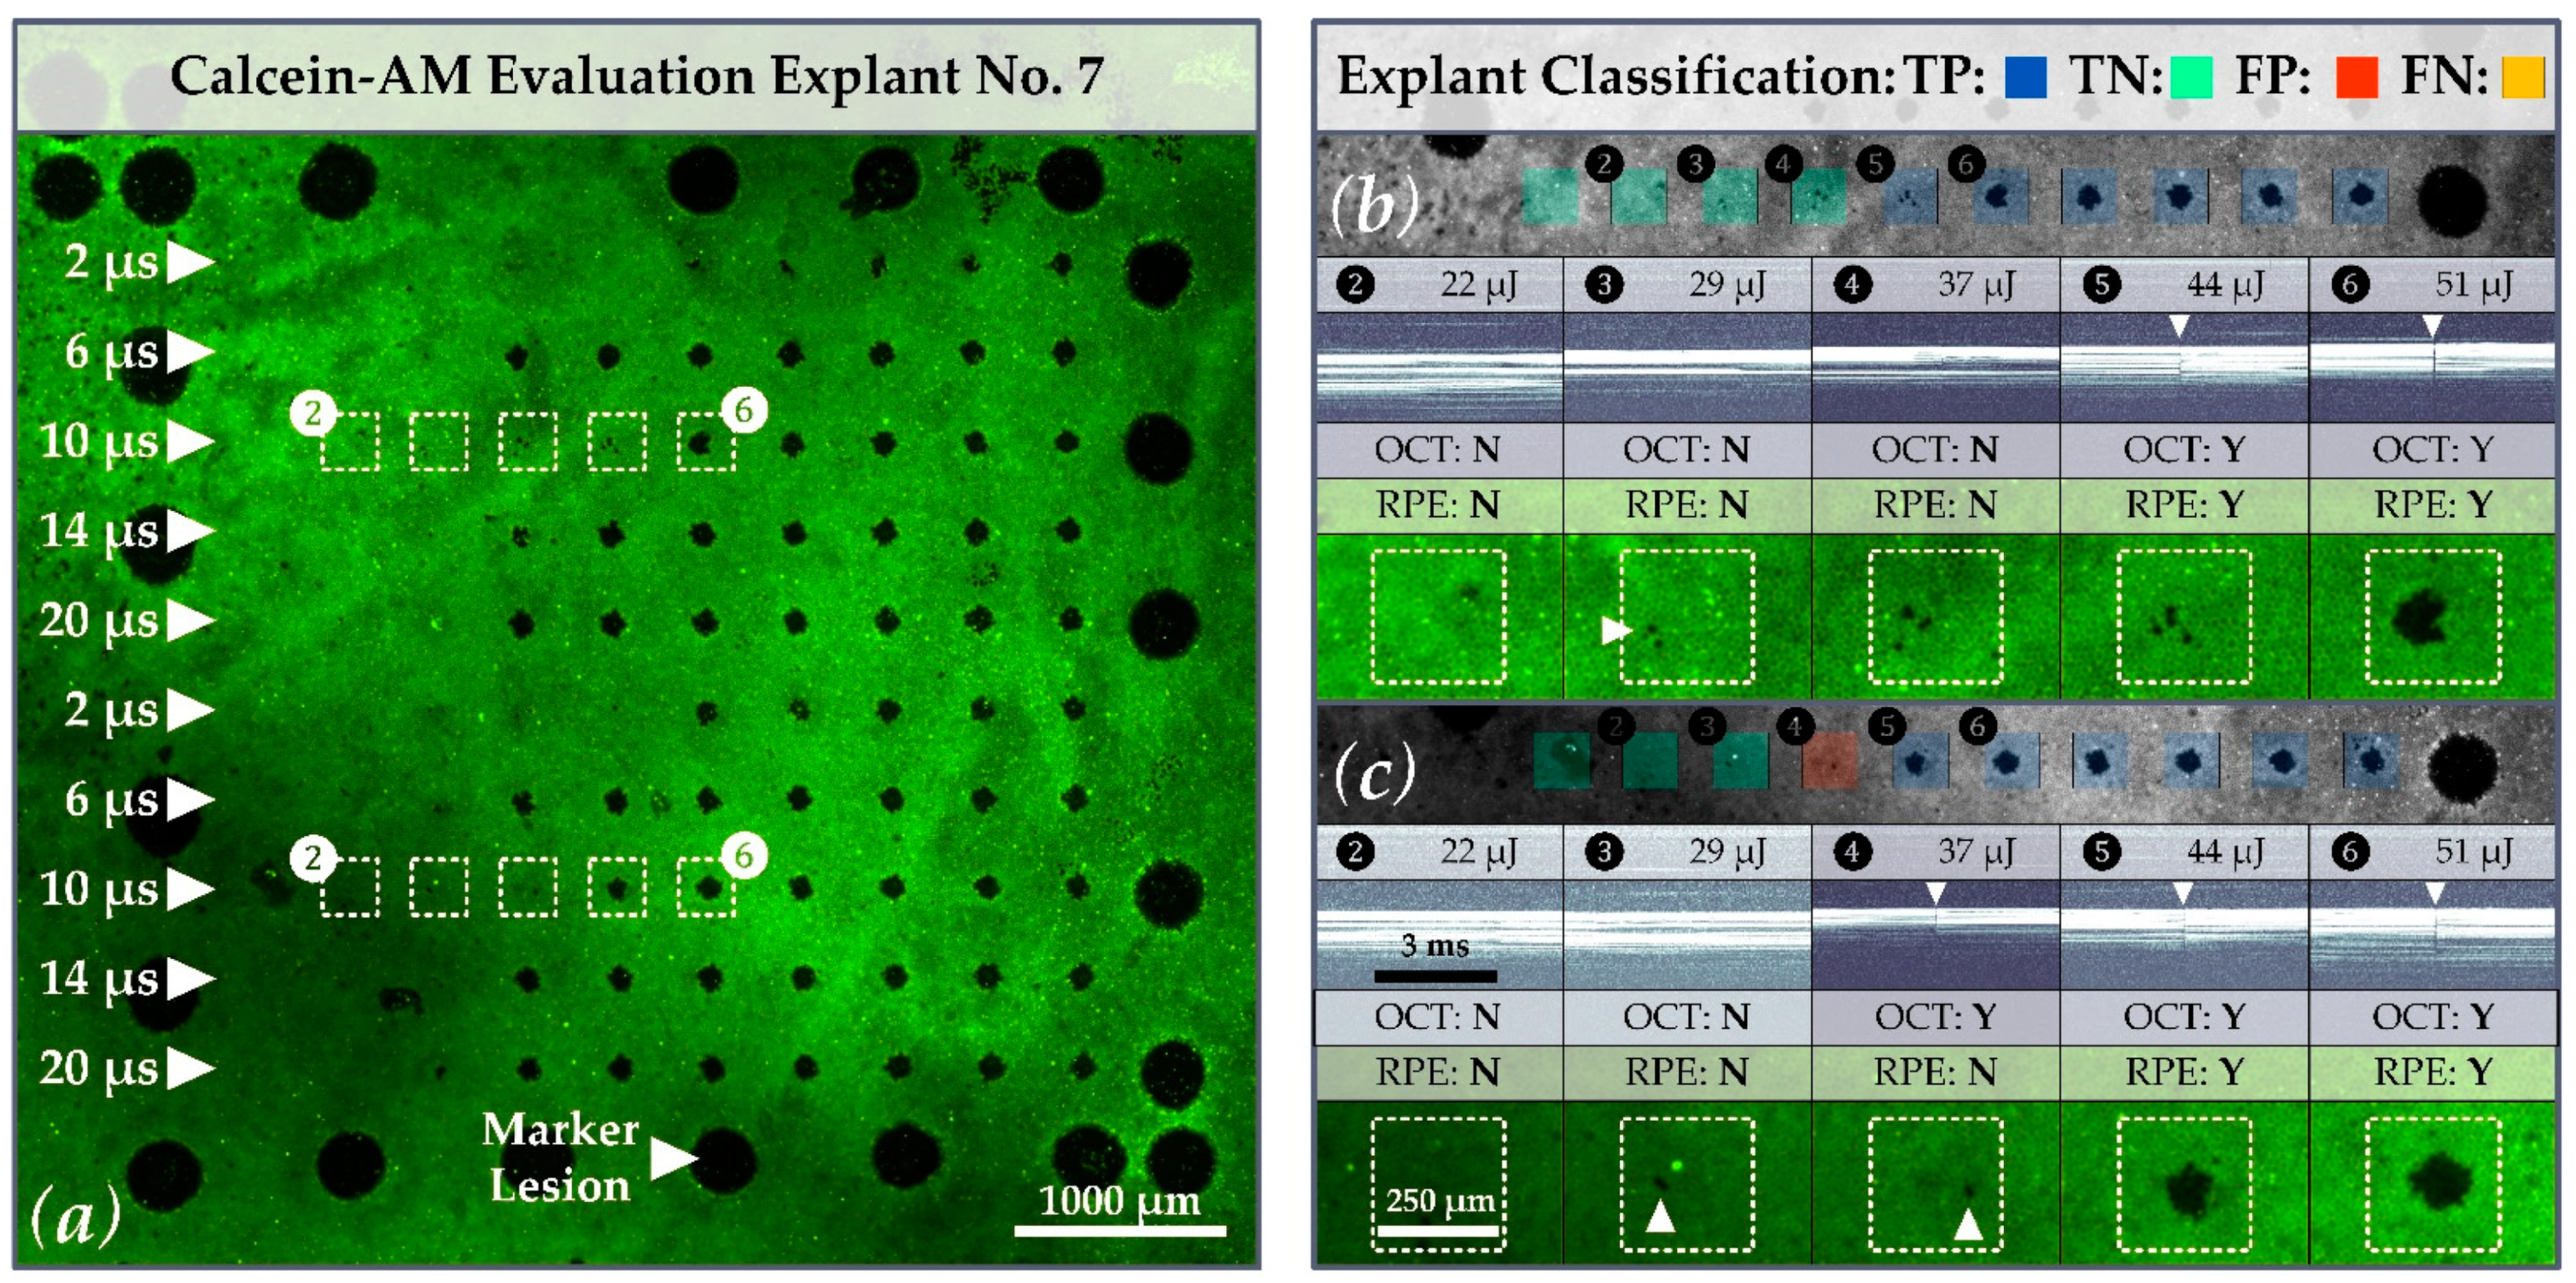
39]. Regarding the evaluation of our porcine RPE-choroid-sclera explants, practically all samples showed local radiant exposure damage threshold variability (
Figure 8). This variation may be related to local differences in the melanin distribution of the RPE. While in some regions, a certain amount of energy caused clear-cut RPE damage; in adjacent regions, the same energy caused little or no RPE cell damage (e.g.,
Figure 8b,c lesions applied with 44 µJ
397 mJ/cm
2 and pulses of 10 µs duration). This variability is important with regard to possible over- and under-treatment of patients. In the absence of laser dosimetry control (or a laser treatment system with marked inhomogeneity due to a high IMF or strongly varying laser pulse energy), overtreatment may occur even with pulse durations that are considered as selective. Our findings demonstrate that OCT-based dosimetry can prevent overtreatment and collateral retinal damage.
Regarding the IMF, local RPE cell destruction (e.g., lesion 3 (262 mJ/cm
2 ≙ 29 µJ) in
Figure 8b) may be attributed to local peaks in the laser beam profile, in addition to local pigment differences. For laser treatments that are intended to selectively damage the RPE, the influence of the top-hat beam quality is of fundamental importance. Whereas local intensity peaks can lead to local over-treatment and mechanical rupture, local dips might not lead to any damage at all. In terms of clinical application, the influence of the IMF in this respect is interesting to discuss, because in our experiments the laser was applied to the uncovered RPE situated within an artificial eye with an optically “perfect” cornea and lens. When applied to patients, however, ocular aberrations, cloudiness of the ocular media, and other effects need to be considered. The beam profile of the SRT laser is thus (additionally) reshaped on its way to the RPE, which can strengthen or weaken intensity peaks. In addition, the laser can undergo scattering caused by edema, which may smooth out local intensity peaks. It is therefore difficult to precisely define what IMF value is reasonable, although homogenous exposure (IMF = 1) that excludes ocular influences is desirable.
The correlation between the exposure threshold values for the OCT signal loss in M-scans and RPE cell damage supports the ability of the Spectralis Centaurus system for predictive microsecond laser dosimetry via OCT fringe washout analysis. A similar average threshold for fringe washouts in M-scans would also allow the evaluation of sequential events (e.g., three consecutive fringe washouts) as proposed by Kaufmann et al. (SRT in ramp mode combined with a fast algorithm-based SD-OCT treatment stop). This would make the SRT dosing more robust, without risking over-treatment despite the tissue’s variable exposure thresholds [
28]. This methodology will be investigated in further experiments with the Spectralis Centaurus system.
A remaining open question is whether the OCT signal loss is caused solely by MBF or whether pure thermal effects, like fast tissue expansion or coagulation, are also detected. Recently, Seifert et al. concluded that thermal cell damage is likely to be the primary cellular damage mechanism. According to this work, MBF sets in at slightly higher radiant exposure levels and leads to superimposed mechanical damage [
40]. Based on ex-vivo experiments, Lee et al. found approximately equal thresholds for MBF and RPE cell damage at 10 µs, whereas at 20 µs the MBF threshold was ~10% higher than for cell damage [
18]. Analogous results were recently found by Seifert et al. Their ex vivo results suggested approximately equal thresholds for MBF and RPE cell damage at 2 µs, whereas for laser pulses of 5.2 µs and 20 µs duration, the MBF threshold was ~7% and ~25%, respectively, which was higher than for cell damage [
40]. By contrast, our investigator-based evaluation of OCT M-scans (
Appendix A:
Figure A1 and
Table A2) suggested that OCT signal loss occurs even at exposures ~6% lower than that at which RPE cell damage occurs, and that this holds true across the whole pulse duration range from 2 to 20 µs. These results show the exciting potential for OCT-based assessment of RPE cell damage and may have the following causes: (1) MBF is the primary damage mechanism up to 20 µs. OCT is extremely sensitive to such damage and even detects very small microbubbles that do not actually lead to cell damage. (2) The OCT fringe washout technique is more sensitive for longer pulse durations up to 20 µs than the optoacoustic and light reflection methods [
22,
40]. (3) OCT fringe washout detects fast thermal tissue expansion and subsequent thermal cell damage, rather than primarily responding to MBF.
A current weakness of OCT dosimetry in terms of patient application is the limited axial SD-OCT scan depth of 1.8 mm. Therefore, axial movements of the patient as well as drift, tremor and saccades of the eye are a challenge. Such artifacts can lead to false-positive indications of RPE damage or complete signal loss. Accordingly, we are currently evaluating to what extent eye-tracking and other features of the system (e.g., positioning the patient in a supine position or an optimized energy ramp mode) can be modified to counteract these instabilities. Furthermore, one could also take advantage of small axial SD-OCT scan depth by checking the focal plane of the treatment laser via this measuring range to thereby further increase the safety of the SRT delivery.
The OCT dosing control algorithm was developed for a treatment device with a different positive detection criterion (at least 50% dead RPE cells within the exposure spot, not a cluster of three dead RPE cells) [
37]. This criterion leads to fine fringe washouts being discarded by the algorithm, which results in a low number of falsely identified events (overall FP = 24). Since the algorithm focuses on detecting large RPE lesions, many small lesions were missed, leading to a higher number of missed events (overall FN = 93). The overall moderate sensitivity of 85% and high specificity of 93% of the algorithmic evaluation can therefore be attributed to the assumption made during the algorithm development. Therefore, the dosing algorithm for fringe washouts in SD-OCT M-scans should be compared again to RPE damage using a calcein-AM viability assay and an area-based detection criterion (i.e., at least 50% dead RPE cells). Furthermore, the lesions should be applied with a laser burst or ramp application, as currently advocated for SRT [
41]. For clinical application, the OCT algorithm should also be compared to RPE barrier leakage found via fluorescence angiography.
The above discussion shows that the decision regarding whether a lesion is considered successful or unsuccessful can have a major influence on the assessment of a dosimeter’s performance. The question therefore arises, of what proportion of the RPE in the area of the applied laser beam needs to be injured for a treatment to be considered successful. It is questionable whether lesioning a cluster of three RPE cells is sufficient to rejuvenate the RPE and stimulate their metabolism sufficiently to have a positive effect on retinal disease. To our knowledge, no in vivo study with patients has gauged the minimum number of lesioned RPE cells necessary for a successful treatment. However, experimental results for ex vivo porcine RPE-choroid explants revealed increased pigment epithelium derived factor (PEDF) secretion in 200 µm SRT spots compared to 100 µm spots [
11]. This indicates that laser spot size in SRT plays an important role. Therefore, an area-based classification should be included in future evaluations of SRT dosimetry algorithms. With respect to our OCT dosimetry algorithm, this would probably lead to a higher sensitivity, as fewer false-negative events would be observed. Furthermore, an OCT device that evaluates the emanating pressure field might become more sensitive with either a larger or also smaller detection area, although vibrations obviously span more than the detection range of the ~250 µm thick retina.
Our results suggest that RPE cell damage could be successfully monitored by using an OCT dosimetry algorithm. Optimal performance of the algorithm was obtained for a pulse duration of 6 or 14 µs (AUC 0.97). The OOP was determined for a κ-value of 13 at a laser pulse duration of 6 µs (sensitivity: 0.89, specificity: 0.94). However, in the case of OCT dosimetry, sensitivity is of paramount importance because sensitivity is a measure of how many of the positive samples (RPE lesion created) have been predicted correctly by the dosimetry algorithm. Showing a high sensitivity in this case means that lesions within the RPE are detected reliably, such that further (unnecessary) laser pulses are not delivered. For successful SRT operation, overtreatment due to low-sensitivity dosimetry must be avoided. Therefore, the OOP could be biased in favor of sensitivity, which would lead to the use of lower κ-values (e.g., 12 to 10). When interpreting our results, consideration should be given to the fact that only the RPE, choroid and sclera were present during the SD-OCT M-scan acquisition. Thus, the algorithm had relatively little signal available for the fringe washout evaluation. Similar experiments should therefore be repeated on whole eyes, where the additional OCT signal from the neural retina would likely enhance the MBF detection. Furthermore, since the present results are based on a single pulse application, further studies with pulse sequences should be performed to verify the performance under repeated exposure.


 ,
, 


