Article

Application of Genetic Algorithms for the Selection of Neural Network Architecture in the Monitoring System for Patients with Parkinson’s Disease

by
Yulia Shichkina
1,*,
Yulia Irishina
2,
Elizaveta Stanevich
1 and
Armando de Jesus Plasencia Salgueiro
3
1
Faculty of Computer Science and Technology, St. Petersburg State Electrotechnical University “LETI”, 197376 St. Petersburg, Russia
2
N.P. Bechtereva Institute of the Human Brain of the Russian Academy of Sciences, 197376 St. Petersburg, Russia
3
Institute of Cybernetics, Mathematics and Physics, La Habana CP 10400, Cuba
*
Author to whom correspondence should be addressed.
Appl. Sci. 2021, 11(12), 5470; https://doi.org/10.3390/app11125470
Submission received: 29 April 2021 / Revised: 1 June 2021 / Accepted: 7 June 2021 / Published: 12 June 2021
(This article belongs to the Special Issue 14th International Conference on Intelligent Systems (INTELS’20))

Abstract

:
This article describes an approach for collecting and pre-processing phone owner data, including their voice, in order to classify their condition using data mining methods. The most important research results presented in this article are the developed approaches for the processing of patient voices and the use of genetic algorithms to select the architecture of the neural network in the monitoring system for patients with Parkinson’s disease. The process used to pre-process a person’s voice is described in order to determine the main parameters that can be used in assessing a person’s condition. It is shown that the efficiency of using genetic algorithms for constructing neural networks depends on the composition of the data. As a result, the best result in the accuracy of assessing the patient’s condition can be obtained by a hybrid approach, where a part of the neural network architecture is selected analytically manually, while the other part is built automatically.

1. Introduction

Parkinson’s disease (PD) is the most common age-related motor disorder and second-most common neurodegenerative disorder (after Alzheimer’s disease), affecting an estimated 7 million people worldwide [1,2].
Only a doctor can prescribe the correct complex treatment for Parkinson’s disease. If the diagnosis has already been made, then it is necessary to convince the person to take good care of their health, follow all the prescriptions of specialists, exercise, and adhere to a special diet.
Monitoring the patient’s condition is the key to successful correction of the main clinical manifestations of PD. This affects the modification of the clinical picture of the disease against the background of long-term dopaminergic therapy. At the same time, monitoring the patient’s condition has been associated with a number of difficulties:
  • Impossibility of daily observation by a doctor in outpatient practice;
  • inability to analyze the patient’s diaries by the doctor more than a few days prior to the date of the patient’s visit;
  • impossibility of a comprehensive analysis of all pages of the diaries for the entire observation period of the patient;
  • inaccuracy in filling out the patient diary for various reasons, including:
    biased perception by patients of their condition;
    untimely filling of the diary;
    difficulty of filling out diaries;
    loss of diary, and so on.
Use of the capabilities of mobile phones can help to solve these monitoring problems.
A mobile phone is a personal device that is almost always near the user. Therefore, it is logical to use mobile phones to collect data that can help doctors diagnose the improvement or deterioration in a patient’s condition. With the help of mobile phones, the patient can describe their health condition, take notes for the doctor, and so on. In addition, some of the work related to collecting and processing data can be transferred from the patient and the doctor using mobile devices. A mobile phone can contain up to 14 different sensors [3], which allow for tracking changes in coordinates, atmospheric pressure, air temperature, and so on.
One of the most important sources of information about a person’s condition is their voice. People’s voices differ from each other in many parameters. Voice sounds are characterized by strength, timbre, pitch, and other characteristics. Changing a person’s voice in various diseases and in the course of diseases is also an individual property of a person.
At present, the intensive development of technologies related to audio information is well underway. However, the search for and development of methods to automate the processing of audio information is still an urgent problem. The solving of these problems is important for both existing and new tasks in various fields of human activity.
This article presents the results of research in two areas: the development of approaches to processing voice data and the construction of neural networks for classifying the condition of patients with Parkinson’s disease.
The article is structured as follows: Section 2 presents an overview of existing solutions for monitoring PD symptoms using mobile devices, an overview of methods for processing voice data, and solutions for the use of neural networks in medicine. Section 3 is devoted to the description of our purpose and objectives. Section 4 provides a brief description of the data collection system. Section 5 describes an approach making use of genetic algorithms for constructing neural networks. Section 6 discusses approaches to processing a person’s voice and describes other data obtained about the patient’s condition from a mobile phone. Section 7 gives the results of the experiment. Finally, the conclusion summarizes the research results and briefly describes further steps for developing a system for monitoring the condition of patients with PD.

2. Related Work

The market for mobile devices is growing rapidly and, at the moment, almost every person has a smartphone that can constantly process data from its sensors.
At present, a huge number of mobile applications related to medicine are available [4]; however, all of the currently existing applications associated with Parkinson’s disease can be divided into three categories:
  • Applications that are designed for physical training; for example, in [5], the created mobile application was used for cognitive stimulation in the elderly. The application offers a number of games for training various cognitive functions (memory, concentration, and so on);
  • applications that provide the ability to obtain information about the PD, as a whole, to the user and the ability to obtain information directly from those who have already had experience in solving such problems. Today, there are many websites and online reference books and, therefore, there is no need to download a separate application for a smartphone; and
  • applications that, using sensors embedded in a smartphone, allow the user to identify and track certain symptoms. For example, applications for assessing hand tremor [6,7], and for assessing the symptoms of Parkinson’s disease by voice, fine motor skills, and gait [8].
The main disadvantages of all these applications are the lack of communication with a specialist, such as the attending neurologist, and the need to perform certain physical manipulations to assess the symptoms of PD.
Many studies use special sensors to assess the patient’s condition. These sensors are mounted on the human body. Such studies have been described, for example, in [9,10,11]. Unfortunately, such approaches to measuring the parameters of the condition of patients cannot be applied to everyday monitoring. Therefore, we use measuring instruments for hand movements, which are more affordable for many patients. However, it should be noted that, in this case, it is impossible to take into account the mutual correlation between the accelerometers on the arm, trunk, and leg. However, using a phone, it is possible to collect other important parameters about the patient’s condition, such as assessing their memory, attention, voice parameters, and emotional state, among others.
The next task in creating a patient monitoring system is the development of approaches for intelligent data processing. There are a lot of data and they are very diverse; as such, machine learning methods—in particular, neural networks—are often applied to such data.
The comprehensive computational model for the diagnosis of PD based on motor, non-motor, and neuroimaging features using the recently-developed enhanced probabilistic neural network (EPNN) has been previously described in [12], while an artificial neural network system with a back-propagation algorithm for helping doctors in identifying PD has been presented in [9].
A description of the use of two different artificial neural network classifiers—probabilistic neural network (PNN) and classification tree (ClT)—for distinguishing people with Parkinson’s disease and people with essential tremor based on 123I-FP-CIT SPECT data has been presented in [13].
A comparison of the effectiveness when using three probabilistic variants of the neural network (PNN)—incremental search (IS), Monte Carlo search (MCS), and hybrid search (HS)—to discriminate between healthy people and people with Parkinson’s disease was carried out in [14]. The studies were conducted on a set of biomedical voice measurements obtained from 31 people, 23 having Parkinson’s disease (PD). For each person, 195 voice recordings were made. The study was conducted on 22 voice parameters, including the speed of pronunciation of the text, the presence of noise, vocal data, and others. The results showed that there is no significant difference between the three named methods.
A study of the voice signals of patients with Parkinson’s disease, in order to determine the ability to distinguish these people from healthy ones by their voices, has also been carried out [15]. The authors created a complex hybrid intelligent system that includes pre-processing features using clustering based on Gaussian models, principal component analysis methods, linear discriminant analysis, the least squares support vector method (LS-SVM), a probabilistic neural network (PNN), and common neural network regression (GRNN).
A voice digital biomarker for identifying and quantifying symptoms of Parkinson’s disease and determining a course of treatment has been described in [16]. The authors analyzed a database of PD patients and non-PD subjects containing voice recordings which were used to extract paralinguistic features, which served as inputs to machine learning models to predict PD severity.
A descriptive correlation study comparing 20 subjects with PD and 20 healthy controls has been described in [17]. The subjects with PD completed the VHI-30 instrument and performed sustained phonation of different vowels in Spanish. The stage of the disease was evaluated using the Hoehn and Yahr scale.
One article [18] has described a study on the correlation of the values of the selected acoustic parameters, with an assessment of the neurological state in patients with Parkinson’s disease up to 3 h after taking medications that alleviate the symptoms of the disease.
The analysis, including 5-s recordings of the vowel “a” and the syllable “pa”, as well as text with different emotional shades in patients with Parkinson’s disease and healthy people, has been described in [19]. Studies of the correlation between individual sound parameters of the voice and the severity of the condition of PD patients have also been carried out [20,21,22].
Another article [23] described the results of applying a statistical method based on the chi-squared distribution to confirm that 90% of PD patients have voice deviations.
Many publications have focused on the selection of neural network architectures and machine learning methods for assessing the deviation of the voice of a patient with Parkinson’s disease from the voice of a healthy person, such as [24,25,26,27].
A distinctive feature of our study is the completeness of data collection from mobile phones, which can be used to classify the condition of patients and the availability of mobile phones. At present, 70% of PD patients have smartphones, and talking on the phone is the most commonly used feature. Therefore, the voice, hand movements with the phone, and the peculiarities of using the phone’s sensorics are sources of data that are always available and can help in monitoring the condition of patients with PD. In addition, the voice is an individual characteristic of a person. Using data on the sound of a voice, it is possible to identify a person and exclude their entry into the database of information that does not belong to a patient with PD.

3. Formulation of the Problem

The aim of this study is to build a system for monitoring the condition of a patient with Parkinson’s disease, using a set of parameters that can be estimated based on data obtained using mobile phones.
To achieve this aim, it is necessary to build a number of neural networks to classify (evaluate) each of the parameters. Further, based on the obtained parameter estimates, using a neural network, it is possible to classify the patient’s condition.
To solve this problem, it was necessary to complete:
  • The development of an application that allows one to collect a training sample for a neural network using mobile devices;
  • The preparation and processing of data for the future neural network model;
  • The analysis of the possibility of using neural networks, in order to classify the condition of patients with PD;
  • The selection and testing of various options for neural network architectures on the obtained sample;
  • The testing of the neural network on patients with PD;
  • The evaluation of the results of the neural network.

4. Data Collection System

The modules responsible for collecting data on the current state of a patient with Parkinson’s disease can be divided into background and interactive.
In an interactive module, the user manually enters their state data. Some of this data is sent by postal services directly to the doctor’s computer, and all data is collected on a server to create an intelligent component of the monitoring system.
The interactive part also includes various tests that the user can do. The test results involve both unprocessed data (e.g., hitting accuracy and keystroke frequency), memory and attention scores, and generalized estimates (e.g., the accuracy of figure outlining and voice sound parameters). This data is then sent by the application to the server, for analysis and improvement of the general model for predicting the condition of a patient with PD, and is analyzed locally to train the neural network for a specific patient who owns the mobile phone.
The background part is the collection of data from a mobile device in the background (without any involvement of the patient). In particular, these include:
  • Data from the sensors of devices that are responsible for the movement of the phone (e.g., changing the coordinates along three axes, the angle of inclination, activity). These data allow for the tracking of the patient’s activity, tremor, and dyskinesia.
  • Data collected from sensors responsible for controlling the telephone (e.g., pressing buttons, keys, and moving fingers on the screen). These data allow for the assessment of the general condition of patients.
  • On the server, the main components are a data pre-processing module and a module for applying data mining algorithms to obtain knowledge about a patient. This knowledge is necessary to understand the characteristic signs of phone use in patients with Parkinson’s disease, and whether the patient is holding the phone in their hands or if another person is doing it.
In addition to mobile devices and a server, the data is intelligently processed on the doctor’s computer, where it is first converted into a special format, then distributed to various folders and analyzed using artificial intelligence methods, visualization tools, and other assistive technologies.
The interface is designed in such a way that the patient requires as little effort as possible to learn and use the application.

5. Application of a Genetic Algorithm to Build a Neural Network

Building a good deep learning network takes a lot of effort, practice, art, and science. One way to find the correct hyperparameters is through trial and error using a heuristic method. In [28,29], studies that show effective results when using genetic algorithms in the construction of neural networks have been presented.
A genetic algorithm is a metaheuristic based on the process of natural selection. This type of algorithm belongs to a large class of evolutionary algorithms. It is used for high-quality solutions of optimization and search problems, using such operations as mutation, selection, and crossing. To build a neural network, it is necessary to configure the following parameters: The number of neurons, the number of layers, the choice of the activation function, and the network optimizer.
The implementation of the algorithm consists of the following steps:
  • Initialization of N random networks to create a population.
  • Evaluation of each network. This step takes a long time, as it is necessary to train each neural network, then determine how well it performs when classifying the test set.
  • Sorting of all networks in the population, according to the prediction accuracy of the test sample. A certain percentage of the best networks are retained to be part of the next generation and to create descendants. There will also be several networks with a low level of accuracy, potentially helping to find combinations between the worst and best neural networks.
  • The next stage is “reproduction”: the algorithm selects two different members of the population and creates one or more descendants, where each descendant is a combination of a random set of parameters of its parents; for example, one descendant may have the same number of layers as one of its parents, and the rest of the parameters from its other parent.
  • After it has been decided which networks should be stored, some parameters in a given set of networks are randomly changed.
The initial data for building a network are:
  • layers_count—an array of valid values for determining the number of layers in the neural network;
  • neurons_count—a set of valid values for choosing the number of neurons in a layer;
  • activation—a set of names of activation functions; and
  • optimizer—a set of names for optimization functions.
For the execution of the program, binary cross entropy (binary_crossentropy) was specified as the loss function.

6. Description of Test Data

The data used in this study were obtained using a mobile application, in which patients and healthy people undergo a wide range of tests which have been agreed upon by medical personnel. When taking the tests, speech, hand tremors, tapping with fingers, speed of movement, balance, and reaction time are evaluated. The application users comprised 28 people, of which 10 were patients aged 45 to 80 years with a confirmed diagnosis of PD. Data collection was carried out for 1 month; as a result, 100,000 records were obtained for the rotation and tilt angles of the mobile phone, and 5000 records according to the test results.
To train the network, there was a need for data on the well-being of patients. As such, they entered data throughout the day after passing the tests: The time of taking their drugs, the severity of dyskinesia, and self-assessment of their condition. According to the results of each test, after the completion of its passage, a numerical score was calculated. Then, the obtained results were analyzed together with the data entered manually. The result of the intellectual analysis of all tests and data received from the device sensors was a “PD score,” characterizing the degree of the patient’s condition.
An example of input data to a neural network for classifying a patient’s condition, according to the data from the test modules, is presented in Table 1.
In Table 1, dp or dip (density-independent pixels) is an abstract unit of measurement that allows applications to look the same on different screens and resolutions, and ms is milliseconds.
The data on voice parameters required separate pre-processing. After the user takes a test, the server receives audio recording files and texts that the users have read. It is necessary to extract the parameter values from the audio recording, which are significant for authentication of the owner of the phone, including:
  • Values of voice loudness, measured in decibels (dB)—average, maximum, minimum values of voice loudness; average, maximum, minimum values of differences in voice loudness; and the number of differences in voice loudness. The loudness value is measured according to the following formulas:
    dbfsCoef = 20/ln(10.0),
    db = lg(amplitude) * dbfsCoef.
    Each frame contains information about the amplitude at a specific point in time. To calculate the loudness value over the entire file, it is necessary to process the amplitude array. At the point where the amplitude value is 0, the loudness value is taken as 0, as log tends to infinity at this point. When calculating the number of differences in loudness values, only those values for which the difference in magnitude of the loudness value from the following value exceeds the number 10 are involved.
  • Pause values—average, maximum pause time, number of pauses. A pause, in this work, is considered when there is a sound volume value less than a certain specified value.
    A segment in which all amplitude values are below the third part of the average amplitude value of the entire file are considered “silence”. The minimum value of the pause length is taken as 0.1 s. The pause time is determined by the following formula: pause time = (frame length)/(sample rate),where length is the difference between the end and beginning of the current pause.
  • Clarity of speech. For speech recognition, we used the library «CMUSphinx», which accepts an audio file as input [30]. The result of processing the file is a list of words. The recognition process is long and not always successful, as different people have different recording quality access and degrees of vocal intelligibility. To assess the intelligibility of speech, the developed test “Read the text” was used.
    As a result of passing the test, after the user read the specified text on the phone screen, the text that was pronounced by the phone user was recorded and recognized. The text was selected by doctors and psychologists. Each text was selected at random from a data set of 20 texts. The percentage of similarity between these texts was used as the measure of intelligibility. The original and recognized texts were compared using the Shingle algorithm, which includes:
    • The canonization of the text (i.e., removing all prepositions and symbols from the text);
    • Splitting the text into shingles (i.e., parts of the text selected for comparison), with a certain number of words in its sequence to check for uniqueness. The shingle size was taken as equal to two;
    • The calculation of shingle hashes using 84 static functions.
  • Speech rate. To determine the value of the rate of speech, it is necessary to divide the number of all spoken words by the duration of the entire audio file. The total number of words is known from the text obtained as a result of recognition. The duration of the entire audio file is defined as duration (in seconds) = (frame length)/(sample rate).
  • List of repeated words and their number of times in the text. Another characteristic feature of speech is the repetition of words or the pronunciation of words of filler words; for example, “e” and “em,” among others. Therefore, it is necessary to highlight these words and the number of repetitions of each of them.
Examples of average voice metrics for two users are shown in Table 2.
Table 2 shows that the number of pauses and the average pause time were very similar between users. This was a consequence of the fact that users read the same text. However, it is possible to notice a difference in the maximum length of the pause, as each person has their own intonation, which is different from that of the other. It can also be seen that the speech speed of both users was quite high, but the difference in some tests was noticeable. One of the most important metrics is intelligibility. From Table 2, it can be seen that intelligibility also depended on the text but, at the same time, it differed significantly for each of the users separately. This can be affected by various factors, such as the fast pronunciation of names and other words, or poor recording quality. It can be concluded that, for each user, these parameters will differ from other users and, as such, it will be possible to determine the similarity of intonations.

7. Testing a Model for Assessing the Condition of a Patient with Parkinson’s Disease Based on a Neural Network and a Genetic Algorithm

To assess the patient’s condition, we built several neural networks. The general diagram of the patient’s condition analysis system is shown in Figure 1.
The original neural network architecture for rotation angles and voice parameters is shown in Figure 2.
The neural network consisted of five layers: The first and second are recurrent LSTMs with 128 neurons, followed by fully connected layers with 64 and 32 neurons, and one output neuron. The introduction of the second recurrent layer made it possible to increase the learning rate and the accuracy of the neural network by reducing the time required for calculating the results of PD severity based on the data provided.
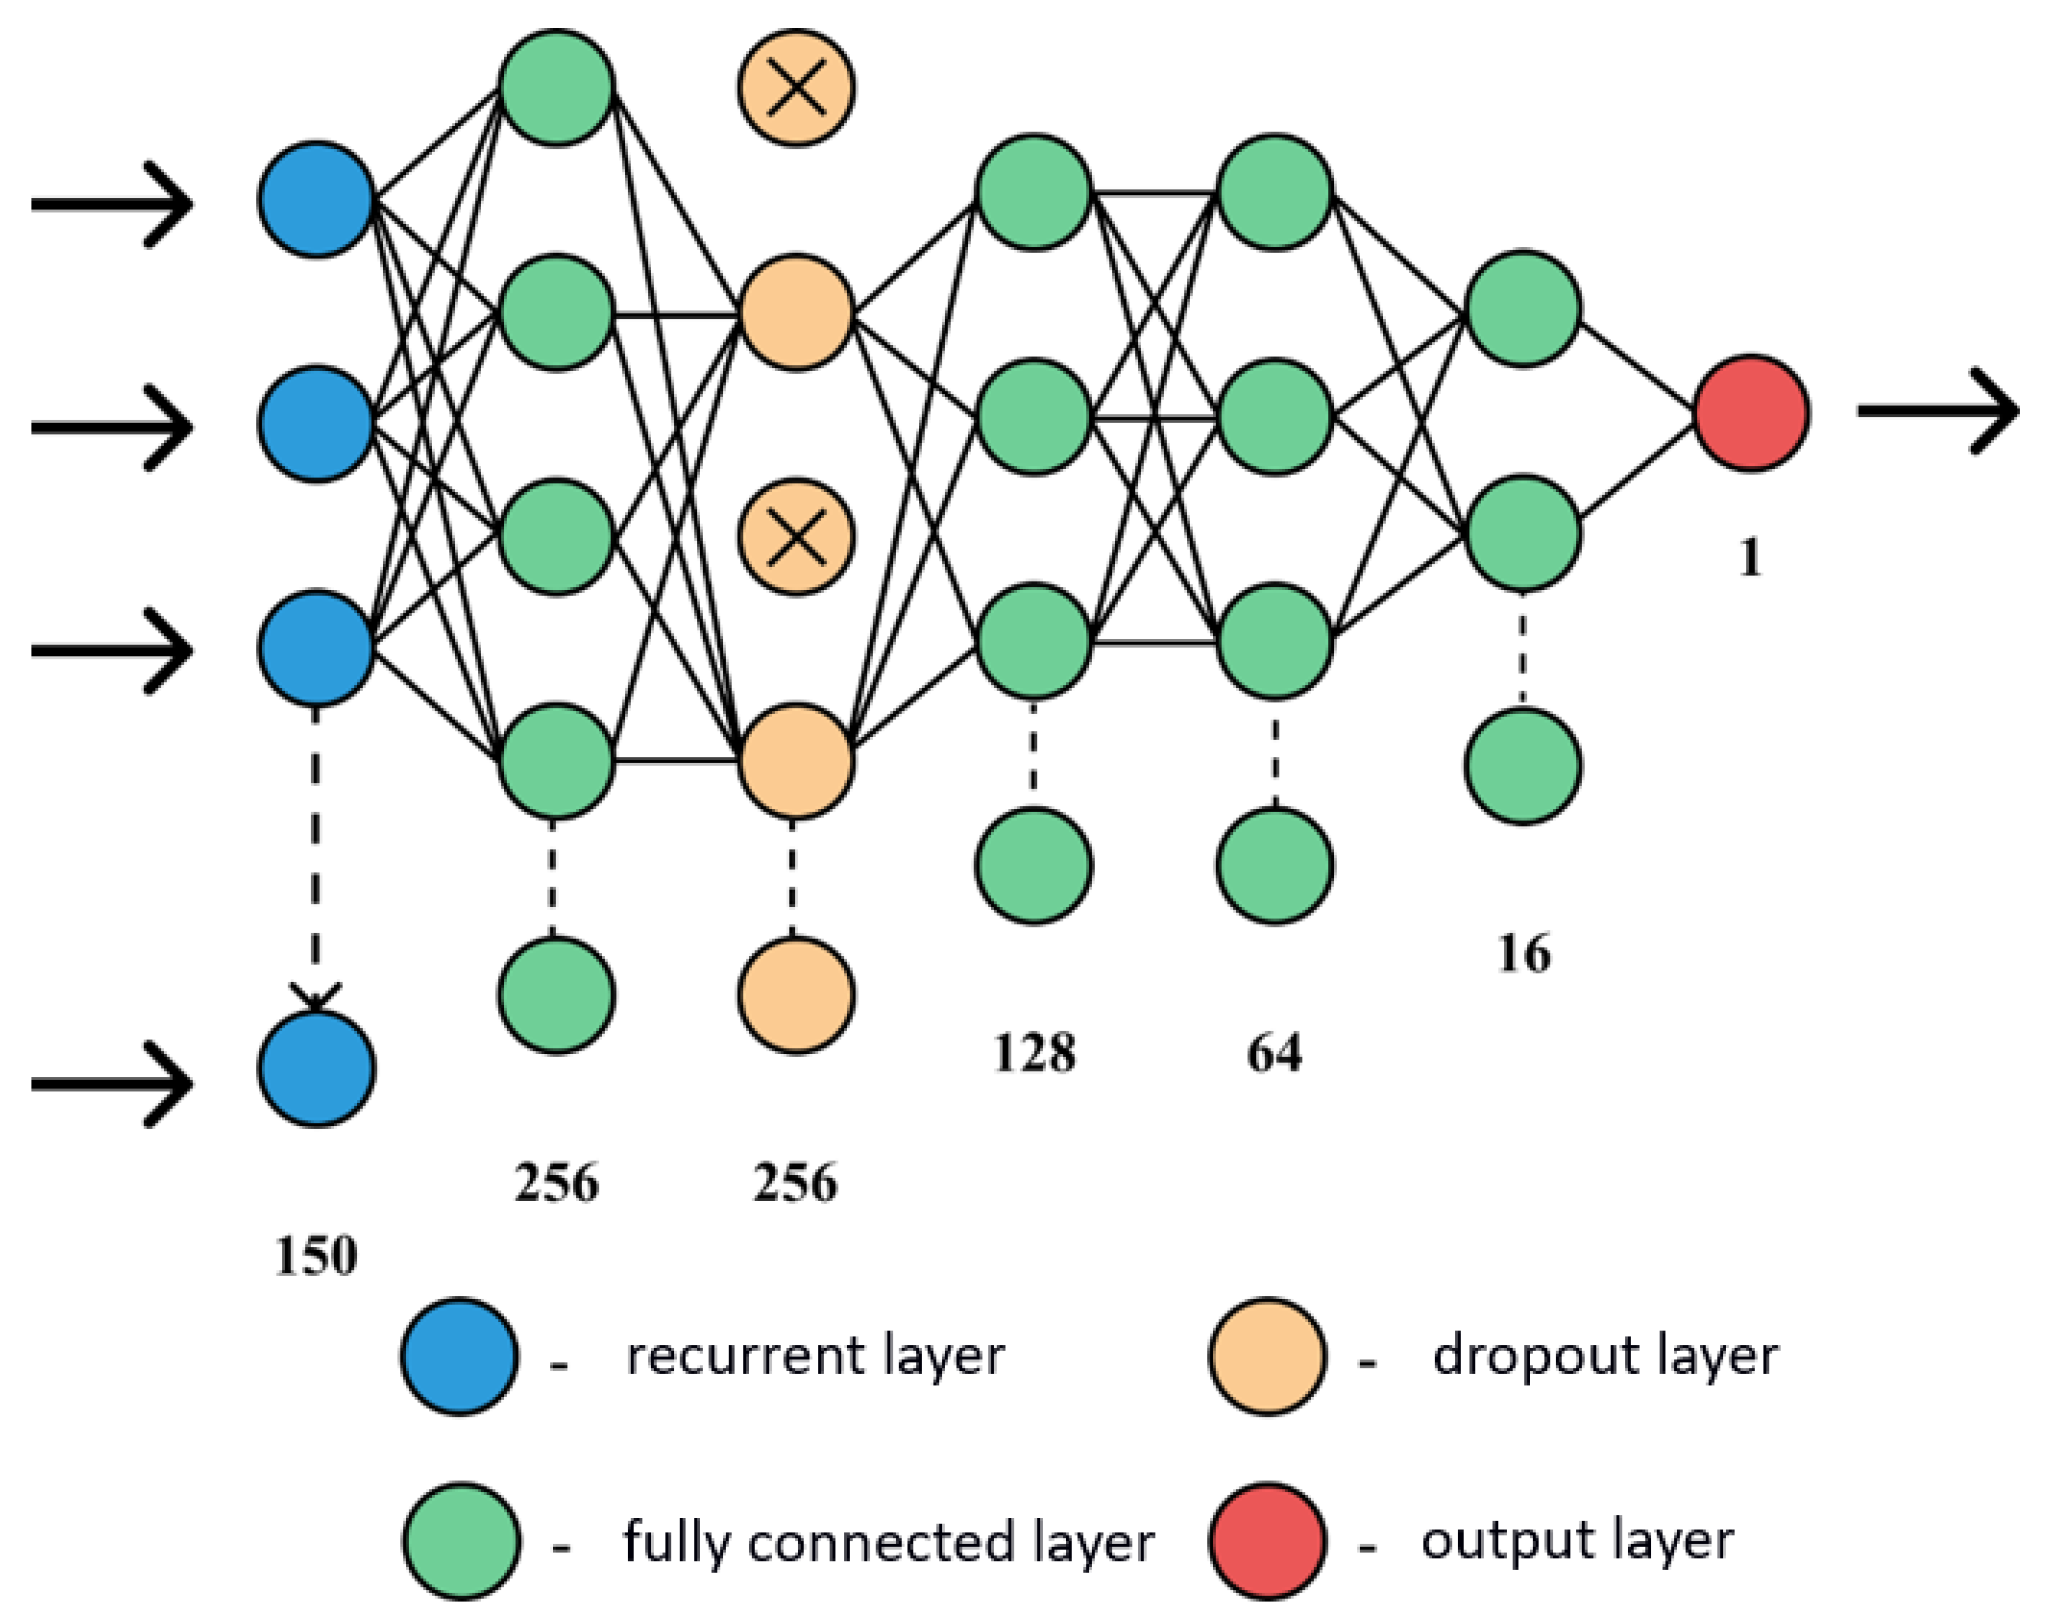
The parameters obtained during the execution of the test modules, such as the speed of movement, the accuracy of the entered text, the accuracy of hitting visual elements, the assessment of fine motor skills, and the reproduction of a geometric figure, required building a separate neural network. The first layer is a recurrent LSTM consisting of 150 neurons. The subsequent layers are fully connected, including 256, 128, 64, 16, and one neuron.
A Dropout layer was introduced between the fully connected layers, as the neural network model only explained examples from the training set, instead of learning to classify examples from the test set. Dropout, or the “thinning method”, passes through all neurons of a certain layer and, with probability p, completely excludes them from the network for the duration of the iteration. Thus, the network relies on a “consensus opinion,” rather than the opinion of a particular neuron. The neural network architecture for test modules is shown in Figure 3.
The number of neurons for all architectures was selected by a heuristic method, where the following parameters were used for construction:
  • Binary cross-entropy (BCE) was used as a loss function;
  • The standard deviation (MSE) was used as a metric for learning quality;
  • The activation function ReLU was used in the hidden layers of the neural network, while that in the output layer was Sigmoid.
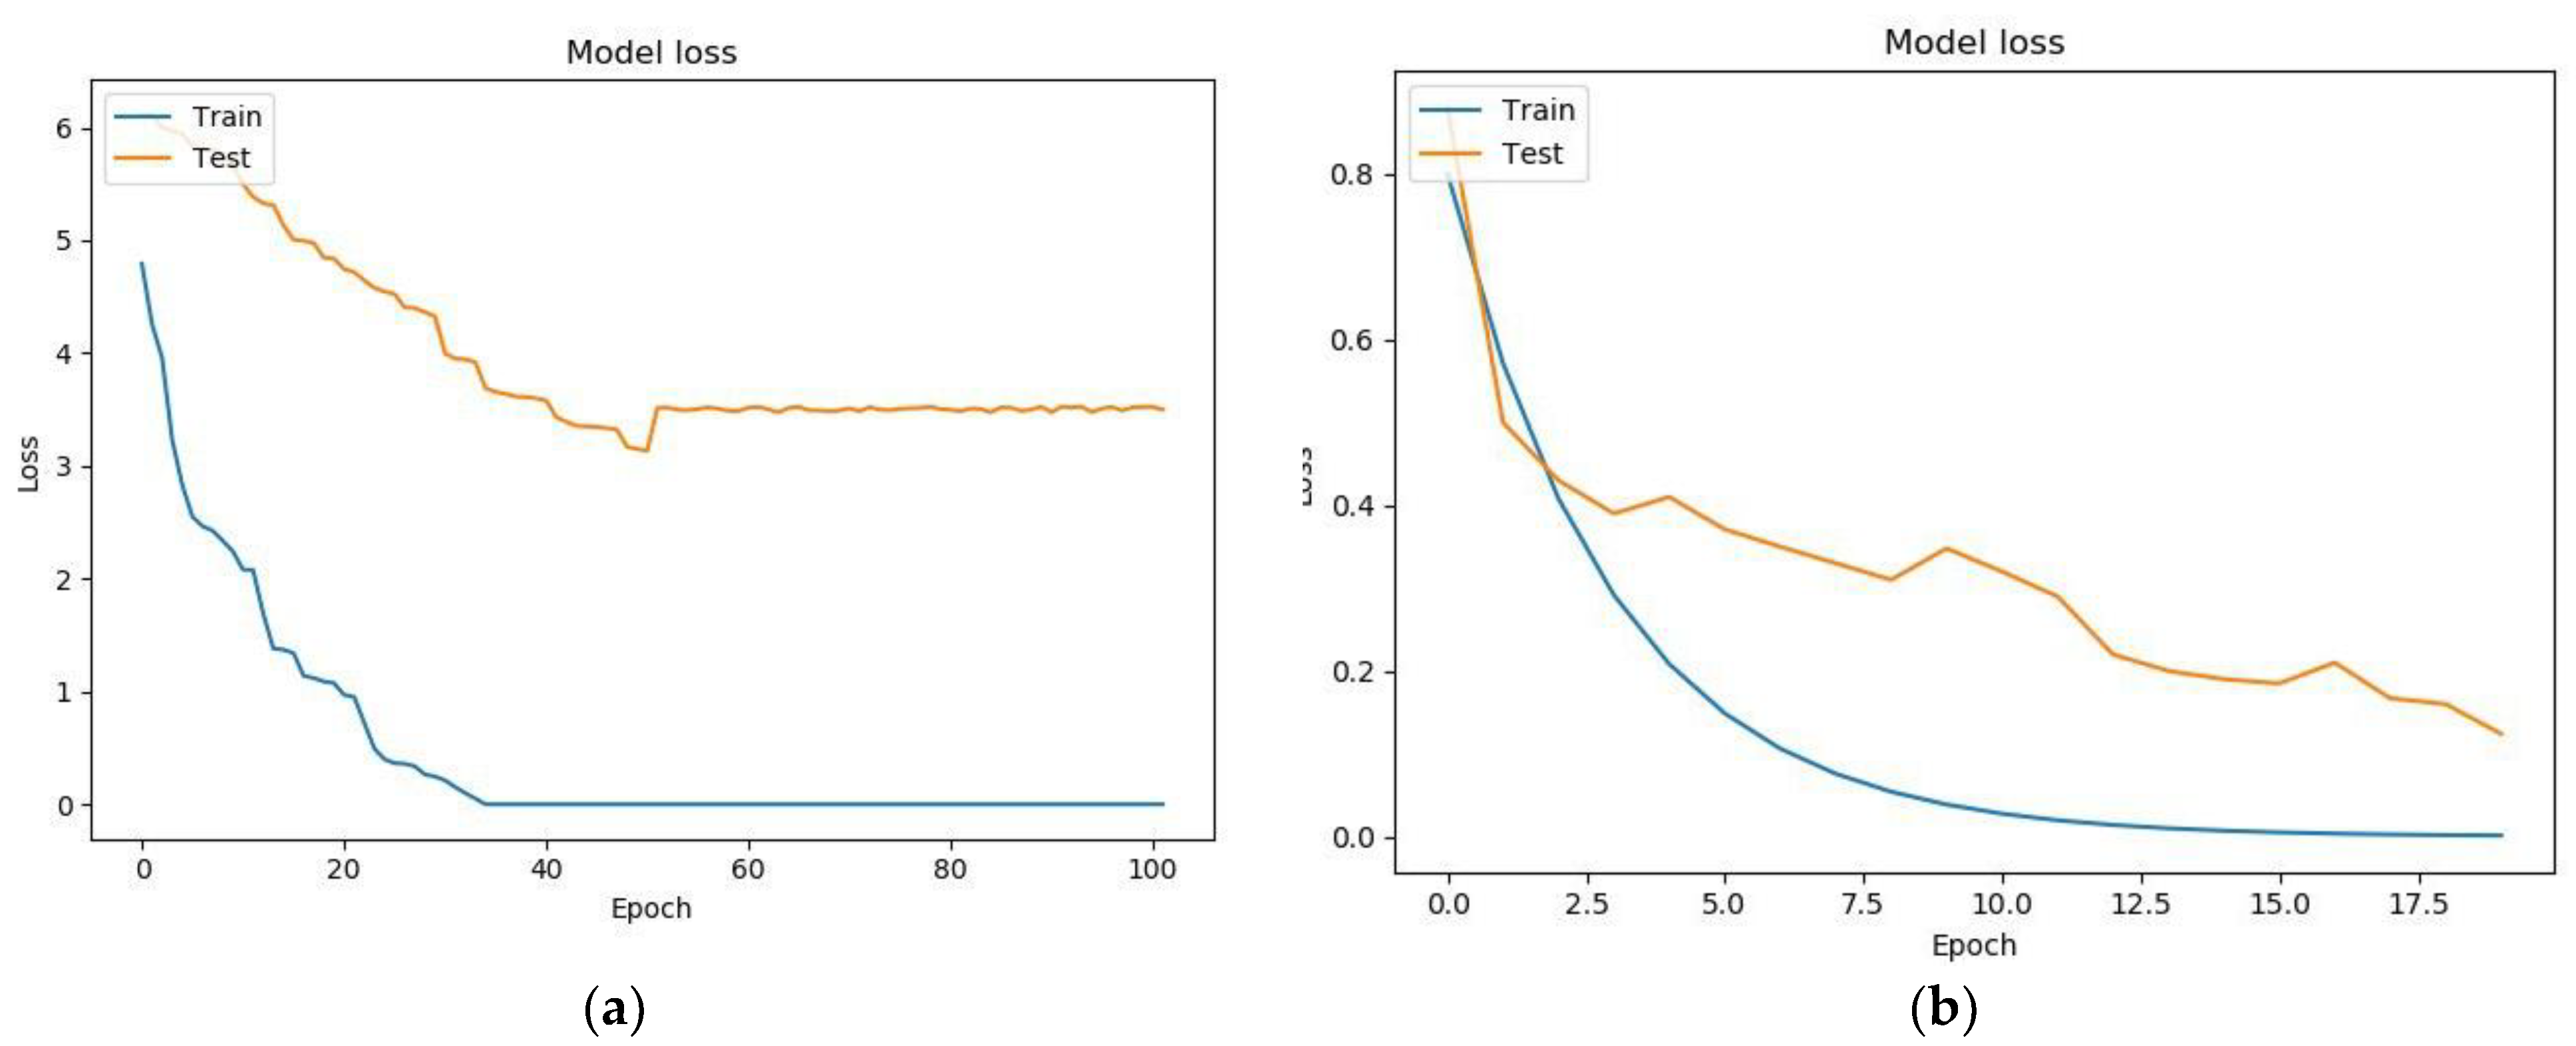
As a result of application of the genetic algorithm, several neural network architectures were built. The results of training are presented in Figure 4. On the abscissa axis is the ordinal number of the training epoch, while the binary cross-entropy value is presented on the ordinate axis, which determines the value of the loss of the neural network computation result from the corresponding value in the validation sample. The blue curve denotes the loss function for the training sample, the orange one for the test sample.
Figure 4 shows graphs of loss functions when training a neural network using test data for only two parameters: the angles of rotation and tilt of a mobile device
The training and testing errors decreased, but the value of the testing error for a given architecture of a neural network designed by an analytical method was less than that for a neural network built using a genetic algorithm (i.e., it summarizes data better). Comparative characteristics of the architectures of these networks are presented in Table 3.
The accuracy rates for an architecture designed without the use of a genetic algorithm were significantly superior to those of a neural network generated by an analytical method. The genetic algorithm was limited to the construction of only fully connected neural networks and, for data on the angles of rotation and tilt of a mobile device, at least one recurrent layer is required, as the data are presented as a function of time.
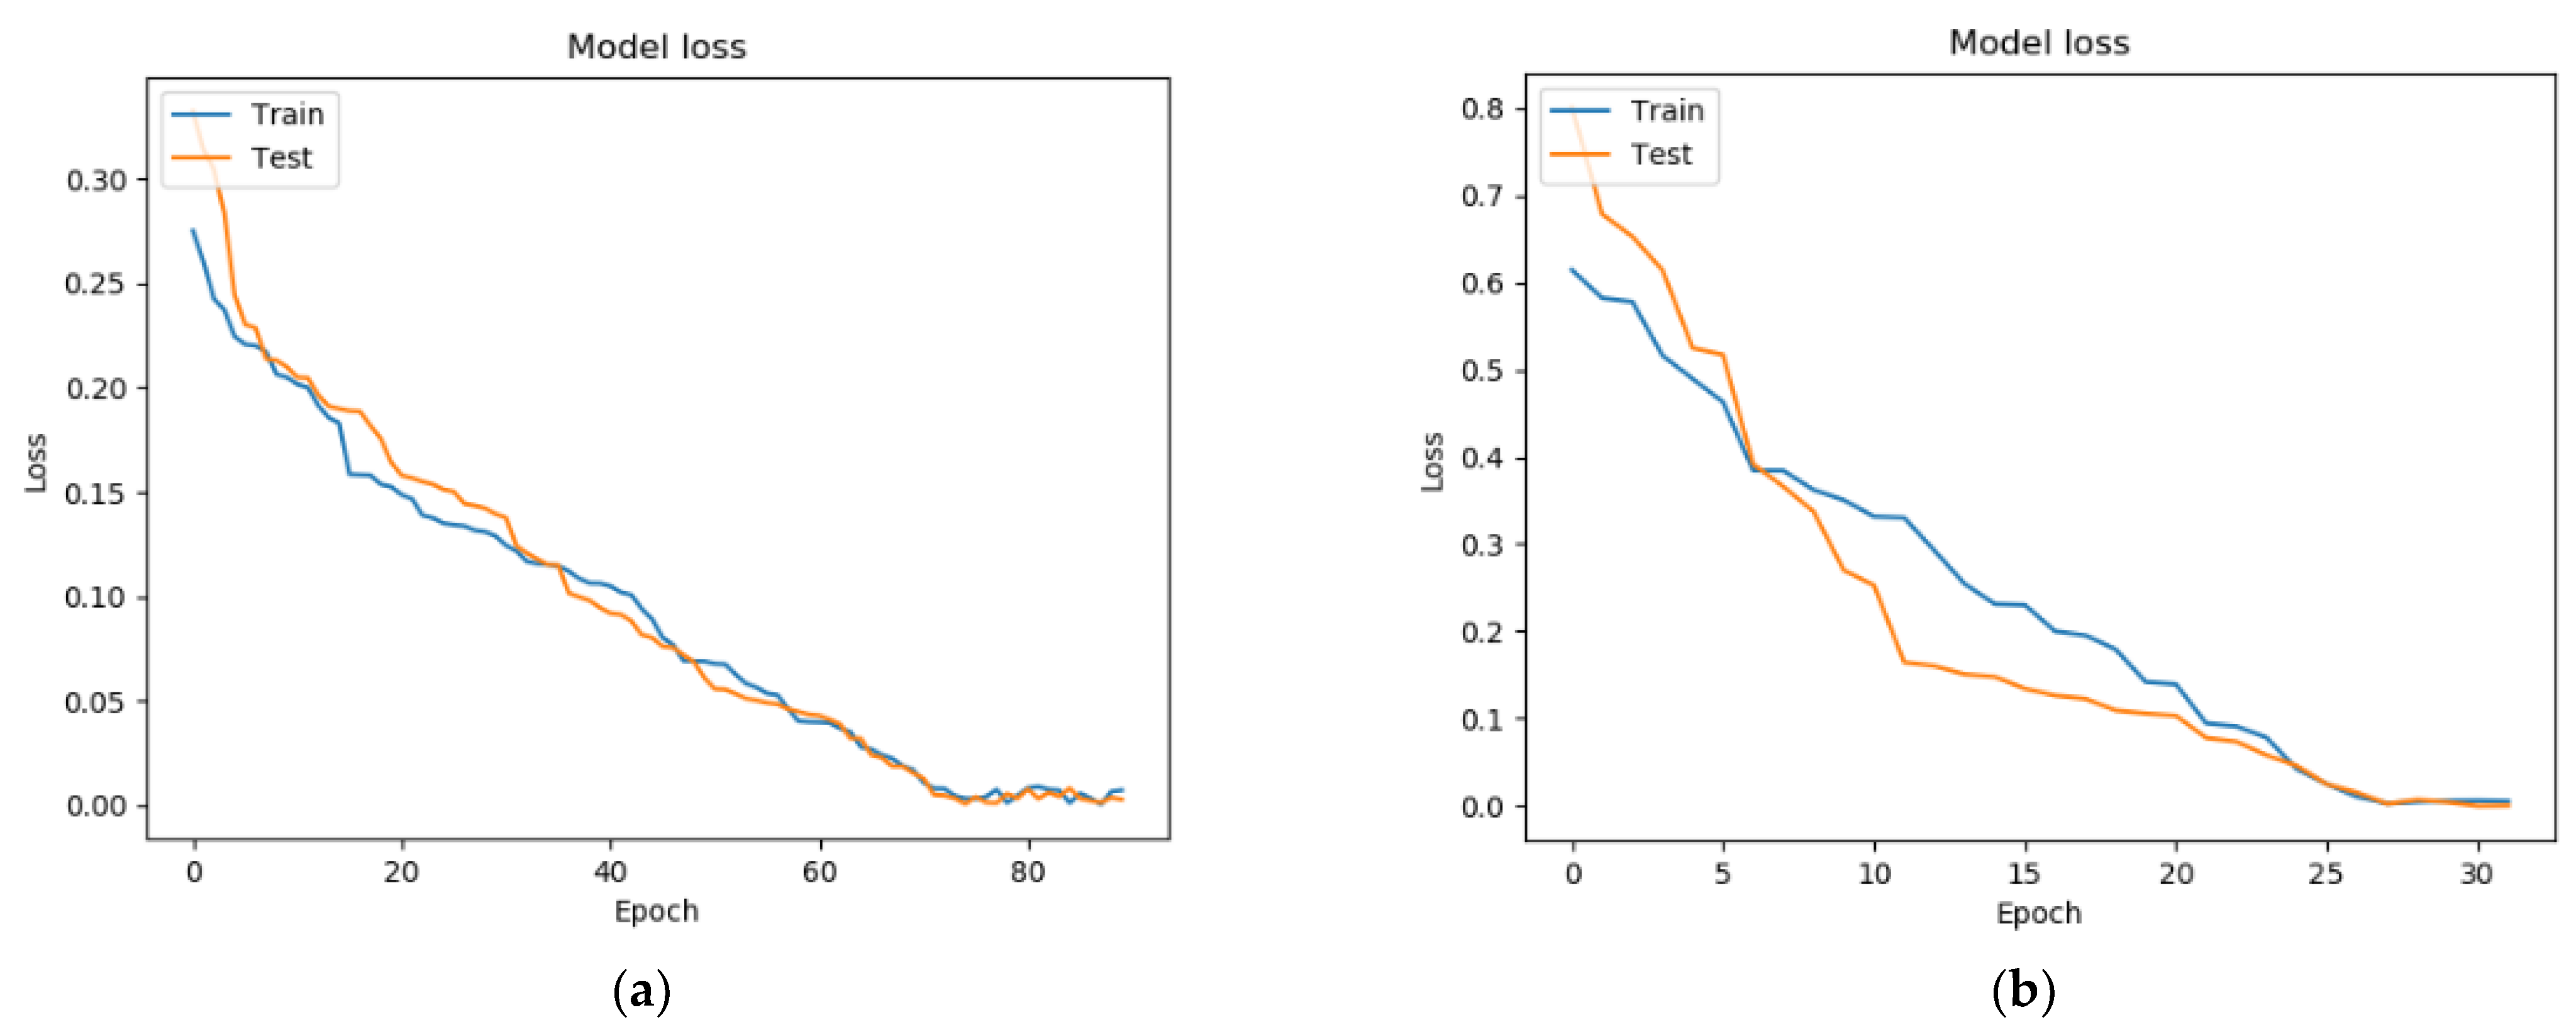
Figure 5 shows the graphs of the loss function for training neural networks, using all data from the test modules.
The training and testing errors decreased for both neural network architectures and tended to zero. Table 4 shows the comparative characteristics of the considered architectures.
The accuracy rates for the two architectures shown in Table 4 are quite high, but the architecture using the genetic algorithm showed much better results and was able to increase the accuracy, bringing it closer to 100% without using recurrent layers.
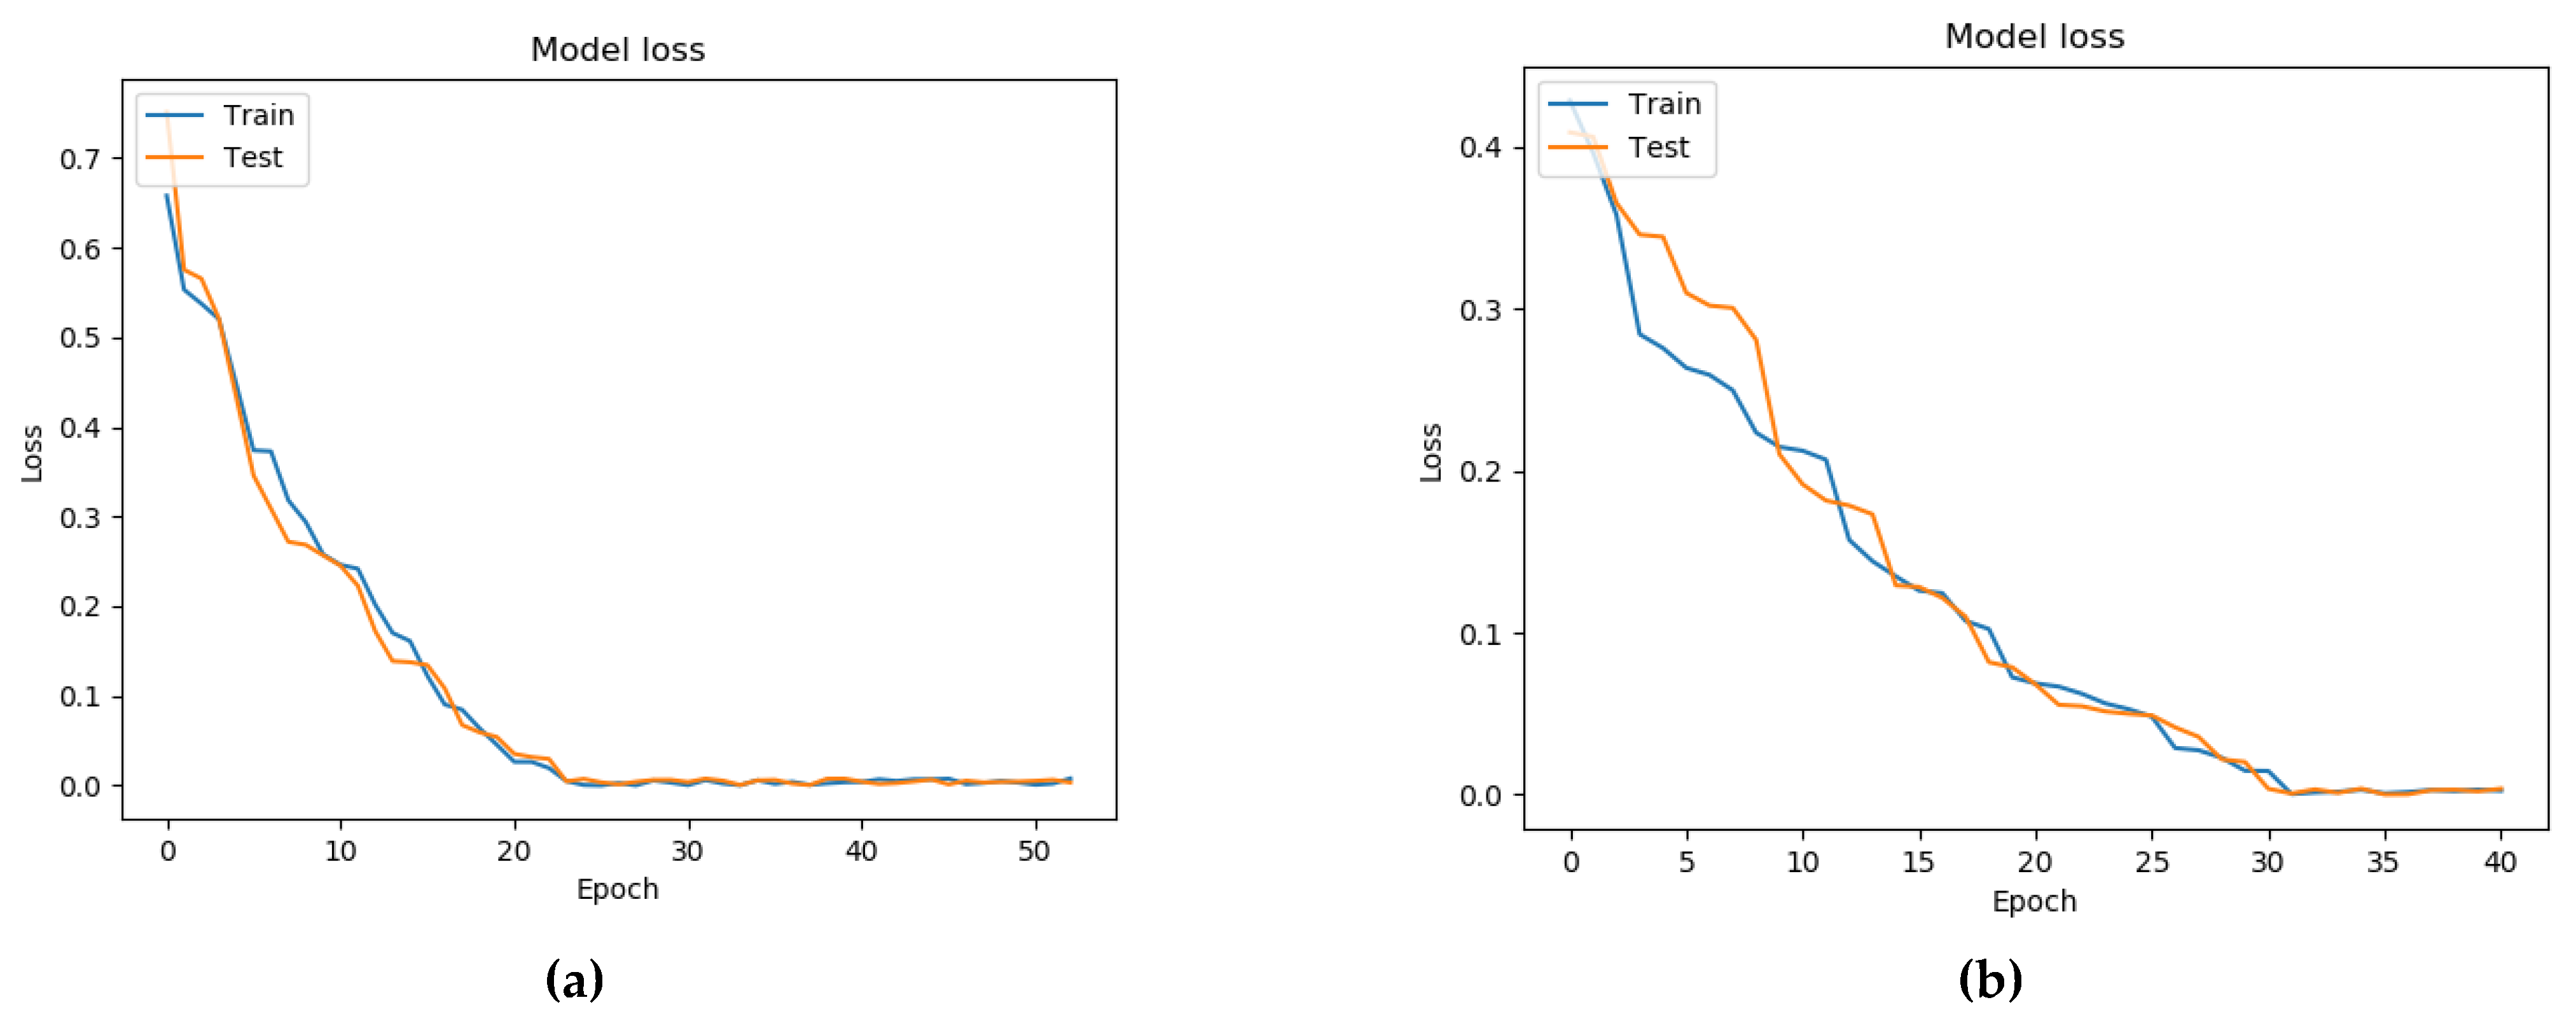
Figure 6 shows graphs of the loss function when training general neural networks. To construct general architectures, the results of the network constructed by the analytical method were taken, considering the angles of rotation and tilt of the mobile device, as well as the results of the network constructed using the genetic algorithm for all tests.
The network training and testing errors decreased for the two neural network architectures, but the error for the architecture designed using the genetic algorithm tended to zero faster. Comparative characteristics of the considered architectures are presented in Table 5.
The accuracies of the neural networks with the architectures presented in Table 5 were approximately equal; however, the architecture built using the genetic algorithm had a much lower value for the loss function, which guarantees comparatively better forecasting results on future data.
It should be noted that it is possible to select the architecture of a neural network using an exhaustive search or other methods. So, for example, in comparison with the exhaustive search method, this approach has a positive point: The search space is smaller, less computing resources are required and, therefore, this method can be implemented even on a mobile phone. A negative feature of the genetic algorithm is the lack of a global solution. The authors of [30] found similar results when analyzing the applicability of the exhaustive search method in their studies, which can be applied with a small amount of data and a large amount of computing resources.
Below in Table 6 are the results of a comparative analysis of assessments of the condition of a patient with Parkinson’s disease with different approaches to the construction of an analytical system.
It can be seen, from the table, that if the data set is supplemented with voice data and a hybrid method for constructing the neural network architecture is applied to the data set, it is possible to increase the accuracy of assessing the condition of a patient with Parkinson’s disease.
In the previous version of the system, neural networks were built analytically, on a data set without voice data. This led to a 77% accuracy. With these tests, the accuracy in determining the patient’s condition was 83%, which was 6% better than the previous result. The diagram in Figure 7 presents the results of a comparative analysis of the accuracy of assessing the condition of patients using a neural network with and without voice data.
The diagram shows that a neural network built using a genetic algorithm and based on a data set supplemented with voice data can provide a more accurate assessment of the patient’s condition than a neural network built using an analytical method without voice data.
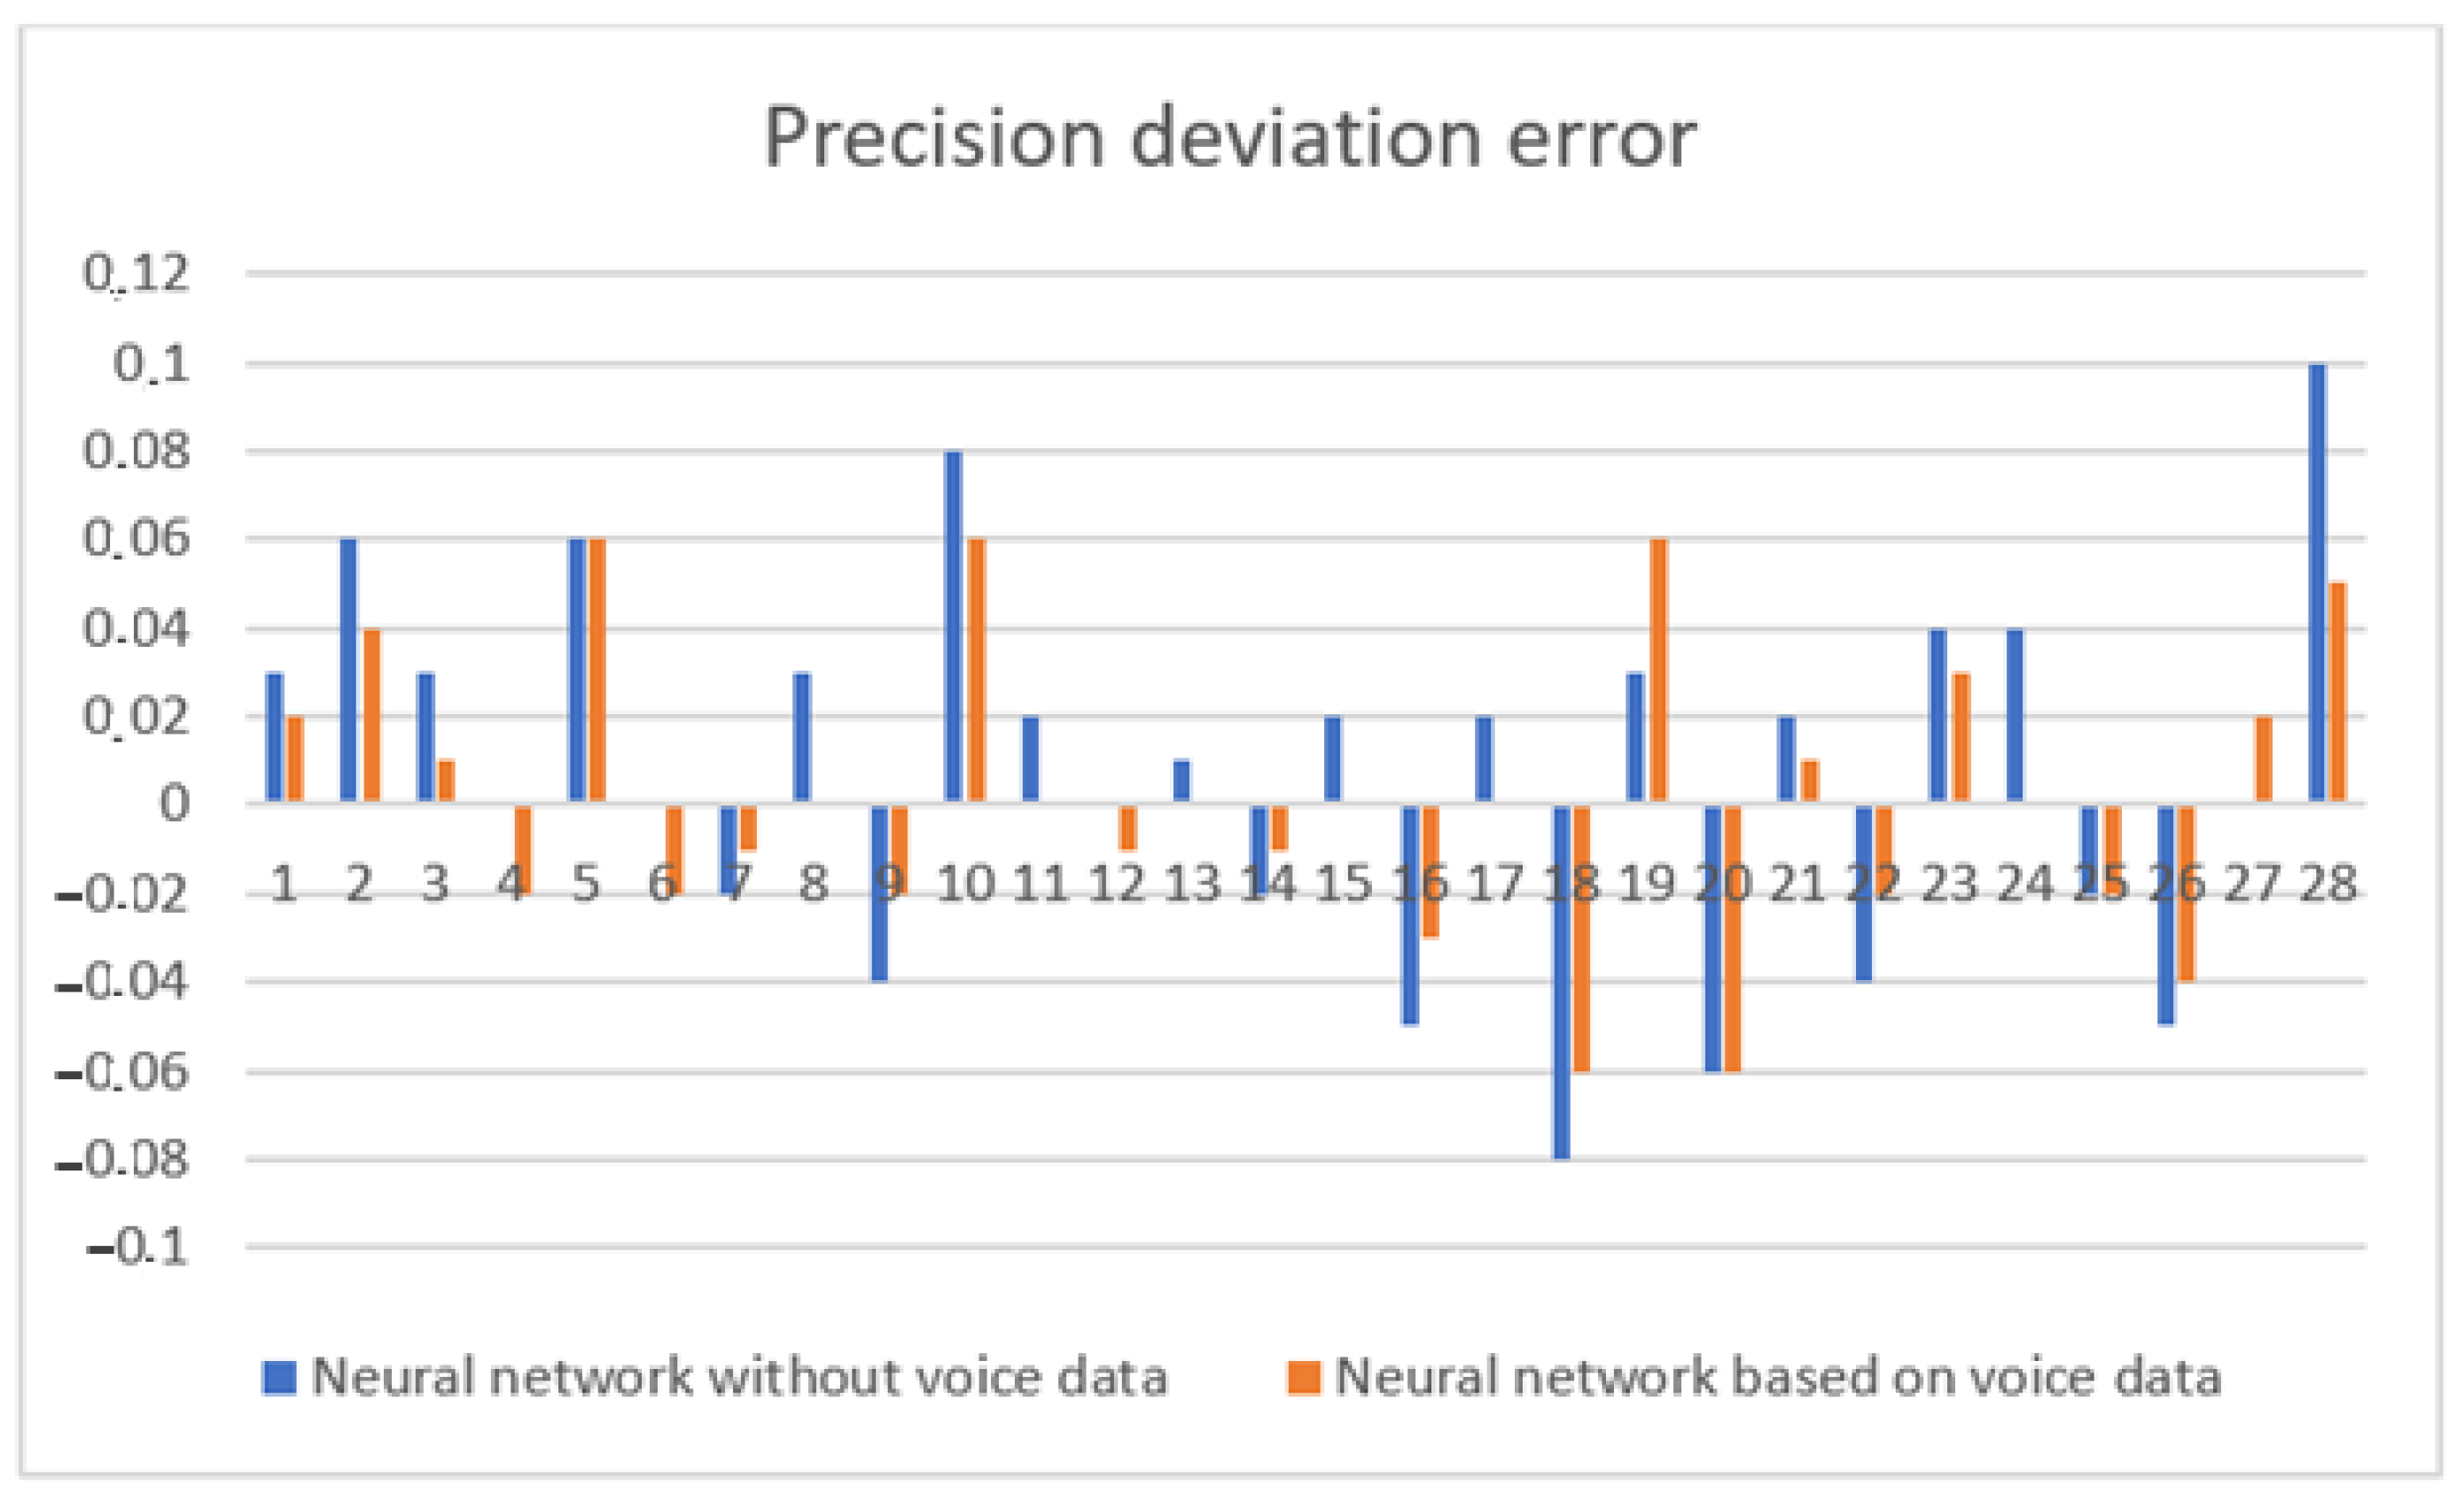
In Figure 8, the values of deviations of the assessment of the state of both networks from the average assessment are shown, calculated as the arithmetic mean for assessments of their condition by the patient and their doctor.
It can be seen from the diagram that the deviation of the assessment of the patient’s condition—obtained as a result of the use of a neural network with voice data—from the average estimate was, in almost all cases, lower than the deviation for a neural network based on a data set without voice data.
Increased accuracy is important for monitoring the condition of a patient with Parkinson’s disease, as it allows for responses to deviations from the treatment trajectory in a timely manner and, based on the results of the analysis of the dynamics of the patient’s condition, for considering the treatment regimen. Therefore, even a slight increase can have a significant difference in maintaining the patient’s health.

8. Discussion

Based on the results of our research, it was found that, based on the angles of rotation and tilt of a mobile device or sound parameters, a neural network with an analytical architecture had the best accuracy. For a general neural network and using data from all testing units, the best result was given by a network with an architecture constructed according to a genetic algorithm. However, in practice, it is difficult to use a hybrid version of the network, as there is a problem: a network must be built and implemented on a mobile device for each patient. Therefore, we plan on further development of the work in two directions: removing neural networks and using methods based on logic, reducing the number of parameters. We will use neural networks only to identify the owners of the phone. We can reduce the number of parameters by determining the most significant parameters. We believe that this is the path to explainability of systems utilizing artificial intelligence technologies.

9. Conclusions

The availability of mobile phones for monitoring the state of PD patients can have a profound impact on clinical practice by giving physicians access to long-term data. This additional data can help doctors to gain a fuller and more objective understanding of symptoms and fluctuations in symptoms of their patients, therefore enabling more accurate diagnoses and treatment regimens.
As a result of this work, we determined that the proposed neural network was able to generalize data on the angles of rotation and tilt of a mobile phone, in order to identify PD symptoms. A comparative analysis of two methods for constructing neural network architectures was considered and carried out. Adding data on voice parameters in combination with other parameters to the analysis system of a patient with Parkinson’s disease and applying a semi-automated approach to building a neural network gave the best result. Neural networks were built in Python using the TensorFlow [31] and Keras libraries [32].
It was found that the use of LSTM, instead of GRU, blocks can lead to higher accuracy for the neural network. Future research will focus on building neural networks with more parameters and on a larger sample of initial data, which will lead to the better training of the neural network, such that it may return even more accurate diagnosis results. To train and evaluate the constructed neural networks, we used preliminary assessments of the states of the patients. These estimates were given by the patients themselves, and are not always correct assessments. This is a problem that we are contemplating how to solve.
Much more data—both in terms of volume and number of parameters—are needed to more accurately determine the robustness of machine learning and smartphone tests, in terms of these confounding factors.

Author Contributions

Y.S.: Conceptualization, Methodology, Writing—Original Draft; Y.I.: Evaluation of graphs, Testing; E.S.: Software, Formal analysis, Visualization; A.d.J.P.S.: Data pre-processing. All authors have read and agreed to the published version of the manuscript.

Funding

This work was supported by the Ministry of Science and Higher Education of the Russian Federation by the Agreement № 075-15-2020-933 dated 13 November 2020, on the provision of a grant in the form of subsidies from the federal budget for the implementation of state support for the establishment and development of the world-class scientific center: Pavlov center «Integrative physiology for medicine, high-tech healthcare, and stress-resilience technologies».

Institutional Review Board Statement

The study was conducted in accordance with the Declaration of Helsinki, and the protocol was approved at the meeting of the Academic Council of the N.P.Bechtereva Institute of the Human Brain of the Russian Academy of Sciences dated 17 September 2015. (No. 29).

Informed Consent Statement

Informed consent was obtained from all subjects involved in the study.

Data Availability Statement

The data presented in this study are available on request from the corresponding author.

Conflicts of Interest

The authors declare that they have no known competing financial interest or personal relationships that could have appeared to influence the work reported in this paper.

References

  1. Levin, O.S.; Fedorova, N.V. Parkinson’s Disease; OAO IPO «Lev Tolstoy»: Moskow, Russia, 2006. (In Russian) [Google Scholar]
  2. Luna, E.; Luk, K.C. Bent out of shape: α-Synuclein misfolding and the convergence of pathogenic pathways in Parkinson’s disease. FEBS Lett. 2015, 589, 3749–3759. [Google Scholar] [CrossRef] [Green Version]
  3. Stankevich, E.; Paramonov, I.; Timofeev, I.; Demidov, P.G. Mobile Phone Sensors in Health Applications. In Proceedings of the 12th FRUCT Conference, Oulu, Finland, 5–9 November 2012; p. 19. [Google Scholar]
  4. Wenlong, X.; Yin, L. mHealthApps: A Repository and Database of Mobile Health Apps. US National Library of Medicine National Institutes of Health. 2018. Available online: https://www.ncbi.nlm.nih.gov/pmc/articles/PMC4382566/ (accessed on 16 December 2019).
  5. Pavlakis, P.; Alepis, E.; Virvou, M. Intelligent mobile multimedia application for the support of the elderly. In Proceedings of the Eighth International Conference on Intelligent Information Hiding and Multimedia Signal Processing, Piraeus-Athens, Greece, 18–20 July 2012; pp. 297–300. [Google Scholar]
  6. Wu, D.; Warwick, K.; Ma, Z.; Gasson, M.N.; Jonathan, G.; Burgess, J.G.; Pan, S.; Aziz, T.Z. Prediction of parkinson’s disease tremor onset using a radial basis function neural network based on particle swarm optimization. Int. J. Neural Syst. 2010, 20, 109–116. [Google Scholar] [CrossRef]
  7. Wu, D.; Warwick, K.; Ma, Z.; Burgess, J.G.; Pan, S.; Aziz, T.Z. Prediction of Parkinson’s disease tremor onset using radial basis function neural networks. Expert Syst. Appl. 2010, 37, 2923–2928. [Google Scholar] [CrossRef]
  8. Antos, S.; Albert, M.; Kording, K. Hand, belt, pocket or bag: Practical activity tracking with mobile phones. J. Neurosci. Methods 2014, 231, 22–30. [Google Scholar] [CrossRef] [Green Version]
  9. Sadek, R.M.; Mohammed, S.A.; Abunbehan, A.R.K.; Ghattas, A.K.H.A.; Badawi, M.R.; Mortaja, M.N.; Abu-Nasser, B.S.; Abu-Naser, S.S. Parkinson’s disease prediction using artificial neural network. Int. J. Acad. Health Med Res. (IJAHMR) 2019, 3, 1–8. [Google Scholar]
  10. Joshi, S.; Shenoy, D.; Rrashmi, P.L.; Venugopal, K.R.; Patnaik, L.M. Classification of Alzheimer’s disease and Parkinson’s disease by using machine learning and neural network methods. In Proceedings of the Second International Conference on Machine Learning and Computing, Bangalore, India, 12–13 June 2010; pp. 218–222. [Google Scholar] [CrossRef]
  11. Ahmed, S.S.S.J.; Santosh, W.; Kumar, S.; Christlet, T. Neural network algorithm for the early detection of Parkinson’s disease from blood plasma by FTIR micro-spectroscopy. Vib. Spectrosc. 2010, 53, 181–188. [Google Scholar] [CrossRef]
  12. Hirschauer, T.J.; Adeli, H.; Buford, J.A. Computer-Aided Diagnosis of Parkinson’s disease using enhanced probabilistic neural network. J. Med. Syst. 2015, 39, 179. [Google Scholar] [CrossRef] [PubMed]
  13. Palumbo, B.; Fravolini, M.L.; Nuvoli, S.; Spanu, A.; Paulus, K.S.; Schillaci, O.; Madeddu, G. Comparison of two neural network classifiers in the differential diagnosis of essential tremor and Parkinson’s disease by 123I-FP-CIT brain SPECT. Eur. J. Nucl. Med. Mol. Imaging 2010, 37, 2146–2153. [Google Scholar] [CrossRef]
  14. Ene, M. Neural network-based approach to discriminate healthy people from those with Parkinson’s disease, Annals of the University of Craiova. Math. Comp. Sci. Ser. 2008, 35, 112–116. [Google Scholar]
  15. Hariharan, M.; Polat, K.; Sindhu, R. A new hybrid intelligent system for accurate detection of Parkinson’s disease. Comput. Methods Programs Biomed. 2014, 113, 904–913. [Google Scholar] [CrossRef] [PubMed]
  16. Tracy, J.M.; Özkanca, Y.; Atkins, D.C.; Ghomi, R.H. Investigating voice as a biomarker: Deep phenotyping methods for early detection of Parkinson’s disease. J. Biomed. Inform. 2020, 104, 103362. [Google Scholar] [CrossRef] [PubMed]
  17. Fernández-García, S.; Dumitrache, C.G.; González-López, J.A. Acoustic analysis of the voice in patients with Parkinson’s disease and hypokinetic dysarthria. Revista de Logopedia, Foniatría y Audiología 2020. [Google Scholar] [CrossRef]
  18. Hemmerling, D.; Wojcik-Pedziwiatr, M. Prediction and Estimation of Parkinson’s Disease Severity Based on Voice Signal. J. Voice 2020. [Google Scholar] [CrossRef] [PubMed]
  19. Majda-Zdancewicz, E.; Dobrowolski, A.; Potulska-Chromik, A.; Jakubowski, J.; Chmielińska, J.; Białek, K.; Nojszewska, M.; Kostera-Pruszczyk, A. The use of voice processing techniques in the assessment of patients with Parkinson’s disease. In Proceeding of the SPIE 11442, Radioelectronic Systems Conference, Jachranka, Polan, 20–21 November 2019. [Google Scholar] [CrossRef]
  20. Poorjam, A.H.; Kavalekalam, M.S.; Shi, L.; Raykov, J.P.; Jensen, J.R.; Little, M.A.; Christensen, M.G. Automatic quality control and enhancement for voice-based remote Parkinson’s disease detection. Speech Commun. 2021, 127, 1–16. [Google Scholar] [CrossRef]
  21. Tsanas, A.; Little, M.A.; Ramig, L.O. Remote Assessment of Parkinson’s Disease Symptom Severity Using the Simulated Cellular Mobile Telephone Network. IEEE Access 2021, 9, 11024–11036. [Google Scholar] [CrossRef] [PubMed]
  22. Viswanathan, R.; Arjunan, S.P.; Bingham, A.; Jelfs, B.; Kempster, P.; Raghav, S.; Kumar, D.K. Complexity Measures of Voice Recordings as a Discriminative Tool for Parkinson’s Disease. Biosensors 2020, 10, 1. [Google Scholar] [CrossRef] [PubMed] [Green Version]
  23. Ali, L.; Zhu, C.; Zhou, M.; Liu, Y. Early diagnosis of Parkinson’s disease from multiple voice recordings by simultaneous sample and feature selection. Expert Syst. Appl. 2019, 137, 22–28. [Google Scholar] [CrossRef]
  24. Lahmiri, S.; Shmuel, A. Detection of Parkinson’s disease based on voice patterns ranking and optimized support vector machine. Biomed. Signal Process. Control 2019, 49, 427–433. [Google Scholar] [CrossRef]
  25. Aich, S.; Younga, K.; Hui, K.L.; Al-Absi, A.A.; Sain, M. A nonlinear decision tree based classification approach to predict the Parkinson’s disease using different feature sets of voice data. In Proceedings of the 2018 20th International Conference on Advanced Communication Technology (ICACT), Chuncheon, South Korea, 11–14 February 2018; pp. 638–642. [Google Scholar] [CrossRef]
  26. Wroge, T.J.; Özkanca, Y.; Demiroglu, C.; Si, D.; Atkins, D.C.; Ghomi, R.H. Parkinson’s Disease Diagnosis Using Machine Learning and Voice. In Proceedings of the 2018 IEEE Signal Processing in Medicine and Biology Symposium (SPMB), Philadelphia, PA, USA, 1 December 2018; pp. 1–7. [Google Scholar] [CrossRef]
  27. Haq, A.U.; Li, J.P.; Memon, M.H.; khan, J.; Malik, A.; Ahmad, T.; Ali, A.; Nazir, S.; Ahad, I.; Shahid, M.; et al. Feature Selection Based on L1-Norm Support Vector Machine and Effective Recognition System for Parkinson’s Disease Using Voice Recordings. IEEE Access 2019, 7, 37718–37734. [Google Scholar] [CrossRef]
  28. Hochman, R.; Hochman, R.; Khoshgoftaar, T.M.; Allen, E.B.; Hudepohl, J.P. Using the genetic algorithm to build optimal neural networks for fault-prone module detection. In Proceedings of ISSRE’96: 7th International Symposium on Software Reliability Engineering, White Plains, NY, USA, 30 October–2 November 1996; pp. 152–162. [Google Scholar]
  29. Lam, H.-K.; Ling, S.H.; Leung, F.H.F.; Tam, P.K.S. Tuning of the structure and parameters of a neural network using an improved genetic algorithm. IEEE Trans. Neural Netw. 2003, 14, 79–88. [Google Scholar] [CrossRef] [Green Version]
  30. Update on CMUSphinx Project. Available online: https://cmusphinx.github.io/ (accessed on 21 March 2021).
  31. Pendharkar, P.C. Exhaustive and heuristic search approaches for learning a software defect prediction model. Eng. Appl. Artif. Intell. 2010, 23, 34–40. [Google Scholar] [CrossRef]
  32. TensorFlow Core. Available online: https://www.tensorflow.org/overview (accessed on 16 March 2021).
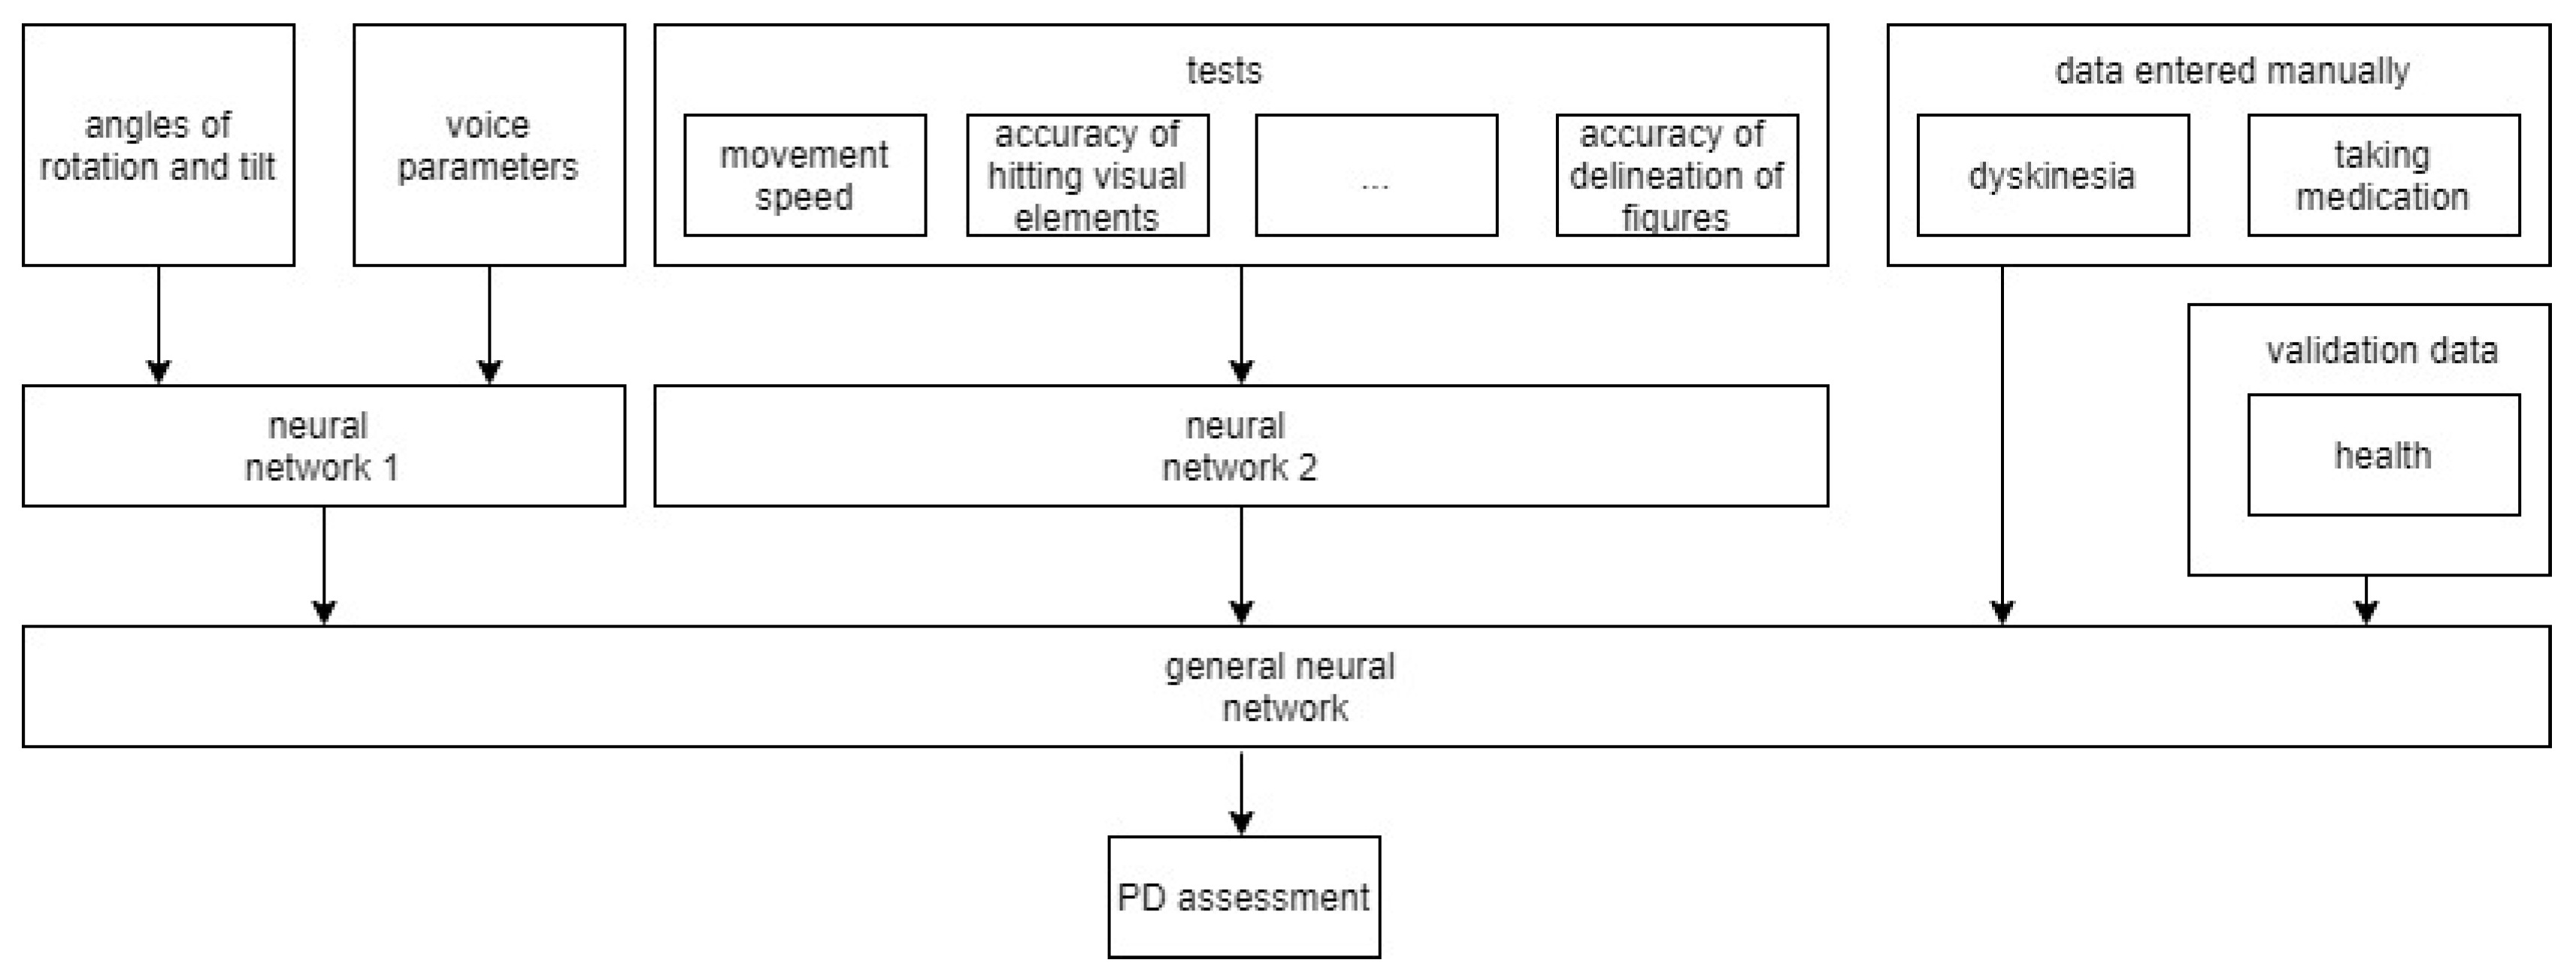
Figure 1. General architecture of a system of neural networks for PD analysis.
Applsci 11 05470 g001
Figure 2. Neural network architecture for assessing changes in the values of the angles of rotation, tilt of a mobile phone, and voice parameters.
Applsci 11 05470 g002
Figure 3. Architecture of the neural network for testing modules.
Applsci 11 05470 g003
Figure 4. Graphs of the loss function for training neural networks using the angles of rotation and tilt of a mobile device as test data. (a) is a graph for a neural network constructed using a genetic algorithm. (b) is a graph of a neural network that was designed using an analytical method.
Applsci 11 05470 g004
Figure 5. Graphs of the loss function for training a neural network according to the data of the testing modules. (a) shows a graph for a neural network developed using a genetic algorithm, while (b) shows a graph of a neural network designed using an analytical method.
Applsci 11 05470 g005
Figure 6. Graphs of the loss function when training a general neural network. (a) shows a graph for a general neural network built using a genetic algorithm, and (b) shows a graph of a general neural network that was designed using an analytical method.
Applsci 11 05470 g006
Figure 7. Estimates of the condition of patients.
Applsci 11 05470 g007
Figure 8. Estimates of the condition of patients.
Applsci 11 05470 g008
Table 1. An example of input data for building a neural network based on patient testing modules.
ParameterParameter DescriptionExample ValueUnit of Measure
Text erasedNumber of characters removed13-
Text timeTime to print text139,763ms
Levenshtein DistanceLevenshtein distance5-
MisclicksThe number of button misses in the application4-
Misclick distanceDistance between nearest button and miss2.357022dp
Tapping left countNumber of strokes with the left finger47-
Tapping right countNumber of strokes with the right finger52-
StateSubjective state of the patient1-
VelocityPhone movement speed1.342ms
Figure distanceDistance from a point to a given shape2.23dp
Table 2. Average indicators of user voices.
Test NumberAverage Pause Time (sec)Maximum Pause TimeNumber of PausesAudibility (%)Number of Words Per SecondPopular Word
10.290.446.834.731.74«and» -2
0.280.566.2516.671.92« more »-2
20.310.545.537.51.99-
0.270.475.531.021.99-
30.310.506.47.281.78-
0.220.485.55.791.63« not, and »-2
40.260.364.6528.351.70
0.180.273.581.74-
50.250.38818.711.92-
0.270.485.54.161.91«in»-2
Table 3. Comparative characteristics of neural network architectures based on test data.
ArchitectureNumber of Epochs for TrainingLoss FunctionAccuracy
Fully connected architecture built using a genetic algorithm1053.743620.1745234
Analytically built architecture (two recurrent layers + two fully connected layers)320.197950.88951
Table 4. Comparative characteristics of architectures for building a neural network based on the data of testing modules.
ArchitectureNumber of Epochs for TrainingLoss FunctionAccuracy
Fully connected architecture built using a genetic algorithm900.0001480.97295
Analytically built architecture (one recurrent layer + four fully connected layers)350.005920.88725
Table 5. Comparative characteristics of neural network architectures for building a general neural network.
ArchitectureNumber of Epochs for TrainingThe Function of LossesAccuracy
Four fully connected layers in a network built using a genetic algorithm550.000002410.83254
Three fully connected layers in a network built without use of a genetic algorithm400.00004820.82152
Table 6. Comparison of the accuracy of assessing the condition of patients with different approaches.
Accuracy of Assessing the Condition of Patients (%)Building Neural Networks AnalyticallyBuilding Neural Network Architectures Using a Genetic AlgorithmHybrid Approach
Using voice parameters807983
Without using voice parameters787780
Publisher’s Note: MDPI stays neutral with regard to jurisdictional claims in published maps and institutional affiliations.