Article

Simulation and Experimental Study of the Near Field Probe in the Form of a Folded Dipole for Measuring Glucose Concentration

Radiophysics Faculty, Tomsk State University, 634050 Tomsk, Russia
*
Author to whom correspondence should be addressed.
Appl. Sci. 2021, 11(12), 5415; https://doi.org/10.3390/app11125415
Submission received: 6 April 2021 / Revised: 5 June 2021 / Accepted: 8 June 2021 / Published: 10 June 2021

Abstract

:

Featured Application

The design is highly sensitive to various glucose concentrations in biological media and can be used for non-invasive monitoring of glucose concentrations.

Abstract

The article investigates the near-field probe of a special design to account for changes in glucose concentration. The probe is designed in such a way that it emits radiation in both directions from its plane. In this paper, it was proposed to modernize this design and consider the unidirectional emission of the probe in order to maximize the signal and reduce energy loss. We have done extensive research for both bidirectional and unidirectional probe designs. Numerical simulations and field experiments were carried out to determine different concentrations of glucose (0, 4, 5.3, 7.5 mmol/L). Numerical modeling of a unidirectional probe showed that the interaction of radiation generated by such a probe with a multilayer structure simulating a human hand showed a better result and high sensitivity compared to a bidirectional probe. Further, based on the simulation results, a phantom (physical model) of a human hand was recreated from layers with dielectric properties as close as possible to the properties of materials during simulation. The probe was constructed from a copper tube and matched both the geometric and physical parameters of the model. The experimental measurement was carried out using a vector network analyzer in the frequency range 2–10 GHz. The experimental measurement was carried out using a vector network analyzer in the frequency range 2–10 GHz for the unidirectional and bidirectional probes. Further, the results of the experiment were compared with the results of numerical simulation. According to the results of multiple experiments, it was found that the average deviation between the concentrations was 2 dB for a unidirectional probe and 0.4 dB for a bidirectional probe. Thus, the sensitivity of the unidirectional probe was 1.5 dB/(mmol/L) for the bidirectional one 0.3 dB/(mmol/L). Thus, the improved design of the near-field probe can be used to record glucose concentrations.

1. Introduction

Measurement of glucose concentration is necessary for the prevention and treatment of diabetes. Early diagnosis of diabetes and prevention of its complications are important challenges for global health. Timely and accurate blood glucose control is significant for people with diabetes, especially those on insulin therapy. Thanks to regular measurements of glucose concentration, the adequacy of therapy is evaluated and, if the level of glycemia is unsatisfactory, a correction of therapy is planned. In addition, such measurements can prevent acute and chronic metabolic complications. At the same time, regular control of sugar levels in the population is extremely important for the prevention of such an incurable disease as diabetes. Despite the existing variety of physical methods for the non-contact determination of blood glucose concentration [1,2], the problem of creating effective non-invasive glucometers is still very urgent. The best known are electrochemical methods [3,4,5], optical methods [6,7], transdermal methods [8], microwave or radio frequency methods [9,10,11,12,13,14,15,16]. The development of contact lenses based on the measurement of tears, a liquid containing glucose, is also gaining popularity [17]. A large number of works in the direction of radio frequency methods are associated with the fact that microwave radio waves penetrate deep enough into biological tissues, however, due to small wavelengths, they are lost with significant distortions due to small inhomogeneities, and also it are sensitive to the integral parameters of the medium. In this case, the concentration of glucose affects the integral electrical characteristics. Most of the work in this area is based on the analysis of the frequency shift of the signal reflected from blood analog samples with different glucose concentrations [14] using microstrip antennas. The disadvantage of this approach is a small change in frequency with a large change in glucose concentration. The electrochemical method is the most accurate of the above methods, but it has a significant drawback, namely: glucose is measured by piercing the skin to take a blood sample. Besides the fact that this procedure is extremely unpleasant and unsafe, this method requires a lot of additional material, such as test strips. The latter, taking into account the fact that monitoring of glucose in the blood must be carried out very often leads to significant costs. In addition, accuracy is critical to creating an effective continuous glucose monitoring device. Optical methods are quite accurate today. The authors of [7] have shown that the use of a 6 × 6 mm sensor made with hollow silicone microneedles allows a sufficiently accurate result to be achieved. The measurement error was 15%, which is currently a high result for non-invasive glucose measurement methods. The main problem with this approach is the complexity of creating such sensors.
The most common non-invasive methods for measuring glucose levels are radio frequency methods [10,11]. Such methods are harmless to the human body and do not require piercing of the finger or other parts of the body. The authors of [10] use a wireless microstrip sensor with information transmission over the air using Vivaldi antennas.The authors used water as a measured substance with the addition of glucose contained in the liquid in a volume of 20%, 25% and 30%. Measurement of the transmission coefficient showed a shift of the resonance frequency of 0.1 GHz with a change in the glucose content in water from 20% to 50%. The main problem with this device is that the test piece must be placed between the ports of the device, and the transmitting antennas are large compared to the sensor itself. The authors of [11] created a microstrip sensor based on a resonant design, which made it possible to achieve acceptable results (the authors do not indicate exact numbers). The article considered two resonant frequencies of 3.41 and 3.81 GHz. The difference in the amplitudes of the transmitted signal when measuring deionized water with glucose was in the range of 0.04–0.2 g/mL. In this case, the value of the transmitted signal for the entire range of changes in glucose concentration was 0.87 dB. The disadvantage of such a sensor is a rather narrow frequency band in which the response of the system to a change in glucose concentration is observed.
This article proposes to consider a near-field microwave probe in the form of a combined emitter (a combination of a symmetric dipole and an annular frame) or a folded dipole as a possible promising antenna for non-invasive monitoring of glucose concentration. The near field created by such a probe penetrates into the investigated medium deeper than the field of resonant microstrip antennas. Structurally, the probe differs from the existing microwave analogs in that the probe is more resistant to mechanical stress than analogs on a dielectric substrate. These design features make it possible to reduce the size of the probe without major structural changes and scaling the probe will not affect the radiation power loss in the near field. Previously, the authors have carried out theoretical studies of this near-field probe [18], which showed a sufficient depth of penetration of the signal generated by such probes into biological media and the possibility of using this design for non-invasive measurements, in particular, to measure the concentration of glucose in biological tissues. Theoretical modeling of the interaction of a bidirectional probe with a multilayer structure showed the probe sensitivity of 0.55–0.86 dB/(mmol/L). The layer with dielectric properties of blood with different glucose concentrations was investigated here.The purpose of this work was a more in-depth study and experimental verification of this near-field probe design. The study was carried out for a bidirectional probe and a unidirectional one.

2. Numerical Simulations

2.1. Simulation of a Unidirectional Probe

Earlier in [18], the authors presented and theoretically studied the design of a probe that has significant prospects for creating a device for accurate non-invasive monitoring of glucose levels. We suggested that it would be more expedient to make the probe unidirectional, in order, firstly, to avoid unnecessary radiation, and, secondly, to focus it in order to maximize the signal penetrating into the medium. Based on the design of the microwave probe previously developed by the authors, a numerical simulation of this design was carried out in the case of unidirectional radiation. To do this, we took a metal plate, which we attached to one of the sides of the probe. Since the probe is completely symmetrical, the choice of a particular side is not important. The resulting model is shown in Figure 1. The dimensions correspond to the previously presented probe in [18]. The metal plate had a diameter of 160 mm. The parameter “normal” is selected as the external space, which has the value of dielectric and magnetic permeability equal to 1, which corresponds to vacuum. Figure 1 shows the result of calculating the distribution of the electric field near a unidirectional probe at frequencies of 2 GHz (a) and 10 GHz (b). The graduation of the radiation measurement scale corresponds to the scale shown in Figure 1.
It can be seen from the figures that the probe has an extended field without external radiation backward. The use of a metal plate can increase the penetration depth of the near field. So, if for a bidirectional probe the maximum possible the penetration depth at low frequencies was 18 cm, in the case of a unidirectional probe, the near-field radiation is prolonged to 20 cm with a maximum radiation of 21.2 V/m. The electric field strength was taken into account at a frequency of 2 GHz this frequency was chosen based on the calculation of the minimum value when choosing the 2–10 GHz range. As the frequency increases, the near-field diverges in three directions, while the central near-field radiation still has a prolonged form in comparison with the bidirectional probe. It can also be seen that at high frequencies the electric field decays faster, which can be related to both the wavelength and the design of the probe.
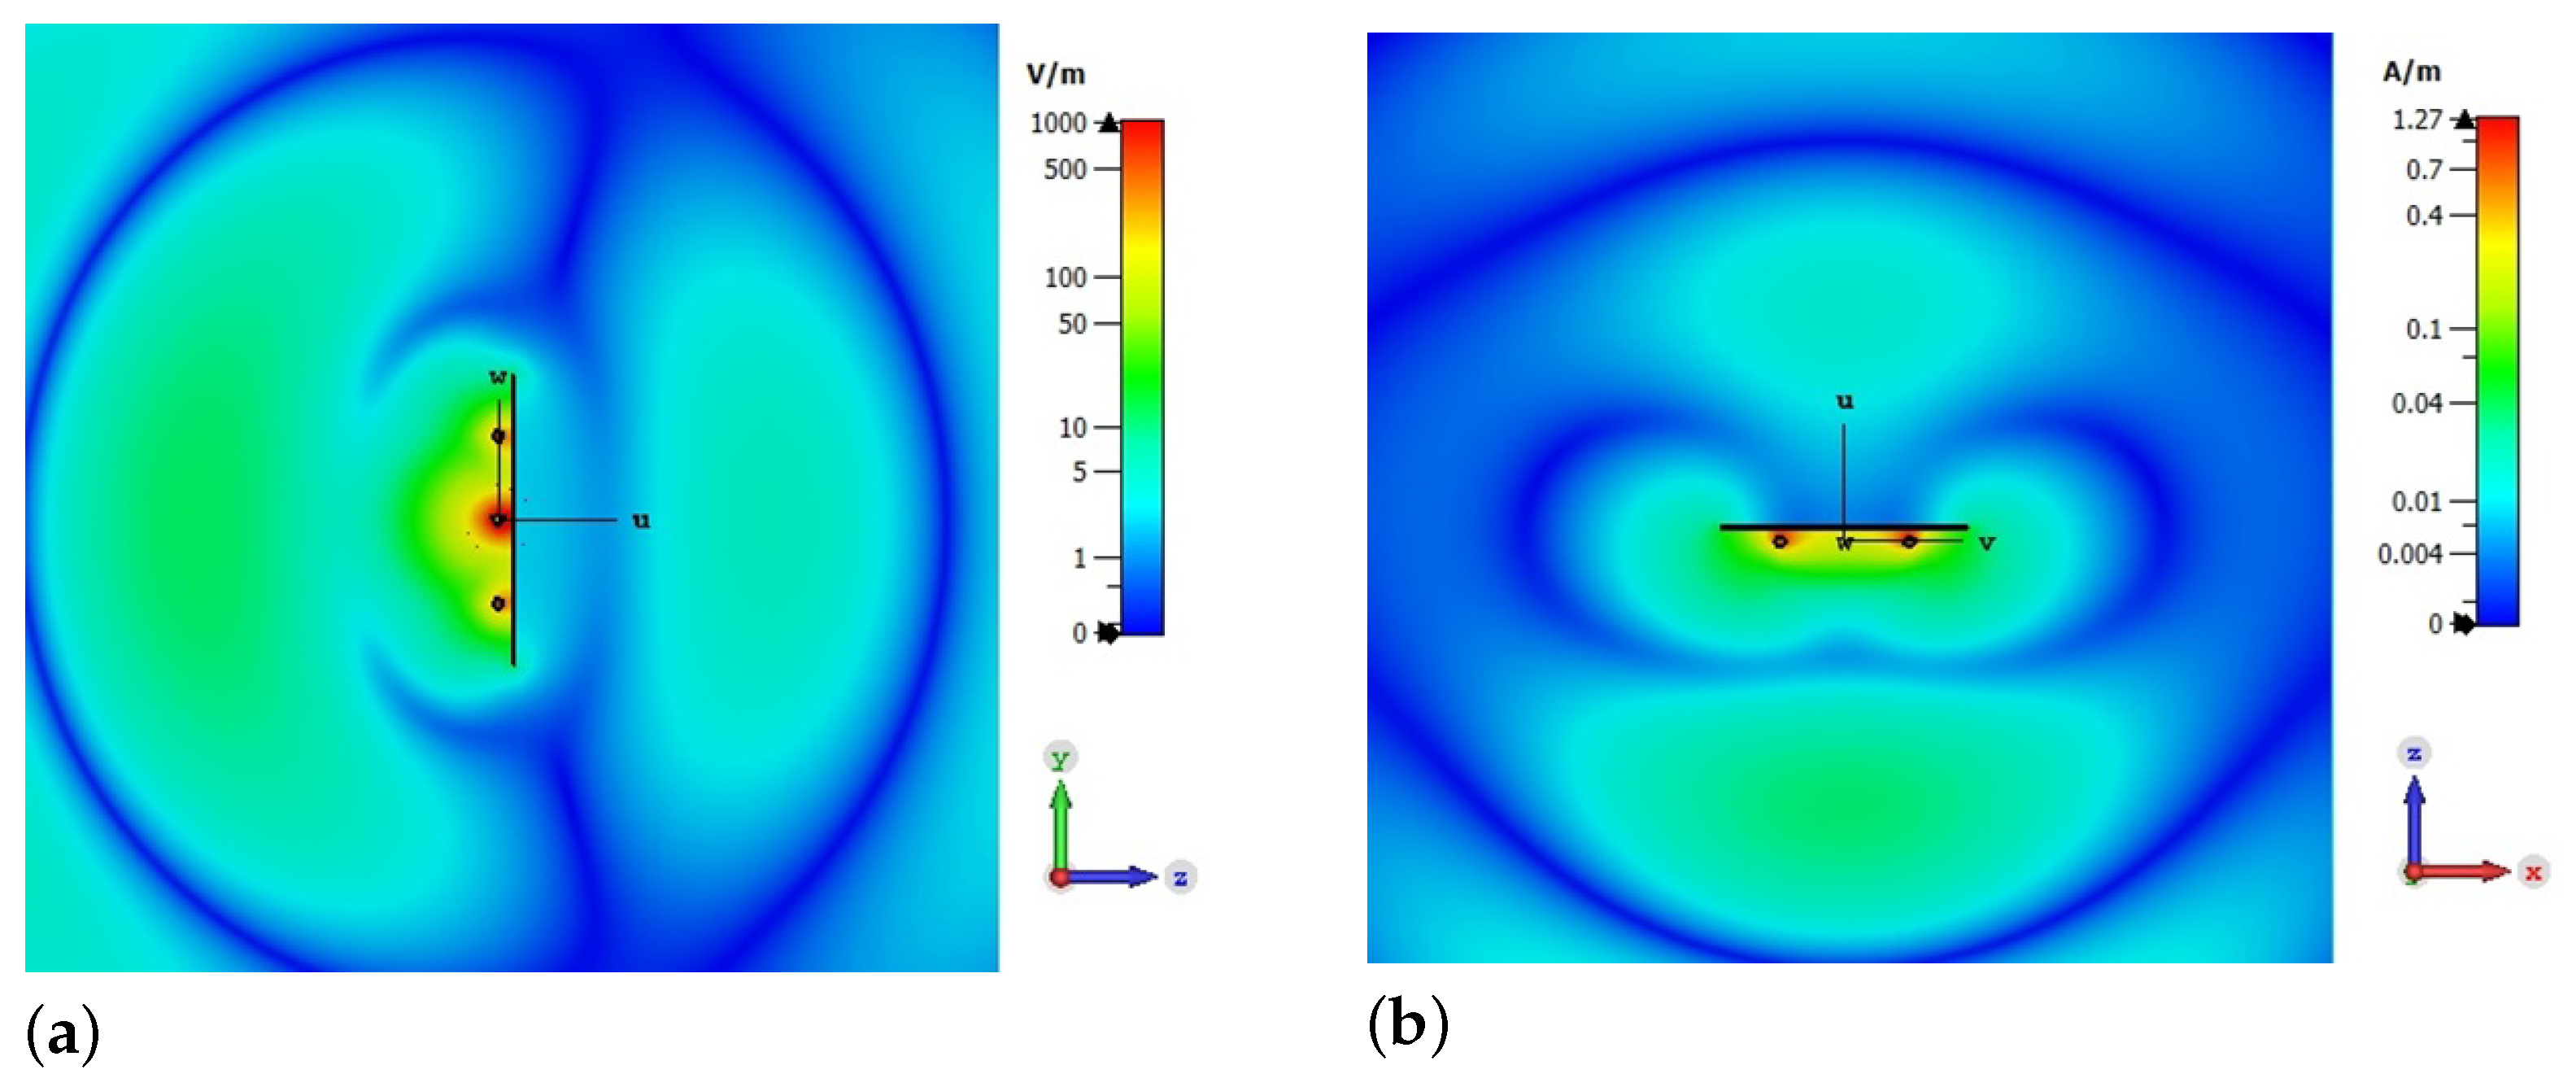
Figure 2 shows the result of calculating the distribution of the electric field and magnetic field near the radiator. According to the calculation for this configuration, the maximum possible length of the near-field reactive field at low frequencies is 18 cm, as in the bidirectional case.
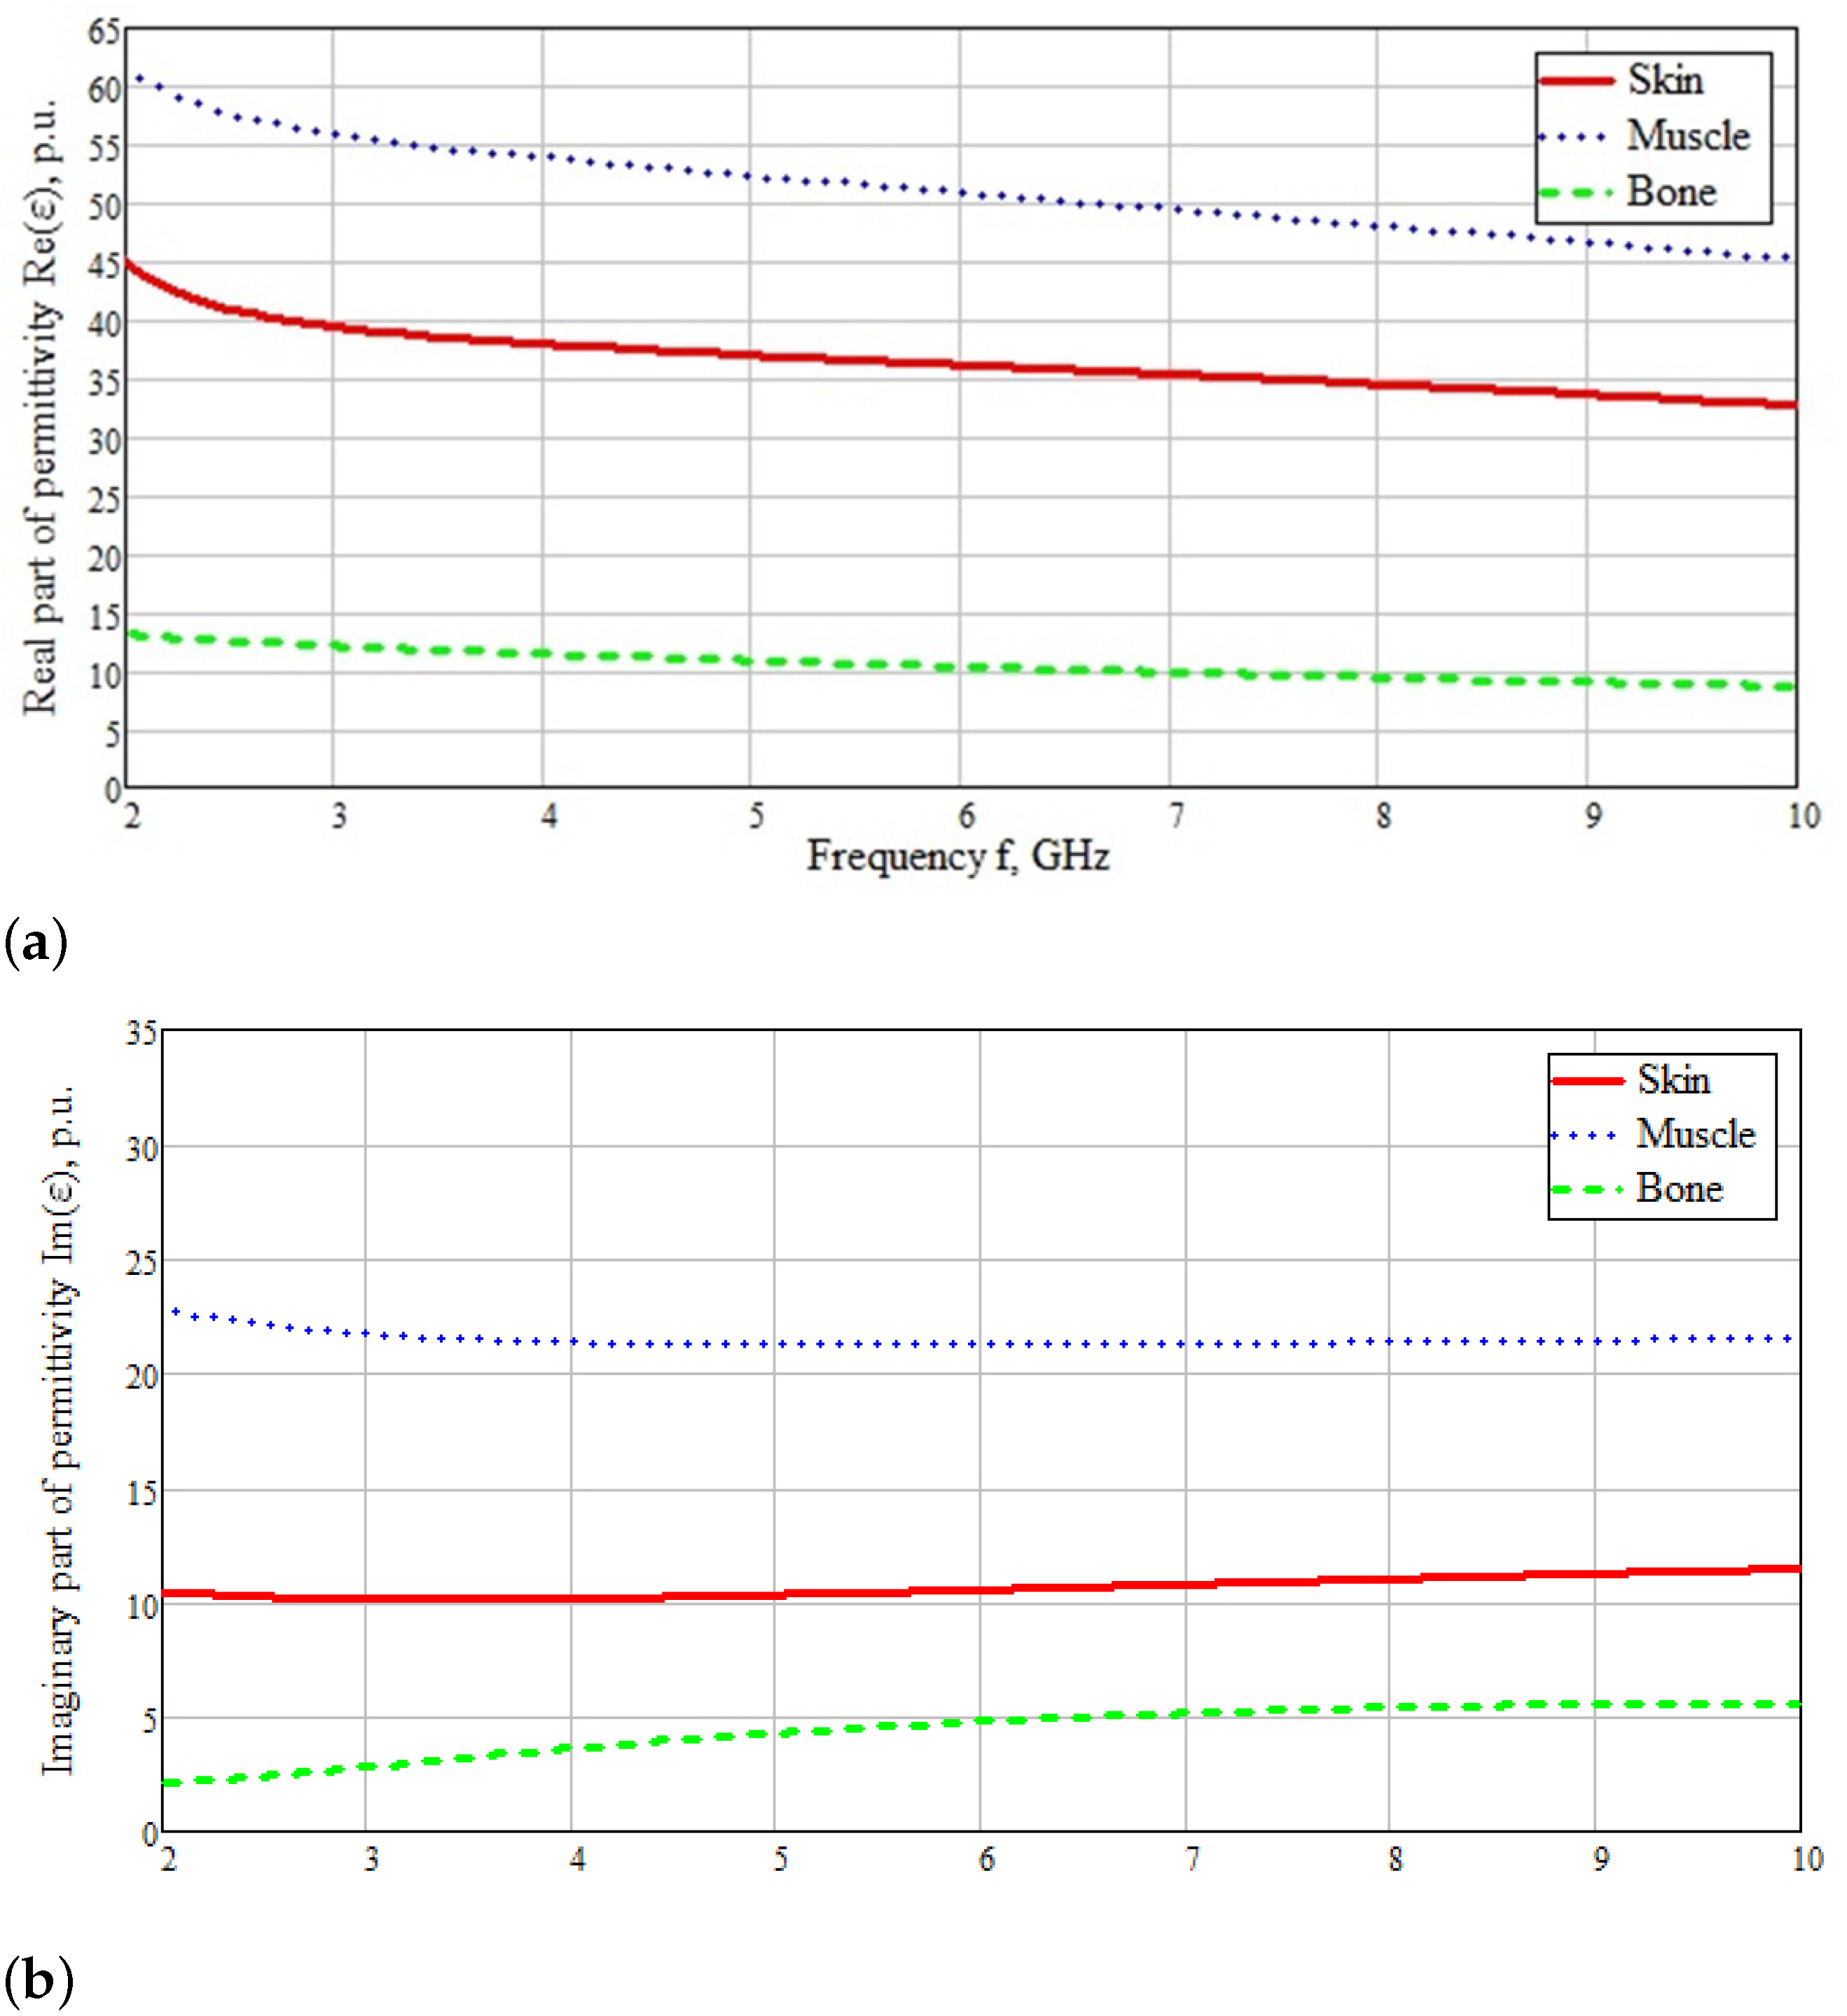
Next, it was necessary to simulate the interaction of this probe with the environment for further comparison of the sensors. As which was considered a flat-layered structure consisting of: skin, fat, blood, muscle and bone. The thickness of the layers was as follows: skin—1 mm, fat—0.5 mm, blood—2.5 mm, muscles—15 mm, bone—10 mm. These thicknesses are due to previous research. To calculate the dielectric parameters, the formula given in the article was used [19]. The formula is:
ε ( ω ) = ε + n Δ ε n 1 + ( j ω τ n ) 1 α n + σ i j ω ε 0
where, ε , ε -are the “static” and “infinite frequency” of the dielectric permittivity, ω is the angular frequency, τ is the time constant, α is the exponent parameter takes values from 0 to 1, ε ( ω ) is the complex dielectric permittivity.
The values for each of the layers of the simulated flat-layered structure are shown in Table 1 for each of the materials.
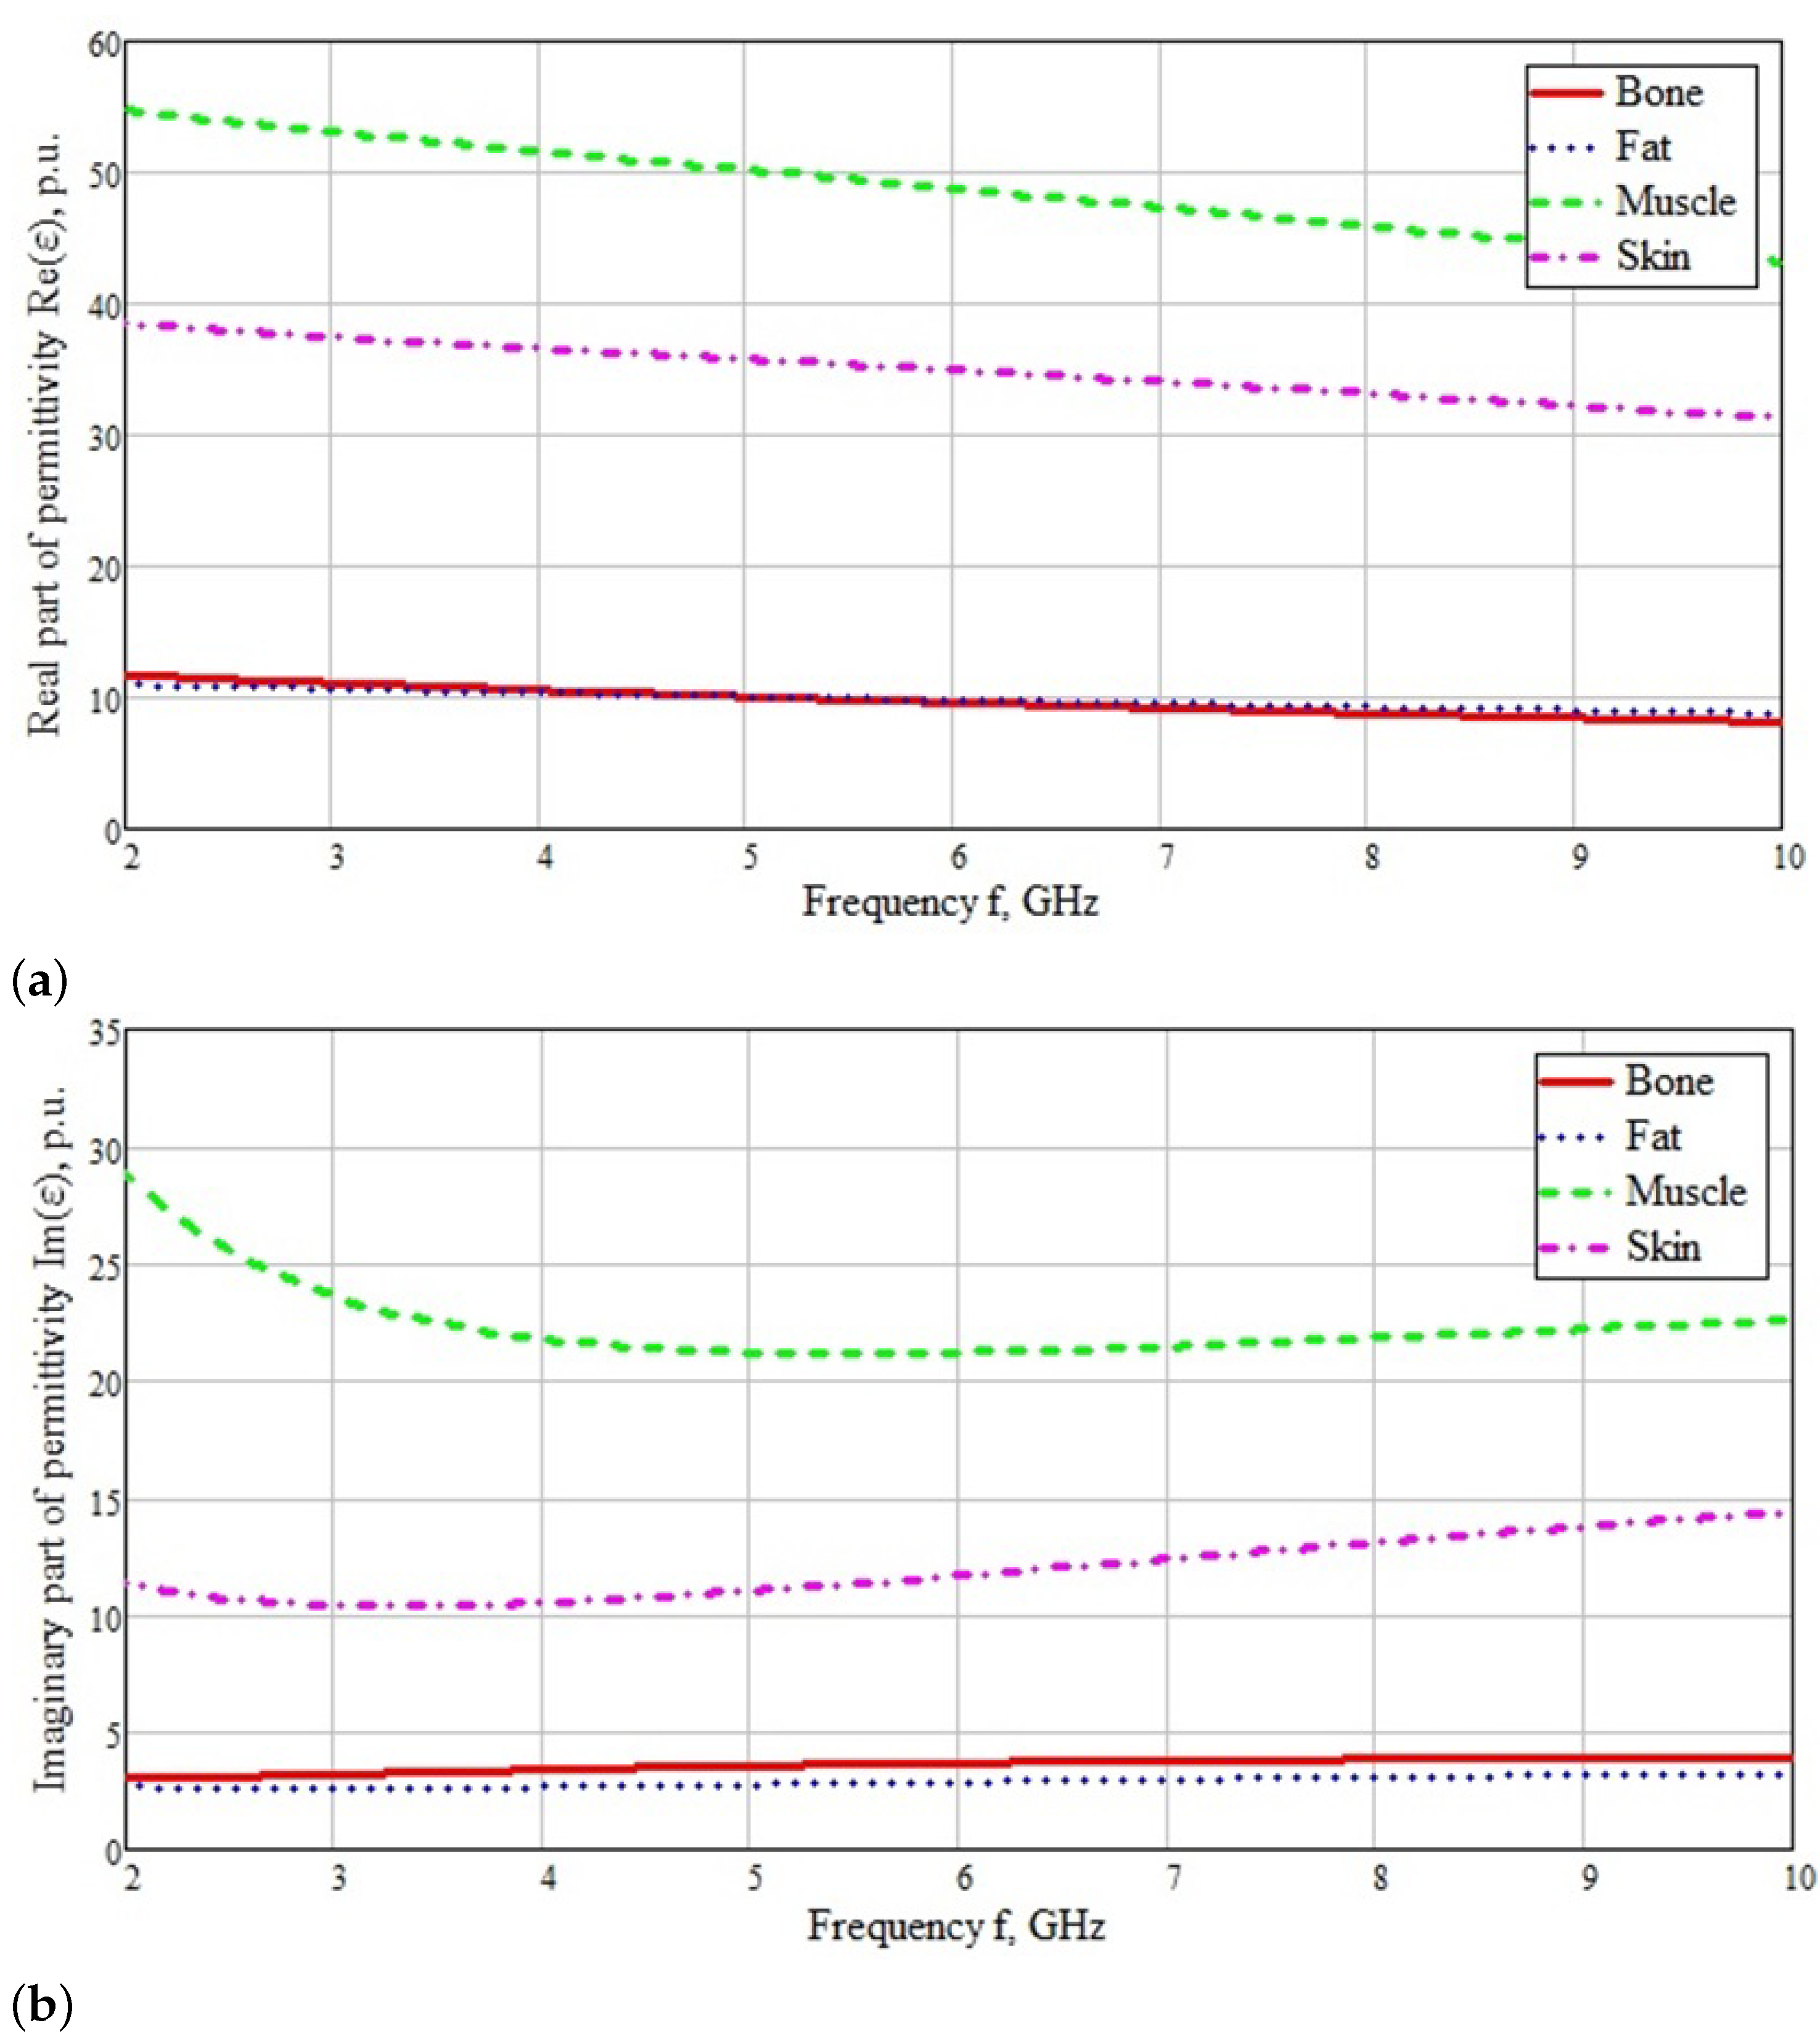
According to the above values, the dependence of the real (Figure 3a) and imaginary (Figure 3b) parts of the relative permittivity was plotted at frequencies of 2–10 GHz.
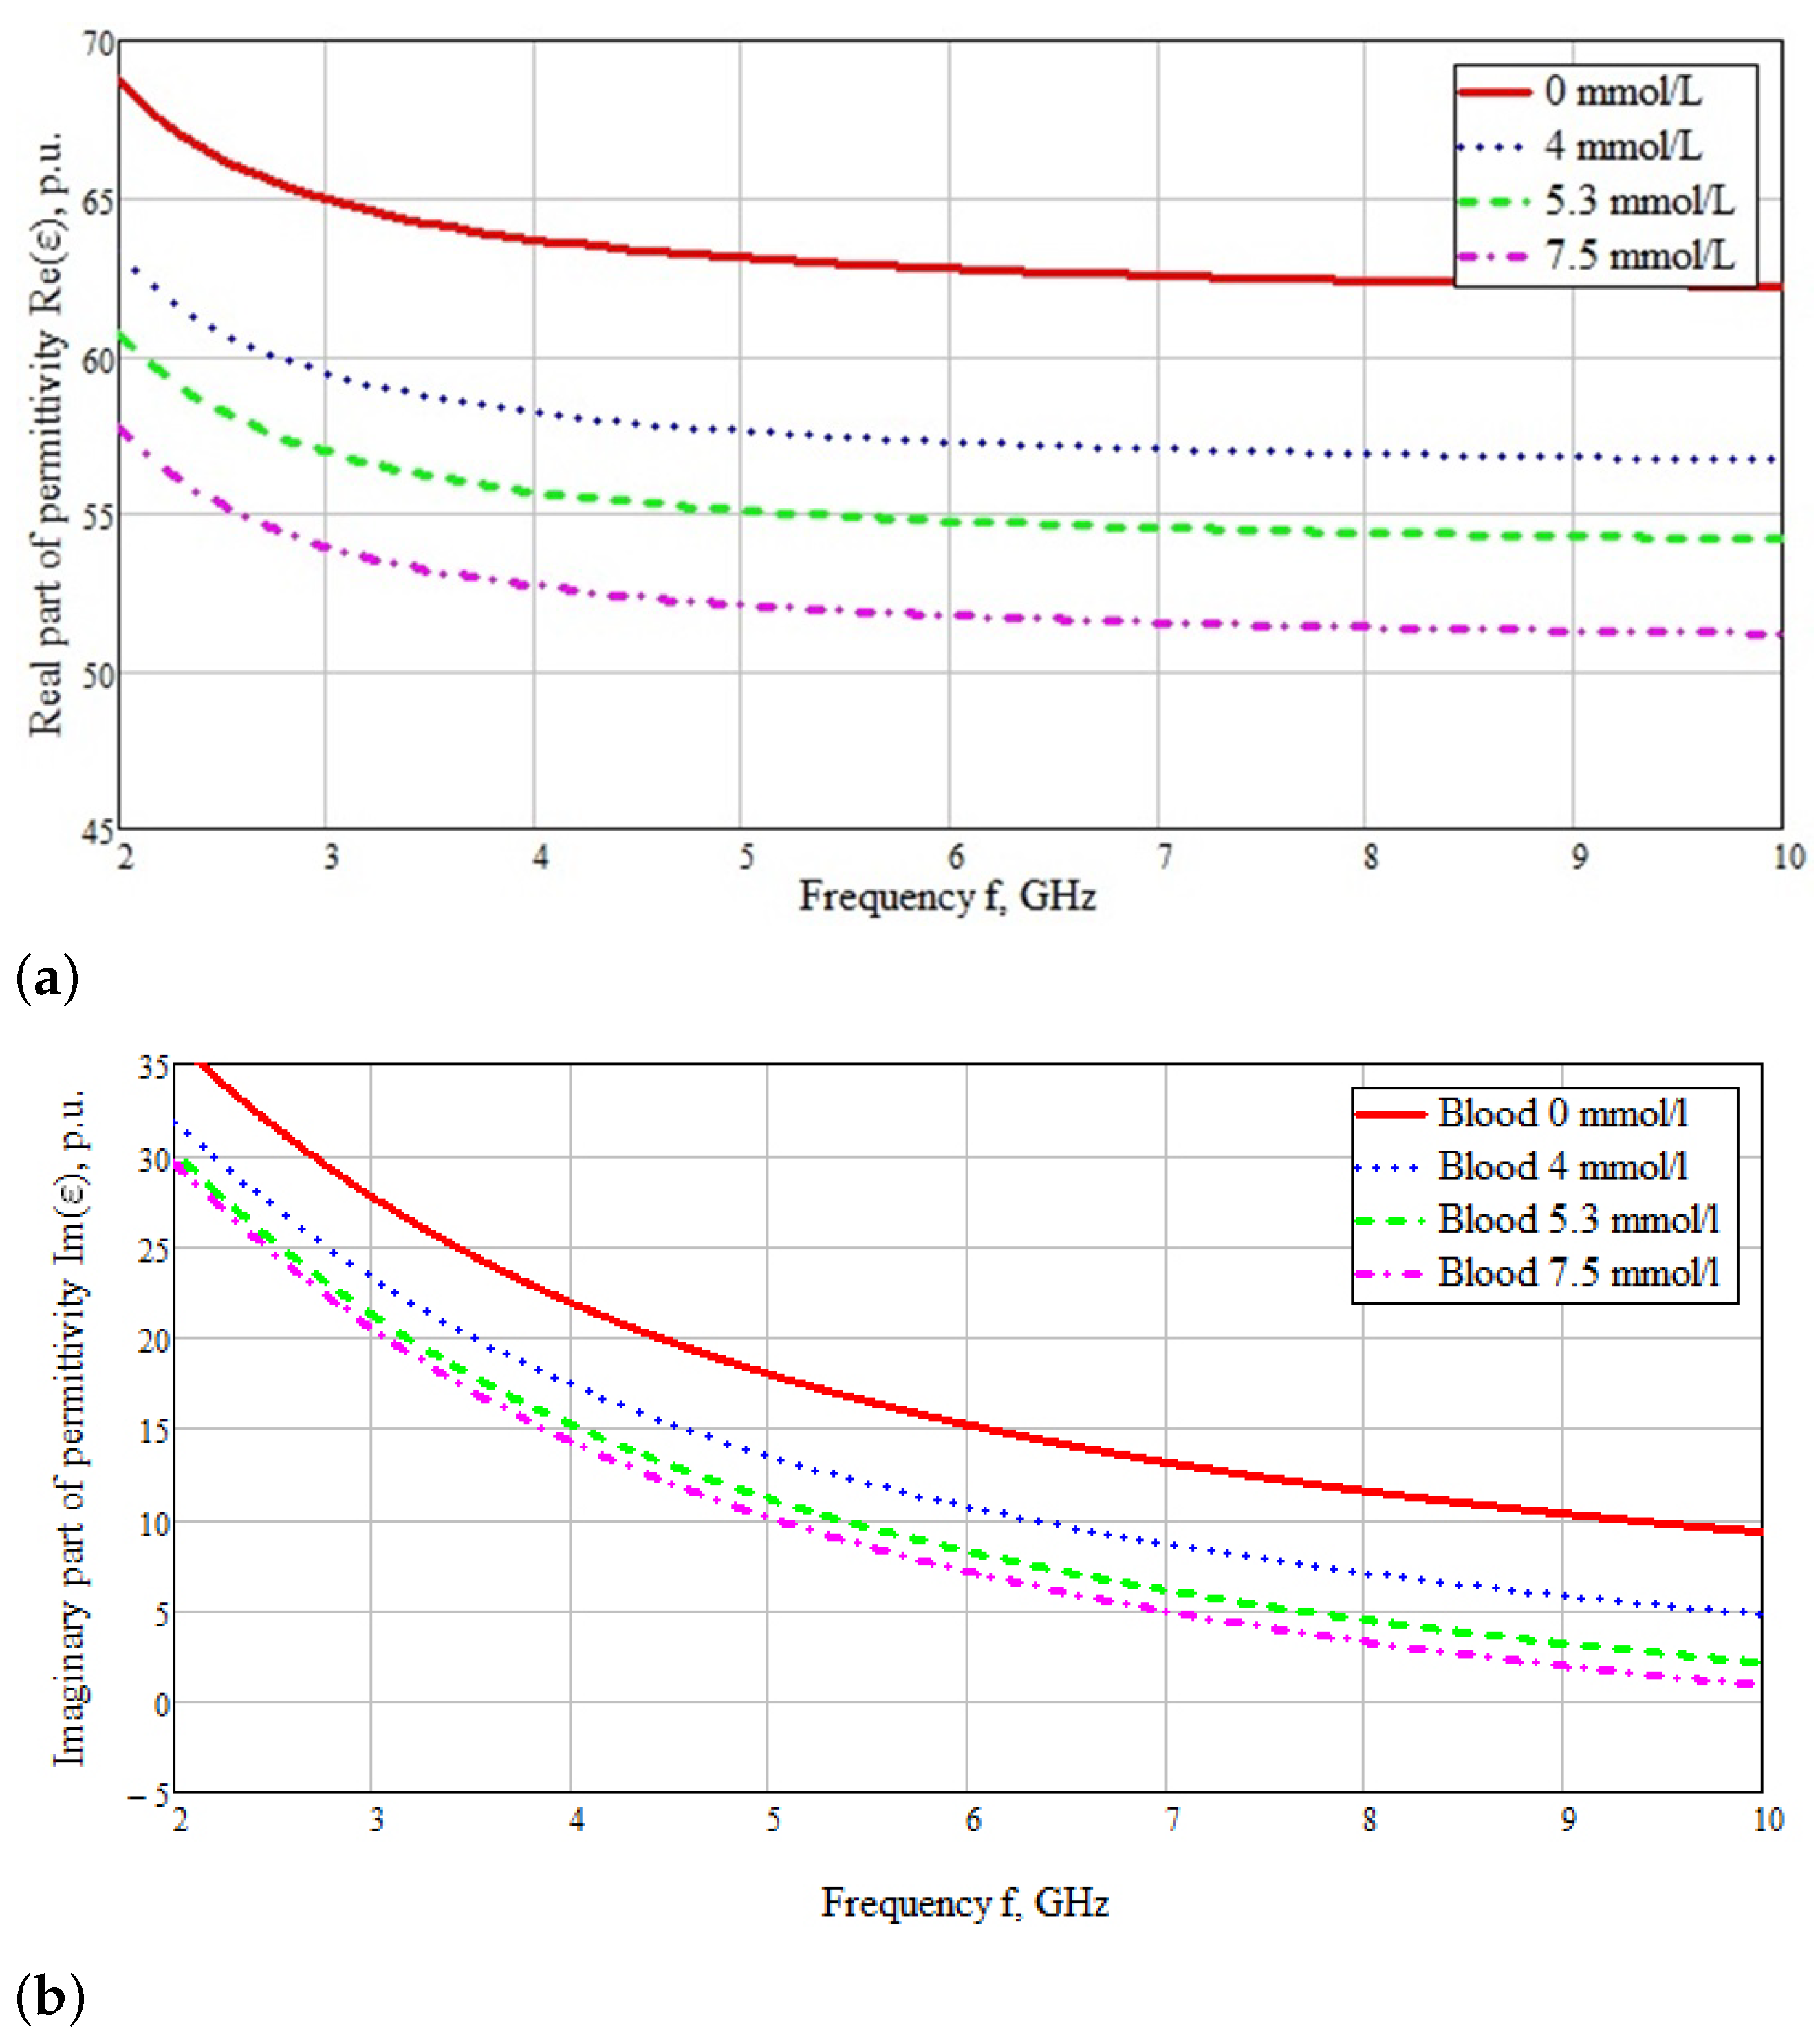
The glucose concentration values were taken as follows: 0, 4, 5.3, 7.5 mmol/L. As in the previous study, to calculate the relative permittivity, we use the data obtained by Benjamin Freer and Jayanti Venkataraman from Department of Electrical and Microelectronic Engineering Rochester Institute of Technology [20], which is based on a modified Cole-Cole equation:
ε ( ω ) = R e ε + m 1 2 Δ ε m 1 + ( j ω τ m ) 1 α m ( 0.001445 ) g + 1.145882 + I m ε + m 1 2 Δ ε m 1 + ( j ω τ m ) 1 α m + σ i j ω ε 0
where, ε , ε - are the “static” and “infinite frequency” of the dielectric permittivity, ω is the angular frequency, τ is the time constant, α is the exponent parameter takes values from 0 to 1, ε ( ω ) is the complex dielectric permittivity, g—blood glucose concentration in mg/dL
The data obtained are presented in the form of graphs of the dependences of the real and imaginary parts of glucose permittivity on the frequency in Figure 4.
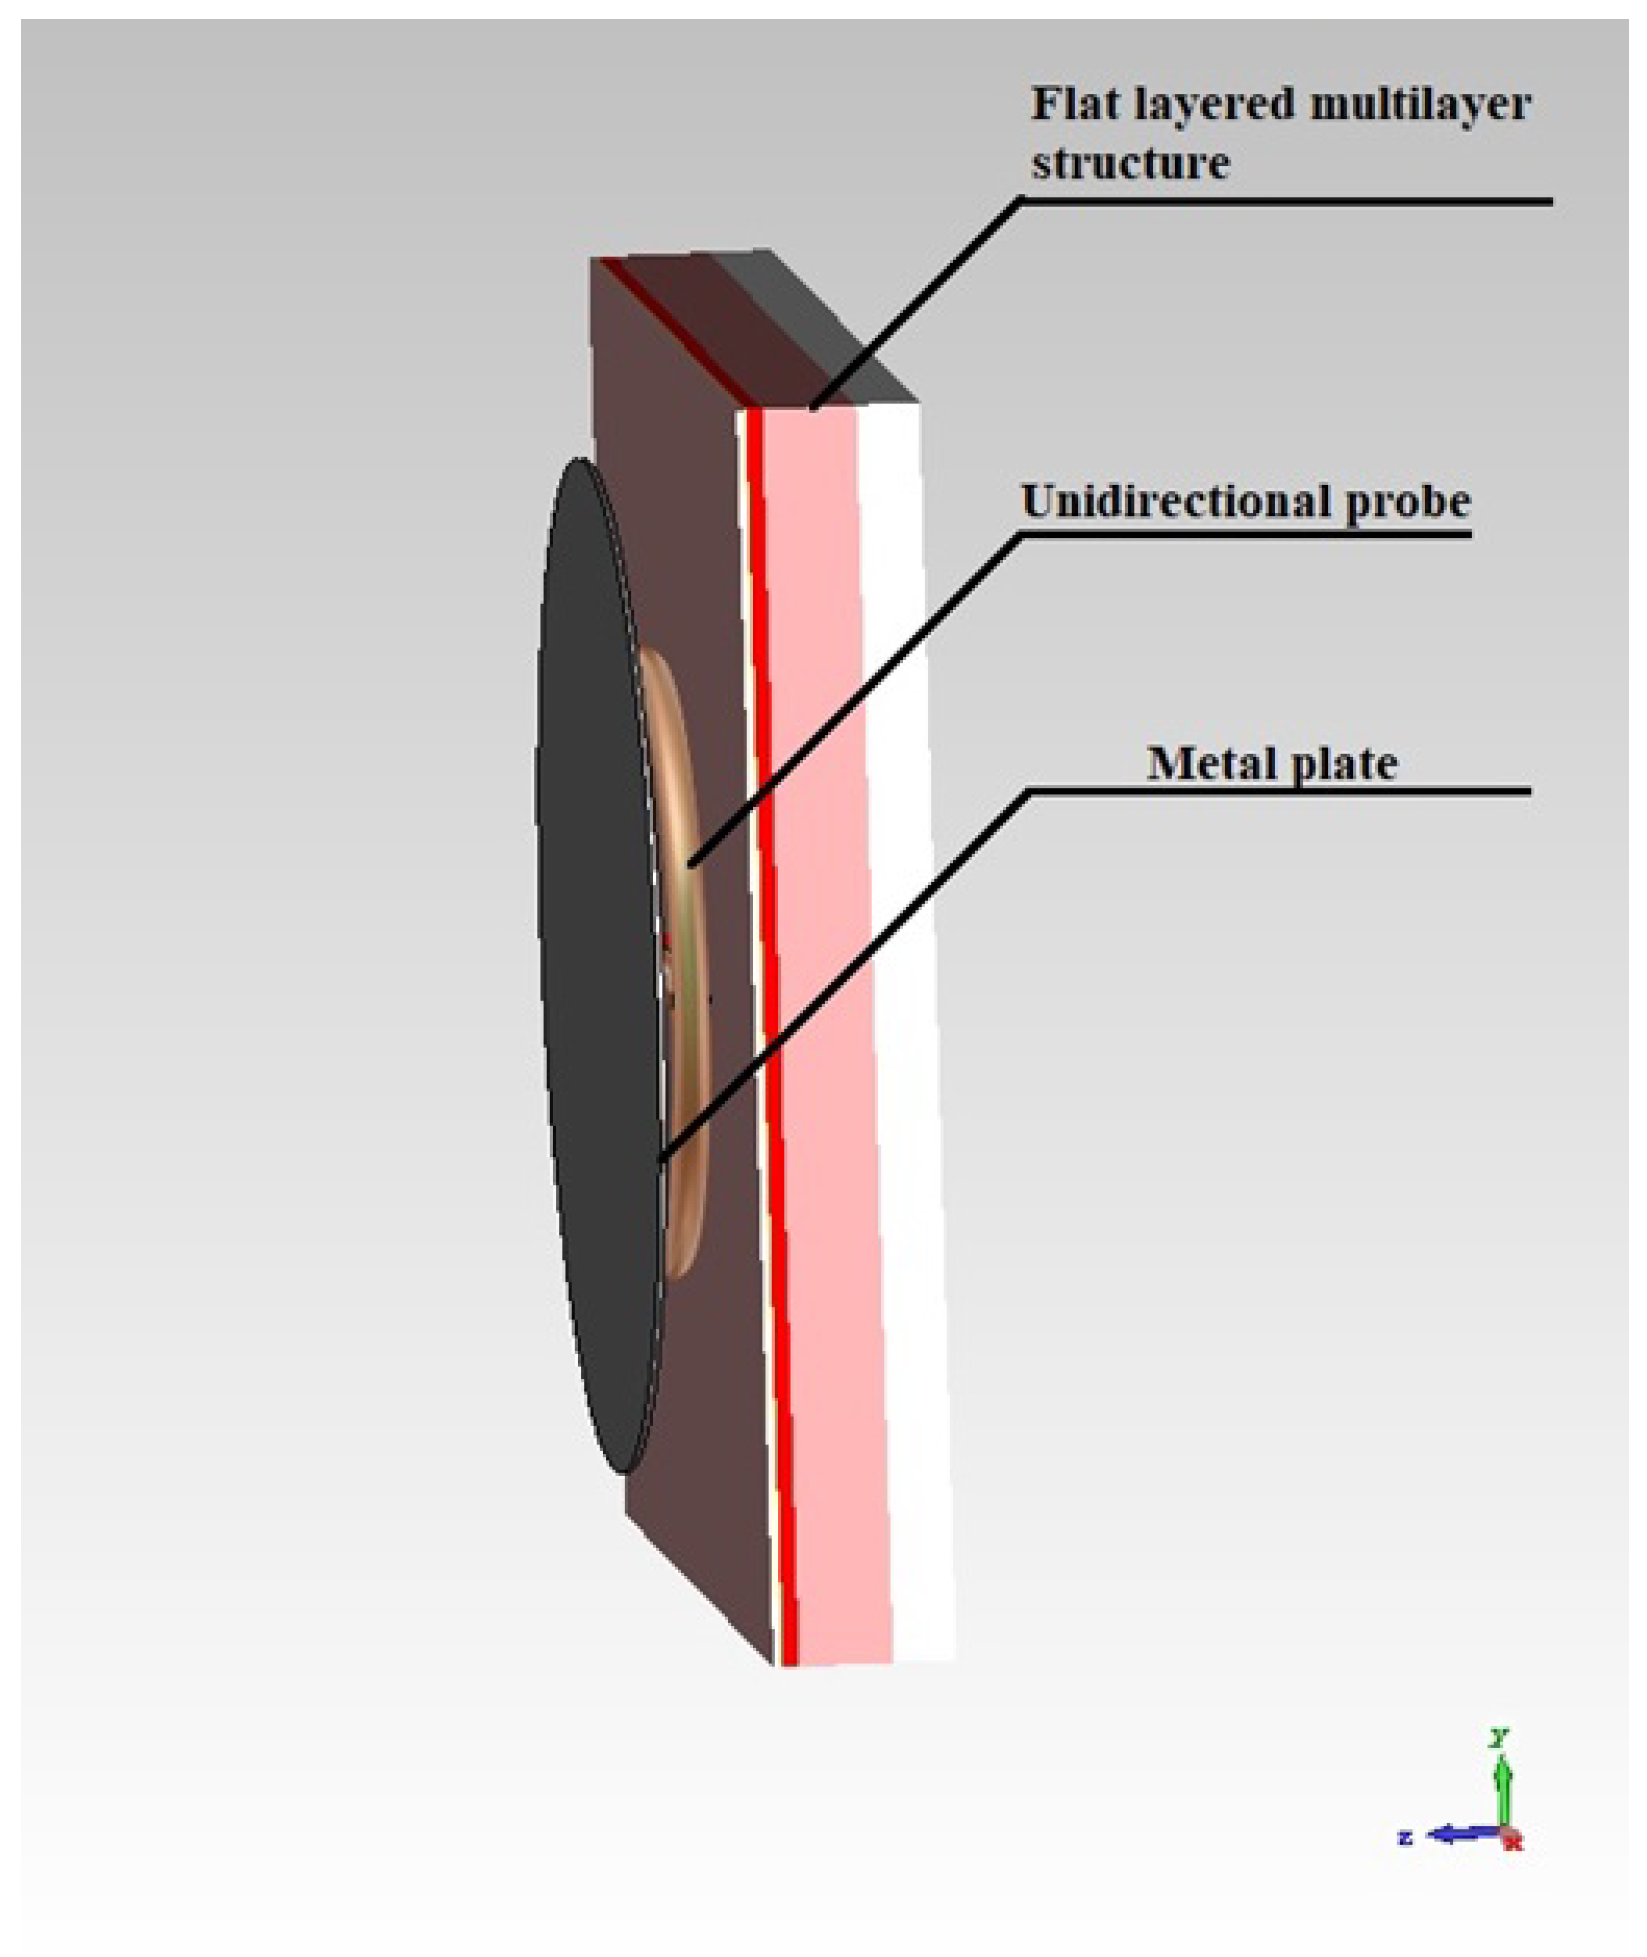
The general scheme of the numerical simulation is shown in Figure 5. The figure shows a flat-layered multilayer structure consisting of the biological tissues described above, as well as a unidirectional probe. The probe is located at a distance of 1 mm from the flat layered medium as in the previous study [18].
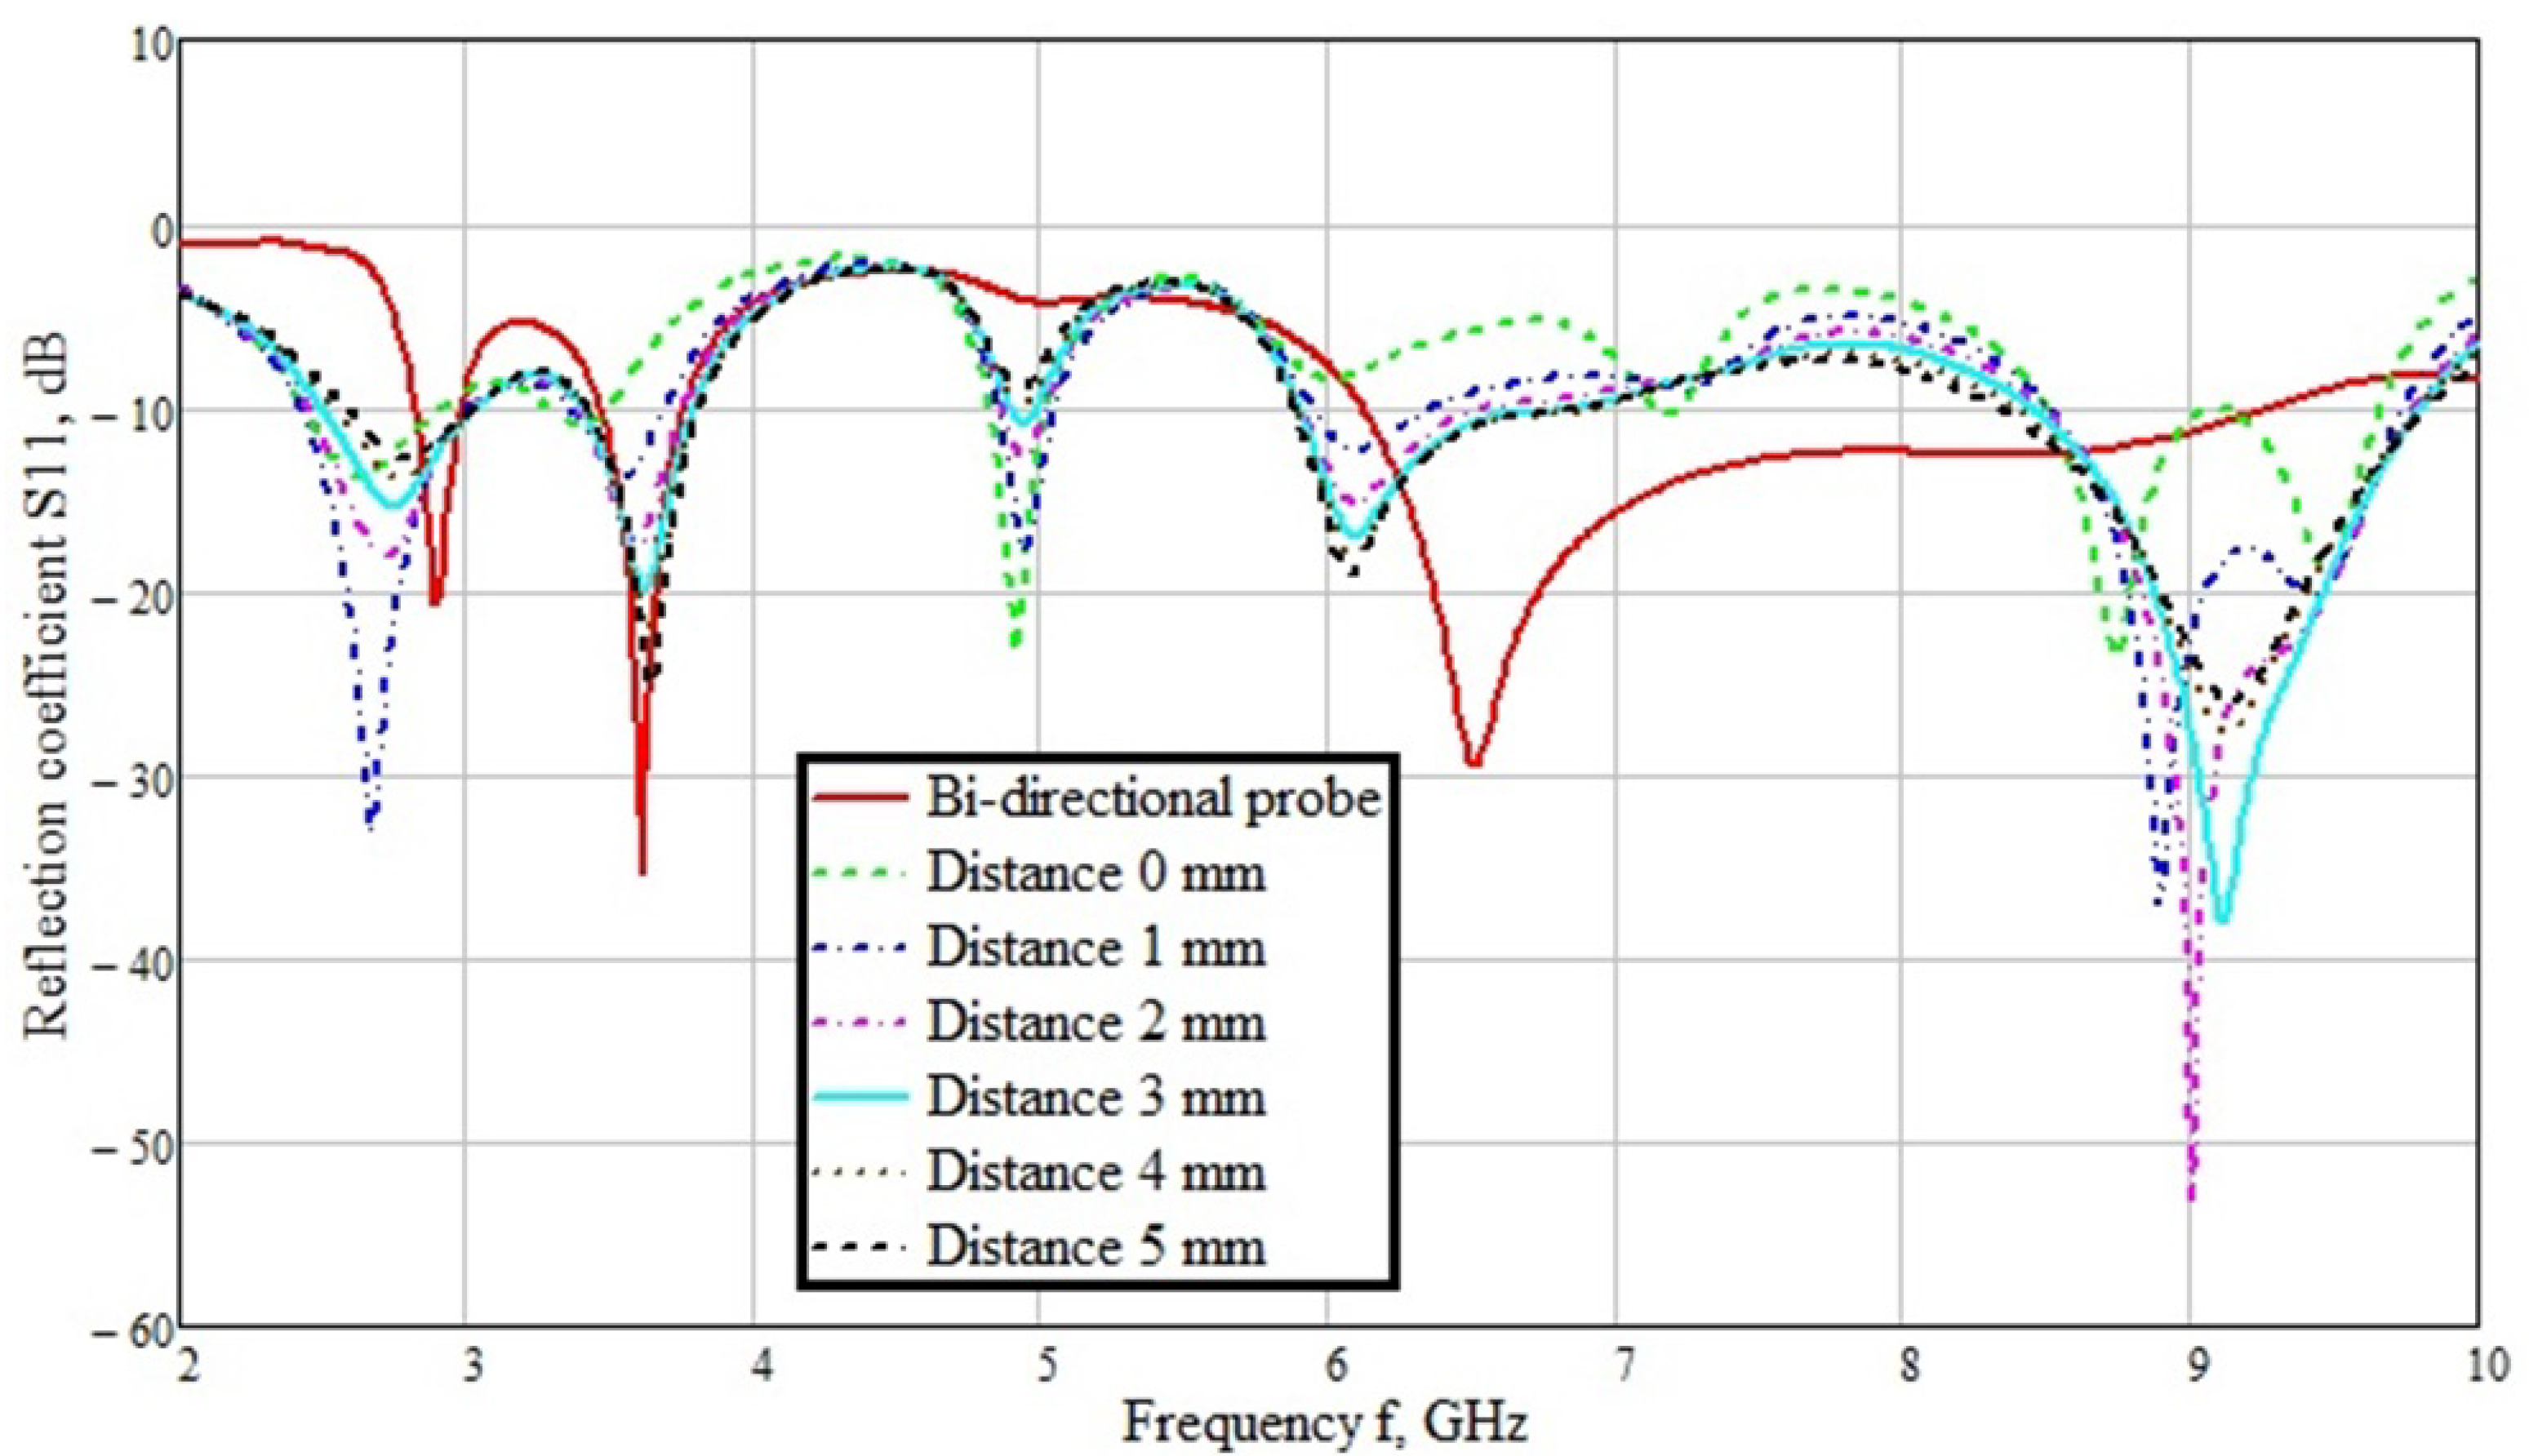
Detailed studies have been carried out on the optimal distance to place the metal plate. The main task in the selection of the distance was to obtain resonant sections of the reflected signal at low frequencies. This approach will allow to accurately determine changes in the concentration of glucose in the blood. The distance between the probe and the metal plate was changed by the fitting method by 1 mm from the probe in the range of 0–5 mm. The best results are shown in Figure 6. Simulations were performed in the frequency range 2–10 GHz. In numerical simulation, the probe was fed by a discrete port representing an impedance element (50 Ohm).
Figure 6 shows the values of the reflected signal of an unidirectional probe and a bidirectional probe (red line) for clarity. As can be seen from the graphs, the reflected signals change significantly. Apart from the resonance at 3.6 GHz the similarity of these values is observed. The reflected signal at 2.6 GHz is similar to the bidirectional transmitter at 2.9 GHz.
Comparing the values obtained for different distances of the metal plate from the probe, it was concluded that the best among the presented results is the distance of 1 mm. At this distance, we got two resonances at a low frequency of 2.6 GHz and a high frequency of 9 GHz. Increasing the distance further reduces resonance at low frequencies, while increasing values at high frequencies. Further modeling was carried out taking into account the measurements made above and the selected distance of the metal plate from the probe of 1 mm.
It can be seen, however, that the reflected signal at 3.6 GHz remains unchanged. This fact is explained by the resonance at the inner diameter of the probe, which is 90 mm, which, when converted to frequency, gives 3.5 GHz. Because of this, a resonance occurs at the same frequency when the distance of the metal plate from the probe changes, but even in this case, small shifts of the resonance in frequency occur.
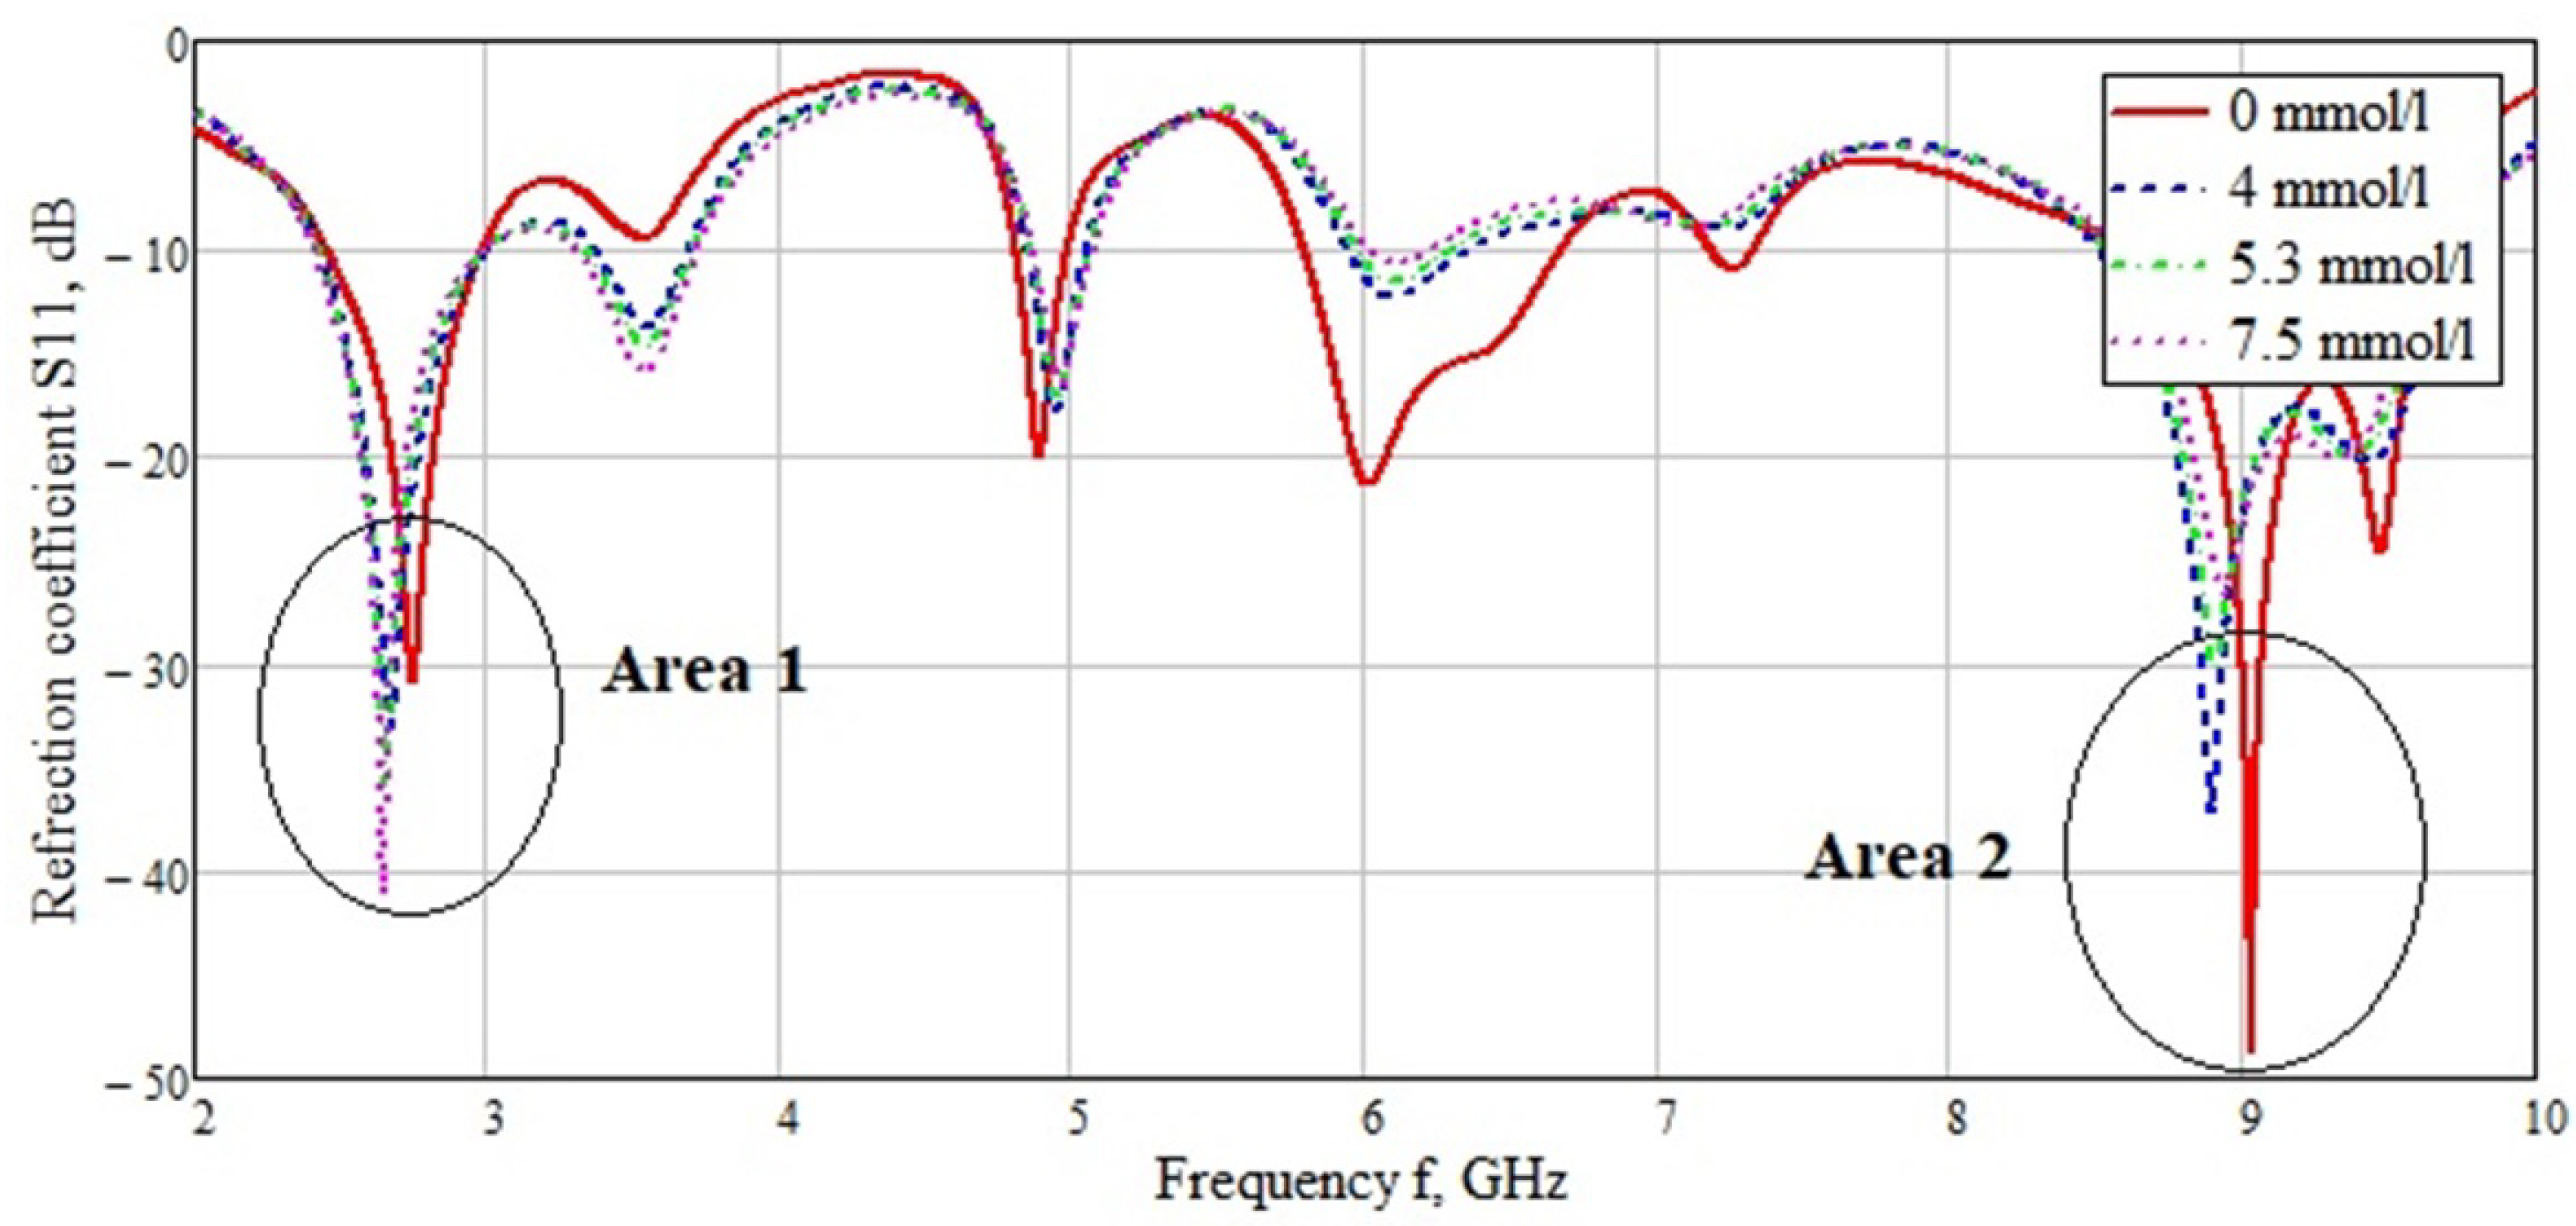
Determination of the sensitivity of the unidirectional probe was carried out by changing the layer with the dielectric properties of the blood at various glucose concentrations (0, 4, 5.3, 7.5 mmol/L). The resulting reflected signal data is shown in Figure 7.
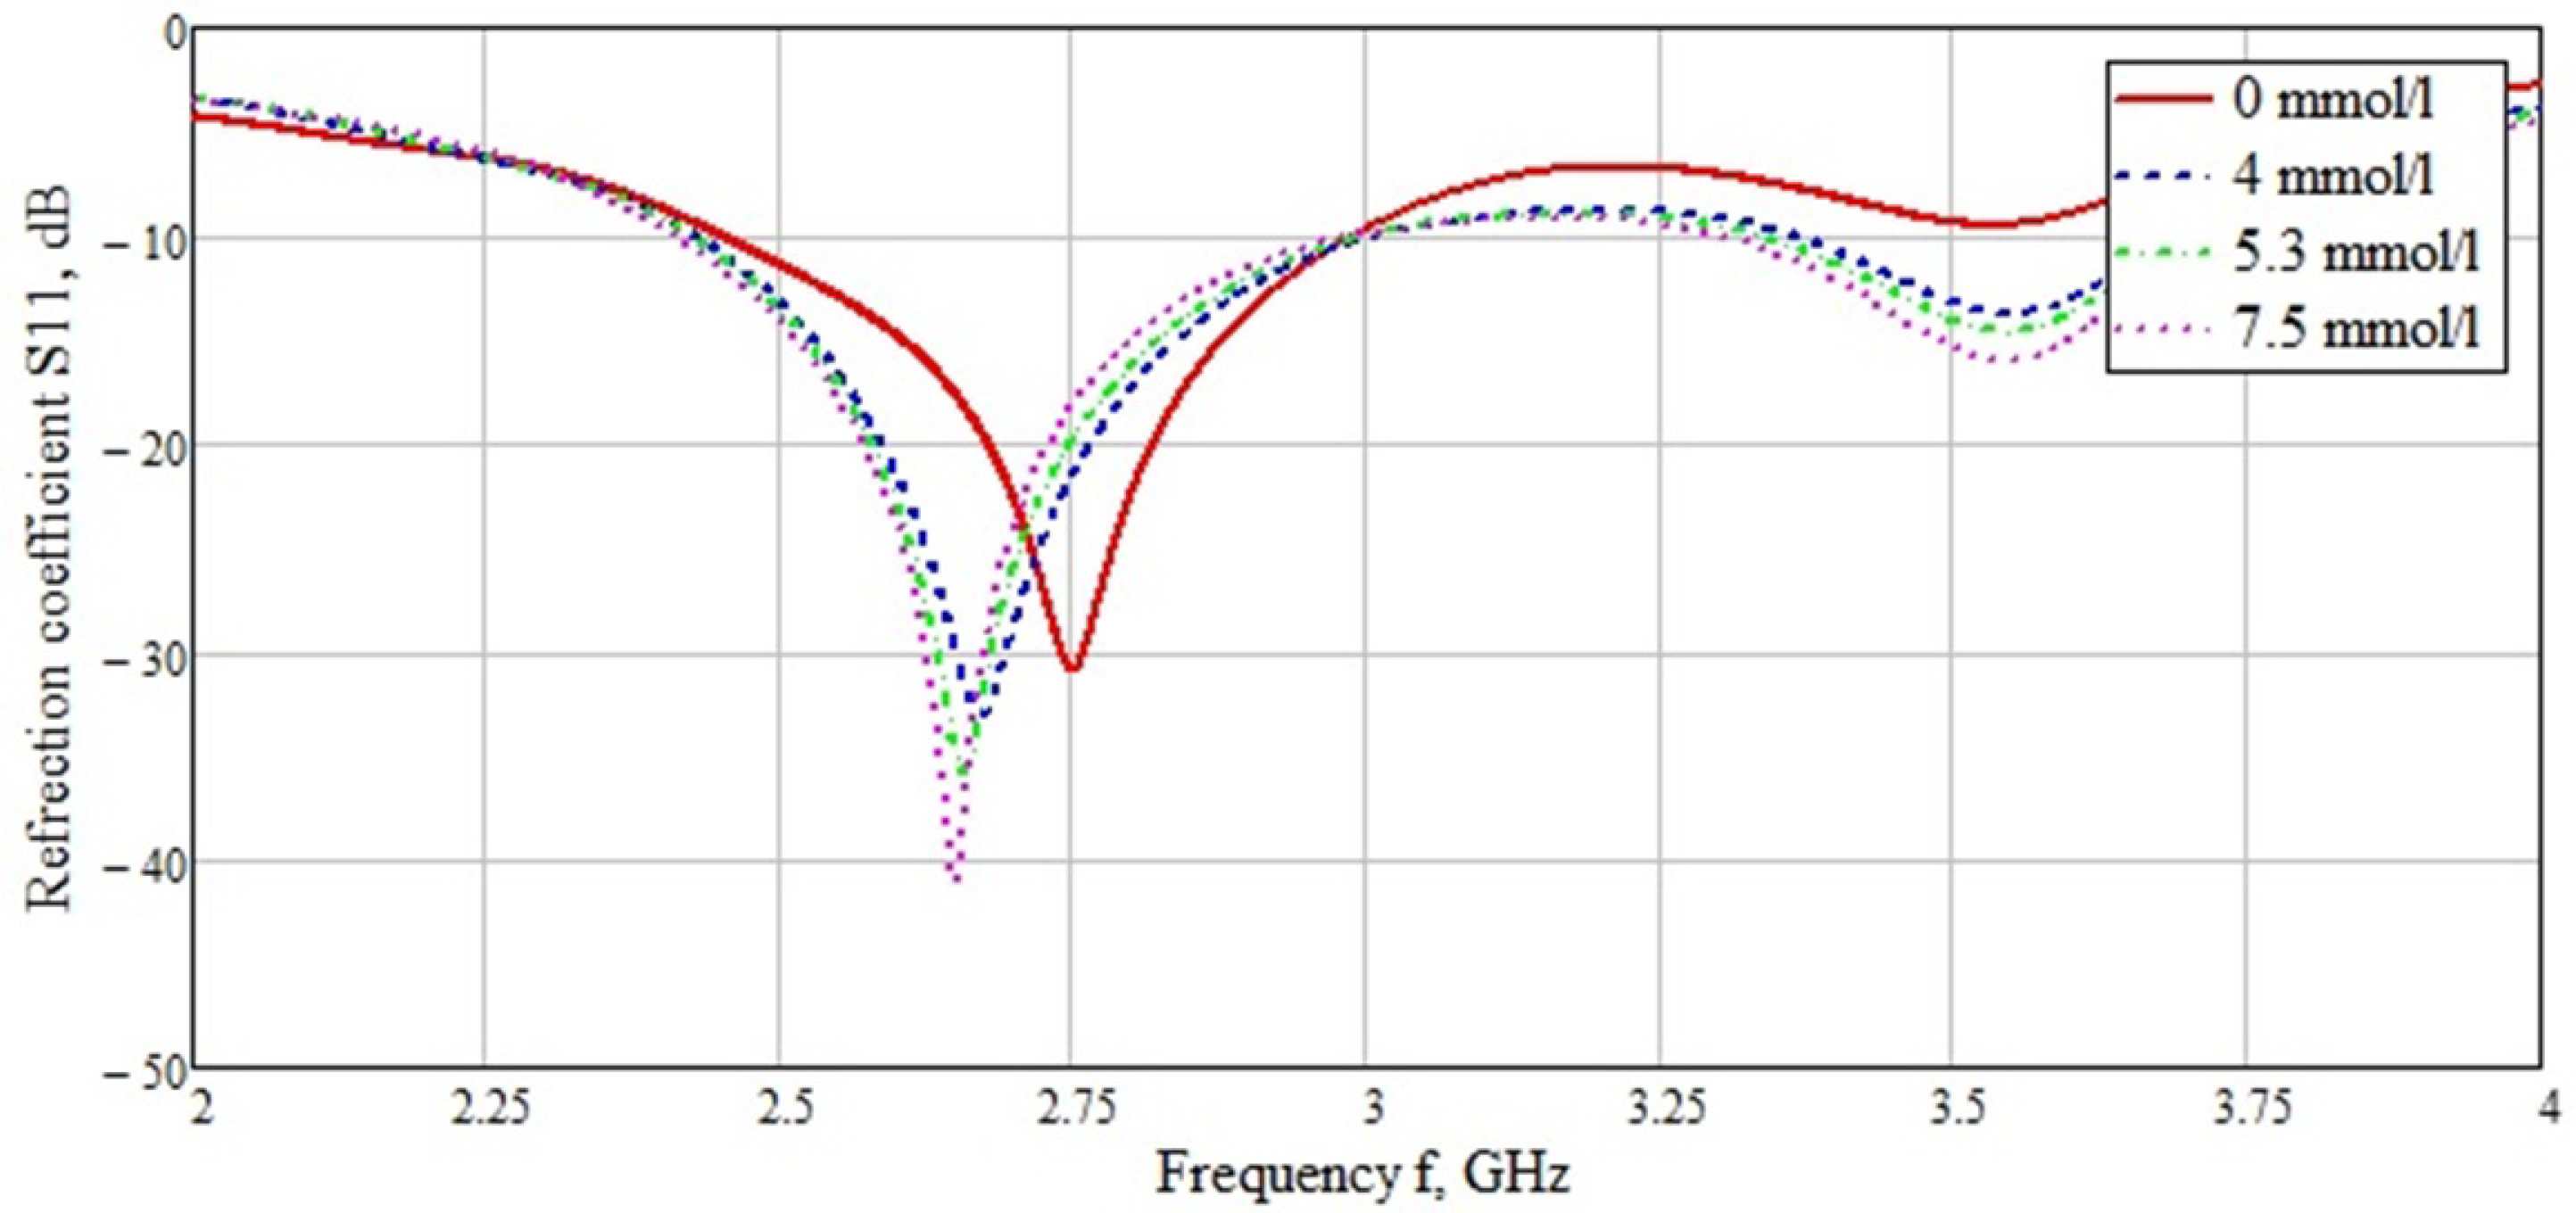
Two resonance peaks can be observed in the graphs (Figure 7) at 2.65 GHz and 8.9 GHz. The values for the reflected signal at a glucose concentration of 0 mmol/L are maximally knocked out at the second peak in region 2, therefore further research was focused on the frequency range 2–4 GHz for region 1. Figure 8 is a graph enlarged in scale for region 1.
It can be observed that when the glucose concentration changes, the reflected signal changes both in amplitude and in frequency. So the values of the amplitude of the reflected signal were: 0 mmol/L- 30.819 dB, 4 mmol/L- 33.073 dB, 5.3 mmol/L- 35.762 dB, 7.5 mmol/L- 41.094 dB. Thus, the sensitivity of the probe is 1.5–2.7 dB/(mmol/L). The frequency values for each of the concentrations were: 0 mmol/L- 2.75 GHz, 4 mmol/L- 2.67 GHz, 5.3 mmol/L- 2.66 GHz, 7.5 mmol/L- 2.65 GHz. The frequency sensitivity of the probe was 5–7 MHz/(mmol/L). For the frequency shift of the reflected signal, it is possible to distinguish to regions: first one, from 0 to 4 mmol/L with a shift of 20 MHz /mmol/L, second one, from 4 to 8 mmol/L with a shift of 5 MHz /mmol/L. The obtained simulation results indicate a high sensitivity of the probe. Also, in addition to amplitude changes, frequency changes were also observed for each concentration. Studies of blood glucose levels in two parameters significantly increase the accuracy of the data obtained.
We also considered the VSWR values for this frequency range at a concentration value of 4 mmol/L. The results are shown in Figure 9. As can be seen from the graph, the values do not exceed 3 rel. units on the VSWR scale over the entire considered range.
Further, before conducting an experimental study, it was necessary to create a physical model of the biological environment (phantom) with the most approximate electrophysical values calculated in numerical modeling for each material (layer).

2.2. Creation of a Flat-Layered Biological Environment in the Form of a Human Forearm Phantom

For creating the flat-layered structure of the biological medium with dielectric values close to the values calculated in the numerical model, a number of articles were considered with different approaches to make a phantom. One of the most common methods for making a phantom of a biological environment is based on gelatin, deionized water, sunflower oil and dishwashing liquid [21,22,23]. The method described in [24], based on the use of graphite, polyurethane and acetone, proved to be the most suitable. The use of graphite makes it possible to more accurately recreate the dielectric properties of biological tissue. Due to the high value of the relative permittivity for the layers being created, the resulting phantom structure is more durable, less susceptible to external influences. Table 2 shows the values for each of the layers.
Each of the layers was made separately, in accordance with the data in Table 2. In this case, it was decided to neglect the fat layer due to its low relative permittivity and extremely small thickness (0.5 mm). The properties of each of the layers obtained were checked on a special installation [25].
Based on the results of measurements of the dielectric properties of the obtained layers on this installation, graphs of the dependences of the real and imaginary parts of the relative permittivity of the layers on the frequency were built (Figure 10).The obtained electrophysical properties of the experimentally created layers are very close to the values calculated mathematically during modeling. The difference lies in the more linear plots for the experimentally created layers. Then they were selected for further experimental studies of two probes.
Flat blood materials with glucose values of 0, 4, 5.3, 7.5 mmol/L were also measured separately. The results are shown in Figure 11.
For blood, one can notice a high similarity in the obtained values of the real part of the relative permittivity for various glucose concentrations in the case of theoretical modeling and the created layers of biological tissue (Figure 4). The values of the relative permittivity for the theoretical graphs and those obtained by measuring the phantoms are different, but the values between the different concentrations coincide with the theoretical ones. In the case of the imaginary part of the relative permittivity, the behavior of the curves is similar to the theoretical ones, but the experimental data are larger by about 5 relative units in their values.

3. Experiments and Results

3.1. Unidirectional Probe

To confirm the simulation and experimental verification, a near-field probe was made. A copper tube with a diameter of 6 mm was taken as a basis. The diameter of the probe itself was 100 mm (in accordance with the dimensions described in [18]). Figure 12 (left) shows a photograph of the manufactured probe in the form of a loop vibrator. The probe was powered from the input of a symmetrical dipole.
To take S-parameters, we used a PNA-L NetworkAnalyzer vector network analyzer from Agilent Technologies, which has a frequency band of 0.01–40 GHz. This equipment allows high speed measurements (4 to 9 μ s per point) and accuracy. The manufactured installation is shown in Figure 12 (right). A metal circle 2 mm thick and 160 mm in diameter was used as a reflective plate, which corresponds to the dimensions in the simulation.
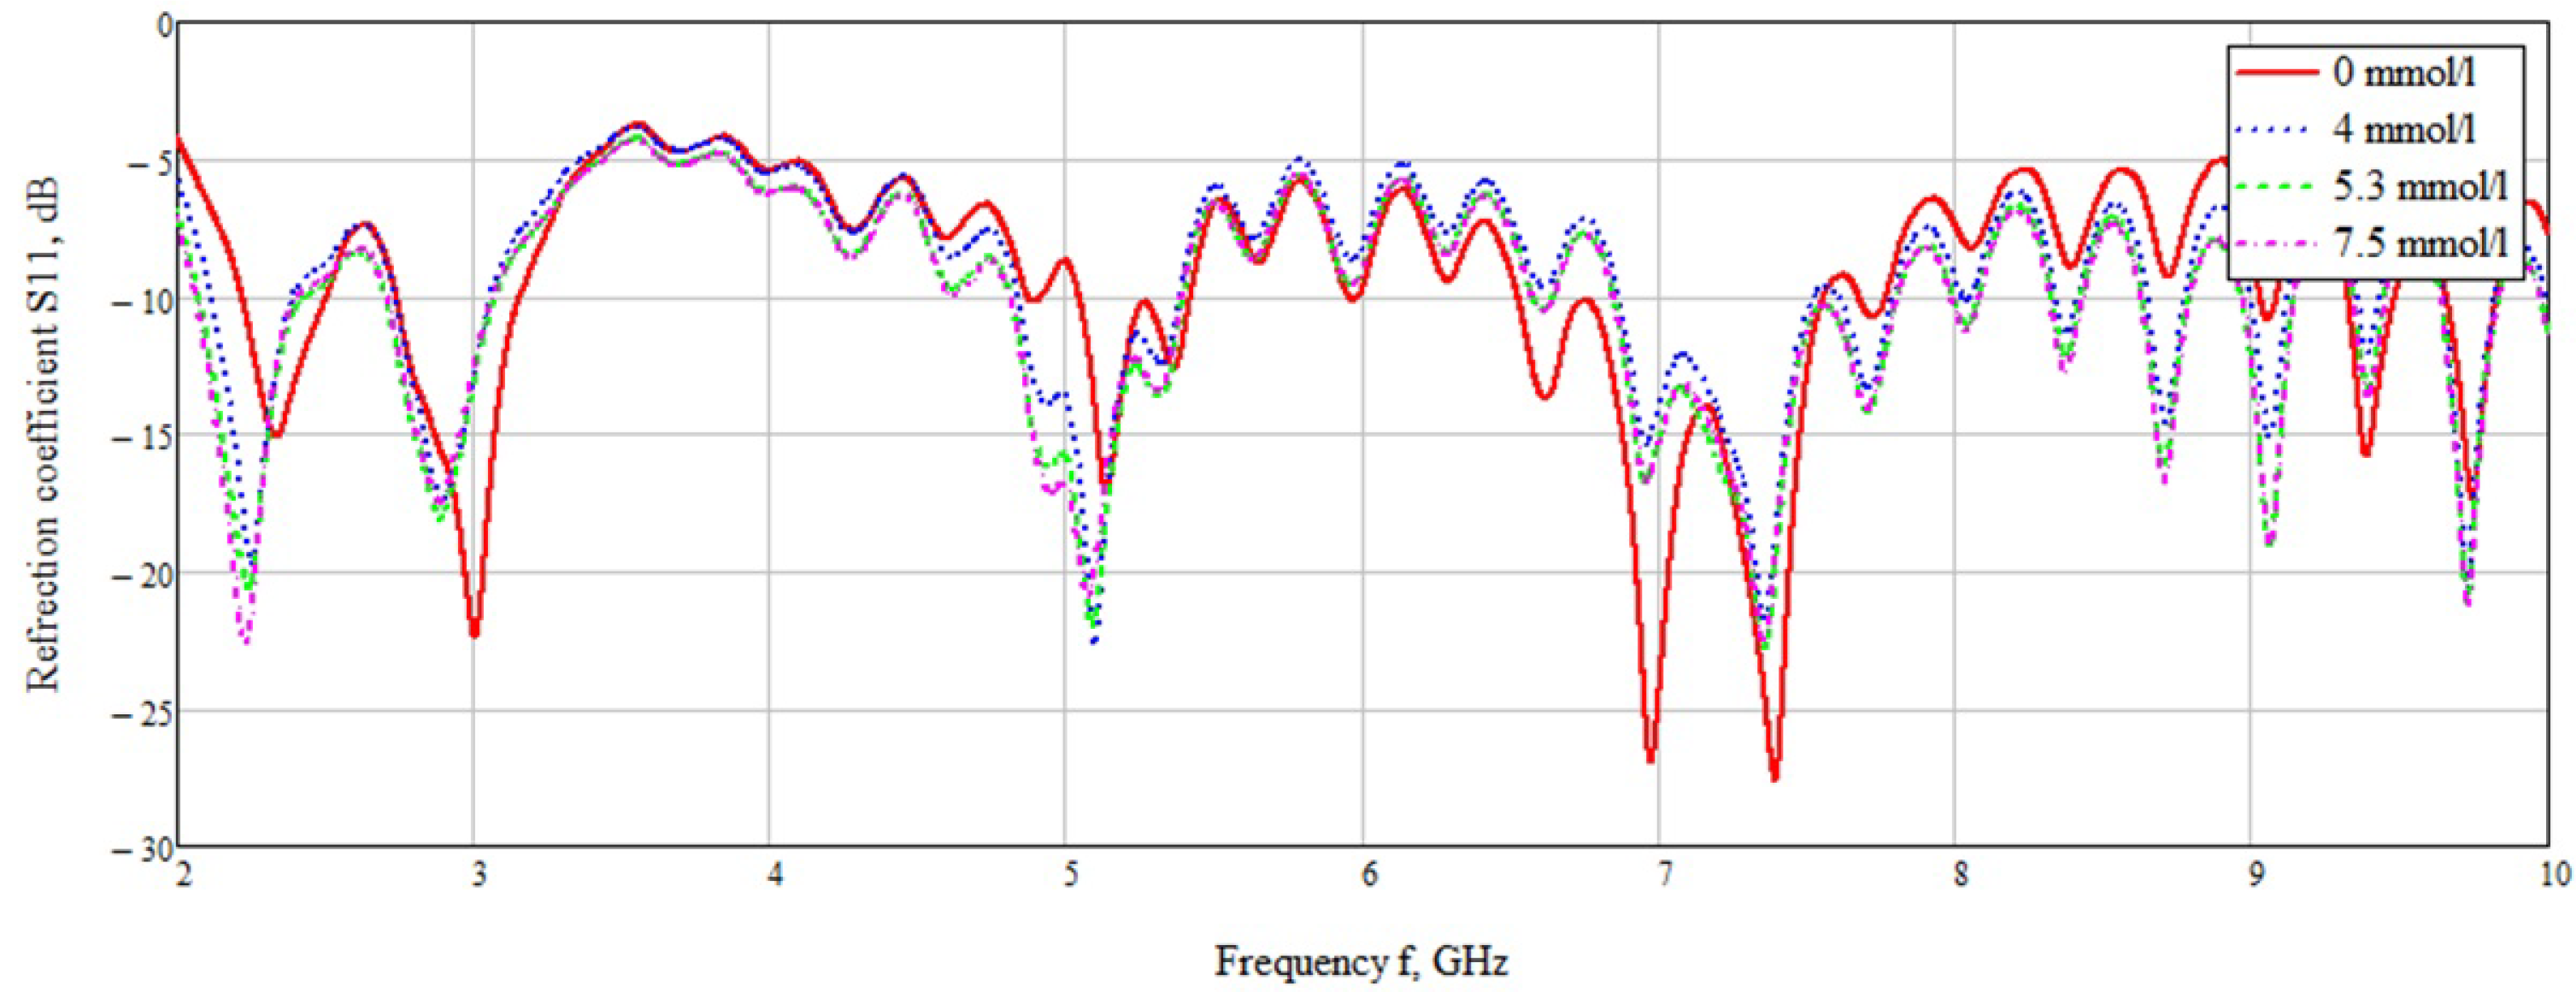
When examining the reflected signal of a unidirectional probe, an identical setup was used with the addition of a metal plate at a distance corresponding to the distance in the simulation (Figure 5). Experimental measurements were carried out on four samples of the material. The structure of each consisted of 4 layers with electrophysical values of the dermis, muscles, bone and blood layer. The first three layers (dermis, muscles, bone) in these samples were the same; only the layer with blood parameters for different glucose concentrations changed: 0 mmol/L, 4 mmol/L, 5.3 mmol/L, 7.5 mmol/L. The measurements were carried out on four samples of the material. The measurement took place in two stages: registration of a signal without a sample to remove background noise and registration of S11 parameters with samples. The data obtained after the background subtraction is presented in Figure 13. The results, as in the case of modeling, have a similar pattern of change.
Considering the entire measured range of 2–10 GHz, a large number of resonant amplitudes can be observed. The resonances that are closest to the simulation are in the frequency range 2–2.4 GHz and at a frequency of 5 GHz. The amplitude at 9 GHz differs significantly from the simulation values in region 2 (Figure 7). The values of the amplitude at a frequency of 5 GHz, obtained during simulation, differ slightly from the values obtained during experimental measurements with phantoms. A detailed study of the first band 2–2.4 GHz (Figure 14) shows differences in both amplitude and frequency at different glucose concentrations.
Comparison of the measured data for different glucose concentrations was carried out in amplitude at a frequency of 2.235 GHz. This frequency is the minimum for a concentration of 7.5 mmol/L. The data for each concentration are presented in Table 3. Also, in Table 3, the frequency values at resonance deviation are presented for each concentration.
Using the data presented in Table 3, the amplitude sensitivity of the probe was calculated. It was 1 dB/(mmol/L) with a concentration change from 4 to 7.5 mmol/L. A sensitivity of 2 dB/(mmol/L) is achieved when the concentration changes from 0 to 4 mmol/L. Such a spread in sensitivity in amplitude is associated with a high deviation of the error at a concentration of 0 mmol/L. Such a measurement error at a low glucose concentration (0 mmol/L) is associated with an increased value of the imaginary part of the relative permittivity, as well as due to the compositional structure of the layer. The frequency sensitivity of the probe was also calculated, which was 4.34–5 MHz/(mmol/L) for a concentration range of 4–7.5 mmol/L. As in the case with the amplitude sensitivity, there is also a high deviation in frequency and the probe sensitivity for the concentration range of 0–4 mmol/L was 20 MHz/(mmol/L).
According to Table 3, the dependence of the amplitude and frequency on the change in glucose concentration was also plotted. Figure 15 presents data with errors, as well as a regression curve predicting the behavior of the amplitude of the reflected signal with a change in concentration and a regression curve for a frequency change.
The data obtained indicate a high sensitivity of the probe, although there is a slight difference from numerical simulation. The sensitivity in the experimental study was 1 dB/(mmol/L) in comparison with the modeling of 1.5 dB/(mmol/L). The slight discrepancy between the experimental results and the numerical model can be explained by imperfect experimental conditions and many possible sources of noise. These can be both external factors (external radiation, re-reflections, etc.), and internal (noise in electrical appliances and cable, the quality of the probe, the degree of evenly of the probe sticking to the investigated object, the degree of roughness of the resulting phantom surface, the electrophysical characteristics of the phantom, etc.). The very nature of the reflected signal in the experimental study is similar to the signal in the simulation. The main feature of the unidirectional probe is the change in the reflected signal when the concentration changes, both in frequency and in amplitude, which will make it possible to more accurately determine the concentration when it changes.

3.2. Bidirectional Probe

The bidirectional probe was also measured for comparison with the modeling done in the previous research [18]. The measurement setup is identical for the two probes, except the absence of the metal plate. The measurement was also carried out in two stages.
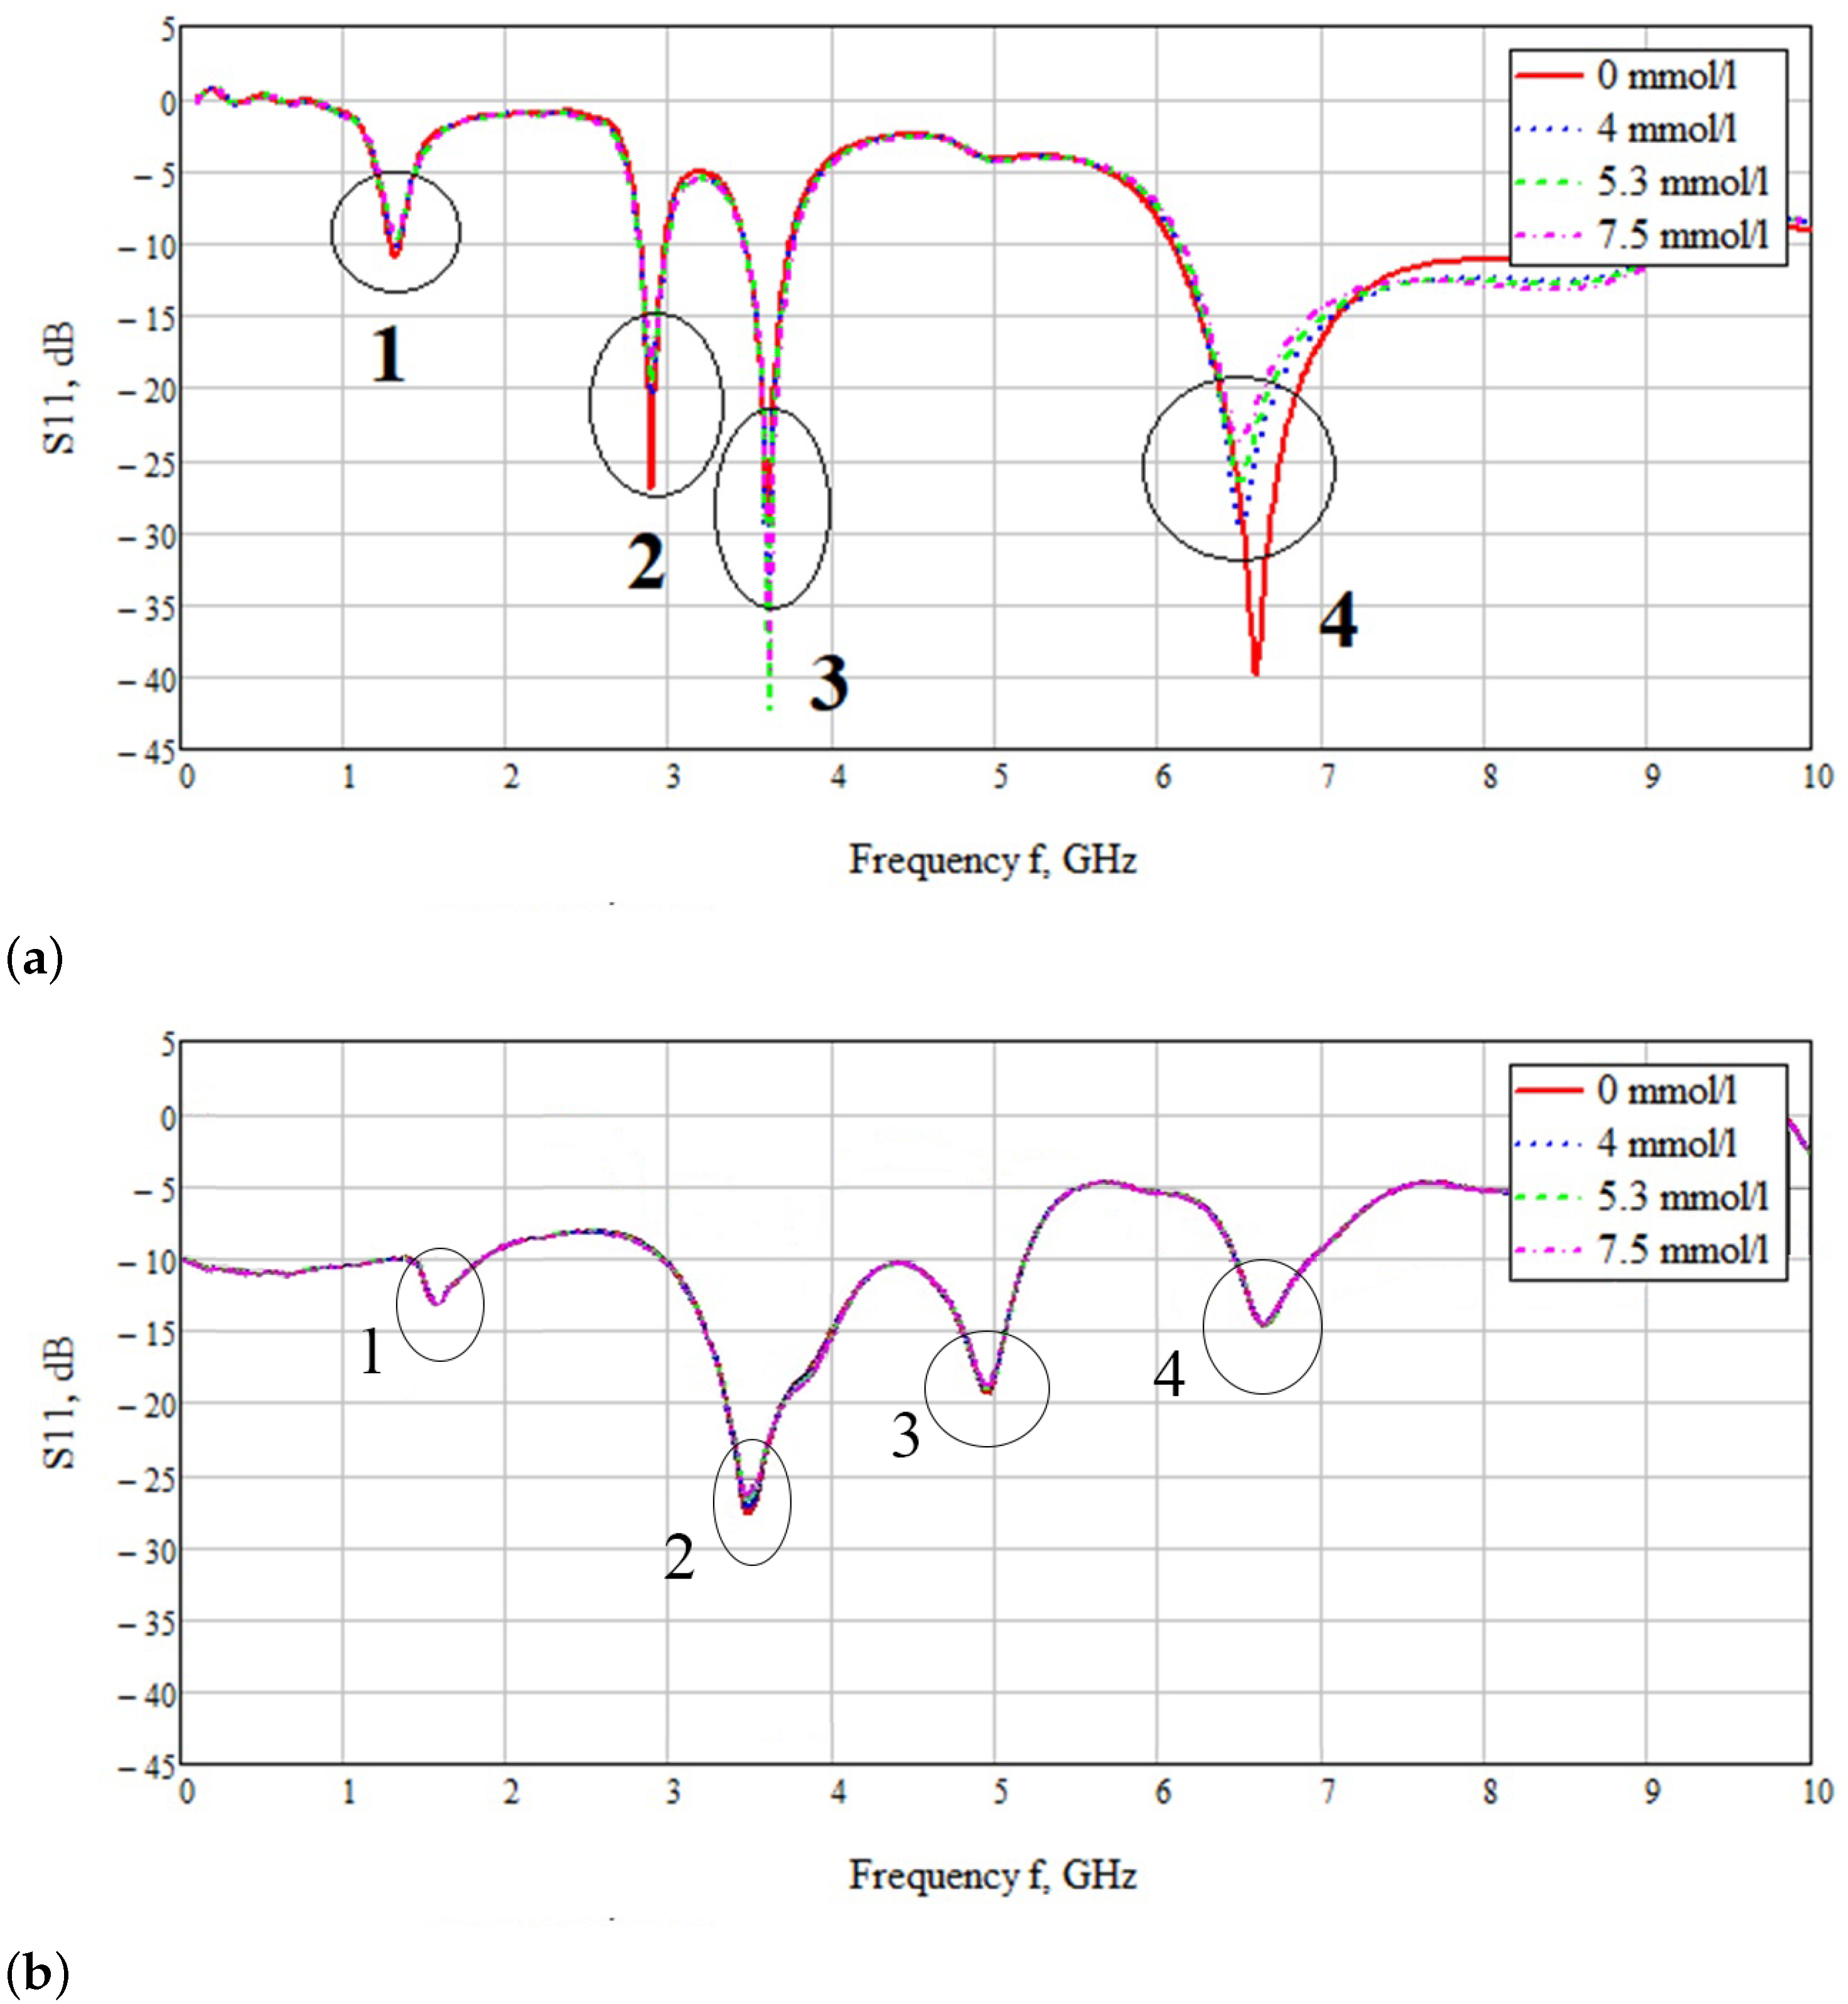
The results obtained for each glucose concentration were compared with the simulated data. Figure 16 shows the dependence of the reflected signal on the frequency during simulation (Figure 16a) and experiment (Figure 16b).
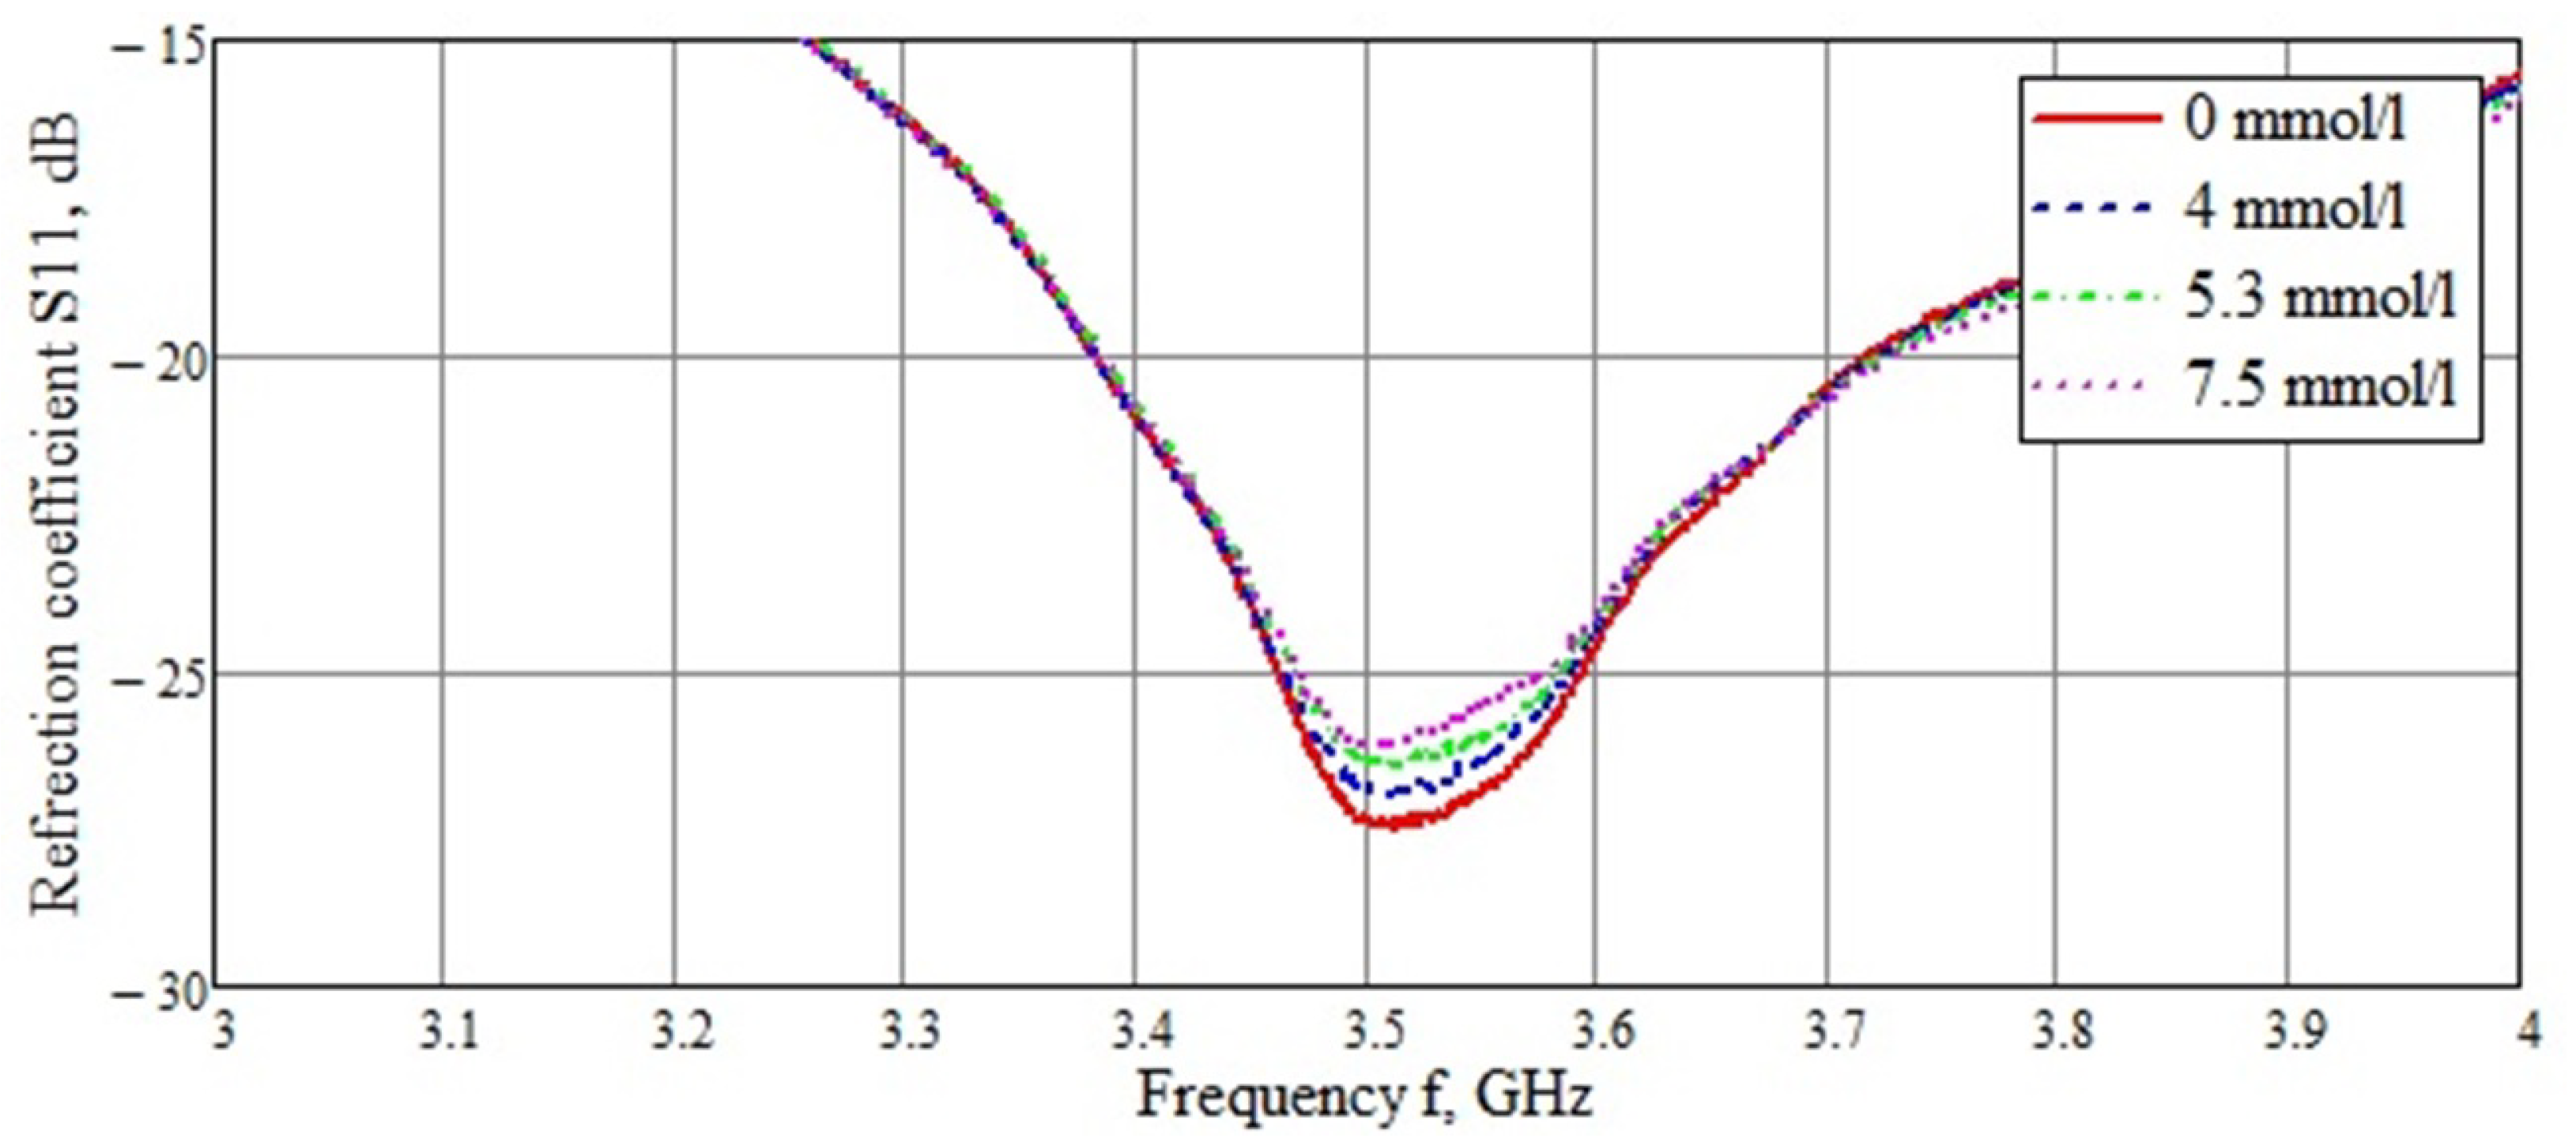
During simulation, region 4 (6–7 GHz) was most sensitive to changes in glucose in saline. In the case of experimental data, the most sensitive region is region 2 (2.5–3.5 GHz). For a more detailed study of this area, the range was reduced to 3–4 GHz (Figure 17). As can be seen from Figure 16, the difference between the concentrations is extremely small.
The amplitude changes for each concentration are shown in Table 4.
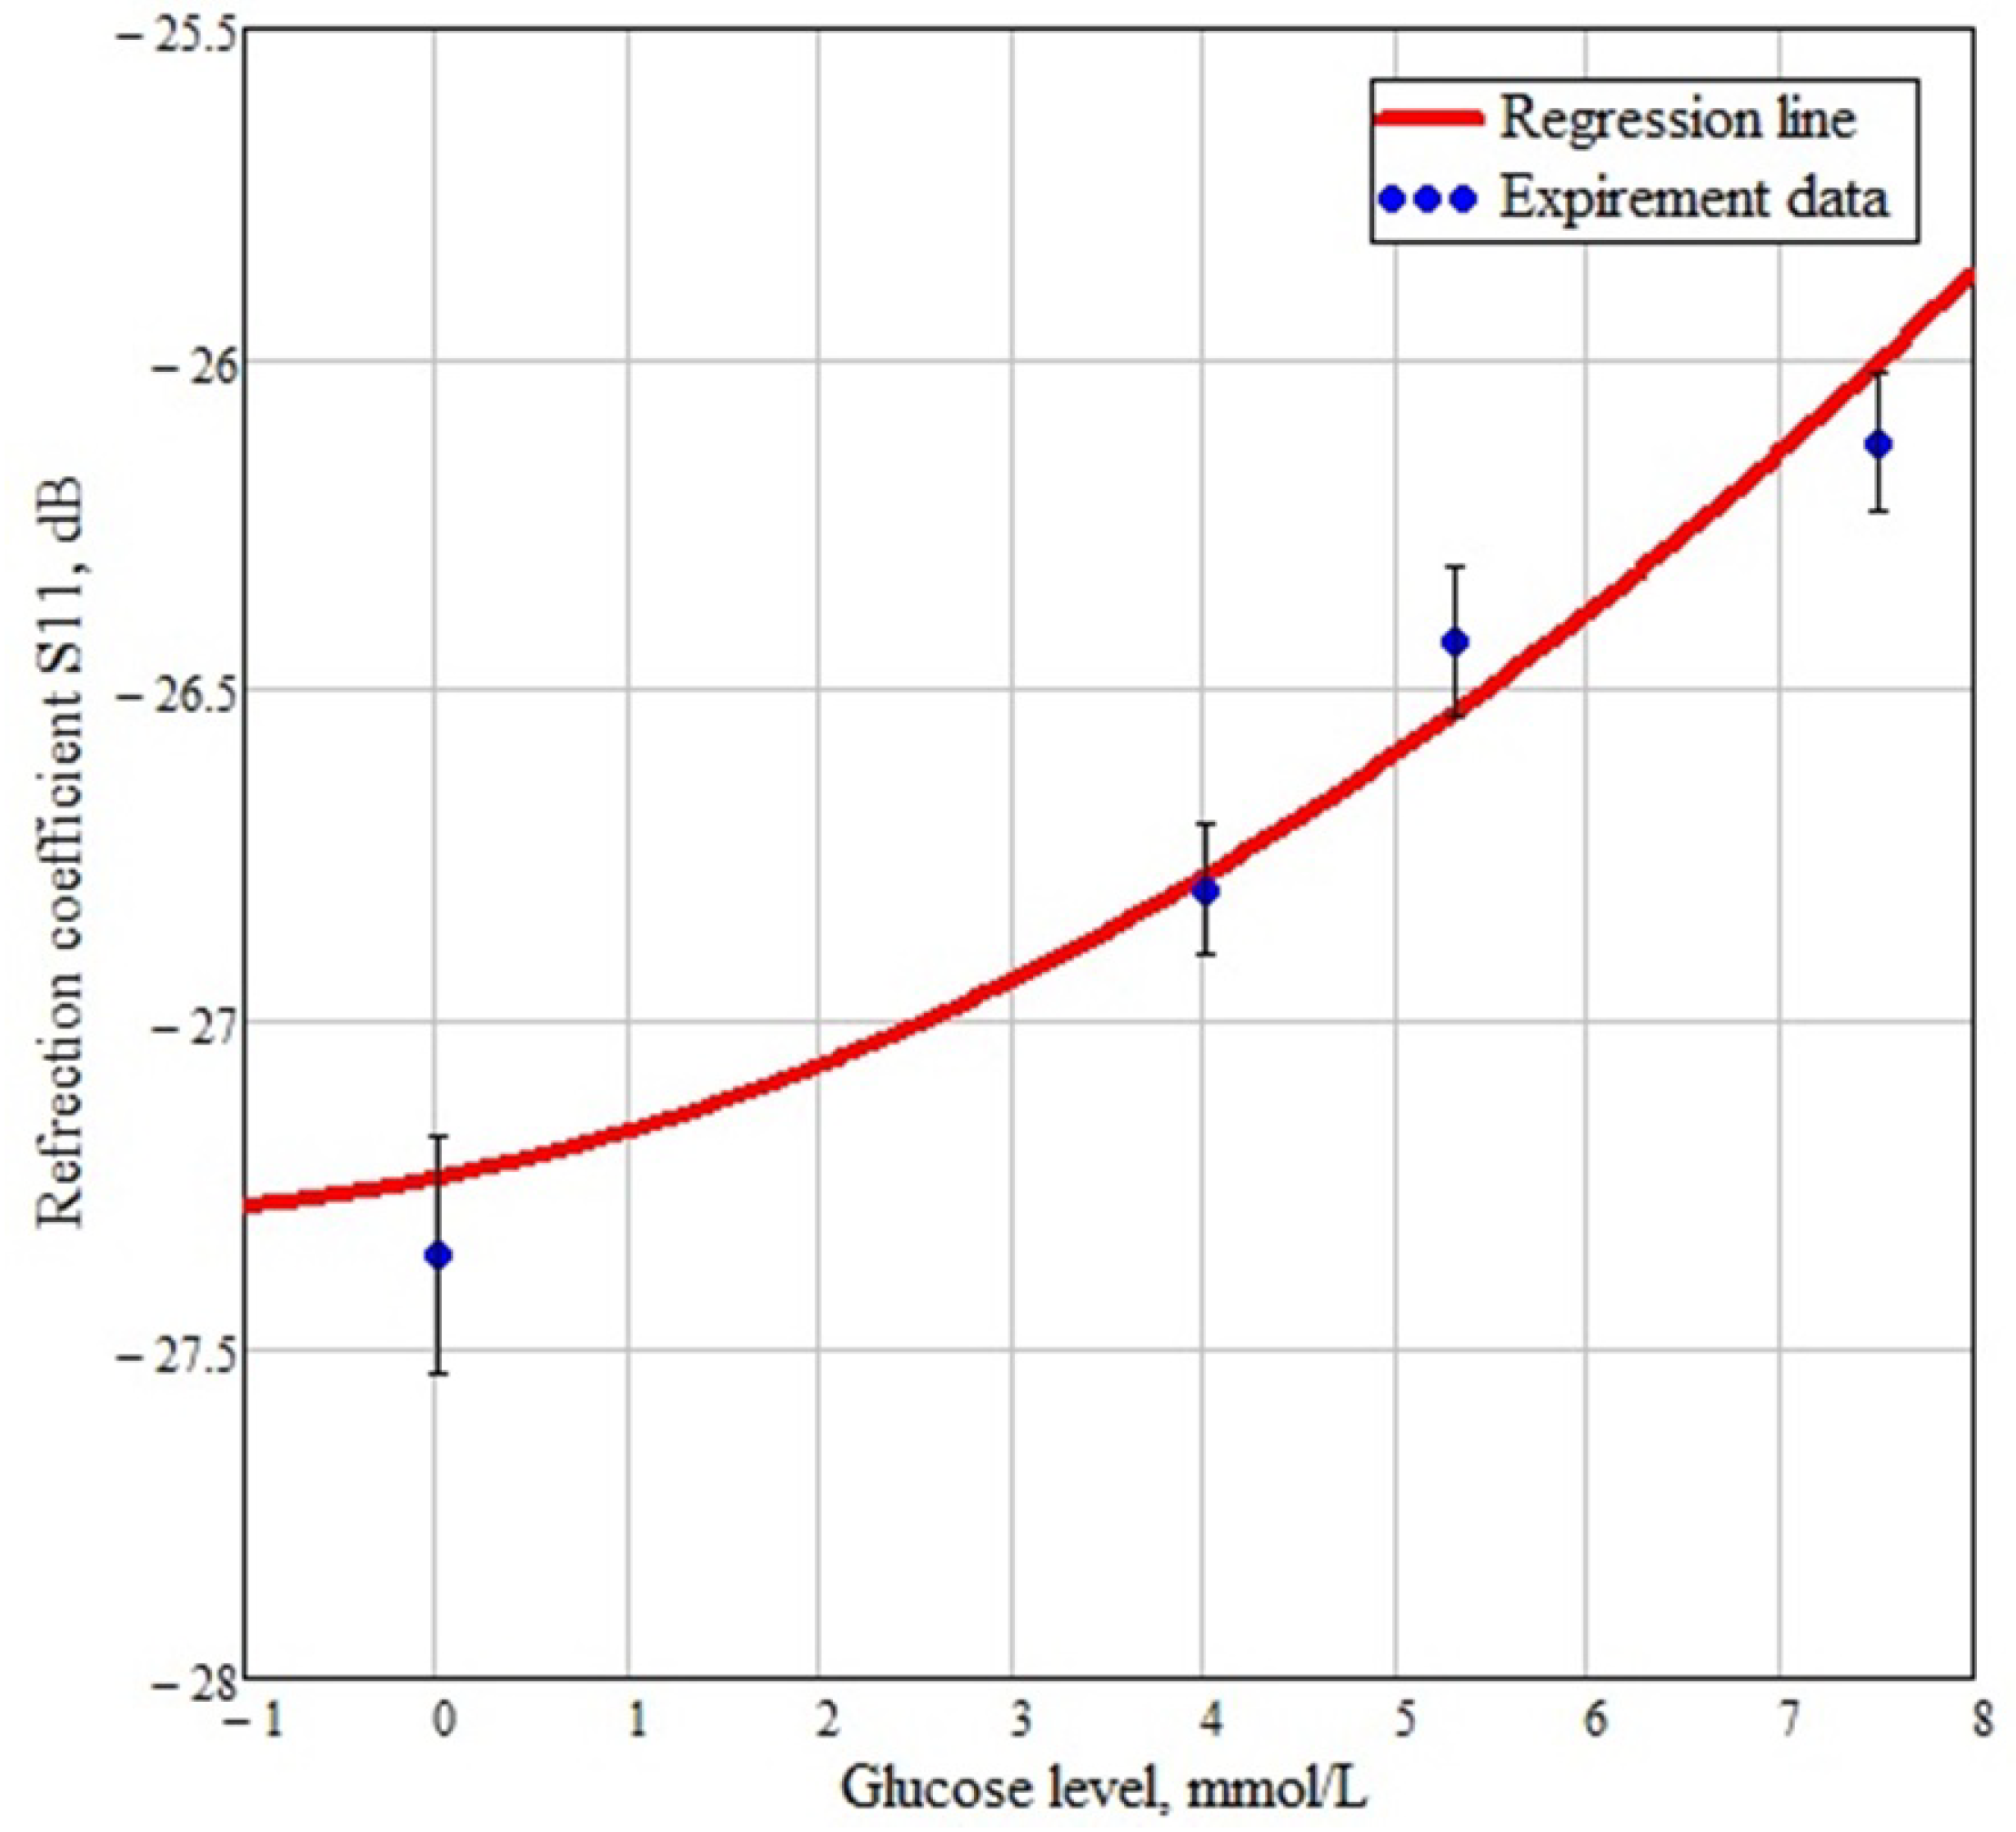
As in the case of the unidirectional probe, the dependence of the glucose concentration on the amplitude of the reflected signal was plotted (Figure 18), the error for each concentration is also shown.
Thus, according to the experimental data, the sensitivity of the bidirectional probe was 0.136–0.5 dB/(mmol/L). When simulating this probe, the sensitivity for region 2 was 0.66–1 dB/(mmol/L). This area is the least considered due to the small change in the amplitude of the reflected signal. Region 4 in the modeling was considered as the main one due to the large difference in amplitudes with a change in glucose concentration. The sensitivity for this area was 2.69 dB/(mmol/L).
The results obtained for unidirectional and bidirectional probes were compared with other microwave measurement methods. Table 5 shows a comparative sensitivity analysis.
As can be seen from the table, the unidirectional probe is superior in sensitivity to all the considered analogs of devices for non-invasive measurement of glucose concentration. The closest to the developed probe is [29]. In this article, the authors used a high frequency signal (50–70 GHz) and considered the deviations of the transmission coefficient. Due to the high frequency, they managed to achieve such high results.

4. Discussion and Conclusions

In the article, a study of the near-field probe in the form of a folded dipole was carried out by means of numerical and field experiments. Two versions of the probe design were considered: bidirectional and unidirectional. The results of modeling a unidirectional probe showed that limiting radiation in one direction significantly increases the signal response when the glucose concentration changes. The sensitivity of the probe during simulation was 1.5–2.7 dB/(mmol/L).
Real experimental studies based on the created probe showed a slightly lower sensitivity of 1 dB (mmol/L). However, even this value significantly exceeds the analogs. The resulting regression line allows to predict the concentration value when it changes. Also, in addition to the amplitude sensitivity, this probe allows to measure the concentration by the frequency shift of the resonance. The sensitivity was 4.34–5 MHz/(mmol/L). The use of frequency and amplitude sensitivity allows to accurately determine the glucose concentration values.
In addition to the unidirectional probe, a bidirectional probe experiment was also performed. The obtained data are significantly less in amplitude. The sensitivity of the bidirectional probe was 0.136–0.5 dB/(mmol/L). This sensitivity is significantly lower than that of a unidirectional probe, but in comparison with some analogs, it is still higher in sensitivity.
Thus, these studies have shown the fundamental possibility of measuring glucose concentration with this design of the near-field probe. The results obtained show that the use of a unidirectional probe of this design makes it possible to determine the level of glucose concentration with high accuracy.
Discussion of the challenges in moving to in vivo use conditions. For in vivo use, it is necessary to minimize the size of the probe for ease of use on humans with subsequent research. Presumably, the probe will be located on a person’s arm in the crook of the elbow area, where the venous vessel is located. It will be necessary to ensure a uniform tight fit of the sensor to the human body. This may require a transition to a flexible dielectric substrate. Regarding the presence of blood flow in the capillaries or vasculature and whether dynamic flow will introduce errors in measurements we can say that in the modeling and experiments carried out at this stage, the influence of the saline solution flow speed in the vessel on the reflection coefficient was not considered, since the probe measurements are carried out in 3.6 μ s per point and when considering 8008 points, the measurement time is 0.028 s. At a flow speed of 150 mm/s, it has no effect on the reflected signal. In capillary vessels, the flow speed is 1 mm/s, which, accordingly, will also not affect the values of the reflected signal. Thus, at this stage of the study, we can say that the dynamic flow will not introduce errors in measurements. In general, non-invasive measurements are very sensitive to various types of interference, and many factors can affect the recorded signal. In the article, the authors use except for glucose solutions, averaged literature data. Meanwhile, people are individual and have a wide variation in blood hemoglobin, hematocrit, degree of skin hydration, cholesterol, thickness of skin layers, vascular architectonics, etc., especially sick people. There are no reliable literature data on the scatter of these data (except for glucose levels) in patients with diabetes mellitus. Moreover, glucose is found not only in the blood, but also in the intercellular space, and in a different concentration. All these factors are individual for each person and changeable in time (in different time scales). For example, the amount of blood, fluid, and, consequently, glucose in the diagnostic volume (in probing) can vary greatly from vasoconstriction/dilation with changes in pressure, temperature, when the patient uses diuretics, etc. All these factors must be considered when assessing measurement result. Separate large-scale studies are required to collect these real scatters of data for all factors affecting the recorded signal. In the best case, taking them into account will lead to a large family of different curves, the choice of a particular one of which will be difficult only according to the device data and will require other additional invasive clinical data. Perhaps a device that measures glucose non-invasively should, in parallel, measure each patient’s all specific individual parameters, “here and now” affecting the signal (blood volume, skin temperature, blood pressure, blood hemoglobin, etc.) and solve the inverse problem. There are still a lot of questions here. How to calculate the volume of venous blood in the examination area using the registered signal and from it the percentage of glucose in this venous blood, excluding the contribution of intercellular glucose, blood hemoglobin, cholesterol, etc. from the signal? What model is needed for this? It may be necessary to create a grounded working model for solving the inverse problem, to isolate the main factors influencing the recorded signal and try, at least, to collect reliable experimental data on them in the control group and for patients with diabetes mellitus. But how much this is possible with the current level of research is difficult to say.
Nevertheless, the obtained results are of great interest and can be used for further research on the development of technology for non-invasive measurement of glucose concentration.

Author Contributions

Conceptualization, A.G., K.Z.; methodology, A.M., A.K., K.Z.; validation, A.G., A.M.; formal analysis, A.M., K.Z.; investigation, A.Z.; resources, A.G.; data curation, A.G., A.M.; writing—original draft preparation, A.G., K.Z., A.M. A.Z., A.K.; writing—review and editing, A.G., K.Z., A.M.; visualization, A.M., A.G.; supervision, K.Z.; project administration, K.Z. All authors have read and agreed to the published version of the manuscript.

Funding

This research was funded by the Russian Science Foundation project “Development of ideas about the features of near-field interaction of electromagnetic radiation in a wide frequency band with a diagnosed biological environment to create on this basis a new non-invasive glucometry technology” N 18-75-10101.

Institutional Review Board Statement

Not applicable.

Informed Consent Statement

Not applicable.

Conflicts of Interest

The authors declare no conflict of interest. The funders had no role in the design of the study; in the collection, analyses, or interpretation of data; in the writing of the manuscript, or in the decision to publish the results.

References

  1. Villena Gonzales, W.; Mobashsher, A.T.; Abbosh, A. The progress of glucose monitoring—A review of invasive to minimally and non-invasive techniques, devices and sensors. Sensors 2019, 19, 800. [Google Scholar] [CrossRef] [PubMed] [Green Version]
  2. Yilmaz, T.; Foster, R.; Hao, Y. Radio-frequency and microwave techniques for non-invasive measurement of blood glucose levels. Diagnostics 2019, 9, 6. [Google Scholar] [CrossRef] [PubMed] [Green Version]
  3. Schoemaker, M.; Schmelzeisen-Redeker, G.; Jager, J. CGM sensor design principles for reliable and accurate glucose monitoring in the subcutaneous tissue. In Proceedings of the 7th International Conference on Advanced Technologies & Treatments for Diabetes, Vienna, Austria, 5–8 February 2014; pp. 5–8. [Google Scholar]
  4. Clark, L.C., Jr.; Lyons, C. Electrode systems for continuous monitoring in cardiovascular surgery. Ann. N. Y. Acad. Sci. 1962, 102, 29–45. [Google Scholar] [CrossRef]
  5. Bandodkar, A.J.; Imani, S.; Nunez-Flores, R.; Kumar, R.; Wang, C.; Mohan, A.V.; Wang, J.; Mercier, P.P. Re-usable electrochemical glucose sensors integrated into a smartphone platform. Biosens. Bioelectron. 2018, 101, 181–187. [Google Scholar] [CrossRef]
  6. Bazaev, N.; Masloboev, Y.P.; Selishchev, S. Optical methods for noninvasive blood glucose monitoring. Biomed. Eng. 2012, 45, 229–233. [Google Scholar] [CrossRef]
  7. Jina, A.; Tierney, M.J.; Tamada, J.A.; McGill, S.; Desai, S.; Chua, B.; Chang, A.; Christiansen, M. Design, development, and evaluation of a novel microneedle array-based continuous glucose monitor. J. Diabetes Sci. Technol. 2014, 8, 483–487. [Google Scholar] [CrossRef] [Green Version]
  8. Jung, W.; Kim, J.; Jeon, M.; Chaney, E.J.; Stewart, C.N.; Boppart, S.A. Handheld optical coherence tomography scanner for primary care diagnostics. IEEE Trans. Biomed. Eng. 2010, 58, 741–744. [Google Scholar] [CrossRef] [Green Version]
  9. Xiao, X.; Li, Q. A noninvasive measurement of blood glucose concentration by UWB microwave spectrum. Ieee Antennas Wirel. Propag. Lett. 2016, 16, 1040–1043. [Google Scholar] [CrossRef]
  10. Jha, A.K.; Akhter, Z.; Tiwari, N.; Shafi, K.M.; Samant, H.; Akhtar, M.J.; Cifra, M. Broadband wireless sensing system for non-invasive testing of biological samples. IEEE J. Emerg. Sel. Top. Circuits Syst. 2018, 8, 251–259. [Google Scholar] [CrossRef]
  11. Harnsoongnoen, S.; Wanthong, A. Coplanar waveguide transmission line loaded with electric-LC resonator for determination of glucose concentration sensing. IEEE Sens. J. 2017, 17, 1635–1640. [Google Scholar] [CrossRef]
  12. Choi, H.; Naylon, J.; Luzio, S.; Beutler, J.; Birchall, J.; Martin, C.; Porch, A. Design and in vitro interference test of microwave noninvasive blood glucose monitoring sensor. IEEE Trans. Microw. Theory Tech. 2015, 63, 3016–3025. [Google Scholar] [CrossRef] [PubMed] [Green Version]
  13. Turgul, V.; Kale, I. Simulating the effects of skin thickness and fingerprints to highlight problems with non-invasive RF blood glucose sensing from fingertips. IEEE Sens. J. 2017, 17, 7553–7560. [Google Scholar] [CrossRef]
  14. Pimentel, S.; Agüero, P.D.; Uriz, A.J.; Bonadero, J.C.; Liberatori, M.; Moreira, J.C. Simulation of a non-invasive glucometer based on a microwave resonator sensor. J. Phys. Conf. Ser. IOP Publ. 2013, 477, 012020. [Google Scholar] [CrossRef] [Green Version]
  15. Adhikari, K.K.; Kim, N.Y. Ultrahigh-sensitivity mediator-free biosensor based on a microfabricated microwave resonator for the detection of micromolar glucose concentrations. IEEE Trans. Microw. Theory Tech. 2015, 64, 319–327. [Google Scholar] [CrossRef]
  16. Guariti, G.; Hofmann, M.; Weigel, R.; Fischer, G.; Kissinger, D. Determination of sugar concentration in aqueous solutions using ultra-wideband microwave impedance spectroscopy. In Proceedings of the 2013 IEEE MTT-S International Microwave Symposium Digest (MTT), Seattle, WA, USA, 2–7 June 2013; pp. 1–4. [Google Scholar]
  17. Lin, Y.R.; Hung, C.C.; Chiu, H.Y.; Chang, P.H.; Li, B.R.; Cheng, S.J.; Yang, J.W.; Lin, S.F.; Chen, G.Y. Noninvasive glucose monitoring with a contact lens and smartphone. Sensors 2018, 18, 3208. [Google Scholar] [CrossRef] [Green Version]
  18. Gorst, A.; Zavyalova, K.; Yakubov, V.; Mironchev, A.; Zapasnoy, A. Theoretical Simulation of the Near-Field Probe for Non-Invasive Measurements on Planar Layers with Biological Characteristics. Bioengineering 2020, 7, 149. [Google Scholar] [CrossRef] [PubMed]
  19. Gabriel, S.; Lau, R.; Gabriel, C. The dielectric properties of biological tissues: III. Parametric models for the dielectric spectrum of tissues. Phys. Med. Biol. 1996, 41, 2271. [Google Scholar] [CrossRef] [PubMed] [Green Version]
  20. Freer, B.; Venkataraman, J. Feasibility study for non-invasive blood glucose monitoring. In Proceedings of the 2010 IEEE Antennas and Propagation Society International Symposium, Toronto, ON, Canadan, 11–17 July 2010; pp. 1–4. [Google Scholar]
  21. Di Meo, S.; Pasotti, L.; Iliopoulos, I.; Pasian, M.; Ettorre, M.; Zhadobov, M.; Matrone, G. Tissue-mimicking materials for breast phantoms up to 50 GHz. Phys. Med. Biol. 2019, 64, 055006. [Google Scholar] [CrossRef] [PubMed]
  22. Lazebnik, M.; Madsen, E.L.; Frank, G.R.; Hagness, S.C. Tissue-mimicking phantom materials for narrowband and ultrawideband microwave applications. Phys. Med. Biol. 2005, 50, 4245. [Google Scholar] [CrossRef]
  23. Di Meo, S.; Matrone, G.; Pasian, M. Experimental Validation on Tissue-Mimicking Phantoms of Millimeter-Wave Imaging for Breast Cancer Detection. Appl. Sci. 2021, 11, 432. [Google Scholar] [CrossRef]
  24. O’Loughlin, D.; O’Halloran, M.; Moloney, B.M.; Glavin, M.; Jones, E.; Elahi, M.A. Microwave breast imaging: Clinical advances and remaining challenges. IEEE Trans. Biomed. Eng. 2018, 65, 2580–2590. [Google Scholar] [CrossRef] [PubMed]
  25. Gorst, A.; Zavyalova, K.; Shipilov, S.; Yakubov, V.; Mironchev, A. Microwave Method for Measuring Electrical Properties of the Materials. Appl. Sci. 2020, 10, 8936. [Google Scholar] [CrossRef]
  26. Huang, S.Y.; Yoshida, Y.; Inda, A.J.G.; Xavier, C.X.; Mu, W.C.; Meng, Y.S.; Yu, W. Microstrip line-based glucose sensor for noninvasive continuous monitoring using the main field for sensing and multivariable crosschecking. IEEE Sens. J. 2018, 19, 535–547. [Google Scholar] [CrossRef]
  27. Kim, S.; Kim, J.; Babajanyan, A.; Lee, K.; Friedman, B. Noncontact characterization of glucose by a waveguide microwave probe. Curr. Appl. Phys. 2009, 9, 856–860. [Google Scholar] [CrossRef]
  28. Hu, S.; Nagae, S.; Hirose, A. Millimeter-wave adaptive glucose concentration estimation with complex-valued neural networks. IEEE Trans. Biomed. Eng. 2018, 66, 2065–2071. [Google Scholar] [CrossRef]
  29. Omer, A.E.; Gigoyan, S.; Shaker, G.; Safavi-Naeini, S. WGM-based sensing of characterized glucose-aqueous solutions at mm-waves. IEEE Access 2020, 8, 38809–38825. [Google Scholar] [CrossRef]
Figure 1. CST model of a near-field microwave probe (left). Electric field distribution of the near-field probe at a frequency of 2 GHz (a) and 10 GHz (b).
Applsci 11 05415 g001
Figure 2. Field distribution E-field (a) and H-field (b) near a unidirectional probe.
Applsci 11 05415 g002
Figure 3. Frequency dependence of the real (a) and imaginary (b) parts of the relative permittivity on the frequency.
Applsci 11 05415 g003
Figure 4. Frequency dependence of the real (a) and imaginary (b) parts of the relative permittivity on the frequency for blood with different glucose concentrations.
Applsci 11 05415 g004
Figure 5. Model of numerical experiments with a flat layered biological medium and a unidirectional probe.
Applsci 11 05415 g005
Figure 6. Frequency dependence of the reflected signal from change in the distance between the metal plate and the probe.
Applsci 11 05415 g006
Figure 7. Frequency response of the reflected signal for various glucose concentrations.
Applsci 11 05415 g007
Figure 8. Frequency dependence of the reflected signal for various glucose concentrations.
Applsci 11 05415 g008
Figure 9. Dependence of voltage standing wave ratio on frequency.
Applsci 11 05415 g009
Figure 10. Frequency dependence of the real (a) and imaginary (b) parts of the relative permittivity of the created biological layers.
Applsci 11 05415 g010
Figure 11. Frequency dependence of the real (a) and imaginary (b) parts of the relative permittivity of biological tissues such as blood.
Applsci 11 05415 g011
Figure 12. Microwave near-field copper tube probe and experimental setup for a unidirectional probe.
Applsci 11 05415 g012
Figure 13. Frequency dependence of the reflected signal from the unidirectional probe for various glucose concentrations. Frequency range 2–10 GHz.
Applsci 11 05415 g013
Figure 14. Frequency dependence of the reflected signal from the unidirectional probe for various glucose concentrations. Frequency range 2–2.4 GHz.
Applsci 11 05415 g014
Figure 15. Dependence of the reflected signal on the glucose concentration at a frequency of 2.235 GHz (a) and the dependence of the frequency on the glucose concentration (b) in saline.
Applsci 11 05415 g015
Figure 16. Frequency dependence of the reflected signal of a bidirectional probe on frequency for various glucose concentrations in modeling (a) [18] and experimental measurement (b).
Applsci 11 05415 g016
Figure 17. Frequency dependence of the reflected signal from the bidirectional probe for various glucose concentrations. Frequency range 3–4 GHz.
Applsci 11 05415 g017
Figure 18. The dependence of the reflected signal on the concentration of glucose at a frequency of 3.5 GHz.
Applsci 11 05415 g018
Table 1. Values of parameters for formula (1).
SkinFatMuscleBone
ε 42.542.5
σ 0.00020.0350.20.02
α 1 00.20.10.2
α 2 0.20.10.10.2
α 3 0.050.10.2
α 4 0.100
Δ ε 1 3295010
Δ ε 2 1100357 × 10 3 180
Δ ε 3 33 × 10 3 12 × 10 5 5 × 10 3
Δ ε 4 1 × 10 7 2.5 × 10 7 1 × 10 5
τ 1 7.234 × 10 12 7.958 × 10 12 7.234 × 10 12 13.263 × 10 12
τ 2 0.324 × 10 7 0.159 × 10 7 3.537 × 10 7 0.795 × 10 7
τ 3 15.915 × 10 6 31.831 × 10 6 15.915 × 10 6
τ 4 1.595 × 10 3 0.274 × 10 3 1.591 × 10 3
Table 2. The calculated data on the components for the phantom.
MaterialPolyuret. HP40 %Two-Comp. Polyuret.// %Graphite, %Acetone, mL/100 g
Skin303032.37.7
Blood 0 mmol/L303033.86.2
Blood 4 mmol/L303030.29.8
Blood 5.3 mmol/L30302911
Blood 7.5 mmol/L303027.112.9
Muscle33.733.725.86.8
Bone404015.64.4
Table 3. Values of the amplitude and frequency of the reflected signal at various glucose concentrations.
Concentration LevelAmplitude of the Reflected Signal at a Frequency of 2.235 GHz (dB)The Minimum Amplitude of the Reflected Signal (dB)Frequency at Minimum Amplitude (GHz)
Blood 0 mmol/L 10.722 ± 0.685 15.131 2.336 ± 0.035
Blood 4 mmol/L 18.765 ± 0.192 19.687 2.256 ± 0.0075
Blood 5.3 mmol/L 20.493 ± 0.156 20.646 2.246 ± 0.0056
Blood 7.5 mmol/L 22.265 ± 0.12 22.636 2.235 ± 0.0048
Table 4. Reflected signal amplitude values for different glucose concentrations.
Concentration LevelFrequencyReflected Signal Amplitude (dB)
Blood 0 mmol/L3.5 GHz 27.36 ± 0.18
Blood 4 mmol/L3.5 GHz 26.804 ± 0.096
Blood 5.3 mmol/L3.5 GHz 26.43 ± 0.112
Blood 7.5 mmol/L3.5 GHz 26.129 ± 0.105
Table 5. Sensitivity values of analog devices for non-invasive measurements.
ReferenceConcentration (mg/mL)Frequency (GHz)Sensitivity ParameterS (dB per mg/mL)
[26]0.78–501.4–1.9S110.18
[27]0–3002.0–2.5S110.003
[28]0–360–80S120.23
[29]0.7–1.250–70S120.8–1
[11]40–2002.5–6S120.01
Unidirectional probe0–1.812.1–2.5S110.94–1.1
Bidirectional probe0–1.813.4–3.6S110.16–0.38
Publisher’s Note: MDPI stays neutral with regard to jurisdictional claims in published maps and institutional affiliations.