Article

A Collaborative Filtering Algorithm with Intragroup Divergence for POI Group Recommendation

1
College of Computer Science and Technology, Jilin University, Changchun 130012, China
2
Key Laboratory of Symbolic Computation and Knowledge Engineering of Ministry of Education, Jilin University, Changchun 130012, China
3
Center for Computer Fundamental Education, Jilin University, Changchun 130012, China
*
Author to whom correspondence should be addressed.
Appl. Sci. 2021, 11(12), 5416; https://doi.org/10.3390/app11125416
Submission received: 8 May 2021 / Revised: 8 June 2021 / Accepted: 8 June 2021 / Published: 10 June 2021
(This article belongs to the Section Computing and Artificial Intelligence)

Abstract

:
The purpose of POI group recommendation is to generate a recommendation list of locations for a group of users. Most of the current studies first conduct personal recommendation and then use recommendation strategies to integrate individual recommendation results. Few studies consider the divergence of groups. To improve the precision of recommendations, we propose a POI group recommendation method based on collaborative filtering with intragroup divergence in this paper. Firstly, user preference vector is constructed based on the preference of the user on time and category. Furthermore, a computation method similar to TF-IDF is presented to compute the degree of preference of the user to the category. Secondly, we establish a group feature preference model, and the similarity of the group and other users’ feature preference is obtained based on the check-ins. Thirdly, the intragroup divergence of POIs is measured according to the POI preference of group members and their friends. Finally, the preference rating of the group for each location is calculated based on a collaborative filtering method and intragroup divergence computation, and the top-ranked score of locations are the recommendation results for the group. Experiments have been conducted on two LBSN datasets, and the experimental results on precision and recall show that the performance of the proposed method is superior to other methods.

1. Introduction

With the development of GPS and electronic devices, users can make check-in activities on the locations that they visit. Location-based social networks (LBSN) are an extension of social network integrating location-based services. LBSN such as Foursquare, Gowalla, and Yelp organically integrate online virtual society with the offline real-world. They are complex heterogeneous networks that include the relationship between users and locations and has a huge amount of data information. Users in LBSN can easily acquire real-time location information, and they can visit and record many locations they are interested in or share their experiences with friends. Generally speaking, point of interest (POI) recommendation is one of the most popular research topics in LBSN. It focuses on recommending a list of POIs to a user. It is of importance but the challenge lies in the data sparsity, implicit user feedback and personalized preference [1,2]. The POI is interchangeably referred to as the location in this article. POI recommendation can not only enhance user experience, but also can help advertisers target advertising for customers.
For individual POI recommendation, collaborative filtering (CF) is the most widely used method because of its simple architecture and is easy to implement. It mainly predicts and recommends unknown locations based on user’s check-in behaviors. User-based CF method is to make use of the information in the whole user-item matrix to recommend, and use statistical techniques to get neighbor users. It makes use of the behavior of neighbor users to predict the preferences of target user, and recommends top-N locations to target user. However, in real scenarios, group activities are becoming more popular in various fields today. Users will always like to go to a place together, such as go to a basketball gym together for fun, or go to the library together for study. It is more necessary to recommend a number of POIs to a group of users than to an individual user. Group recommendation systems are used to generate ranked lists of recommendations based on users’ preferences [3]. Many group recommendation systems are applied in different fields, such as tourism, music, movies and so on. For example, Where2Eat is a model for group restaurant recommendation [4], and HappyMovie is a group recommendation model applying for the domain of movie.
The main challenge in the study of group recommendation systems is to reconcile the different preference of a group’s members. Group recommendation methods have usually used the aggregation functions to model the preferences of group members. Some group recommendation results can be obtained by aggregating results of individual recommendation. Jameson summarized three strategies for aggregating individual recommendations: average satisfaction [5], least misery [6] and maximum satisfaction. The average strategy takes the average recommendation score of all group members as the final score. However, different users have different preferences for items, and average strategy may lead to inaccurate results. In order to satisfy everyone, least misery adopts the minimum recommendation scores as the final score. Baltrunas et al. [7] compares different aggregation strategies, and finds the effectiveness of the strategy depends on the group size. In addition, some group recommendation is based on aggregating the user’ individual preference into a group preference [8]. This kind of approach treats the group as a user, and every user in the group has an influence for the result. However, the computation of weight of the user in the group is a challenging problem. Where-to-go recommendation systems can realize group recommendations based on random walk with a restart approach, but the influence weight of the members of the group is equal in this system [9]. However, group members should have different influences on the final decision of the group and the system needs to calculate the weight of different members for aggregating members’ preferences.
Effectively aggregating the individual preferences of group members to recommend the most meaningful items for the whole group is necessary. Meanwhile, to improve the quality of group recommendations, more additional influential features are taken into account, such as geographical factors, temporal feature, category factors, social factors and experience content. Those influential features should be integrated and mined to improve the effectiveness of POI recommendation. Different people tend to visit different places at different time, so we can mine the user’s preference of locations with time factors. The social factors between members are considered to improve the performance of group recommendation [10]. Zhang proposed the first group event venue recommendation (GEVR) system [11]. It groups with different social relationship strength to aggregate each group member’s location preference. However, more relevant information should be taken into account to further improve the performance of recommendation. The existing group recommendation method fails to generate top-N POIs due to poor precision and the relevancy [12].
In the research of group recommendation, the question of how to obtain a better recommendation performance has attracted widespread attention. Most of the previous methods used aggregation strategy to fuse individual recommendation results. However, due to social environment or personal disposition factors, a user’s behavior in a group is easily affected by other members of the group, the group recommendation results obtained by aggregating method do not consider the differences of members, so it is difficult to obtain satisfactory results. The group recommendation results are not related to individual preferences and it is often very different from personal location preference. To solve this problem, we take the whole group as a virtual user, and construct the preference model of the group, considering the divergence of group members at the same time. The divergence is the difference among relevance of locations to different group members. Therefore, this paper proposes a collaborative filtering based algorithm with intragroup divergence (called CFID) for POI group recommendation.
Therefore, the key contribution of paper is presented as follows. (1) A POI group recommendation algorithm based on intragroup divergence with collaborative filtering model is proposed. The category of locations and temporal features are fully taken into account in this paper. It utilizes users’ check-in behaviors to construct the user preferences in visiting category and access time. (2) The group is regarded as a user, and the group preference model is established by aggregating each group member’s preference. Meanwhile, intragroup divergence is also an important factor affecting group recommendation results, and we develop a novel group divergence computation method for candidate POIs by analyzing the preference probability of all members in the group and their friends. (3) Experimental evaluations of the proposed methods are conducted on two LBSN datasets. The experimental results demonstrate that the proposed method obtains much higher precision and recall value than the other three recommendation methods, and is superior to other POI recommendation methods.
The rest of the paper is organized as follows. The related work of group recommendation is reviewed in Section 2, the details of the proposed algorithm is introduced in Section 3. The comparative experiments on two LBSN datasets are analyzed in Section 4. Finally, the conclusion of the paper and future work directions are shown in Section 5.

2. Related Work

Group recommendation aims to return a list of items for a group of users. There is no consensus on the classification of group recommendation. Some existing methods mostly focus on aggregating individuals’ relevance to generate recommendations for group of users [13]. The aggregation methodology is adopted according to the characteristics of the groups and it can be categorized into two types as aggregate preference and aggregate recommendation.

2.1. Aggregate Preference

The general idea of this method is to extract and combine the individual features of group members which can reflect the overall preference of the group, then integrate the individual features into the model of the whole group, and then make recommendation based on individual recommendation algorithms. Nam et al. proposed a method to represent a group as a virtual user [14]. Then, the model was used to compute the virtual user vector and employ the individual recommendation method for this virtual user. Experiments have been conducted in movie recommendation. Cantador and Castells introduced a semantic-based aggregation model group recommendation strategy [15]. In this method, users with similar preferences were identified to generate semantic documents, and then group semantic documents were generated according to individual semantic documents to make recommendations. In reference [16], the user preference model was constructed by using the historical behavior of group members and item scores. The group preference model was regarded as a multidimensional feature space, and the high-density area of item distribution represented the group preference. Group recommendation was carried out by calculating the distance between candidate items in the multidimensional feature space and high-density area. Similarly, using aggregation model strategy, Masthoff proposed a group recommendation system based on social selection theory [17]. Liu et al. proposed a group recommendation approach based on topic model [18]. The model assumes that influential users in a group can make decisions on behalf of the whole group. However, it does not consider the influence of users in different groups.

2.2. Aggregate Recommendation

This method is a more extensive research method, which first generates the evaluation of individual users on the project, then integrates the evaluation of all users, and finally gives a unified recommendation result. Zhu aggregated individual recommendations for group recommendation [19]. Furthermore, they proposed a context-aware POI group recommendation by taking into account rationality of location and intra-group influences. They get the recommendation list of the group with distance restriction and conduct their experiment on Beijing POI comment data. Yuan et al. [20] proposed a consensus model considering the relevance between groups and topics and the influence of individuals in groups. Scholars [21] introduced game theory for solving the problem of group recommendation, they regarded group activities as non-cooperative games, and made recommendations based on finding the Nash equilibrium. However, this method cannot recommend a specific item because the Nash equilibrium contains a set of items. Some studies adopt a strategy summarized by Jameson for aggregating individual recommendations [7,22]. Baltrunas [7] used collaborative filtering to generate individual recommendations, and then individual recommendations were aggregated into the group recommendations using the least misery and average aggregation strategy. Feng et al. [22] presented a group recommendation based on random walk with restart method. It obtained the preferences of group based on the average of all user ratings in the group. Lin et al. [23] proposed a relationship-based group recommendation system according to the aggregation prediction strategy, and focused on the design of a quantitative method for member weight by measuring the correlation between users and their groups. Logesh proposed an activity and behavior-induced personalized recommendation system to predict persuasive POI recommendations [24]. It can be extended to recommend locations to user groups by exploiting relationships between users in the group.

3. Methodology

A POI group recommendation algorithm based on collaborative filtering with intragroup divergence is present. Temporal and category influence is used to describe user behaviors and exploit the user’s preference of locations, respectively. Then, the group preference model is constructed by aggregating individual preference. The divergence of group members is taken into account as well. Given a group of users, a list of top-N recommended locations is returned for the group. We evaluate the performance of our algorithm with two datasets from Foursquare in the experiments.

3.1. Notation

Table 1 presents the check-in behaviors of users in New York City of Foursquare. Every user’s check-in record contains check-in time, user ID, POI ID, longitude, latitude of the POI, and category that the POI belongs to. Let U = { u 1 , u 2 , . . . , u n } be the set of users, and L = { l 1 , l 2 , . . . , l m } be the set of POIs. R indicates the check-in records made by users visiting to locations. Each entry r u j , l k in R represents the frequency of user u j visiting to location l k . Each location is encoded by longitude and latitude, and C = { c 1 , . . . , c | C | } is the category of locations, such as office, restaurant, coffee shop, airport and so on. For a location l l , it will belong to one categories at least l l C . Let G = { g 1 , g 2 , . . . , g | G | } be the set of groups. Given a group g U , POI group recommendation aims to recommend a list of POIs l L to g.

3.2. Framework of CFID

Algorithm 1 describes the framework of the proposed method. Given a group g, a list of ranked POIs is returned for the group. It is able to fully integrate category and temporal influential features to improve the quality of POI recommendation. In the first phase, we attempt to learn users’ latent preference for POI. We construct the preference vector of a user after analyzing the user’s check-in behaviors and it consists of two parts, one is the preference vector of different users on location categories, and the other is the preference vector of different users on time. Then, we get a group preference feature model based on the user preference feature vector. We propose a group member consistency probability factor as the fuzzy degree of group represented by η u g to aggregate each member’s feature to get the preference by a group. We take a group as a virtual user, then the similarity computation between a group and a user is based on Equation (12). We calculate the similarity between the group and the user based on the check-in records and feature vector separately. Next, it is based on the idea that the average access of friends to the location is taken as the user’s access to the location. The inconsistency of members’ visiting locations in a group is regarded as the divergence degree of the group. For each candidate POI, the preference rating of POI for group is computed based on collaborative filtering and intragroup divergence, separately (line 5 to line 9 in Algorithm 1). Additionally, the final recommendation preference score that a group will visit POI is shown in Equation (17), the recommended results are determined by the items with different weights. It is based on the collaborative filtering result and is also restricted through the divergence. To sort the preference score of group f g , l and return the top-N POIs with higher preference score.
Algorithm 1. CFID algorithm.
Input: 
The group g, users’ check-in frequency matrix R
Output: 
Top-N POIs
1:
extract user preference of location categories M u C based on Equation (3)
2:
extract user preference of time feature M u T based on Equation (4)
3:
get group preference M g based on Equation (9)
4:
similarity between a group and a user computation based on Equation (12)
5:
for each l L  do
6:
 get group preference f g , l based on colloborative filtering
7:
 get group divergence d g , l based on intragroup divergence computation
8:
 compute f g , l based on Equation (17)
9:
end for
10:
sort f g , l in descending order
11:
return Top-N POI

3.3. User Preference Model Construction

(1) Construct the preference of user on category. Each POI has its latitude and longitude, and each POI can belong to a category. For example, a POI belongs to the restaurant, gym, park, entertainment and so on. We can first construct the category feature vector of POI l denoted as V l c = ( f l , c 1 , f l , c 2 , . . . , f l , c i ) . Where f l , c 1 = 1 , if POI l belongs to c 1 , and f l , c 1 = 0 , otherwise.
As shown in Table 1, each user has its own preference, and he will visit different POIs. Furthermore, in order to obtain the user’s preference for categories from the user’s access records to POIs, a computation method similar to TF-IDF is present to calculate the user’s preference for the category. TF-IDF (term frequency inverse document frequency [25]) is to evaluate the importance of a word to a document, which is commonly used in the domain of information retrieval and text mining. The importance of a word increases with the frequency of its appearance in the document, but decreases with the frequency of its appearance in the corpus. The TF-IDF is shown in Equation (1).
T F I D F = f ( t i , d j ) m = 1 k f ( t m , d j ) × l o g n n ( t i )
where f ( t i , d j ) denotes the frequency of word t i in document d j , and n represents the number of documents.
In particular, by considering a location category as a word, and considering a user’s check-in behavior as a document. Similar to TF-IDF formula above, the formula for the degree of preference of user u to the category feature c is shown in Equation (2), it is to estimate the importance of a location category to a user.
p u , c = k = 1 m r u , l k × f l k , c k = 1 m r u , l k × l o g k = 1 m i = 1 C f l k , c i k = 1 m f l k , c
where r u , l k denotes the visiting frequency of user u for location l k in check-ins. f l k , c i is the category feature model for POI l. k = 1 m r u , l k × f l k , c indicates the frequency of user u visiting the locations belonging to category c in its check-ins. C denotes the category of locations. Here I D F is expressed as the ration of total number of all categories in all locations to the number of location belonging to category c. A location can belong to more than one category. Then the category feature model of user can be represented by Equation (3), and p u , c is the preference value of user on category c.
M u c = ( p u , c 1 , p u , c 2 , . . . , p u , c i )
(2) Construct the preference of user on time. As seen from Table 1, it is to be observed that the user has different activities at different times. Time factor plays an important role in analyzing users’ preferences. The locations visited by users in different time slices of the day are also very different. For example, some users like to go to gym at night, but some users like to go to the gym at noon. Moreover, users’ POI preferences on weekday are also different from those on weekend. On this basis, in order to construct the user’s time preference model, time of a day is divided into periodic time slots (e.g., by hour), what is more, we divided the time of day into four parts { T 1 , T 2 , T 3 , T 4 } . T 1 denotes 7–12 h for morning, T 2 denotes 13–18 h for afternoon, T 3 denotes 19–24 h for evening, and T 4 denotes 1–6 h. In order to fully reflect the concept of week by time, we have added T 5 to represent whether the day is weekend or not. T 5 = 1 if it is weekend, T 5 = 0 , otherwise. Thus, the preference model of user u j for different time period is constructed as shown in Equation (4).
M u T = ( p u , t 1 , p u , t 2 , p u , t 3 , p u , t 4 , p u , t 5 )
where p u , t k = n u , t k k = 1 4 n u , t k . n u , t k denotes the vising frequency of user u in the time period t k , and p u , t 5 denotes the ratio between the frequency of user u visits during the weekend and the frequency of visits at all times. Each entry in M u T is expressed as the preference of user u for each time.
For example, a user always prefers to visit restaurants at noon and bars at night. We believe that the user’s visits in the four time periods within a day can represent the user’s time preference to some extent. At the same time, the concept of time “week” is also within our consideration. The user’s visit frequency on weekdays and weekends can reflect the user’s visit characteristics during the week. Thus, the time feature vector of the user is constructed as:
M u = ( M u C , M u T ) = ( p u , c 1 , p u , c 2 , . . . , p u , c i , p u , t 1 , . . . , p u , t 5 )
We combine user category characteristics and time characteristics to represent user characteristics. Then, the user’s feature vector is shown in Equation (6).
M u = ( p u , m 1 , p u , m 2 , . . . , p u , m k )

3.4. The Group Preference Model Construction

In the previous section, we obtained the feature vector of each user by integrating the user’s category feature and time feature. It was composed of the predicted value of user preference for category and user preference for time. For a group with a set of users, users in the group will have intragroup influence. Therefore, to construct the feature vector of a group, we aggregated member preferences into group preference by taking the intragroup influence of users. How to measure the intragroup influence of users is an open problem. We obtained the intragroup influence of users according to calculating the affinity of user with other members from the perspective of location. It is known that if a user has visited locations that are also visited by others, then the user will have a close relationship with others. Consequently, we calculate the probability of whether the location visited by each user in the group is visited by other users to express the current user’s affinity in the group. η u g is defined in this paper to reflect the importance of the user in the group feature preference. The formula is:
η u g = L u L u , g L u
where L u represents the POI visited by user u in the group, L u , g represents the set of locations visited by other users in the group except for user u, and η u g denotes the probability that the locations visited by user u are visited by other users in the group.
Among them, p u , m k represents the feature vector of users in the group. Here, the higher the value of η u g , the greater the probability that the place visited by the user u is visited by other people in the group. That is to say, the feature preference of the user u is closer to the feature preference of the group.
The preference of a feature m k of a group is constructed by aggregating the preference for the feature of each user in the group. It is calculated as follows.
p g , m k = u g p u , m k × η u g u g η u g
Thus, splice the preference of all the features to construct the group feature vector. The construction of the group preference model is shown as follows.
M g = ( p g , m 1 , p g , m 2 . . . p g , m k )

3.5. POI Group Recommendation Algorithm

Each group contains several users and the users have different preferences. Different from some researches which generate a POI list for each user and aggregate all users’ recommendations for the group, the group is regarded as a “user”. The group preference model construction process is described in the previous section, and each group is represented by a vector in this paper, then collaborative filtering algorithm is employed to obtain the preference POI of a group through similarity computation. Meanwhile, intragroup divergence is also taken into account to get group recommendation results, and we develop a novel group divergence computation method for candidate POIs. Finally, the score of the POI group recommendation is a linear combination of the results based on collaborative filtering and group divergence.
Collaborative filtering algorithm is one of the most widely used and successful methods in the field of recommendation system. Similarity computation is important for collaborative filtering algorithm. As we regard the group as a virtual user, and we recommend the POIs visited by users who have similar hobbies to this group. For any user v and a group g, the similarity between g and v is obtained by the following two parts:
(1) Similarity computation from feature preference perspective. We calculate the similarity of feature preference between the group and the user v. Here, the method to calculate the cosine similarity of the feature vector between them as the similarity relationship between them is shown as follows.
s i m g , v m = i = 1 M p g , m i p v , m i i = 1 M ( p g , m i ) 2 i = 1 M ( p v , m i ) 2
where p g , m i is the feature vector of group g, and p v , m i is the feature vector of user v.
(2) Similarity computation from users’ check-ins perspective. It is to calculate the similarity between the group and the user v based on the check-ins. To further get higher similarity results, we count historical check-in records of each member in the group. Then we compute the similarity between each member in the group and a user based on the check-in record. The average similarity of all group members and a user is expressed as the similarity of the group and a user.
s i m g , v u = 1 n ( g ) × u g l k = 1 L r u , l k r v , l k l k = 1 L ( r u , l l ) 2 l k = 1 L ( r v , l k ) 2
where r u , l and r v , l denotes the check-in information of user u in the group and user v, respectively. If user u has checked in at location l, r u , l = 1 . Otherwise, r u , l = 0 . s i m g , v u is the similarity based on historical records. n ( g ) denotes the size of group.
Furthermore, the similarity of a group and a user is a simple combination of s i m g , v m and s i m g , v u . Furthermore, we normalize the sum of the two and get the similarity between g and v. In summary, the preference similarity between group g and any user v is as follows:
s i m g , v = s i m g , v m + s i m g , v u
(3) Group recommendation based on collaborative filtering algorithm. After obtaining the similarity between group g and user v, we recommend the locations visited by users similar to group g through collaborative filtering. The result represents the preference of the group. For example, a group likes to go to location A. Then, the score of each location for the group can be computed based on collaborative filtering. While calculating results according to collaborative filtering, it is found that only users with high similarity to group g have affected recommendation results to the group g, so this paper designs a threshold θ in Equation (13) to constrain s i m g , v .
s i m g , v = 0 , i f s i m g , v < θ
Finally, we recommend the selected locations visited by users to the group through user based collaborative filtering. The calculation formula is:
f g , l = v U s i m g , v × r v , l v U s i m g , v
(4) Group recommendation based on intragroup divergence. Each group is composed of multiple users, so the overall preference of a group for POI is mainly determined by the different preferences of each member in the group. With the size of the group increasing, that is to say, the group is of three or more users, there is complex relationship within the group. Users in the group may have different opinions, and have disagreements about a location. Intragroup divergence is the preference difference of all users in the group for a location l. The most common method is to calculate the difference of visiting probability of any two members in the group to location l. To compute the probability of a user in the group for location l, we have introduced the concept that if a friend of user u has visited location l, then it has a high probability of being recommended to user u. The probability of user u to location l can be calculated by the check-ins of u s friends.
Regarding the calculation of the degree of divergence within the group, we use the formula to calculate the divergence relationship between the historical visits of the group. As shown in Equation (15), to compute the degree of divergence of the group d g , l by considering the relationship between any two members in the group.
d g , l = 2 n ( n 1 ) × | δ ( u , l ) δ ( u , l ) |
where δ ( u , l ) δ ( u , l ) represents the divergence of two members for each location. δ ( u , l ) denotes the probability of a user in the group for lcoation l. The calculation formula of δ ( u , l ) is shown in Equation (16). n denotes the size of group.
δ ( u , l ) = 1 | A u | × v A u r ( v , l )
The number of friends visited by each user in the group, and A u is the set of friends of user u (similar to user u), where r ( v , l ) indicates whether user v has checked in location l. If so, r ( v , l ) = 1 ; otherwise, r ( v , l ) = 0 .
The disagreement of users in the group on location l is manifested in the differences of users in the group on location l. We believe that the preference of users in the group for location l can be computed by calculating whether the user’s friend collection has visited the location. If the user’s friends have visited the location, it means that the user may be willing to visit the location. Therefore, the percentage of friends visiting the location in the friend collection are taken as the user’s preference for location l in the group.
Finally, The POI group recommendation result can be obtained based on Equation (17). It combines the similarity and divergence within the group. f g , l denotes a new preference value for a group. The divergence degree of users has a negative impact on the final recommendation score. The top-N POIs with larger values are selected as the recommendation for a group to visit.
f g , l = α f g , l ( 1 α ) d g , l
In the above equation, α is a tuning parameter, and the value range is 0 to 1. It is related to group recommendation with different group size.

4. Experiments and Results Analysis

We introduce the experiments to compare the performance of our method with other three POI group recommendation methods named CFL, CFA, and CMFC, respectively. All the codes are implemented in Matlab, and all the experiments are conducted on a Windows PC with Intel i7 CPU and 8GB of RAM.

4.1. Data Set

The data collected from Foursquare [26] is used in our experiment to evaluate the proposed approach. It contains two long-term, real-time check-in datasets in New York City (NYC) and Tokyo (TK). New York City dataset contains consecutive check-ins from July 2012 to December 2013. Tokyo dataset contains consecutive check-ins from April 2012 to May 2013. The statistics of these two datasets are displayed in Table 2. New York City dataset contains 1083 users, 227,428 check-ins, and 38,333 locations. Tokyo dataset contains 2293 users, 573,707 check-ins, and 61,858 locations.
For POI group recommendation, we adopt a method commonly used in academic simulation proposed by Lu et al. [27] to generate preferred POIs for a group. The specific methods are as follows: If user u 1 , u 2 , u 3 in less than an hour time to visit POI l, and the three users are friends, then the three-person group u 1 , u 2 , u 3 preferred to the location l. As observed from Table 2, the number of two-person group of New York City and Tokyo is 2055 and 2129. In contrast, the number of multi-person group is lower than that of two-person group. In the experimental phase, we do POI group recommendation for two-person group and multi-person group, respectively.

4.2. Evaluation Metrics

To evaluate the performance of POI recommendation methods, three evaluation metrics are adopted in this paper. Precision of a group is described as the ratio of the number of POIs the group actually visited to the total number of POIs in the recommendation list. Recall of a group is described as the ratio of the number of POIs the group visited to the total number of POIs. Generally, given a group g, we denote the set of POIs which group actually visited in the testing set as T g , and the set of POI recommendation list by a method as R g ( N ) . Therefore, we use the average precision P r e c i s i o n @ N of each group to indicates the overall precision. Furthermore, the average recall R e c a l l @ N of each group to indicate the overall recall. The corresponding formulas are shown in Equations (18) and (19). In the experiment, the length of recommended POI list N is set 5, 10 and 20, respectively.
P r e c i s i o n @ N = 1 | G | g G | R g ( N ) T g | | R g ( N ) |
R e c a l l @ N = 1 | G | g G | R g ( N ) T g | | T g |

4.3. Comparison of Methods

In this paper, three algorithms are selected as comparative experiments. Two of them are based on collaborative filtering with Least-misery and average strategy, and one algorithm is based on context aware matrix factorization and intragroup divergence. We make a comprehensive comparison with three baseline methods.
(1) CFL (CF with the least misery strategy): CFL employs user-based collaborative filtering algorithm to estimate recommendation score of each user in the group for candidate POI, and it adopts the least misery strategy, which focuses on the user with the lowest score in the group to get the final result for group.
(2) CFA (CF with the average strategy): CFA employs user-based collaborative filtering algorithm to estimate recommendation score of each user in the group for candidate POI, and it adopts the average strategy, which calculating the average of these location scores of all users in the group as the final score of the group.
(3) CMFC (context aware matrix factorization with an improved group consensus function) [19]: CMFC firstly obtains the preference of the individual for POI based on matrix factorization, then it uses group decision strategy with group consistency and group divergence computation and ranking adjustment to get the predicting score of POIs and the top-N POIs with the highest score are the recommendation result of the group.

4.4. Experimental Results

4.4.1. Parameter Setting

Choosing the optimal parameter can maintain a high precision value for recommendation. The experimental results of optimizing the threshold parameter θ for New York City dataset and Tokyo dataset are shown in Figure 1 and Figure 2, respectively. In order to explore the influence of optimization parameter threshold θ on group recommendation, we tune the threshold from 0.4 to 0.9 by step 0.1 for a two-person group to calculate the influence of threshold θ on recommendation accuracy. It takes precision as the objective function to determine the parameter. As shown in Figure 1 and Figure 2, with the threshold parameter θ changing, the recommendation results show a trend of first increasing and then decreasing. In fact, the threshold value is for selecting similar users. The higher the value is, the similar the users are. The users with high similarity to the group (virtual user) can give more suggestions, and their opinions can be adopted by the group. When the threshold is low, the POI preferences of some users who are no longer particularly similar to the group are also recommended, thus reducing the accuracy of recommendation results. While the threshold is too large, some preference information of POIs is lost, and the selected similar users cannot recommend enough POIs for the group very well, so the performance declines. From Figure 1 and Figure 2, the optimal parameter θ is the experiment is 0.7 and 0.5 for New York City and Tokyo dataset separately.
Next, in the phase of group recommendation, it is based on collaborative filtering and intragroup divergence separately. The parameter α controls the weight of recommendation results for collaborative filtering and intragroup divergence. When the number of users in the group is more than three, users’ relationship in the group becomes complicated and they may have disagreement with POIs. When there are more members in the group and they do not have a common hobby, the disagreement between any two members in the group is considerable and complicated. In view of this situation, the number of users in the group affects the recommendation results. We divide the group recommendation into two-person group and multi-person group, and recommend their locations in the experiment section.
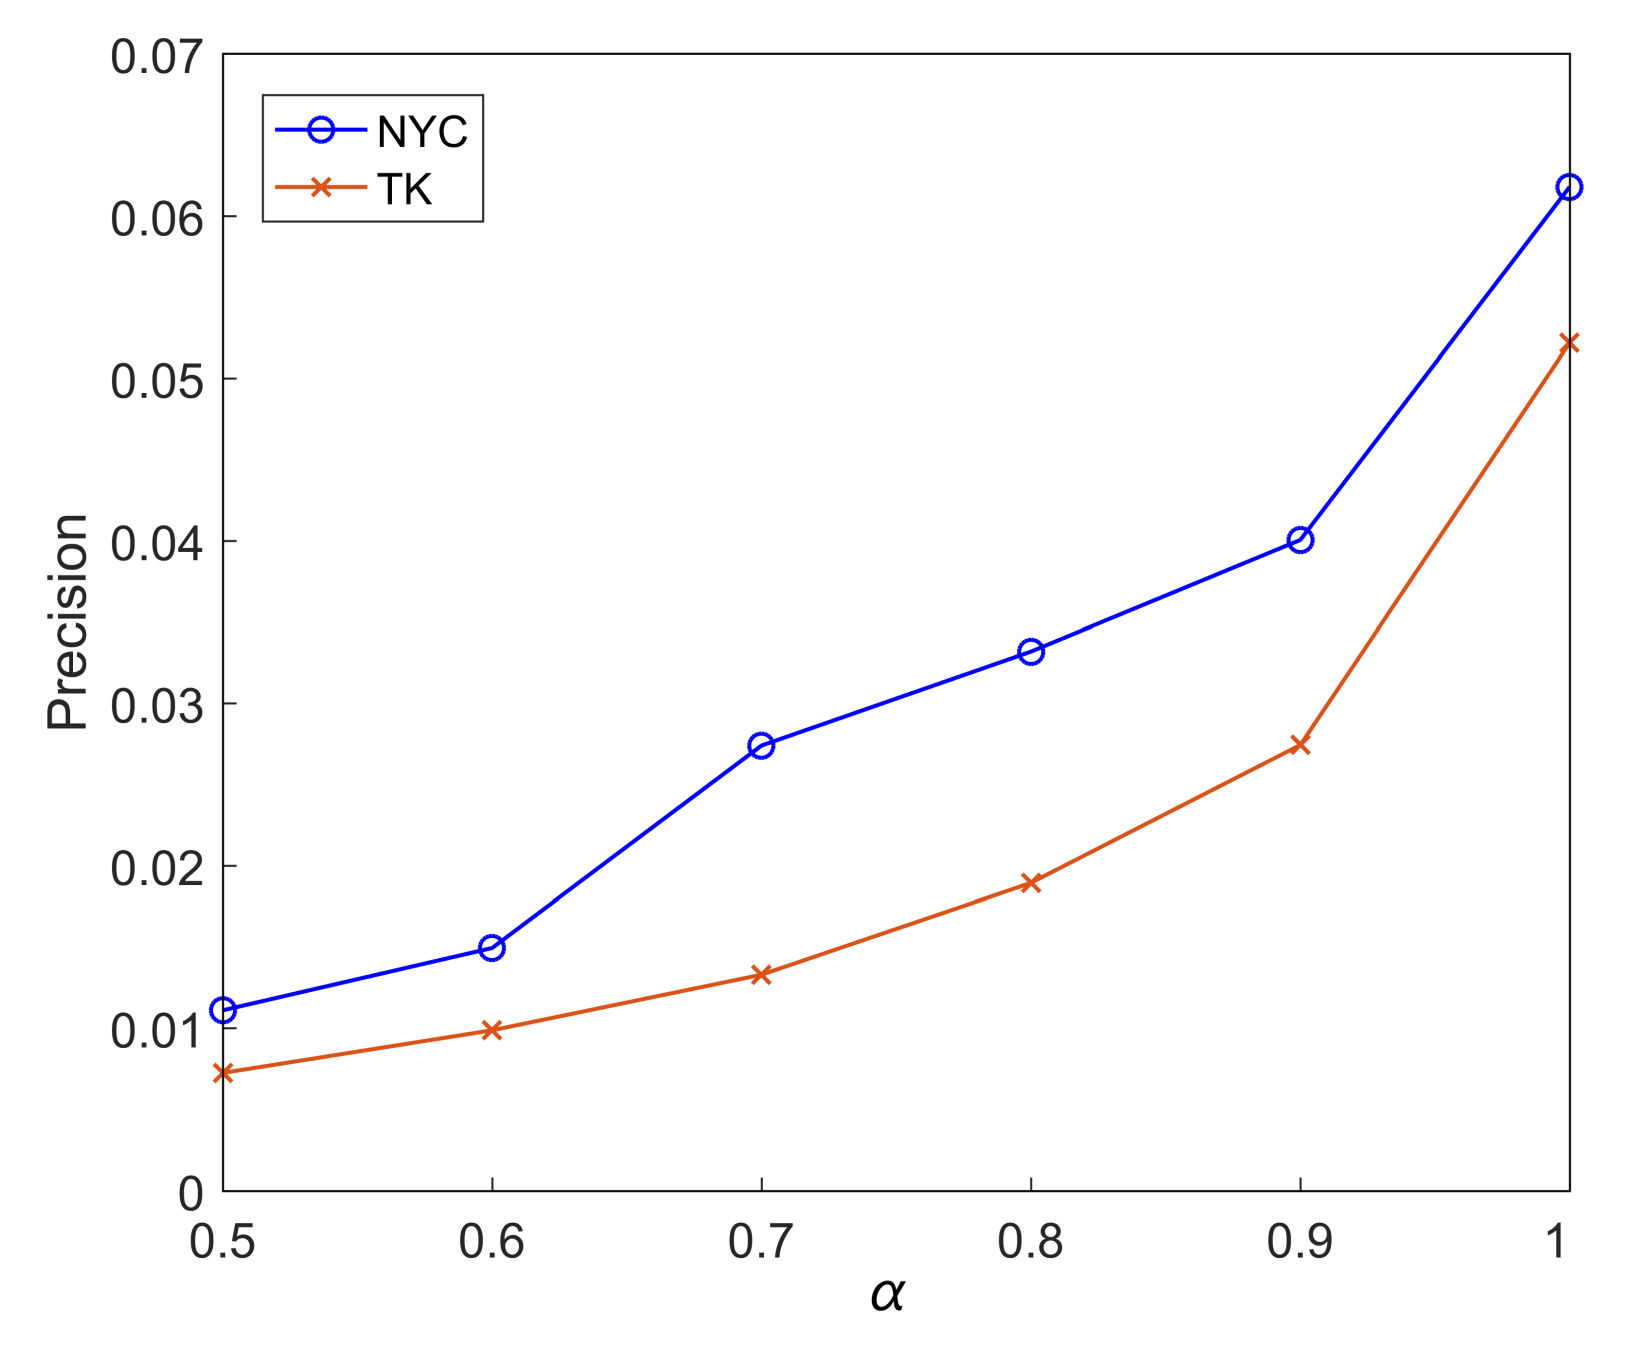
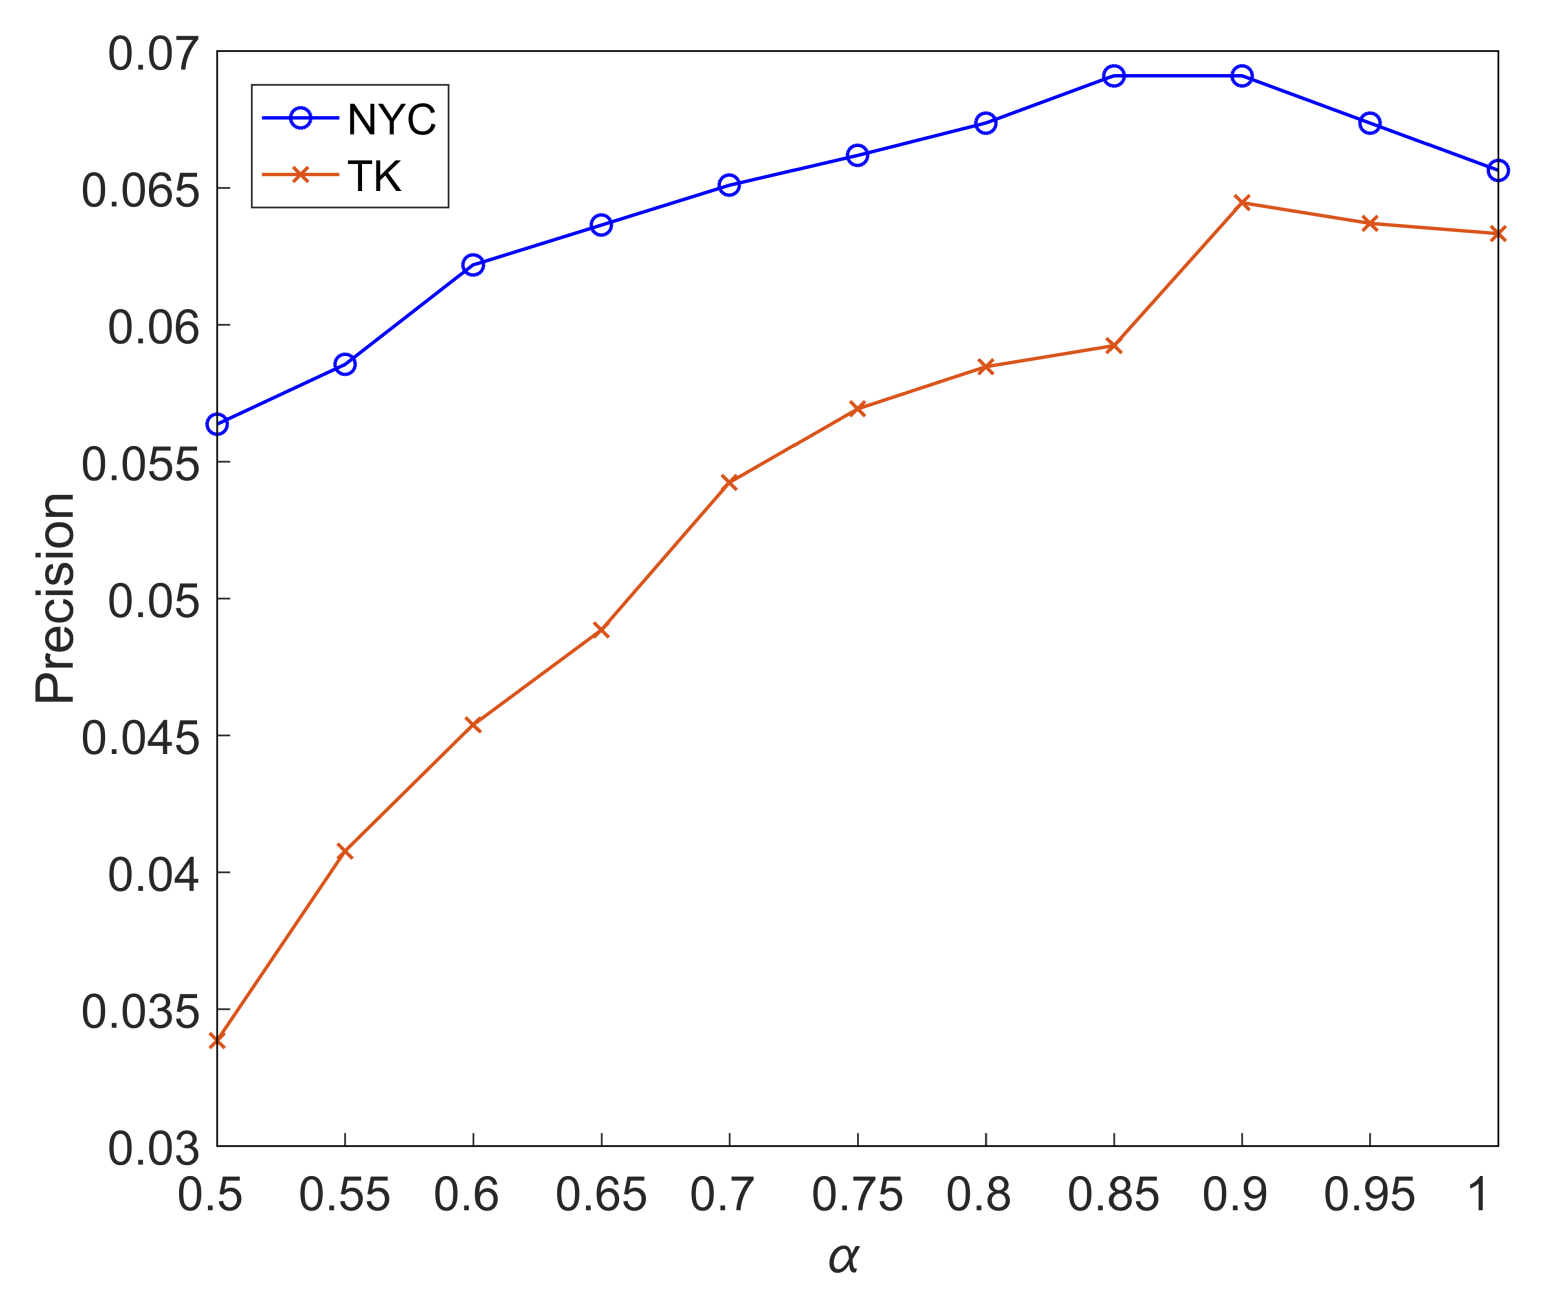
The parameter of the algorithm is tuned for achieving optimal performance. Here, we use a simple heuristic method to choose the value of parameter α , and we adopt the strategy of maximizing the value of P r e c i s i o n @ 10 to determine the optimal α value. Different precision values are obtained when α increases from 0.5 to 1 by step 0.1 and 0.05. Different value of α affects the performance of group recommendation with different group size. As is shown in Figure 3, when the parameter value α = 1 , the effect for two-person group recommendation is the best. When the number of members in the group is two, the group size is small, the relationship between users in the group is similar, and the similarity between any two members in the group is very high. This shows if a group of two users traveling together, the relationship between them is close and their hobbies are similar. They have no intragroup divergence. Furthermore, seen from Figure 4, the precision of top-10 recommendation achieves best when α is set to 0.85 for NYC dataset. It is observed that the optimal α is 0.9 for multi-person group recommendation for TK dataset. When there are more users in the group, the intragroup divergence will impact the recommendation result.

4.4.2. POI Group Recommendation Results

This part will present the experimental results of this group recommendation algorithm and other three comparative experiments. Each group is composed of multiple users, so the overall preference of a group for a POI is mainly determined by the different preferences of each member in the group. In this experiment, for groups with different number of members, we divided them into two-person group and multi-person group to carry out experimental verification analysis.
(1) The experimental results for the two-person group. Figure 5 plots the recommendation performance of the four algorithms for the two-person group on the NYC dataset. P r e c i s i o n @ N and R e c a l l @ N results of different recommendation algorithms are depicted in Figure 5a,b, respectively. With the increase in the number of recommended POI from 5 to 20, the accuracy presents a gradual downward trend, while the recall rate presents a gradual upward trend. It can be seen from the figure that the experimental results of CFL and CFA based on collaborative filtering with recommendation strategy are not good. Furthermore, the tendency of the histogram of CFL and CFA is nearly the same for N = 5 . Those two algorithms employ different strategies of aggregating each group member’s preference. However, there are differences in group recommendation performance under different conditions. The adoption of recommendation strategy and the recommendation results of group members may destroy the integrity of the group, and the preferences of group members are influenced by others in the group, so there are differences between group members’ preferences when they are in a group and those who are not in the group. CMFC algorithm aggregates individual recommendation results, and it calculates group differences by adding group divergence function, so it has better performance than CFL and CFA from the experimental results. In this paper, different from CMFC algorithm generating a list of top-N recommendation POIs for each user in the group, CFID takes the group as a whole through the establishment of group preference model, and CFID combines collaborative filtering algorithm with intragroup divergence computation. Therefore, the final group recommendation of CFID takes into account the integrity of the group and the difference of group members’ preferences. CFID is obviously better than the other three comparative test methods in accuracy and recall.
Detailed experimental results on the New York dataset are described in Table 3. It is found that P r e c i s i o n @ N and R e c a l l @ N of ours are higher than the other three algorithms when N is different. In a word, it shows that as N is changing from 5 to 20, the results of our method become slightly better. When the value of N is small, the algorithms can obtain better precision, and when the value of N is large, the algorithm can obtain better recall results. CFID gets the highest precision value of 0.06 when the number of recommendation location N is 10, and CFID obtains the highest recall value of 0.618 when the number of recommendation location N is 10. Take N = 5 for example, the precision of CFID is 0.1124, which is much higher than 0.0658, 0.0666 and 0.0818 of CFL, CFA and CMFC, respectively. So our algorithm nearly improves by 70.8%, 68.7% and 37.4% than CFL, CFA and CMFC. Meanwhile, the recall of our method is about 0.562 when N = 5 , which is much higher than 0.3294 and 0.4092 of CFL and CMFC, respectively. Therefore, our algorithm nearly improves by 70.6% and 37.3% than CFL and CMFC. The results indicate that CFID algorithm performs better than other three algorithms on New York City dataset.
Figure 6 shows the experimental comparison of two-person group recommendation results of four algorithms on Tokyo dataset. Compared with the baseline methods, our proposed POI group recommendation has better recommendation performance. Though the dataset TK is much larger than the dataset NYC, in the case of data overload, the other three experimental methods have a significant decline. For example, when the number of recommended locations is 10, the recall rate of CFA is 0.4477 for NYC dataset, while it is only 0.28 for TK dataset, and the performance of CMFC algorithm reduced from 0.5075 to 0.28. The recall of CFID is about 0.52 for TK dataset. CFID still performs well when the dataset is large. In a word, the experimental results of CFID have a greater improvement than the other three experimental algorithms.
Detailed experimental results on Tokyo dataset are described in Table 4. Note that precision and recall value obtained by our proposed method on Tokyo dataset are higher than other three algorithms. It is seen that precision value decreases and recall value increases, respectively, with the number of location recommendations varying from 5 to 20. Especially, take N = 10 for example, the precision of our method is about 0.0522, which is larger than 0.0247, 0.0283 and 0.0287 of CFL,CFA and CMFC, respectively. Therefore, the CFID algorithm nearly increases by 111.3%, 84.5% and 81.9%, respectively. Meanwhile, the recall of our method is about 0.6186 which is much higher than 27% and 20% of CFL and CMFC algorithm when N = 20 , respectively.
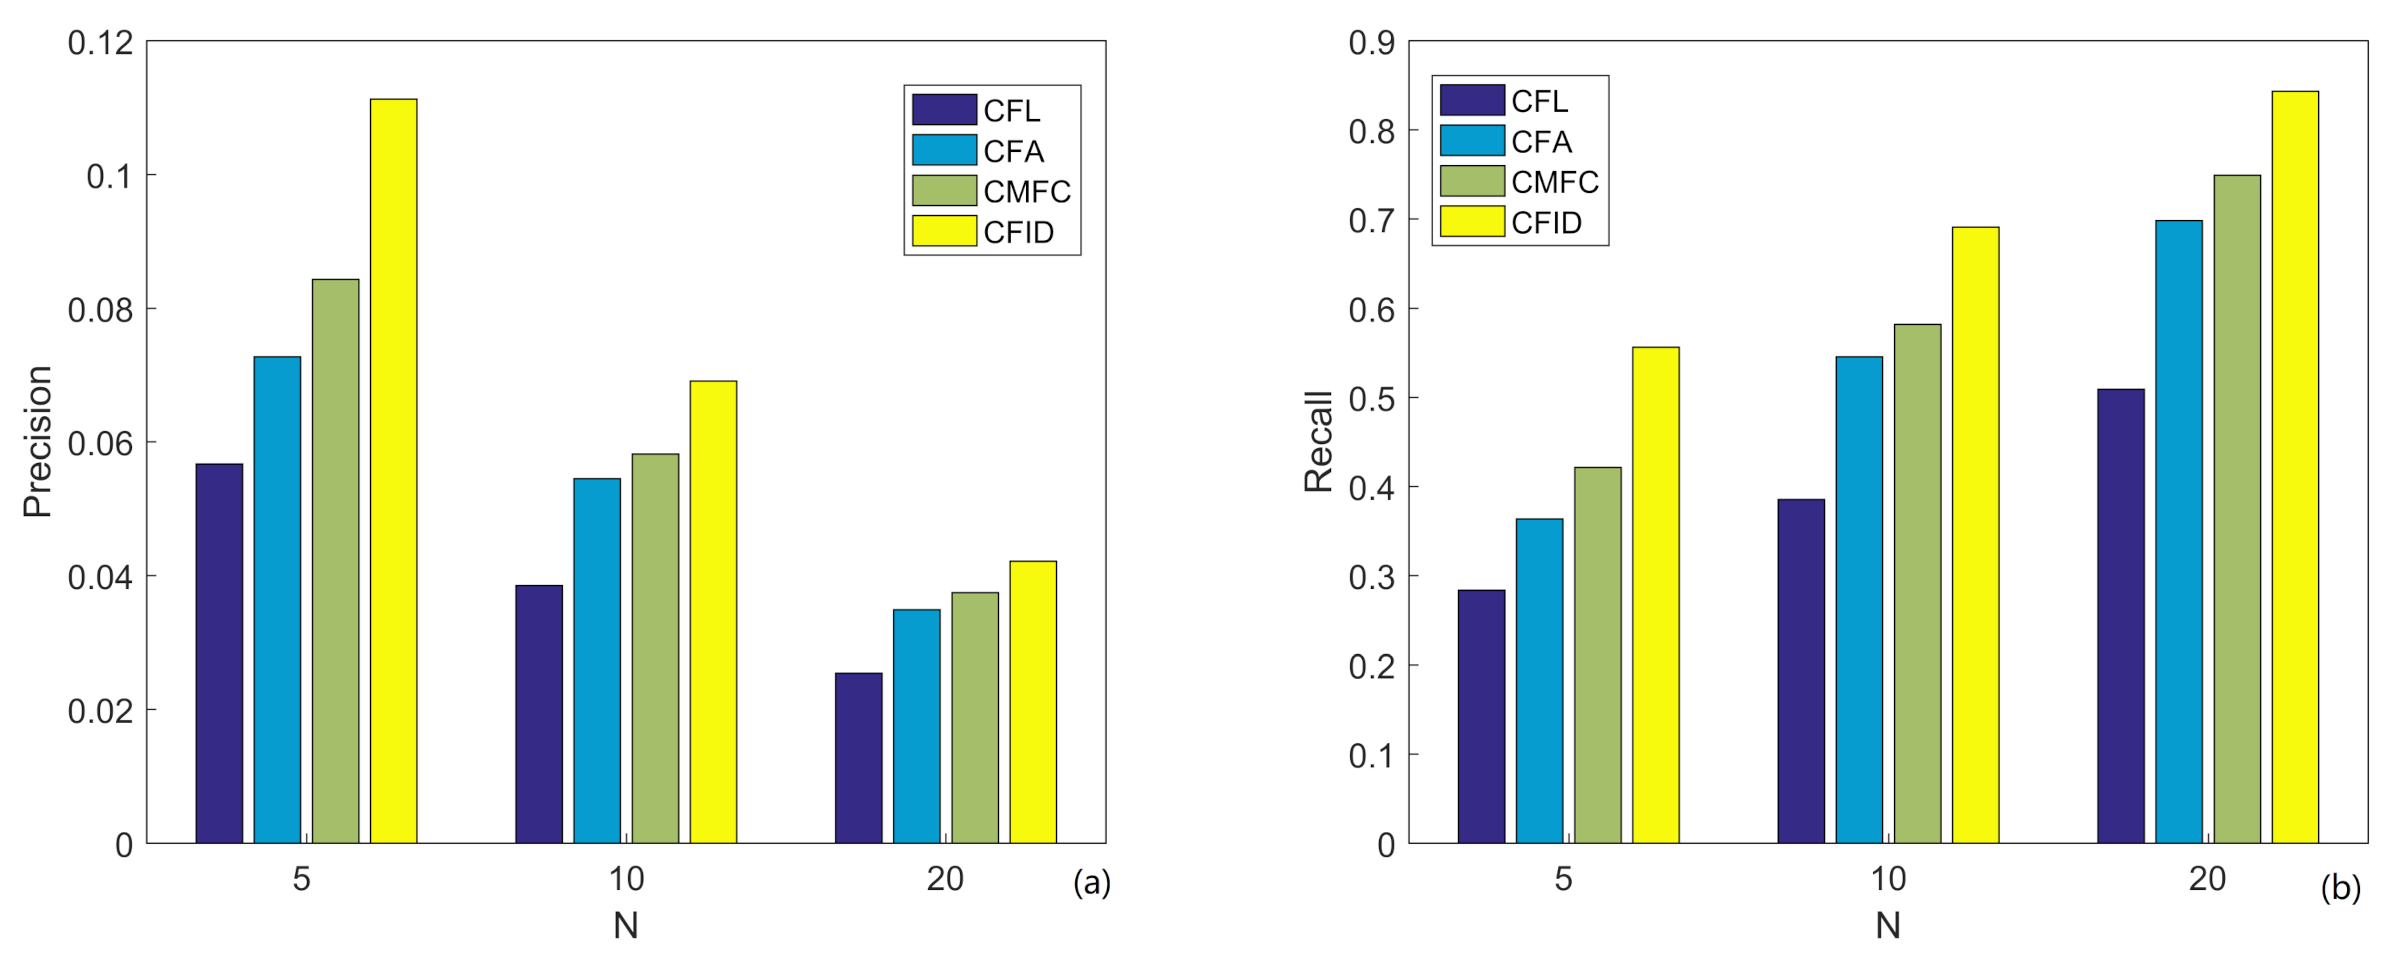
(2) The results of the multi-person group experiment. Table 5 shows the detailed results of the algorithm comparison on NYC dataset. Take N = 5 for example, the precision of our method is about 0.1112, and the corresponding value of CFL, CFA and CMFC are 0.0567, 0.0727 and 0.0843, respectively. Therefore, is CFID algorithm results are nearly 5.4%, 3.8% and 2.7% higher than CFL, CFA and CMFC, respectively. The improvement results indicate that the CFID algorithm performance is the best.
Figure 7 is a histogram of the P r e c i s i o n @ N and R e c a l l @ N of the four comparison algorithms on the NYC dataset. Comparing CFL with CFA, It is seen that when the group size is two, the difference between the average satisfaction strategy and the least misery satisfaction strategy is slight. When the number of members in a group is more than two, the average strategy is much higher than the least misery strategy, which shows that when there are more members in a group, CFA algorithms employing the average strategy considers all members in the group, and it performs better than CFL algorithm which considers only one member in the group. Furthermore, comparing the recommendation results of two-person group and multi-person group on NYC, the CFID method has higher accuracy and recall rate than the other three methods.
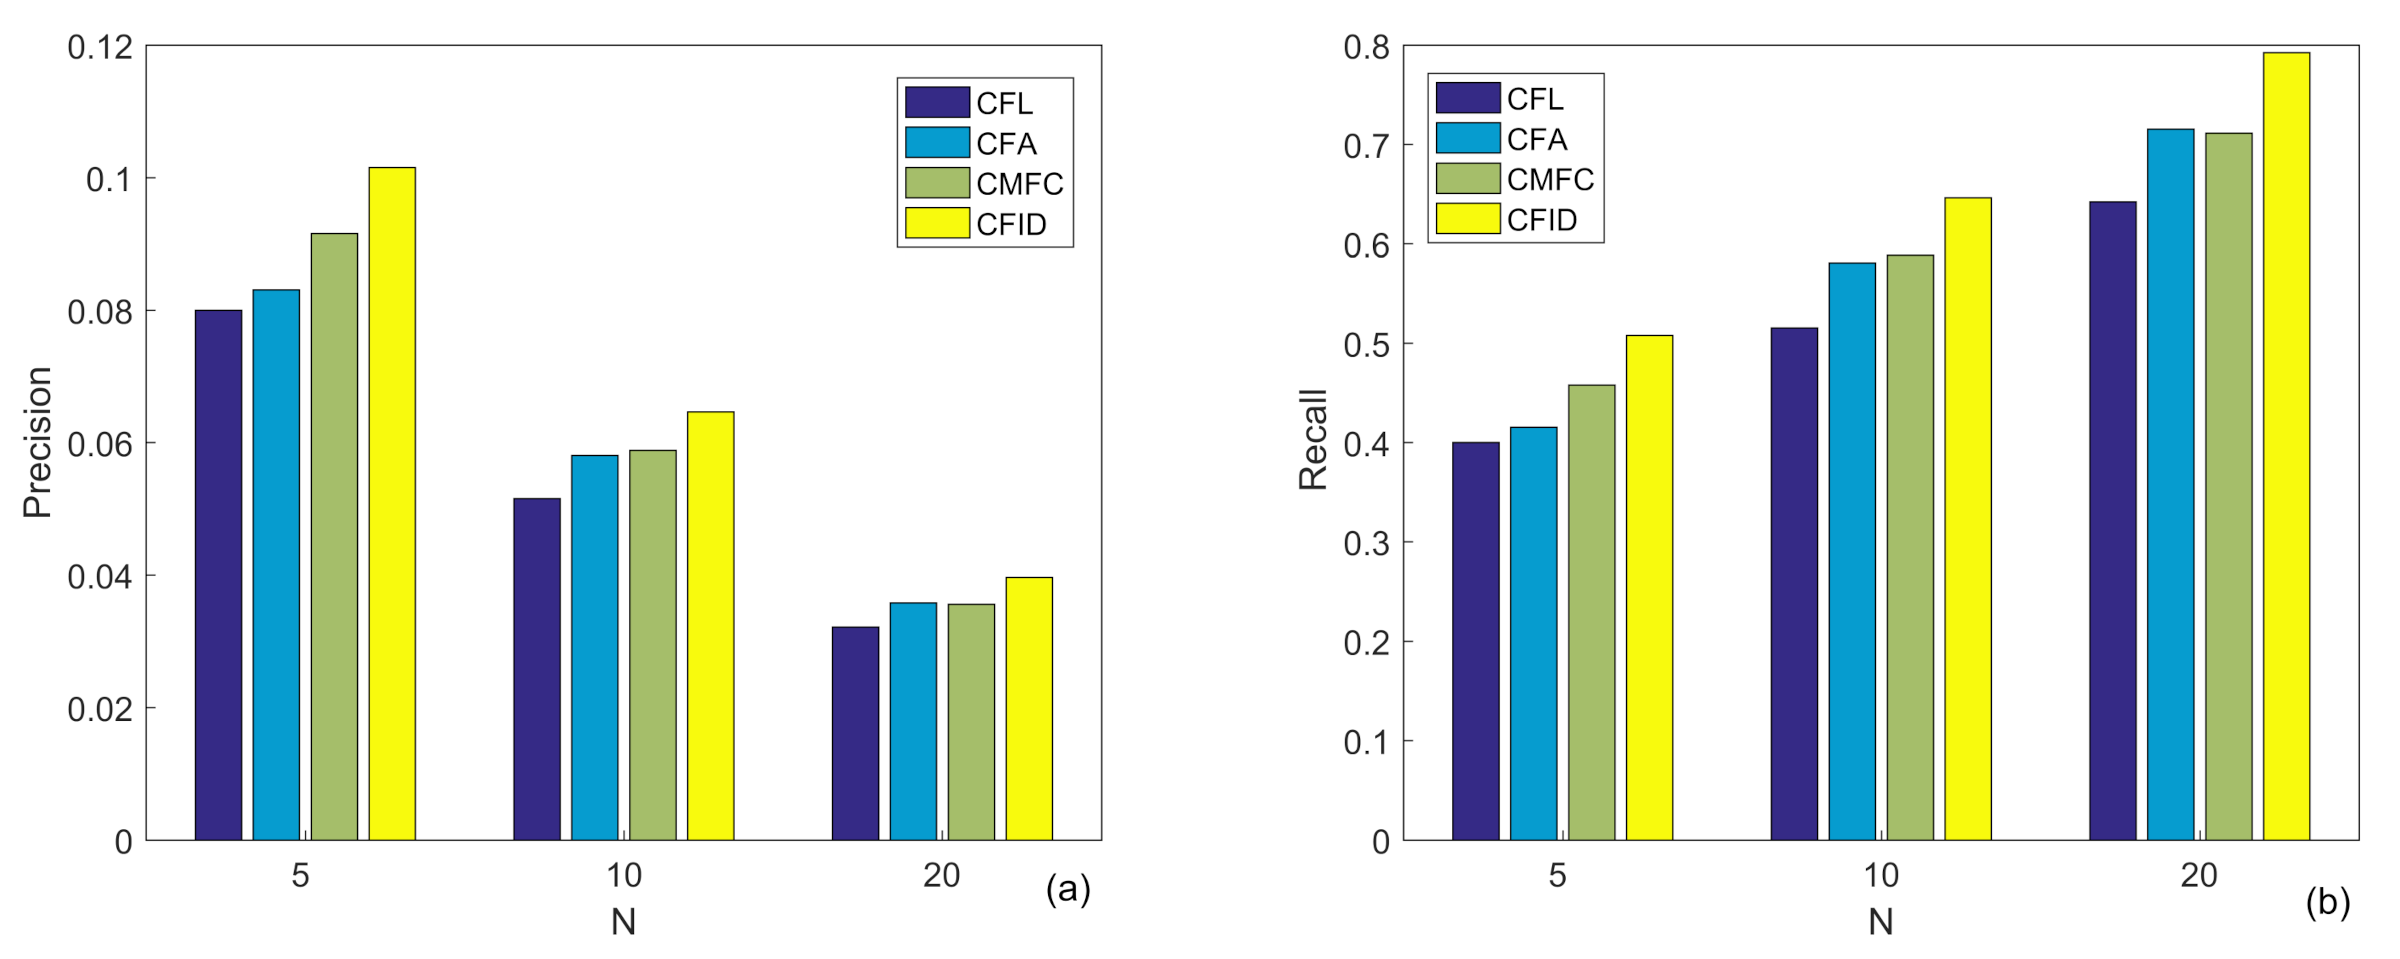
The detailed comparative results of four algorithms on Tokyo dataset are listed in Table 6. CFID algorithm has the highest accuracy and recall compared with CFL, CFA and CMFC. Significantly, the precision of ours is 0.0646 when N = 10 . Meanwhile, the precision value of ours when N = 10 nearly increases by 25.4%, 11.2% and 9.86% than CFL, CFA and CMFC algorithm, respectively. The improvement results indicate our algorithm performs better than others. The results show that the proposed method with intragroup divergence is better than CF algorithm with least misery strategy and average strategy for multi-person groups.
Figure 8 is a histogram of the precision and recall of the four comparison algorithms on Tokyo dataset. Seen from Figure 8a, with the number of recommended locations increasing, the precision value decreased. Especially, the precision value is about 0.1 when the length of recommendation location list is 5. Seen From Figure 8b, with the number of recommended location increasing, the recall value also increases. The recall value of ours obtains 0.051, which is much higher than CFL, CFA and CMFC when N = 5 , respectively. It obtains a good quality of precision and recall, which illustrates that the technique is reliable.

5. Conclusions

In this paper, a collaborative filtering algorithm with intragroup divergence for POI group recommendation is proposed. The innovation of this paper is mainly in three directions. Firstly, user preference vector is constructed based on the preference of user on time and category. In the aspect of group integrity, CFID algorithm takes the group as a virtual user, and a group feature preference model is established based on user’s category and temporal preference model. Secondly, we compute the similarity of the group and other users based on the preference vector and the users’ check-in information. Thirdly, in the aspect of calculating intragroup divergence, we develop a novel group divergence computation method for candidate POIs by analyzing the preference probability of all members in the group and their friends. It improves the result significantly by comprehensively considering the group integrity and difference. It studies the influence of group size on the results of group recommendation. The recommendation results of two-person group and multi-person group on two real datasets of Foursquare show that CFID algorithm has a significant improvement in terms of precision and recall compared with the other methods.
The next direction of the work is try to investigate other factors to construct the user preference model, and we will study POI recommendation algorithm on the basis of machine learning and deep learning technology.

Author Contributions

Conceptualization, M.Y., Y.L. and X.Z.; methodology, M.Y.; validation, M.Y. and X.Z.; formal analysis, M.Y.; writing—original draft preparation, M.Y. and X.Z.; writing—review and editing, X.Z.; supervision, Y.L.; funding acquisition, Y.L. and X.Z. All authors have read and agreed to the published version of the manuscript.

Funding

This research was funded by the National Natural Science Foundation of China under grants 61806083, 61872158; Excellent Young Talents Program for the Department of Science and Technology of Jilin Province of China under grant 20190103051JH.

Institutional Review Board Statement

Not Applicable.

Informed Consent Statement

Not Applicable.

Data Availability Statement

Publicly available datasets were analyzed in this study. These data can be found here: https://www.kaggle.com/chetanism/foursquare-nyc-and-tokyo-checkin-dataset/version/1.

Conflicts of Interest

The authors declare no conflict of interest.

References

  1. Zhao, X.G.; Zhang, Z.; Bi, C.; Sun, Y.J. A new point of interest group recommendation method in location based social networks. Neural Comput. Appl. 2020. [Google Scholar] [CrossRef]
  2. Xiong, X.; Qiao, S.J.; Han, N.; Xiong, F.; Bu, Z.; Li, R.H.; Yue, K.; Yuan, G. Where to go: An effective point of interest recommendation framework for heterogeneous social networks. Neurocomputing 2020, 373, 56–69. [Google Scholar] [CrossRef]
  3. Sojahrood, Z.B.; Taleai, M. A POI group recommendation method in location-based social networks based on user influence. Expert Syst. Appl. 2021, 171, 1–13. [Google Scholar]
  4. Guzzi, F.; Ricci, F.; Burke, R. Interactive multi-party critiquing for group recommendation. In Proceedings of the Conference on Recommender Systems (RecSys’11), Chicago, IL, USA, 23–27 October 2011; ACM Press: New York, NY, USA, 2011; pp. 265–268. [Google Scholar]
  5. Jameson, A.; Smyth, B. Recommendation to groups. In Adaptive Web; Springer: Berlin, Germany, 2007; pp. 596–627. [Google Scholar]
  6. Amer-Yahia, S.; Boy, S.B.; Chawlat, A.; Das, G.; Yu, C. Group recommendation: Semantics and efficiency. In Proceedings of the VLDB, Lyon, France, 1 August 2009; Volume 2, pp. 754–765. [Google Scholar]
  7. Baltrunas, L.; Makcinskas, T.; Ricci, F. Group recommendations with rank aggregation and collaborative filtering. In Proceedings of the 4th ACM Conference on Recommender Systems, Barcelona, Spain, 26–30 September 2010; pp. 119–126. [Google Scholar]
  8. Zhao, H.; Liu, Q.; Ge, Y.; Kong, R.; Chen, E. Group preference aggregation: A nash equilibrium approach. In Proceedings of the IEEE International Conference on Data Mining, Barcelona, Spain, 12–15 December 2016; pp. 679–688. [Google Scholar]
  9. Guo, L.; Shao, J.; Tan, K.L.; Yang, Y. Where to go: Personalized travel recommendation for individuals and groups. In Proceedings of the 15th International Conference on Mobile Data Manage, Brisbane, Australia, 14–18 July 2014; pp. 49–58. [Google Scholar]
  10. Li, C.T.; Huang, M.Y. Team formation with influence maximization for influential event organization on social networks. World Wide Web 2018, 21, 939–959. [Google Scholar] [CrossRef]
  11. Zhang, J.S.; Gartrell, M.; Han, R.; Lv, Q. GEVR: An event venue recommendation system for groups of mobile users. In Proceedings of the ACM Interactive Mobile Wearable Ubiquitous Technology, New York, NY, USA, 2 March 2019; Volume 3, pp. 1–25. [Google Scholar]
  12. Kompan, M.; Bielikova, M. Group recommendations: Survey and perspectives. Comput. Inf. 2014, 33, 446–476. [Google Scholar]
  13. Pessemier, T.D.; Dooms, S.; Martens, L. Comparison of group recommendation algorithms. Multimed. Tools Appl. 2014, 72, 2497–2541. [Google Scholar] [CrossRef] [Green Version]
  14. Nam, L.; Vy, H.; My, L.; Mai, L.; Gia, H.; Nhung, H. An approach to improving group recommendation systems based on latent factor matrices. In Proceedings of the SoICT 2019: The Tenth International Symposium on Information and Communication Technology, Ha Noi-Ha Long Bay, Vietnam, 4–6 December 2019; ACM: New York, NY, USA, 2019; pp. 98–105. [Google Scholar]
  15. Cantador, I.; Castells, P. Extracting multilayered communities of interest from semantic user profiles: Application to group modeling and hybrid recommendations. Comput. Hum. Behav. 2011, 27, 1321–1336. [Google Scholar] [CrossRef]
  16. Seko, S.; Yagi, T.; Motegi, M. Group recommendation using feature space representing behavioral tendency and power balance among members. In Proceedings of the 22th International Conference on World Wide Web, Rio de Janeiro, Brazil, 13–17 May 2013; pp. 495–504. [Google Scholar]
  17. Masthoff, J. Group modeling: Selecting a sequence of television items to suit a group of viewers. User Model. User Adapt. Interact. 2004, 14, 37–85. [Google Scholar] [CrossRef]
  18. Liu, X.; Tian, Y.; Ye, M.; Lee, W.C. Exploring personal impact for group recommendation. In Proceedings of the 21st ACM International Conference on Information and Knowledge Management, Maui, HI, USA, 29 October–2 November 2012; pp. 674–683. [Google Scholar]
  19. Zhu, Q.L.; Wang, S.G.; Cheng, B.; Sun, Q.; Yang, F.C.; Chang, R.N. Context aware group recommendation for point of interest. IEEE Access 2018, 6, 12129–12144. [Google Scholar] [CrossRef]
  20. Yuan, Q.; Cong, G.; Lin, C. Com: A generative model for group recommendation. In Proceedings of the 20th ACM SIGKDD International Conference on Knowledge Discovery and Data Mining, New York, NY, USA, 24–27 August 2014; ACM: New York, NY, USA, 2014; pp. 163–172. [Google Scholar]
  21. Carvalho, L.; Macedo, H. Users’ satisfaction in recommendation systems for groups: An approach based on noncooperative games. In Proceedings of the 22th International Conference on World Wide Web Companion, Rio de Janeiro, Brazil, 13–17 May 2013; pp. 951–958. [Google Scholar]
  22. Feng, S.; Cao, J. Improving group recommendations via detecting comprehensice correlative information. Multimed. Tools Appl. 2017, 76, 1355–1377. [Google Scholar] [CrossRef]
  23. Lin, K.H.; Chiu, Y.S.; Chen, J.S. An adaptive correlation based group recommendation system. In Proceedings of the International Symposium on Intelligent Signal Processing & Communications Systems, Chiang Mai, Thailand, 7–9 December 2011; pp. 1–5. [Google Scholar]
  24. Logesh, R.; Subramaniyaswamy, V.; Vijayakumar, V.; Li, X. Efficient user profiling based intelligent travel recommender system for individual and group of users. Mob. Netw. Appl. 2019, 24, 1018–1033. [Google Scholar] [CrossRef]
  25. Salton, G.; Buckley, C. Term weighting approach in automatic text retrieval. Inf. Process. Manag. 1988, 24, 513–523. [Google Scholar] [CrossRef] [Green Version]
  26. Yang, D.Q.; Zhang, D.Q.; Zheng, V.W.; Yu, Z. Modeling user activity preference by leveraging user spatial temoral characteristics in LBSNs. IEEE Trans. Syst. Man Cybern. Syst. 2015, 45, 129–142. [Google Scholar] [CrossRef]
  27. Lu, Z.; Li, H.; Mamoulis, N.; Cheung, D.W. Hbgg: A hierarchical Bayesian geographical model for group recommendation. In Proceedings of the 2017 SIAM International Conference on Data Mining, Houston, TX, USA, 27–29 April 2017; Society for Industrial and Applied Mathematics: Philadelphia, PA, USA, 2017; pp. 372–380. [Google Scholar]
Figure 1. Parameter θ setting for New York City dataset.
Applsci 11 05416 g001
Figure 2. Parameter θ setteing for Tokyo dataset.
Applsci 11 05416 g002
Figure 3. Parameter α for two-person group.
Applsci 11 05416 g003
Figure 4. Parameter α for multi-person group.
Applsci 11 05416 g004
Figure 5. Two-person group recommendation results of four algorithms on New York City dataset. (a) precision result; (b) recall result.
Applsci 11 05416 g005
Figure 6. Two-persongroup recommendation results of four algorithms on Tokyo dataset. (a) precision result; (b) recall result.
Applsci 11 05416 g006
Figure 7. Multi-person group recommendation results of four algorithms on New York City dataset. (a) precision result; (b) recall result.
Applsci 11 05416 g007
Figure 8. Multi-person group recommendation results of four algorithms on Tokyo dataset. (a) precision result; (b) recall result.
Applsci 11 05416 g008
Table 1. Check-in data on Foursquare.
User IDPOI IDPOI Category NameLatitudeLongitudeTime
1201178office40.68667−73.97845Sat Apr 07
20:24:10
303289coffee shop40.72645−73.99859Fri Apr 20
16:06:33
5268829bar40.71963−73.98954Wed Apr 11
23:08:33
..................
Table 2. Description information of the dataset.
DatasetNew York CityTokyo
users10832293
POIs38,33361,858
check-ins227,428573,707
two-person group20552129
multi-person group338220
Table 3. Comparative results for two-person group on New York City dataset.
Method Precision @ N Recall @ N
5102051020
CFL0.06580.04300.027450.32940.42970.5489
CFA0.06660.04480.02880.33280.44770.5752
CMFC0.08180.05080.03130.40920.50750.6268
CFID0.11240.06180.03300.56200.61800.6599
Table 4. Comparative results for two-person group on Tokyo dataset.
Method Precision @ N Recall @ N
5102051020
CFL0.03130.02470.01790.15640.24710.3574
CFA0.03380.02830.02060.16910.28280.4124
CMFC0.04060.02870.02120.20290.28700.4237
CFID0.08330.05220.03090.41660.52180.6186
Table 5. Comparative results for multi-person group on New York City dataset.
Method Precision @ N Recall @ N
5102051020
CFL0.05670.03850.02550.28360.38550.5091
CFA0.07270.05450.03490.36360.54550.6982
CMFC0.08430.05810.03750.42180.58180.7491
CFID0.11120.06910.04220.55620.69090.8436
Table 6. Comparative results for multi-person group on Tokyo dataset.
Method Precision @ N Recall @ N
5102051020
CFL0.08000.05150.03210.40010.51540.6423
CFA0.08310.05810.03580.41540.58080.7154
CMFC0.09150.05880.03560.45770.58850.7115
CFID0.10150.06460.03960.50770.64620.7923
Publisher’s Note: MDPI stays neutral with regard to jurisdictional claims in published maps and institutional affiliations.