Abstract
A bolt-connected precast reinforced concrete deep beam (RDB) is proposed as a lateral resisting component that can be used in frame structures to resist seismic loads. RDB can be installed in the steel frame by connecting to the frame beam with only high-strength bolts, which is different from the commonly used cast-in-place RC walls. Two 1/3 scaled specimens with different height-to-length ratios were tested to obtain their seismic performance. The finite element method is used to model the seismic behavior of the test specimens, and parametric analyses are conducted to study the effect on the height-to-length ratio, the strength of the concrete and the height-to-thickness ratio of RDBs. The experimental and numerical results show that the RDB with a low height-to-length ratio exhibited a shear–bending failure mode, while the RDB with a high height-to-length ratio failed with a shear-dominated failure mode. By comparing the RDB with a height-to-length ratio of 2.0, the ultimate capacity, initial stiffness and ductility of the RDB with a height-to-length ratio of 0.75 increased by 277%, 429% and 141%, respectively. It was found that the seismic performance of frame structures could be effectively adjusted by changing the height-to-length ratio and length-to-thickness of the RDB. The RDB is a desirable lateral-resisting component for existing and new frame buildings.
1. Introduction
A reinforced concrete (RC) shear wall is commonly used as an infilled lateral load-resisting component in RC frames for high-rise buildings. The RC frames with infill RC shear walls exhibited better performance compared with the traditional bare RC frames because of the insufficient lateral stiffness and resistance of RC frames. The frame columns and beams are used to resist the vertical loads and moments due to earthquakes, while the RC shear walls (RCSW) resisted the majority of shear forces [1]. The initial researches focused on different kinds of RCSW systems and conducted experimental and theoretical investigations on their seismic performance [2,3,4]. Furthermore, experimental and numerical studies were performed to analyze the mechanical behavior of different types of connections between RC walls and building frames [5,6,7]. However, the RC shear walls may exhibit oversized lateral stiffness resulting in an insufficient lateral deformation capacity of the structure with an insufficient load-carrying capacity. Besides, the shear force carried by the RC shear walls may be transmitted as tension or compressive force to the frame columns [8]. To prevent severe damage from occurring at the end of frame columns, strong columns must be designed to comply with the design principle of “strong frame, weak wall”. Furthermore, to meet the architectural requirements, the effects of different kinds of openings on the seismic performance of RCSWs also need to be investigated, which may make the seismic design of RCSWs more difficult.
Three major issues should be considered for the frames with RCSW systems. Firstly, a few RC shear walls might be placed in the first story for the stores and open lobbies due to the architectural demands. These buildings may have a soft first story if insufficient shear walls are placed in the first story compared to the upper stories [9]. Secondly, rapid repair and retrofit methods of a severely damaged component are desired for structures after an earthquake occurs [10,11]. The RC shear walls are commonly connected with frame columns and beams cast in place; thus, the frame columns and beams may be destroyed if the retrofit work is performed on the damaged walls. Lastly, the dimensions of the infill walls are determined by the dimensions of the surrounding frame. The lateral stiffness and resistance of the structure are mainly adjusted through the thickness of the walls. However, the thickness is a strict rule for the RC walls due to stability requirements [2]. Therefore, the lateral stiffness and resistance of the RC frames with RCSWs are difficult to change on a large scale to meet the optimization design of RC structures.
In the past decades, the RC wall panel (RCWP) was introduced by Kahn and Hanson [12] as a strengthening member to enhance the performance of RC structures. It was also proposed as a retrofit/repair strategy for the RC frames [13] because the member could be connected to structures with precast construction. Engineered cementitious composite materials (ECC) were proposed for RCWP due to their good performance to dissipate energies generated from earthquakes [14], and a series of experimental and theoretical investigations were performed. In recent years, many researchers have suggested that the RC walls should be separated with frame columns, including separating the RC infill wall from the RC frame by slits [15], and slitting the separated RC infill wall [9]. Other types of steel wall panels, such as double-skin wall panels [16] and panel wall strengthened systems [17,18,19,20], were proposed and analyzed. Different from the steel wall panels, the RC wall panels were commonly connected to the boundary frames with cast-in-place construction. Thus the RC wall panels are difficult to remove or repair. The precast concrete components or structures should be developed for the rapid construction of new structures and repairing existing damaged structures under seismic hazard, and it is important to guarantee the desired structural performance for the precast structures [21,22]. The connections are the key aspects of obtaining precast structures’ desired performance [23,24,25,26]. Therefore, a new type of connection could realize the rapid construction and replacement of RC wall panels and could also ensure the connecting performance between RC wall panels and boundary frames.
Based on the researches presented here, the bolt-connected precast reinforced concrete deep beam (RDB) is proposed in this paper. It connects to the frame beam with high-strength bolts. It exhibits some advantages to handle the above issues compared to the other RC walls for the following reasons. Firstly, the RDB can be flexibly placed, and thus it provides architectural space for the installation of doors and windows. Secondly, it can be easily assembled or removed from the bolted connection; thus, it can be rapidly and cost-efficiently fabricated in building repair or retrofit. Lastly, the length of the RDB could be selected in a wide range; thus, it can achieve a wide range of initial stiffness and lateral resistance. In addition, the main deformation of the deep beam is combining bending and shearing deformation; thus, RDB may exhibit better ductility by comparing it with the RC infill walls for relatively sufficient plastic development of materials. It is also a part of a project that uses a deep beam as a lateral resisting system.
In this study, experimental investigations of two precast reinforced concrete deep beam specimens that were 1/3 scaled were performed, and numerical studies of RDBs were conducted and verified by test results. The initial stiffness, as well as the mechanical behavior of the bolt connections, were also discussed and calculated. Such results provide information for the seismic design of bolt-connected precast RDB components.
2. Materials and Methods
2.1. Material Properties
In Table 1, the average cube compressive strength of concrete material, as well as the material performance of reinforcing bars, is presented. The concrete and reinforcement steel bars were designed as C30 and HPB235, respectively. Based on the Chinese standard GB50081 [27], concrete cube specimens taken from the batches of concrete were tested. Three repeatable specimens were fabricated with 28 days of standard maintenance, and the average values were used. For the high-strength bolts used in this paper, the yield strength was 800 N/mm2, and the yield-failure ratio was 0.8. The pretension force applied to each bolt was 125 kN.

Table 1.
Mechanical properties of concrete and reinforcing bars.
2.2. Test Specimens
In the test program, two bolt-connected precast reinforced concrete deep beams (RDB) were designed on a 1/3 scale and different height-to-length ratios (RDB-A and RDB-B were 2.0 and 0.75, respectively). The dimensions of these specimens and the test setup are shown in Figure 1. The height of RDBs was 900 mm, and the length was 450 mm for RDB-A and 1200 mm for RDB-B, respectively. The clear height of the specimens was 810 mm. The thickness of the specimens was 60 mm. The reinforcing bars were arranged at a distance of 75 mm, and the diameter was 8 mm.
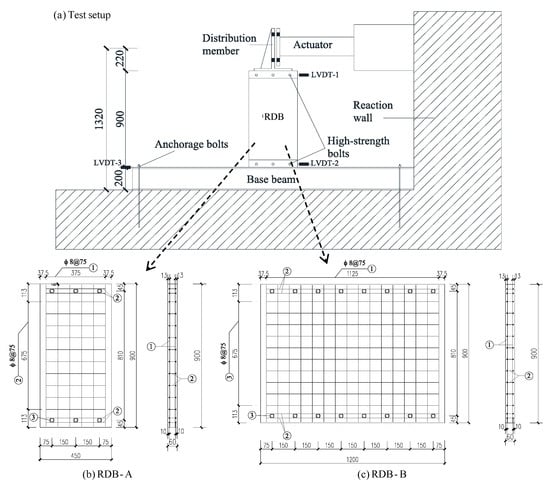
Figure 1.
Test setup and test specimens.
2.3. Setup and Measurements of Test Specimens
The construction details of the test device and the specimens are presented in Figure 2. To distribute the load in the RDBs more evenly, a distribution member was designed to connect to the actuator through M45 bolts. Two angles were placed at the two sides of RDBs, and these angles were equipped back-to-back to support the RDBs. M20 high-strength bolts were used to connect the angles and the RDBs. The angles were connected to the base beam and distribution member by M20 bolts, and they were connected to the strong floor by anchorage bolts. To ensure that no out-of-plane deformation developed in the specimens during the tests, two rigid beams were constructed to provide lateral supports. Two pairs of sliding constraints were installed between the rigid beams and the distribution member.
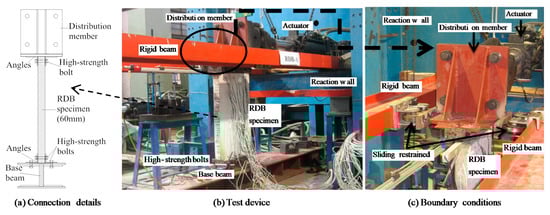
Figure 2.
Details of the test device, specimens, connection details and boundary conditions.
Three displacement-based linear transducers were used for measuring the lateral displacement of the specimen. They were placed at the two sides of the RDBs and the base beam, and they were used to measure the relative lateral deformation of the test specimens. The stress distribution of the RDBs was traced by uniaxial strain gauges, and they were placed along the reinforced bars to analyze the mechanical behavior of the RDBs, as presented in Figure 3. The loading pattern of the test specimens was designed based on the Chinese standard JGJ 101 [28], and it was controlled by displacement. The diagrams of the loading pattern are shown in Figure 4. An increment of 1 mm on displacement was used at the elastic mechanical stage, and the displacement did not repeat at the same loading level. The increment was increased at the elastic–plastic stage, and the displacement was repeated three times at the same loading level. Two methods were used to determine the yield displacement of the test specimens: some of the strain gauges exceeded the yield value, and the slope of the load–displacement curves decreased sharply.
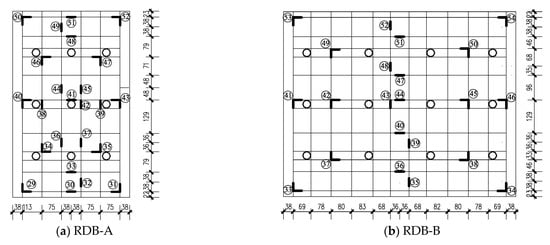
Figure 3.
Arrangement of uniaxial strain gauges on the reinforcing bars.
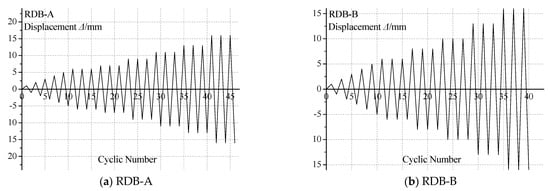
Figure 4.
Loading patterns for the test specimens.
3. Test Results
3.1. Failure Mode and Hysteretic Behavior
The RDB-A failed to combine with the bend and shear destroy. An inclined crack was found at the bottom of the deep beam at the 2 mm loading step. At this loading step, concrete spalling was observed at the top side corner of the deep beam, but the reinforcing bars were not exposed, as shown in Figure 5a. New cracks were observed at the corner and bottom of the specimen at the story displacement of 3 mm, and a major crack had obviously developed along the direction of 45° in a horizontal direction. When the displacement reached 5 mm, the concrete at the bottom corners was apparently crushed, as presented in Figure 5b, which resulted in exposing the stirrups. A crisp noise was produced from the high-strength bolts at this step. After that, a relative slip deformation was found, and the cracks developed quickly. The final failure pattern of the RDB-A specimen is depicted in Figure 5c.
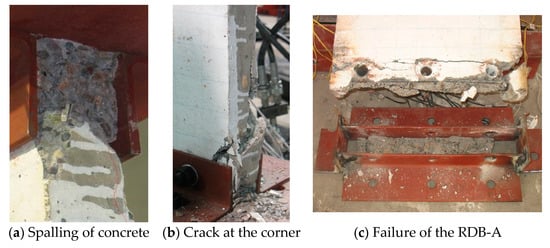
Figure 5.
Failure modes of the RDB-A.
The RDB-B failed, dominated by the shearing destroy. The first crack was found at the bottom corner nearby, with the first high-strength bolt at the story displacement of 2 mm. When the displacement had reached 3 mm, such cracks could not be closed, as shown in Figure 6a, and a crisp noise was heard from the high-strength bolts. The first diagonal crack was detected; it was formed along the direction of 45° in a horizontal direction when the lateral displacement was 5 mm, as shown in Figure 6b. After that, more other inclined cracks were formed at the center region of the deep beam. The final failure mode is presented in Figure 6c.
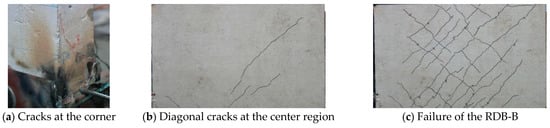
Figure 6.
Failure modes of the RDB-B.
The relation curves of lateral load and displacement curves of the specimens are depicted in Figure 7. The force and displacement results of some key points are presented in Table 2. When the height-to-length ratio of the RDB specimen decreased from 2.0 to 0.75, the ultimate capacity, initial lateral stiffness and ductility increased about 277%, 429% and 141%, respectively. The results indicated that the height-to-length ratio is an important factor in adjusting the strength and stiffness of the RDBs on a large scale.
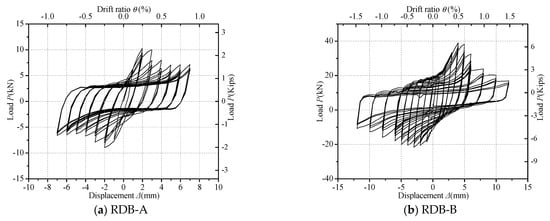
Figure 7.
Loading-displacement curves of the specimens.
Table 2.
Force, displacement and ductility results.
3.2. Ductility and Energy Dissipation
In this paper, the displacement-based ductility coefficient μΔ is utilized to represent the ductility performance of RDBs. The μΔ is determined by the displacements when the specimens yield and fail, and the calculation is μΔ = Δmax/Δy. The equal energy method is used to obtain the value of Δy. The failure displacement is defined as 85% times the maximum value [8]. The ductility results are listed in Table 2. The RDB-B exhibited better ductility than the RDB-A, indicating that the ductility of RDBs increases if the height-to-length ratio reduces.
To evaluate the energy dissipation performance of RDB specimens, the energy dissipation coefficient E is used. The detailed calculation and the diagram are shown in Figure 8a [8]. The energy dissipation coefficients of the test specimens in this paper are presented in Figure 8b. The results show that the energy dissipation coefficient decreases with the increase of the lateral displacement for the most part. The energy dissipation capacity of RDB-A is close to the RDB-B, indicating that the energy dissipation capacity of RDBs changes little by decreasing the height-to-length ratio. Due to the limited number of specimens, it should be highlighted that the effects of the height-to-length ratio on ductility and energy dissipation coefficient are not regular.
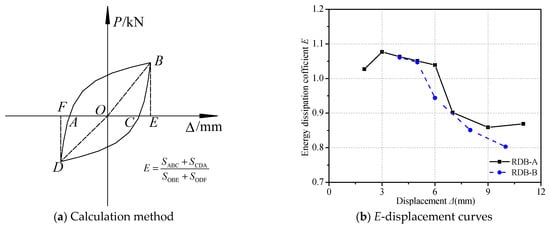
Figure 8.
Energy dissipation results of test specimens.
3.3. Elastic Stiffness
The boundary condition is an important factor to determine the stiffness as well as the ultimate strength of RC deep beams [29]. Thus, the boundary conditions of the RDBs can be simplified as a deep beam with fixed supports [8], and the idealized diagram is presented in Figure 9a. The initial stiffness of the RDB could be obtained by considering the bending deformation and shearing deformation of the RDB. The deformation diagram and force distribution diagram of the RDBs associated with lateral force F are shown in Figure 9b.
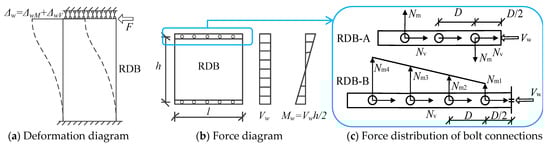
Figure 9.
Deformation and force diagrams for RDBs and bolt connections.
The lateral displacement of RDBs Δw is a combination of bending deformation ΔwM and shearing deformation ΔwV. The displacement of RDBs can be calculated based on the Graph Multiplication Method in basic theory in structural mechanics:
where Iw, Vw and A are the moments of inertia, shear force and section area of RDBs, respectively; Ec and G are the elastic modulus and shearing modulus of concrete. Thus, Equation (1) can be expressed as:
where h is the effective height and l is the effective length. The elastic lateral stiffness Ke is calculated as:
Table 3 presents the comparison of the elastic lateral stiffness of the test specimens obtained from Equation (3) and the tests. It was found that the error is no more than 20%, and the values derived from the equation slightly overestimate the lateral stiffness of the test specimens. It can be concluded that the imperfections of the specimens and uncertainty in test procedures were not considered in the equation. However, the overestimation can also be treated as safety reserves in the structural design of RDBs.
Table 3.
Comparison of elastic stiffness of the theoretical and experimental test results.
3.4. Mechanical Behavior of the Bolt Connection
The frictional types of high-strength bolts were used in the tests to transfer the shear forces. Thus, it is important to ensure the effectiveness and reliability of the bolt connections. In this paper, the mechanical behavior of the bolt connections is divided into two main phases; they are: (1) phase I, the carried shear force of a bolt is less than its friction force; (2) phase II, the carried shear force of a bolt is larger than its friction force.
A mechanical diagram of RDBs at phase I is presented in Figure 9c; the shear force of bolts generated from the lateral load (Nv) and bending moment (Nm) are included in the diagram. The lateral force is considered as an even distribution force on the bolts; the shear force of each bolt is determined as Nv = Vw/n, where n is the number of the bolts in a support of RDBs. According to Figure 9c, Mw = Vwh/2 = 0.405Vw for the RDB-A, thus the Nm = Mw/4D = 0.675Vw, and Nv = Vw/3. The largest shear force is 0.75Vw. For the mechanical diagram of RDB-B, Mw = Vwh/2 = 0.405 Vw and Nm4 = 0.225Vw, and Nv = Vw/8. The largest shear force is 0.26 Vw.
At phase II, due to the carried shear force of the bolts that exceeded the friction force, the bending moment is carried by the RDB, and thus the bolts carry the shear force solely. The largest shear force of the bolts is 0.33 Vw and 0.125 Vw for the RDB-A and RDB-B, respectively.
The shear force carried by the bolts in specimens is 10.35 kN and 39.06 kN for the RDB-A and RDB-B (Table 2), respectively. Thus the largest shear force is 7.76 kN and 10.16 kN in phase I for bolt connections in RDB-A and RDB-B, respectively, and the largest shear force is 3.42 kN and 4.88 kN in phase II for the bolt connections in RDB-A and RDB-B, respectively.
The friction force NvuI in phase I and shear resistance NvuII in phase II of the bolts used in this paper are:
where nf is the number of frictional faces of bolts; μ is the anti-sliding coefficient between bolts and angles, and it is determined as 0.3 according to suggestions [8]; P is the pre-tensile force, it is 125 kN in this study; d0 is the clear diameter of bolts, and it is 20 mm; fv is the yield shear strength of bolts, and it is 320 MPa.
Thus NvuI = 67.5 kN and NvuII =100.5 kN can be calculated according to Equations (4) and (5), and the calculated values represent the loading resistance of a high-strength bolt at the two phases. The calculated values are larger than the maximum shear force of the bolts during tests; thus, it can be concluded that high-strength bolts are safe enough in the test specimens. According to test results recorded by the LVDTs, there was also no slipping behavior or bolt-damage failure observed in the test specimens.
4. Numerical Study
4.1. Validation of Finite Element Model
The numerical study was performed by ANSYS, as presented in Figure 10, and the “Solid 65” and “Pipe20” elements were selected out to model the mechanical behavior of reinforced concrete. A bilinear model was used for the reinforcements, and the material test results such as the elastic modulus, yield stress and ultimate stress were derived from material test results. The concrete damage plasticity model in ANSYS was used for the concrete material in RDBs, because it considers the nonlinear behavior of concrete after it cracks or crushes. The compressive strength curve was taken from the compressive test results of the concrete, and the tensile cracking strength was estimated as 5.6% of the compressive strength. The 3D 8-node solid element captured the cracking and crippling behavior of the concrete. The same mesh sizes (50 mm) were used to mesh the model. The intersectant nodes in concrete elements and reinforcing bar elements were coupled together at the same positions so that they could cause consistent deformations. The boundary conditions of the bottom and top side of the concrete panel are considered as a fixed connection (at the bottom side, fixed the X, Y, Z, Rot X, Rot Y and Rot Z; at the top side, fixed the Y, Z, Rot X, Rot Y and Rot Z; the X-direction represents the direction that applied lateral loads). The lateral load is assumed as a uniform load to apply to the top side of the concrete panel in the finite element model, and this mechanical assumption was valid by Jiang et al. [8].

Figure 10.
Deformation and force diagrams for RDB.
The limitations of the modeling method are: (1) the effects of bolt connections, including the influence on stress concentration and the weakness on RC walls, are not considered in this model; (2) the bond-slipping deformation between reinforcements and concrete is not considered in the model.
The comparison between test and FEM results on lateral–loading curves and failure modes are presented in Figure 11 and Figure 12, respectively. There is a relatively close agreement between the test results and FEM results in the elastic and elastic–plastic stage. For the RDB-A, the peak shear force of RDBs during the tests and FEM analysis is 10.35 kN and 12.22 kN, respectively, and it is 39.06 kN and 45.24 kN for RDB-B specimen, respectively. The difference in maximum shear force value between tests and FE models is no more than 18%. Besides, the failure modes of FEM (Figure 12) can predict the position where concrete cracking is in the test specimens at the estimated boundary conditions. Thus, it can be concluded that the numerical method could effectively simulate the nonlinear behavior of the RDBs, especially for the ultimate lateral resistance of RDBs, even though the largest error is about 18%. However, the loading, deformation and degradation changing processes are basically predicted by the numerical method, and it is assumed that the method can be used for the following parametric study to analyze the effects of different parameters on the mechanical performance of RDBs.
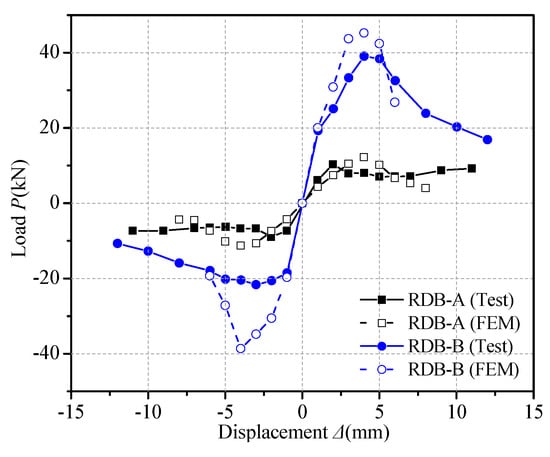
Figure 11.
Comparison of the load-displacement relationship between the test and FEM results.
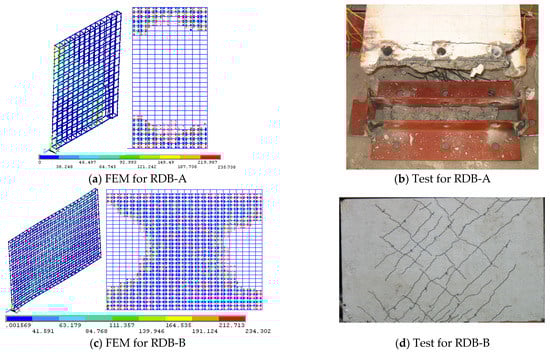
Figure 12.
Failure pattern comparison of the tests and FEM predictions.
4.2. Parametric Analysis Study
A parametric analysis was performed to summarize the effects on geometrical and material parameters based on the verified numerical modeling method in Section 4.1. The following parameters were considered: height-to-length ratio (α), height-to-thickness (β) and material type of concrete. The height of RDBs is determined as 900 mm, which is the same as the test specimens. The thickness of RDB includes 60 mm, 80 mm and 100 mm. The height-to-length ratio of RDB is ranged from 0.75 to 2.0. The compressive strength of concrete includes three types: 25 N/mm2 (C25), 30 N/mm2 (C30) and 35 N/mm2 (C35). Table 4 presents the detailed information of these RDB models. The effects on lateral loading–displacement curves with parameters of height-to-length ratio, height-to-thickness and material type of concrete are shown in Figure 13.
Table 4.
Parameters analyzed for RDBs.
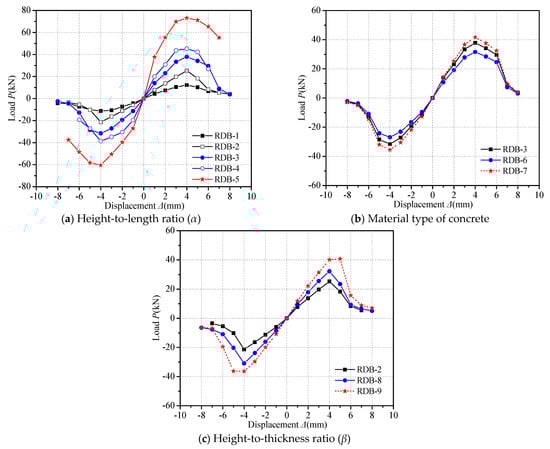
Figure 13.
Effects of parameters on seismic performance of RDBs.
As the results presented in Figure 13a show, it can be concluded that the height-to-length ratio of the RDB is showing a high contribution to the shear resistance of the RDBs. A higher height-to-length ratio of the RDB results in a higher shear resistance throughout all of the loading levels, as demonstrated by the test results. According to Figure 13b, it can be seen that the shear resistance of RDB is increasing with the increase in compressive strength of the concrete material. However, the increment is decreasing with the increase in the compressive strength. The shear resistance of RDB is obviously increasing with the decrease in the height-to-thickness ratio of RDB (see in Figure 13c), and such increment is increasing with the decrease in the height-to-thickness ratio of RDB.
Therefore, it can be concluded that the shear resistance of RDB can be efficiently strengthened by a large margin by decreasing the height-to-length ratio and increasing the height-to-thickness ratio of RDBs. However, the material type of concrete shows little effect on the seismic performance of RDBs.
5. Conclusions and Discussions
In order to understand the mechanical behavior and seismic performance of RDBs, two scaled specimens were designed and tested under cyclic loads, and the corresponding nonlinear FE models were established and verified. The conclusions are listed as follows:
- (1)
- The first crack formed at the corner of RDB-A due to large normal stress, but the first crack of RDB-B formed at the center region due to large shear stress. Besides, the RDB-A failed with a bending–shear failure mode for both typical horizontal and diagonal cracks that developed in the RDB-A; while the RDB-B failed with a shear dominating failure mode, as only diagonal cracks were observed in RDB-B. This indicates the bending–shear dominated mechanical behavior of RDB-A and the shear dominated mechanical behavior of RDB-B;
- (2)
- By comparing the RDB with the height-to-length ratio of 2.0, the ultimate capacity, initial lateral stiffness and displacement-based ductility of the RDB with a height-to-length ratio of 0.75 increased 277%, 429% and 141%, respectively. This indicates that the height-to-length ratio is a good choice to adjust the capacity and stiffness of RDB to cater to the performance requirement of building structures;
- (3)
- According to the parametric analysis, the shear resistance, elastic lateral stiffness and displacement-based ductility are significantly enhanced when decreasing the height-to-length ratio of RDB, which is similar to the test results. The height-to-thickness ratio shows a general influence on the seismic performance of RDBs, but the effect of concrete strength on the seismic performance of RDBs is relatively small.
The bolt-connected RC deep beam (RDB) proposed in this paper is quite different from other types of RC shear walls. The bending–shear mechanical characteristic of RDBs is a benefit for the plastic development of RC materials. The length of RDBs could be an effective parameter to adjust the lateral stiffness and resistance of frame structures, and the RDBs could be flexibly arranged to achieve the architecture requirement. According to the failure patterns of RDB specimens, the bolt connection was effective to ensure the performance utilization of RDBs. Thus, the bolt connection could be treated as a reliable connection for RC deep beam and boundary frames. The authors have conducted experimental and numerical analyses on steel frames with steel panel walls, RC panel walls and composite steel panel walls [17,18,19,20]. The aim of this paper is to investigate the seismic performance of RDBs solely and to understand the collaborative working relationship between the steel frames and RDBs. We found that the seismic performance of the steel frame with RDB specimens is better than the sum of the steel frame and the RDB based on the test results. Though the numerical model developed in this paper is simplified compared to the macroscopic model [20], the simple model proposed in this paper has relatively good accuracy in predicting the lateral resistance of RDB.
Author Contributions
Conceptualization, H.Z. and L.J. (Liqiang Jiang); methodology, J.L. and H.Z.; software, J.L. and H.Z.; validation, J.L., H.Z. and L.Z.; investigation, J.L., H.Z. and L.Z.; writing—original draft preparation, J.L. and L.J. (Liqiang Jiang); writing—review and editing, L.J. (Lizhong Jiang) and L.Z. All authors have read and agreed to the published version of the manuscript.
Funding
This research was funded by the National Natural Science Foundation of China, grant number 50678025.
Institutional Review Board Statement
Not applicable.
Informed Consent Statement
Not applicable.
Data Availability Statement
The results presented in this study are available on request from the corresponding author. The data are not publicly available due to the reason that the authors are conducting further analysis on the same structural model.
Acknowledgments
We would like to thank the editors and reviewers for the comments on the manuscript.
Conflicts of Interest
The authors declare no conflict of interest.
Nomenclature
| Py | yield strength; |
| Δy | yield displacement; |
| φy | yield drift ratio; |
| Pmax | maximum strength; |
| Δmax | maximum displacement; |
| φmax | maximum drift ratio; |
| μΔ | displacement ductility coefficient; |
| E | energy dissipation coefficient; |
| F | lateral force of the RDBs; |
| h | effective height of the RDBs; |
| l | effective length of the RDBs; |
| t | effective thickness of the RDBs; |
| Δw | lateral displacement of the RDBs; |
| ΔwM | bending deformation of the RDBs; |
| ΔwV | shearing deformation of the RDBs; |
| Iw | moment of inertia of the RDBs; |
| Ec | elastic modulus of the concrete; |
| G | elastic shear modulus of the concrete; |
| A | cross-section area of the RDBs; |
| Ke | elastic stiffness of the RDBs; |
| Ke-theoretical | theoretical elastic stiffness of the RDBs; |
| Ke-experimental | experimental elastic stiffness of the RDBs; |
| Vw | shear force of the RDBs; |
| Nv | shear force of a bolt due to lateral load; |
| n | the number of bolts; |
| Nm | shear force of a bolt due to bending moment; |
| D | distance between bolt connections; |
| NvuI | friction force of the high strength bolts at phase I; |
| NvuII | ultimate shear resistance of the high strength bolts at phase II; |
| nf | the number of frictional faces; |
| μ | anti-sliding coefficient; |
| P | pre-tensile force of the high strength bolts; |
| d0 | clear diameter of the bolts; |
| fv | yield shear strength of the bolts; |
| α | height-to-length ratio; |
| β | height-to-thickness ratio. |
References
- Tong, X.; Hajjar, J.F.; Schultz, A.E.; Shield, C.K. Cyclic behavior of steel frame structures with composite reinforced concrete infill walls and partially-restrained connections. J. Constr. Steel Res. 2005, 61, 531–552. [Google Scholar] [CrossRef]
- Wallace, J.W. Behavior, design, and modeling of structural walls and coupling beams—Lessons from recent laboratory tests and earthquakes. Int. J. Concr. Struct. Mater. 2012, 6, 3–18. [Google Scholar] [CrossRef]
- Xu, W.; Yang, X.; Wang, F. Experimental investigation on the seismic behavior of newly-developed precast reinforced concrete block masonry shear walls. Appl. Sci. 2018, 8, 1071. [Google Scholar] [CrossRef]
- Sun, L.; Guo, H.; Liu, Y. Experimental Study on Seismic Behavior of Steel Frames with Infilled Recycled Aggregate Concrete Shear Walls. Appl. Sci. 2019, 9, 4723. [Google Scholar] [CrossRef]
- Magliulo, G.; Ercolino, M.; Cimmino, M.; Capozzi, V.; Manfredi, G. Cyclic shear test on a dowel beam-to-column connection of precast buildings. Earthq. Struct. 2015, 9, 541–562. [Google Scholar] [CrossRef]
- Fischinger, M.; Kante, P.; Isakovic, T. Shake-Table Response of a Coupled RC Wall with Thin T-Shaped Piers. J. Struct. Eng. 2017, 143, 04017004. [Google Scholar] [CrossRef]
- Brunesi, E.; Peloso, S.; Pinho, R.; Nascimbene, R. Cyclic tensile testing of a three-way panel connection for precast wall-slab-wall structures. Struct. Concr. 2019, 20, 1307–1315. [Google Scholar] [CrossRef]
- Jiang, L.; Zheng, H.; Hu, Y. Experimental seismic performance of steel- and composite steel-panel wall strengthened steel frames. Arch. Civ. Mech. Eng. 2017, 17, 520–534. [Google Scholar] [CrossRef]
- Ju, R.-S.; Lee, H.-J.; Chen, C.-C.; Tao, C.-C. Experimental study on separating reinforced concrete infill walls from steel moment frames. J. Constr. Steel Res. 2012, 71, 119–128. [Google Scholar] [CrossRef]
- Gribniak, V.; Misiūnaitė, I.; Rimkus, A.; Sokolov, A.; Šapalas, A. Deformations of FRP–Concrete Composite Beam: Experiment and Numerical Analysis. Appl. Sci. 2019, 9, 5164. [Google Scholar] [CrossRef]
- Salih, R.; Zhou, F.; Abbas, N.; Mastoi, A.K. Experimental Investigation of Reinforced Concrete Beam with Openings Strengthened Using FRP Sheets under Cyclic Load. Materials 2020, 13, 3127. [Google Scholar] [CrossRef]
- Kahn, L.F.; Hanson, R.D. Infilled Walls for Earthquake Strengthening. J. Struct. Div. 1979, 105, 283–296. [Google Scholar] [CrossRef]
- Horii, H.; Kabele, P.; Takeuchi, S. On the Prediction Method for the Structural Performance of Repaired/Retrofitted Structures, Fracture Mechanics in Concrete Structures: Proceedings of FRAMCOS-3; AEDIFICATIO Publishers: Freiburg, Germany, 1998. [Google Scholar]
- Kesner, K.E.; Bilington, S.L. Investigation of infill panels made from engineered cementitious composites for seismic strengthening and retrofit. J. Struct. Eng. 2015, 131, 1712–1720. [Google Scholar] [CrossRef]
- Yanagisawa, M. An experimental study on structural performance of RC frame with non-structural slit wall-part 1 result of test. Proc. Architect. Inst. Jpn. 2008, 48, 261–264. (In Japanese) [Google Scholar]
- Hong, S.-G.; Cho, B.-H.; Chung, K.-S.; Moon, J.-H. Behavior of framed modular building system with double skin steel panels. J. Constr. Steel Res. 2011, 67, 936–946. [Google Scholar] [CrossRef]
- Jiang, L.; Zheng, H.; Liu, Y.; Yuan, X. Experimental investigation of composite steel plate deep beam infill steel frame. Int. J. Steel Struct. 2014, 14, 479–488. [Google Scholar] [CrossRef]
- Jiang, L.; Zheng, H.; Hu, Y. Effects of configuration parameters on seismic performance of steel frames equipped with composite steel panel wall. Struct. Des. Tall Spéc. Build. 2018, 27, e1542. [Google Scholar] [CrossRef]
- Jiang, L.; Jiang, L.; Hu, Y.; Ye, J.; Zheng, H. Seismic life-cycle cost assessment of steel frames equipped with steel panel walls. Eng. Struct. 2020, 211, 110399. [Google Scholar] [CrossRef]
- Jiang, L.; Jiang, L.; Ye, J.; Zheng, H. Macroscopic modelling of steel frames equipped with bolt-connected reinforced concrete panel wall. Eng. Struct. 2020, 213, 110549. [Google Scholar] [CrossRef]
- Lim, W.-Y.; Hong, S.-G. Cyclic loading tests for precast concrete cantilever walls with C-type connections. Earthq. Struct. 2014, 7, 753–777. [Google Scholar] [CrossRef]
- Singhal, S.; Chourasia, A.; Chellappa, S.; Parashar, J. Precast reinforced concrete shear walls: State of the art review. Struct. Concr. 2019, 20, 886–898. [Google Scholar] [CrossRef]
- Zoubek, B.; Fischinger, M.; Isaković, T. Cyclic response of hammer-head strap cladding-to-structure connections used in RC precast building. Eng. Struct. 2016, 119, 135–148. [Google Scholar] [CrossRef]
- Jiang, H.; Qiu, H.; Sun, J.; Yang, Y. Behavior of steel–concrete composite bolted connector in precast reinforced concrete shear wall. Adv. Struct. Eng. 2019, 22, 2572–2582. [Google Scholar] [CrossRef]
- Seifi, P.; Henry, R.S.; Ingham, J.M. In-plane cyclic testing of precast concrete wall panels with grouted metal duct base connections. Eng. Struct. 2019, 184, 85–98. [Google Scholar] [CrossRef]
- Kinnane, O.; West, R.; Hegarty, R.O. Structural shear performance of insulated precast concrete sandwich panels with steel plate connectors. Eng. Struct. 2020, 215, 110691. [Google Scholar] [CrossRef]
- GB/T 50081—Standard for Test Method of Mechanical Properties on Ordinary Concrete; Chinese Architecture & Building Press: Beijing, China, 2002.
- JGJ 101—Specification of Testing Methods for Earthquake Resistant Building; Chinese Architecture & Building Press: Beijing, China, 1997.
- Mansour, M.; El-Ariss, B.; El-Maaddawy, T. Effect of Support Conditions on Performance of Continuous Reinforced Concrete Deep Beams. Buildings 2020, 10, 212. [Google Scholar] [CrossRef]
Publisher’s Note: MDPI stays neutral with regard to jurisdictional claims in published maps and institutional affiliations. |
© 2021 by the authors. Licensee MDPI, Basel, Switzerland. This article is an open access article distributed under the terms and conditions of the Creative Commons Attribution (CC BY) license (https://creativecommons.org/licenses/by/4.0/).