Featured Application
The novel mechanical testing method for prosthetic feet presented here may be used by researchers and engineers to evaluate sagittal plane stiffness characteristics. The method gives comparable results to state-of-the-art biomechanical testing and can be beneficial for evaluating and optimizing a prosthetic foot before user testing.
Abstract
Energy-storing-and-returning prosthetic feet are frequently recommended for lower limb amputees. Functional performance and stiffness characteristics are evaluated by state-of-the-art biomechanical testing, while it is common practice for design engineers and researchers to use test machines to measure stiffness. The correlation between user-specific biomechanical measures and machine evaluation has not been thoroughly investigated, and mechanical testing for ramps is limited. In this paper, we propose a novel test method to assess prosthetic foot stiffness properties in the sagittal plane. First, biomechanical data were collected on five trans-tibial users using a variable stiffness prosthetic foot on a split-belt treadmill. Gait trials were performed on level ground and on an incline and a decline of 7.5°. The same prosthetic foot was tested on a roll-over test machine for the three terrains. The sagittal ankle moment and angle were compared for the two test methods. The dorsiflexion moment and angle were similar, while more variability was observed in the plantarflexion results. A good correlation was found for level-ground walking, while decline walking showed the largest differences in the results of the maximum angles. The roll-over test machine is a useful tool to speed up design iterations with a set design goal prior to user testing.
1. Introduction
The human foot is a complex mechanical structure containing twenty-six bones, thirty-three joints, and more than a hundred muscles, tendons, and ligaments [1]. By comparison, while their aim is to replace lost function of the biological foot, prosthetic feet are simpler and less adaptive. Energy-storing-and-returning (ESR) prosthetic feet are regularly fitted for medium to high active users. Since their first introduction in the 1980s, the design of ESR prosthetic feet has evolved and more complex devices have been engineered, fine-tuning their benefits [2,3]. During gait, the same basic principle can be applied to ESR prosthetic feet, where the composite leaf springs in the device store energy during load application and subsequently return the energy [4]. The stiffness of the elastic structures in the prosthetic foot depends on the geometry and materials used, so each prosthetic foot design has its own stiffness characteristics dictated by its design. During our research, we counted more than a hundred different ESR prosthetic feet available for lower limb amputees [4,5]. The large number of devices makes it difficult for the certified prosthetist and orthotist (CPO) to select the most appropriate prosthetic foot for each user. Every prosthetic foot type has its own stiffness category selection chart, which complicates the decision-making process. The CPO needs to select the “right” stiffness category by considering the user’s weight, mobility level, and impact level. Next, the CPO’s work continues with the alignment process, which needs to be adapted for each user based on visual evaluation of their gait and feedback. Advanced measurement tools are available to quantify the changes in alignment [6,7]; however, the success of the alignment depends highly on the dialogue between the prosthetist and the user to find the optimal adjustment settings.
Previous studies have measured the effect of ESR prosthetic foot stiffness on amputee gait [8,9]. However, the mechanical evaluation of prosthetic feet can be challenging as stiffness is design dependent [10]. Advanced test equipment for prosthetic foot testing could help during the design process and reduce the burden of user testing. Data collection on a machine representing values closer to biomechanical data during different gait tasks would help the communication between design engineers and biomechanical engineers. The ESR prosthetic feet have typically no evident center of rotation or articulation compared with the anatomical ankle joint, making it difficult to relate the investigation of stiffness characteristics to the mechanical deformations during the stance phase [11]. The functional joint center location provides a visual indication of the virtual ankle joint and depends on prosthetic foot design [12]. It is not clear how sagittal stiffness and functional joint center position are related.
In this study, our objective was to assess two methods of collecting data on the same prosthetic foot. State-of-the-art biomechanical analysis of amputee gait for level-ground and ascending and descending ramp walking was compared to a mechanical test machine simulating each gait task. A quality machine assessment can be beneficial for researchers to compare different prosthetic foot designs. Additionally, the user testing could be reduced during the design phase or stiffness characterization and therefore provide an additional tool for prosthetic foot designers.
Our specific aims were to (1) propose load and angle profile data for the machine roll-over test for level-ground and ramp walking, (2) collect sagittal ankle moment and ankle angle data on the test machine and on users and contrast the results with each test method, and (3) compare functional joint center positions for three different prosthetic foot stiffnesses between the two test methods for level-ground walking.
We hypothesized that an advanced mechanical test method can be used to evaluate prosthetic foot stiffness to compare roll-over test data with state-of-the-art biomechanical analysis of amputee gait for all tasks. We further hypothesized that there is a linear relationship between the maximum angles collected on the machine and on the users with increasing stiffness of the prosthetic foot. For example, as the prosthetic foot stiffness increases, the maximum measured angles on the machine and on users decrease.
The same prosthetic foot was used during the study to allow comparison across amputees and machine.
2. Materials and Methods
2.1. Prosthetic Foot Assessed
The device used in this study is the second version of the variable stiffness ankle (VSA) prosthetic foot (Figure 1). The VSA prosthetic foot allows for controlled adjustments of the sagittal prosthetic foot stiffness for each participant. The previously described first generation [13] of the VSA prosthetic foot is a combination of an ESR base prosthetic foot and an adjustable-stiffness unit with a fixed center of rotation around the pivot connection. Enhancements on the prototype device have been implemented to improve usability with a wireless communication to the control unit. The actuator used in the ankle unit is self-locking. This feature allows the control unit and the battery to be disconnected from the prosthetic foot during the walking trial, lowering the mass by 250 g and maintaining the prosthetic foot mass with foot cover at 1.1 kg.
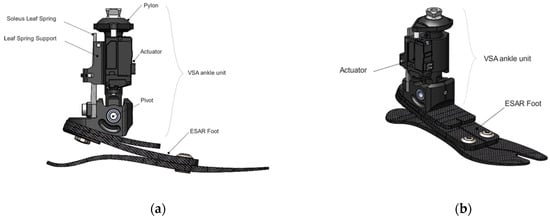
Figure 1.
VSA prosthetic foot drawing: (a) sagittal view and (b) isometric view.
The three stiffness conditions tested during this study are schematized in Figure 2.
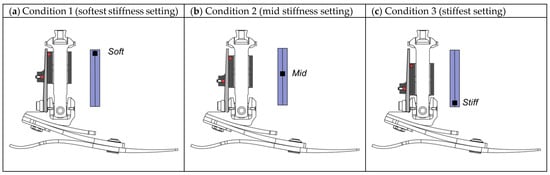
Figure 2.
Schematic of leaf spring support for three stiffness settings for the VSA prosthetic foot: (a) condition 1—softest; (b) condition 2—mid; and (c) condition 3—stiffest.
2.2. Mechanical Testing
2.2.1. Level Ground
The level-ground roll-over evaluation was performed using a prosthetic test machine (Shore Western, Monrovia, CA, USA) with a mechanical setup according to International Organization for Standardization technical specifications ISO/TS 16955 [14]. The aim of this test method is to apply a more realistic progression and magnitude of loading compared to static tests derived from ISO 10328:2016 [15]. Using this new test procedure, quantification of physical parameters of the prosthetic foot can be calculated.
Sagittal foot motion was recorded with a video camera (Rx0 II, Sony, New York City, NY, USA). The test is intended to simulate a heel-to-toe roll-over walking cycle. The test sample is subjected to both an M-shaped force and the motion of a rotating plate synchronized with the vertical force profile. The plate angle starts at −20° for heel strike and ends at +40° for push-off, and the maximum force applied is 1050 N. The machine set-up is described in Figure 3.
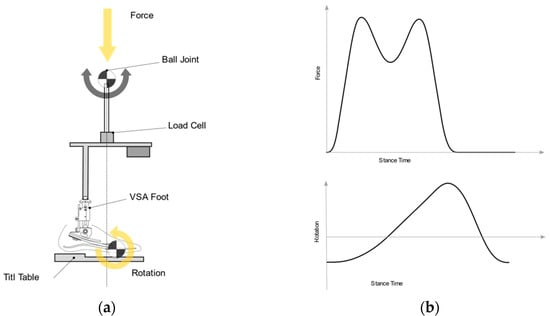
Figure 3.
Schematic illustration of foot roll-over testing according to ISO/TS 16955: (a) machine setup with a VSA prosthetic foot sample (yellow arrows showing force and rotation); (b) vertical force on ball joint and rotation of the tilt-table, as functions of stance phase time.
Markers were placed on the cosmetic foot shell and the pyramid adapter of the foot, as shown in Figure 5, and a roll-over test was performed without shoes.
2.2.2. Ramp Input
Ramp testing is not part of the ISO 16955 nor ISO 22675 standards [16]. However, machine inputs can be adjusted to simulate different types of walking patterns and allow evaluation of other types of devices than prosthetic feet [17,18]. Vertical force input on the machine for the simulated ramp tasks was calculated using previously collected overground ramp data of trans-tibial amputees. These vertical force data were resampled and adjusted to keep smooth loading and unloading. The stance time was modified to allow the test machine to reach the correct loads and plate angle synchronization. Machine input profiles for the test are described in Figure 4.
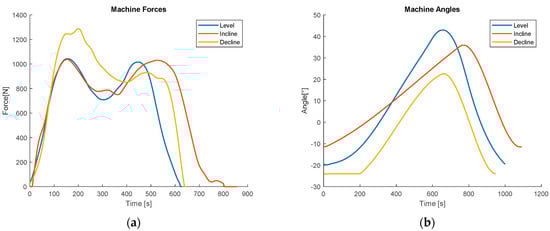
Figure 4.
Machine inputs for vertical force and tilt-table rotation: (a) level-ground, incline, and decline vertical force input; (b) level-ground, incline, and decline tilt table rotation input.
2.3. User Testing
A randomized, participant-blinded crossover study design was used. The order of stiffness settings during data collection was randomly chosen, and both the user and the investigator were blinded to the settings throughout. The user testing protocol was approved by the Icelandic National Bioethics Committee, and all participants gave written informed consent to participate in the study.
2.3.1. Users
The users were recruited at the Össur domestic workshop. The inclusion criteria were (1) 18 years of age or older, (2) unilateral trans-tibial amputation for more than 1 year, (3) prosthetic user for more than 1 year, (4) having no issue with the current socket. The exclusion criteria were (1) user body mass less than 50 kg or higher than 120 kg and (2) patient prosthetic build height lower than 175 mm, to allow correct fitting of the VSA prosthetic foot.
2.3.2. User Data Collection and Processing
Five male users (age: 57 ± 11 years, mass: 97.5 ± 8.7 kg) participated in and completed the study (Table 1). The users walked at 0.8 m/s during level-ground and ramp ascent/descent data collection. All gait trials were performed on an instrumented dual-belt treadmill (Bertec, Columbus, OH, USA), and an eight-camera-based 3D motion capture system (Qualisys AB, Gothenburg, Sweden) was used to track markers for defined body segments (400 Hz). A six DoF model was constructed, and data were processed and analyzed in Visual 3D (C-motion, Germantown, MD, USA). A fourth-order low-pass Butterworth filter was applied for the kinematic and kinetic data, with a cut-off at 6 Hz and 10 Hz, respectively [19]. All users wore their daily prosthetic socket. The prototype foot tested was the only alteration to each user’s prosthetic set-up. The prosthetic foot was aligned for condition 1 (mid-stiffness) by a certified prosthetist with more than ten years of experience. The order of the stiffness conditions tested was randomized for each user who was blinded of the stiffness condition. The same VSA ankle unit was used for all trials. The change in the sole blade size and side was the only change to the ESR base foot. This modification was done to maintain the same foot length as the participant’s prescribed foot. The treadmill ramp angle was set to 7.5° in accordance with previous ramp angle protocols [3,20,21]. The test time was set to allow the collection of 15 consecutive steps on each side at constant speed. The study was performed in two visits for each user. During the first session, each participant was fitted with the VSA prosthetic foot, which was aligned by the CPO. During the second visit, biomechanical data were collected. All users used the same type of shoe (Viking, Norway) during both test sessions.

Table 1.
Characteristics of the users enrolled in the study.
2.3.3. Functional Joint Center Calculation
The functional joint center (FJC) visually indicates the prosthetic foot’s center of rotation [11,12,22] and provides additional information to help understand the ESR deformation characteristics during the stance phase. The ankle moment and ankle angle data commonly collected during user testing describe the prosthetic foot’s stiffness characteristics. In contrast, the FJC’s position provides an average intersection location of the foot and tibial segments rotation during the stance phase. The FJC is an estimation of the virtual joint center and therefore enhances the interpretation of the ESR flexible leaf spring deformation during roll-over.
The functional joint center was calculated for both machine and biomechanical tests. Marker positions were processed using the video tracking software Tema (Image Systems, Linköping, Sweden) for machine tests. The marker positions for the biomechanical tests were exported as an average for the five users. The points coordinates were projected to the sagittal plane (Figure 5). The rigid-body assumption between markers was used for the calculation. The center of zero velocity was calculated during the stance phase using a MATLAB custom script (MathWorks, Natick MA, USA) between M1–M2 and M3–M4 segments for the test machine and between segments Mknee-MAnkle and Mheel-Mtoe segments for the biomechanical test. The position of the instantaneous center of rotation was then averaged for the stance phase over five steps. The X and Y coordinates of the FJC were compared between the two test methods.
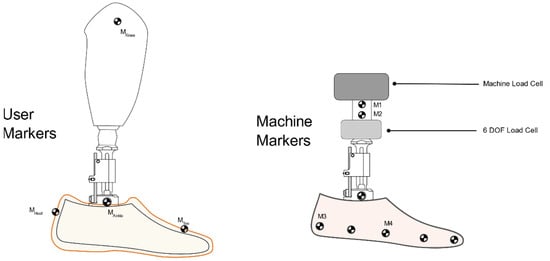
Figure 5.
Schematic of marker positions used for the functional joint center: (left) user test and (right) machine test.
2.4. Statistics
A Pearson correlation was selected to contrast maximum sagittal prosthetic foot angles between the machine test and biomechanical data. Analysis was performed using MATLAB.
Statistical analysis was not performed on the mechanical machine data.
3. Results
3.1. Force Displacement–Static
The prototype VSA prosthetic foot was first evaluated in a state-of-the-art stiffness test, based on AOPA guidelines [20]. Stiffness results are shown in Figure 6. The heel displacement changes between stiffness settings ranged from 17.8 to 18.5 mm, while the keel displacement ranged from 39.5 to 43.6 mm. This test was performed to provide a baseline stiffness measure of the prosthetic foot’s stiffness for the three conditions.
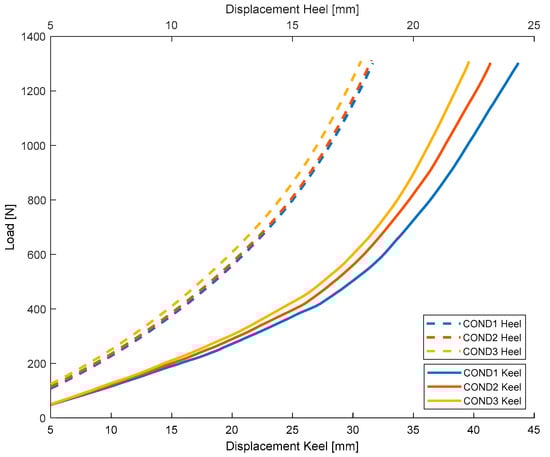
Figure 6.
VSA prosthetic foot load versus displacement heel and keel stiffness test results for condition 1 (softest), condition 2 (mid), and condition 3 (stiffest).
3.2. Ankle Sagittal Moment-Test Machine & Biomechanical Results
3.2.1. Level Ground
The results for the ankle function for the machine and biomechanical tests are contrasted in Figure 7. The ankle moment and angles were averaged for the five users for each stiffness condition. The machine test allows the presentation of data for prosthetic foot ankle joint angles and moments in a comparable layout to the users’ biomechanical data. The load cell moment was moved to the pivot point location of the VSA ankle to allow analysis with the user results on all tasks.
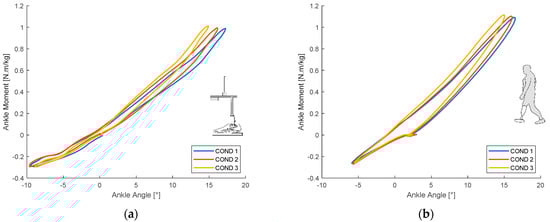
Figure 7.
Ankle moment versus ankle angle during level-ground walking for three stiffness settings-condition 1 (softest), condition 2 (mid), and condition 3 (stiffest): (a) test machine results and (b) biomechanical test results–average of five users.
3.2.2. Ramp
The incline-walking prosthetic foot ankle moment and angle for the machine and biomechanical tests are depicted in Figure 8.
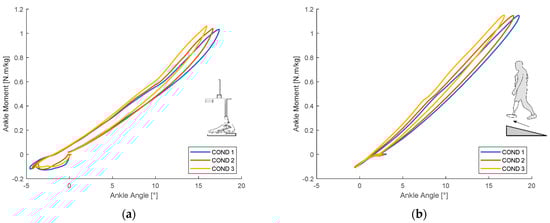
Figure 8.
Ankle moment versus ankle angle during 7.5° incline walking for three stiffness settings-condition 1 (softest), condition 2 (mid), and condition 3 (stiffest): (a) test machine results and (b) biomechanical test results–average of five users.
The decline-walking prosthetic foot ankle moment and angle results for the machine and biomechanical tests are shown in Figure 9.
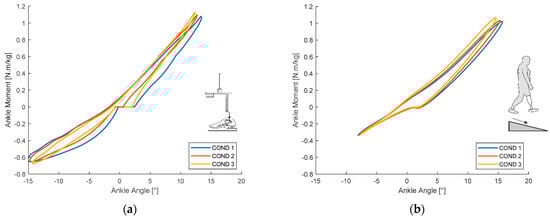
Figure 9.
Ankle moment versus ankle angle during 7.5° decline walking for three stiffness settings-condition 1 (softest), condition 2 (mid), and condition 3 (stiffest): (a) test machine results and (b) biomechanical test results–average of five users.
The maximum ankle angles for plantarflexion and dorsiflexion were recorded for each stiffness condition, task, and test method. The results are presented in Table 2.
Table 2.
Maximum ankle angles for plantarflexion and dorsiflexion in the test machine and biomechanical tests.
3.2.3. Functional Joint Center
Functional joint center positions for biomechanical and machine data are depicted in Figure 10. Since the machine test was performed without shoes, the pivot joint of the VSA unit was used to align results between the two test methods.
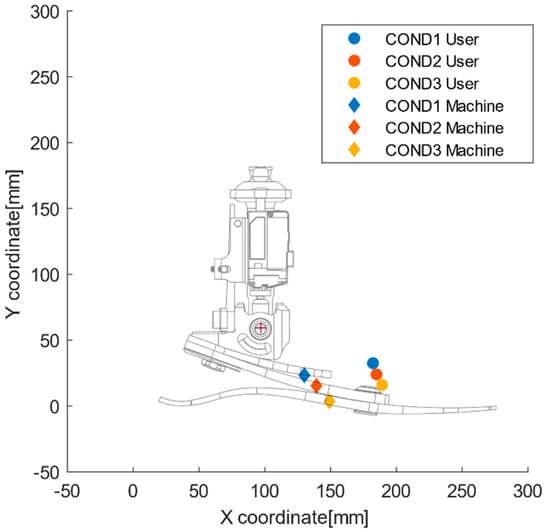
Figure 10.
Functional joint center location for three stiffness settings, condition 1 (softest), condition 2 (mid), and condition 3 (stiffest), calculated for machine test and biomechanical tests during level-ground walking.
4. Discussion
Prosthetic foot stiffness category significantly impacts biomechanical variables; however after some accommodation time, the user’s perception of stiffness becomes inconsistent [21]. While a few studies have evaluated prosthetic foot functions using quasi-static machine testing methods, limited work has been done on dynamic testing [22]. In addition, studies focusing on mechanical testing have been limited to heel and keel loading in separate motions [23,24]. Hansen et al. showed changes in roll-over characteristics between different prosthetic feet for level-ground ambulation using a mechanical testing apparatus [25]. Similar studies have investigated the impact of prosthetic foot sagittal stiffness on trans-tibial amputees by measuring oxygen consumption and ankle push-off power [26,27].
This study presents a novel approach to evaluating prosthetic feet for ramp ascent and descent using a mechanical roll-over test.
In the comparison of biomechanical test results and test machine simulation for level-ground walking, we found a strong correlation between the ankle angles during dorsiflexion. However, the plantarflexion angle was larger in the machine test than in the biomechanical test, which may be because the machine test was performed without shoes, while the biomechanical test was performed with shoes. The cushioning provided by shoes might have affected the correlation between the two test methods.
For ramp ascent, the maximum dorsiflexion prosthetic foot angles obtained during machine and biomechanical testing were comparable between the three stiffness conditions. However, the plantarflexion angles were lower in biomechanical test data versus the machine test data. This result could be explained by the participants’ gait strategy for ramp ascent to ensure flexion angles and moments up the movement chain of the lower limb during weight acceptance [28]. This may be achieved by, for example, initiating a stance with the foot flat to ease the moment on the knee.
During ramp descent, a variability was seen in plantarflexion between the two test methods. The shoe heel cushion likely affected this result. Additionally, the input on the tilt-table angle may have a significant impact on the increased sagittal moment on this terrain. A lower tilt-table angle at heel strike would generate a decreased sagittal reaction moment, corresponding more to the biomechanical test data.
The functional joint center is an additional parameter to help interpret the prosthetic foot response during roll-over. Our calculation method of the functional joint center can describe its change of position, depending on the prosthetic foot stiffness. However, the FJC position calculated using the machine was on average, 4.5 cm more posterior and 1 cm more proximal than the FJC position calculated using level-ground biomechanical gait measurements. The FJC position moved proximally and posteriorly with decreasing stiffness of the VSA. This change in position can be explained by the decreasing stiffness constant of the VSA ankle unit from stiffest to softest, as a result of which, the FJC moves closer to the VSA pivot point. Our calculation of the FJC position is sensitive to the marker position collected and is limited to the sagittal plane.
The novelty of this study is the use of a machine-based roll-over test for a prosthetic foot and evaluation for three types of terrains, level, ramp ascent, and ramp descent, for three different prosthetic foot stiffnesses. To the best of our knowledge, this is the first study providing a machine test input for common functional tasks such as incline/decline walking. The methods described to compare biomechanical and machine data in the sagittal plane for ankle moment and angles are promising, as demonstrated by the correlation seen for dorsiflexion angle data between the two test methods.
The output measurements from the test machine used in conjunction with the camera provide a good surrogate for state-of-the-art biomechanical data generally obtained from gait analysis. The roll-over machine test allows researchers and prosthetic foot designers to evaluate device characteristics in a controlled and reproducible manner. Researchers could use this tool to compare different types of devices or adjust device properties before starting trials on users, ultimately reducing the burden of user testing.
The limitations of the study presented are the small sample size for the user data collected and the use of a 2D camera to track the prosthetic foot angle on the test machine. Best-practices recommendations from Michelini were adopted to improve the video record reliability [29]. Future work should focus on the machine input parameters for heel strike during ramp-walking simulation to achieve an improved plantarflexion correlation.
The VSA prototype foot was well accepted, and all users engaged in the study completed the treadmill trial. The VSA unit allows an assessment of different stiffness settings while the user is wearing the device. This reduces the time and effort to change to the prosthetic foot stiffness category or alignment. In addition, an adaptable prosthetic foot could be beneficial for different terrains and tasks, as previously reported by prosthetic users [30].
Our proposed method is not a fully comprehensive analysis that describes all the prosthetic foot characteristics. However, it allows for calculation and post-processing for different gait tasks, with multiple data sets, such as moments and forces, combined with the deformations of the ESR foot flexible elements.
Machine testing combined with a variable stiffness unit can be beneficial for researchers and prosthetic foot designers to better understand prosthetic foot properties and possibly the specific user preferences. Shepherd and Rouse showed the interaction between the CPO and the user when comparing ankle–foot stiffness preference [31]. We foresee the potential of these types of machine testing results to be optimized for user-specific input profiles. A user-specific gait could be used as input for the machine, and prosthetic foot stiffness can be changed while testing on the equipment to achieve a desired ankle range of motion for the user. Zelik et al.’s ankle elasticity model could be used in conjunction with a variable stiffness prosthetic foot to improve the economy of ankle- or hip-powered walking [32]. Following these two paths in future research, a more individualized prosthetic foot prescription depending on user gait could be developed. The high gait variability between users, as described by Zelik et al., during incline walking, may call for user-specific prosthetic foot adjustability [33]. Safaeepour et al. described the change in ankle quasi-stiffness, depending on the gait phase and speed of healthy subjects [34]. The ability for users to adjust their prostheses for increased dorsiflexion, e.g., during faster walking, may be considered a significant advantage when using a variable stiffness prosthetic foot.
5. Conclusions
We successfully contrasted two different methods of measuring prosthetic foot sagittal movement for level ground, ramp ascent, and ramp descent and proposed input parameters for a machine-based testing for ramps. Our hypothesis regarding the use of machine testing for different terrains was confirmed. The proposed test method and input parameters to evaluate prosthetic feet under ramp ascent and ramp descent conditions is feasible and provides meaningful data that could allow comparison with prosthetic user gait for the specific terrains. This method can be valuable for researchers and designers to evaluate devices prior to user testing and lower the burden on users. Additionally, this method can help in distinguishing prosthetic foot design stiffness characteristics in the sagittal plane.
Author Contributions
Conceptualization, K.B. and S.B.; methodology, C.L. and F.S and A.L.Á.; formal analysis, C.L.; test machine investigation, F.S.; biomechanical investigation, A.L.Á.; data curation, C.L.; writing—original draft preparation, C.L.; writing—review and editing, F.S. and A.L.Á.; supervision, K.B. and S.B.; funding acquisition, S.B. All authors have read and agreed to the published version of the manuscript.
Funding
This research was funded by the Technology Development Fund at the Icelandic Center for Research (grant no. 163805-0612).
Institutional Review Board Statement
The study was conducted according to the guidelines of the Declaration of Helsinki and approved by the Institutional Review Board (or Ethics Committee) of Lyfjastofnun–Icelandic Medicines Agency (protocol code CII20190907102, date of approval 04.12.2019).
Informed Consent Statement
Informed consent was obtained from all the subjects involved in the study.
Acknowledgments
Test machine for measurements were provided by Össur ehf.
Conflicts of Interest
Christophe Lecomte and Felix Starker are employees of Össur ehf. The funders had no role in the design of the study; in the collection, analyses, or interpretation of data; in the writing of the manuscript, or in the decision to publish the results.
References
- Riegger, C.L. Anatomy of the Ankle and Foot general osteology and foot shape. Phys. Ther. J. 1988, 68, 1802–1814. [Google Scholar] [CrossRef]
- Heitzmann, D.; Putz, C.; Wolf, S.I. Benefits of an increased prosthetic ankle range of motion for individuals with a trans- tibial amputation walking with a new prosthetic foot Daniel. Gait Posture 2018. [Google Scholar] [CrossRef]
- Childers, W.L.; Takahashi, K.Z. Increasing prosthetic foot energy return affects whole-body mechanics during walking on level ground and slopes. Sci. Rep. 2018, 8, 5354. [Google Scholar] [CrossRef]
- Versluys, R.; Beyl, P.; Van Damme, M.; Desomer, A.; Van Ham, R.; Lefeber, D. Prosthetic feet: State-of-the-art review and the importance of mimicking human anklefoot biomechanics. Disabil. Rehabil. Assist. Technol. 2009, 4, 65–75. [Google Scholar] [CrossRef]
- Andrysek, J. Lower-limb prosthetic technologies in the developing world: A review of literature from 1994–2010. Prosthet. Orthot. Int. 2010, 34, 378–398. [Google Scholar] [CrossRef]
- Kobayashi, T.; Orendurff, M.S.; Arabian, A.K.; Rosenbaum-Chou, T.G.; Boone, D.A. Effect of prosthetic alignment changes on socket reaction moment impulse during walking in transtibial amputees. J. Biomech. 2014, 47, 1315–1323. [Google Scholar] [CrossRef] [PubMed]
- Bellmann, M.; Blumentritt, S.; Pusch, M.; Schmalz, T.; Schönemeier, M. Measuring Technology The 3D L.A.S.A.R.—A New Generation of Static Analysis for Optimising Prosthetic and Orthotic Alignment. Orthopädie Tech. 2017, 12, 18–25. [Google Scholar]
- Macfarlane, P.A.; Nielsen, D.H.; Shurr, D.G.; Meier, K.G.; Clark, R.; Kerns, J.; Moreno, M.; Ryan, B. Transfemoral amputee physiological requirements:Comparison Between SACH Foot Walking and Flex-Foot Walking. J. Prosthet. Orthot. 1997, 9, 138–143. [Google Scholar] [CrossRef]
- Underwood, H.A.; Tokuno, C.D.; Eng, J.J. A comparison of two prosthetic feet on the multi-joint and multi-plane kinetic gait compensations in individuals with a unilateral trans-tibial amputation. Clin. Biomech. 2004, 19, 609–616. [Google Scholar] [CrossRef]
- Womac, N.D.; Neptune, R.R.; Klute, G.K. Stiffness and energy storage characteristics of energy storage and return prosthetic feet. Prosthet. Orthot. Int. 2019, 43, 266–275. [Google Scholar] [CrossRef] [PubMed]
- Sawers, A.; Hahn, M.E. Trajectory of the center of rotation in non-articulated energy storage and return prosthetic feet. J. Biomech. 2011, 44, 1673–1677. [Google Scholar] [CrossRef]
- Rusaw, D.; Ramstrand, N. Sagittal plane position of the functional joint centre of prosthetic foot/ankle mechanisms. Clin. Biomech. 2010, 25, 713–720. [Google Scholar] [CrossRef][Green Version]
- Lecomte, C.; Armannsdottir, A.L.; Starker, F.; Tryggvason, H.; Briem, K.; Brynjólfsson, S. Variable Stiffness Foot Design and Validation. J. Biomech. 2021, 122, 110440. [Google Scholar] [CrossRef]
- ISO. ISO/DIS 16955 Prosthetics—Quantification of Physical Parameters of Ankle/Foot Devices and Foot Units. 2012. Available online: https://www.iso.org/standard/69821.html (accessed on 31 May 2021).
- Technical Committee ISO/TC 168 “Prosthetics and Orthotics” ISO 10328:2016 Prosthetics—Structural Testing. 2016. Available online: https://www.iso.org/standard/70205.html (accessed on 31 May 2021).
- ISO. ISO 22675:2016 Foot Devices and Foot Units. 2016. Available online: https://www.iso.org/standard/70203.html (accessed on 31 May 2021).
- Starker, F.; Blab, F.; Dennerlein, F.; Schneider, U. A Method for Sports Shoe Machinery Endurance Testing: Modification of ISO 22675 Prosthetic Foot Test Machine for Heel-to-toe Running Movement. Procedia Eng. 2014, 72, 405–410. [Google Scholar] [CrossRef]
- Lai, H.J.; Yu, C.H.; Kao, H.C.; Chen, W.C.; Chou, C.W.; Cheng, C.K. Ankle-foot simulator development for testing ankle-foot orthoses. Med. Eng. Phys. 2010, 32, 623–629. [Google Scholar] [CrossRef]
- Robertson, D.G.E.; Dowling, J.J. Design and responses of Butterworth and critically damped digital filters. J. Electromyogr. Kinesiol. 2003, 13, 569–573. [Google Scholar] [CrossRef]
- American Orthotic and Prosthetic Association AOPA Prosthetic Foot Project Report. Available online: https://www.aopanet.org/wp-content/uploads/2013/12/Prosthetic_Foot_Project.pdf (accessed on 17 June 2020).
- Halsne, E.G.; Czerniecki, J.M.; Shofer, J.B.; Morgenroth, D.C. The effect of prosthetic foot stiffness on foot-ankle biomechanics and relative foot stiffness perception in people with transtibial amputation. Clin. Biomech. 2020, 80. [Google Scholar] [CrossRef] [PubMed]
- Major, M.J.; Howard, D.; Jones, R.; Twiste, M. The effects of transverse rotation angle on compression and effective lever arm of prosthetic feet during simulated stance. Prosthet. Orthot. Int. 2012, 36, 231–235. [Google Scholar] [CrossRef] [PubMed]
- Webber, C.M.; Kaufman, K. Instantaneous stiffness and hysteresis of dynamic elastic response prosthetic feet. Prosthet. Orthot. Int. 2017, 41, 463–468. [Google Scholar] [CrossRef] [PubMed]
- Rigney, S.; Simmons, A.; Kark, L. Energy Storage and Return Prostheses: A Review of Mechanical Models. Crit. Rev. Biomed. Eng. 2016, 44, 269–292. [Google Scholar] [CrossRef]
- Curtze, C.; Hof, A.L.; van Keeken, H.G.; Halbertsma, J.P.K.; Postema, K.; Otten, B. Comparative roll-over analysis of prosthetic feet. J. Biomech. 2009, 42, 1746–1753. [Google Scholar] [CrossRef] [PubMed]
- Schnall, B.L.; Dearth, C.L.; Elrod, J.M.; Golyski, P.R.; Koehler-McNicholas, S.R.; Ray, S.F.; Hansen, A.H.; Hendershot, B.D. A more compliant prosthetic foot better accommodates added load while walking among Servicemembers with transtibial limb loss. J. Biomech. 2019, 109395. [Google Scholar] [CrossRef] [PubMed]
- Klodd, E.; Hansen, A.; Fatone, S.; Edwards, M. Effects of prosthetic foot forefoot flexibility on oxygen cost and subjective preference rankings of unilateral transtibial prosthesis users. J. Rehabil. Res. Dev. 2010, 47, 543–552. [Google Scholar] [CrossRef]
- Fradet, L.; Alimusaj, M.; Braatz, F.; Wolf, S.I. Biomechanical analysis of ramp ambulation of transtibial amputees with an adaptive ankle foot system. Gait Posture 2010, 32, 191–198. [Google Scholar] [CrossRef]
- Michelini, A.; Eshraghi, A.; Andrysek, J. Two-dimensional video gait analysis: A systematic review of reliability, validity, and best practice considerations. Prosthet. Orthot. Int. 2020, 44, 245–262. [Google Scholar] [CrossRef] [PubMed]
- Fogelberg, D.J.; Allyn, K.J.; Smersh, M.; Maitland, M.E. What People Want in a Prosthetic Foot: A Focus Group Study. J. Prosthet. Orthot. 2016. [Google Scholar] [CrossRef] [PubMed]
- Shepherd, M.K.; Rouse, E.J. Comparing Preference of Ankle-Foot Stiffness in Below-Knee Amputees and Prosthetists. Press. Nat. Sci. Reports 2020. [Google Scholar] [CrossRef] [PubMed]
- Zelik, K.E.; Huang, T.W.P.; Adamczyk, P.G.; Kuo, A.D. The role of series ankle elasticity in bipedal walking. J. Theor. Biol. 2014, 346, 75–85. [Google Scholar] [CrossRef]
- Lamers, E.P.; Eveld, M.E.; Zelik, K.E. Subject-specific responses to an adaptive ankle prosthesis during incline walking. J. Biomech. 2019, 95, 109273. [Google Scholar] [CrossRef]
- Safaeepour, Z.; Esteki, A.; Ghomshe, F.T.; Azuan, N.; Osman, A. Quantitative analysis of human ankle characteristics at different gait phases and speeds for utilizing in ankle-foot prosthetic design. Biomed. Eng. Online 2014, 13, 1–8. [Google Scholar] [CrossRef]
Publisher’s Note: MDPI stays neutral with regard to jurisdictional claims in published maps and institutional affiliations. |
© 2021 by the authors. Licensee MDPI, Basel, Switzerland. This article is an open access article distributed under the terms and conditions of the Creative Commons Attribution (CC BY) license (https://creativecommons.org/licenses/by/4.0/).