Article

A Wearable System for the Estimation of Performance-Related Metrics during Running and Jumping Tasks

1
Tyndall National Institute, University College Cork, Lee Maltings Complex, Dyke Parade, T12R5CP Cork, Ireland
2
Setanta College, Thurles Enterprise Centre, Thurles, Co., Jimmy Doyle Rd, E41AP65 Tipperary, Ireland
*
Author to whom correspondence should be addressed.
Appl. Sci. 2021, 11(11), 5258; https://doi.org/10.3390/app11115258
Submission received: 16 May 2021 / Revised: 29 May 2021 / Accepted: 3 June 2021 / Published: 5 June 2021
(This article belongs to the Special Issue Personalized Medical Devices)

Abstract

:
Athletic performance, technique assessment, and injury prevention are all important aspects in sports for both professional and amateur athletes. Wearable technology is attracting the research community’s interest because of its capability to provide real-time biofeedback to coaches and athletes when on the field and outside of more restrictive laboratory conditions. In this paper, a novel wearable motion sensor-based system has been designed and developed for athletic performance assessment during running and jumping tasks. The system consists of a number of components involving embedded systems (hardware and software), back-end analytics, information and communications technology (ICT) platforms, and a graphical user interface for data visualization by the coach. The system is able to provide automatic activity recognition, estimation of running and jumping metrics, as well as vertical ground reaction force (GRF) predictions, with sufficient accuracy to provide valuable information as regards training outcomes. The developed system is low-power, sufficiently small for real-world scenarios, easy to use, and achieves the specified communication range. The system’s high sampling rate, levels of accuracy and performance enables it as a performance evaluation tool able to support coaches and athletes in their real-world practice.

Graphical Abstract

1. Introduction

Athletic performance, technique assessment, and injury prevention are all aspects of great importance in sports at present, for coaches and athletes alike, and are experiencing a growth in interest from the research community. As a consequence, the development of automated, objective, and reliable performance monitoring and evaluation systems, through quantitative analyses of performance variables, is now seen as an essential tool for the improvement of athletic performance and the minimization of injury risk [1,2].
Wearable sensors represent an alternative to gold-standard lab-based assessments because of their potential to monitor performance without hindering it while providing real-time feedback with no space limitation or infrastructure set-up procedures, as well as their advantages in the areas of portability, low-cost, and ease-of-use [3,4,5]. For instance, wearable technology may be used to estimate temporal (e.g., stride time), kinematic (e.g., joint range of motion), and dynamic parameters (e.g., joint forces and moments), as well as motor capacity, workload, and technique, in a number of sport tasks (e.g., swimming, running, team sports, jumping, and strength assessment) [6].
However, few studies have investigated the possibility of combining those disciplines to support coaches in predicting and minimizing injuries [7]. For example, running-related injuries have a complex and multifactorial etiology that is also dependent on aberrant biomechanics and training load errors [8]. Wearables, therefore, can provide important insights into the kinetics potentially responsible for injurious tissue loads, as well as indicate the effectiveness of an intervention [8]. Thus, coaches’ decision-making can be greatly enhanced by the use of wearable sensors to ensure that a biomechanical intervention is truly helping the athletes by minimizing the risk of running-related injuries [8].
In coaching practice, sport-specific activities (such as change-of-direction), jumping, running, and sprinting tasks are largely adopted for athletic performance evaluation [9,10] in a number of sports, e.g., soccer, rugby, etc. For example, it is common to examine jumps before and after training to assess the effectiveness of a specific intervention [11]. Nevertheless, only a limited number of solutions, both in literature and on the market (for example, Xybermind [12]), have been developed to tackle most of the scenarios sport coaches deal with, with the majority of them merely targeting an automatic classification of different sport activities [13] and their intensity [14].
Running and running-related injuries have been widely investigated through the use of wearable sensors [15,16,17], typically considering spatio-temporal variables such as cadence, contact and swing time, stride length, symmetry, and so on. Nevertheless, loading and related metrics, with particular reference to the vertical ground reaction force (GRF), are also gaining the researchers’ attention [18] because of their high correlation with tibial shock and stress injuries in runners [8]. A number of papers have shown that GRF waveforms could be estimated effectively via neural networks [19,20,21,22,23,24] with superior results compared to biomechanical modeling, as demonstrated in a recent comparative study [25].
On the other hand, jumping tasks have also been extensively studied using wearable technology [26,27,28]. However, many of those investigations generally focused on correctly estimating temporal events (e.g., take-off, landing), jump height, and flight time.
Given that the application of wearable sensors will revolutionize exercise science research because of their portability and capability of collecting a multitude of movement data, research in the area will be facilitated by the development of a meaningful solution able to identify and provide insights based on the analysis of a substantial amount of data collected [29]. The aim of the present work is, therefore, to develop a complete integrated solution that could be used by coaches while athletes are performing running and jumping tasks for monitoring performance and evaluate possible injury risks. The objectives of the investigation are, therefore, many-fold:
  • To develop a wearable solution based on inertial measurement units (IMUs) which could be worn on different body locations and are suitable for different physical tasks;
  • To automatically detect every individual jump performed, as well as segment the running bouts and, as a consequence, each running stride from both legs;
  • To provide running performance metrics from the data recorded by the IMUs, such as contact time, step time, mean force, stability, cadence, etc.;
  • To provide vertical GRF waveforms for each segmented running stride for both legs and extrapolate the associated metrics;
  • To provide jumping metrics from the kinematics recorded by IMU, including flight time, jump height, peak force, mean force, etc., and for the different phases of the jump (eccentric and concentric);
  • To provide an easy-to-use graphical interface for an effective visualization of the estimated variables.
The achievement of all these objectives will allow the development of a complete wearable solution that coaches and athletes could use in their real-world practice, which represent the ultimate goal of this work. The manuscript is organized as follows. The proposed system architecture is discussed in Section 2, while the hardware and the software components of the system are illustrated in Section 3 and Section 4, respectively. The graphical interface is shown in Section 5. Testing and results are discussed in Section 6. A state-of-the-art comparison with products on the market is illustrated in Section 7. Final discussion and conclusions are illustrated in Section 8 and Section 9, respectively.

2. System Architecture

The system has been built to provide performance-related metrics based on the scenario where jumping tests are performed before and after training, and running is the main activity performed during training, as it generally occurs in sports such as soccer or rugby. While running, the system relies on two wirelessly synchronized boards located on the left and right shanks; on the other hand, only one device worn on the pelvis is required for jumping (Figure 1). The pelvis was preferred over the shank for the prediction of jumping forces since the sensor would be mounted closer to the subjects’ center of mass, while the estimation of the total impact force would be unaffected by asymmetrical landings between the left and right foot. Adjustable Velcro straps are used in both cases for attachment to the athlete under test. The athlete can, therefore, use the same boards between activities by simply placing the boards on different body locations. This approach minimizes the number of devices simultaneously worn, which is never more than two units. The boards can perform in a number of modes (i.e., “USB”, “running”, or “jumping”) depending on the number of times a touch button is pressed by the user. This control feature is also used for starting and stopping the collection of data which is stored internally on an SD memory card for post-processing. Whenever a device operates in “USB” mode, it can also be plugged in any computer able to read USB mass storage drives.
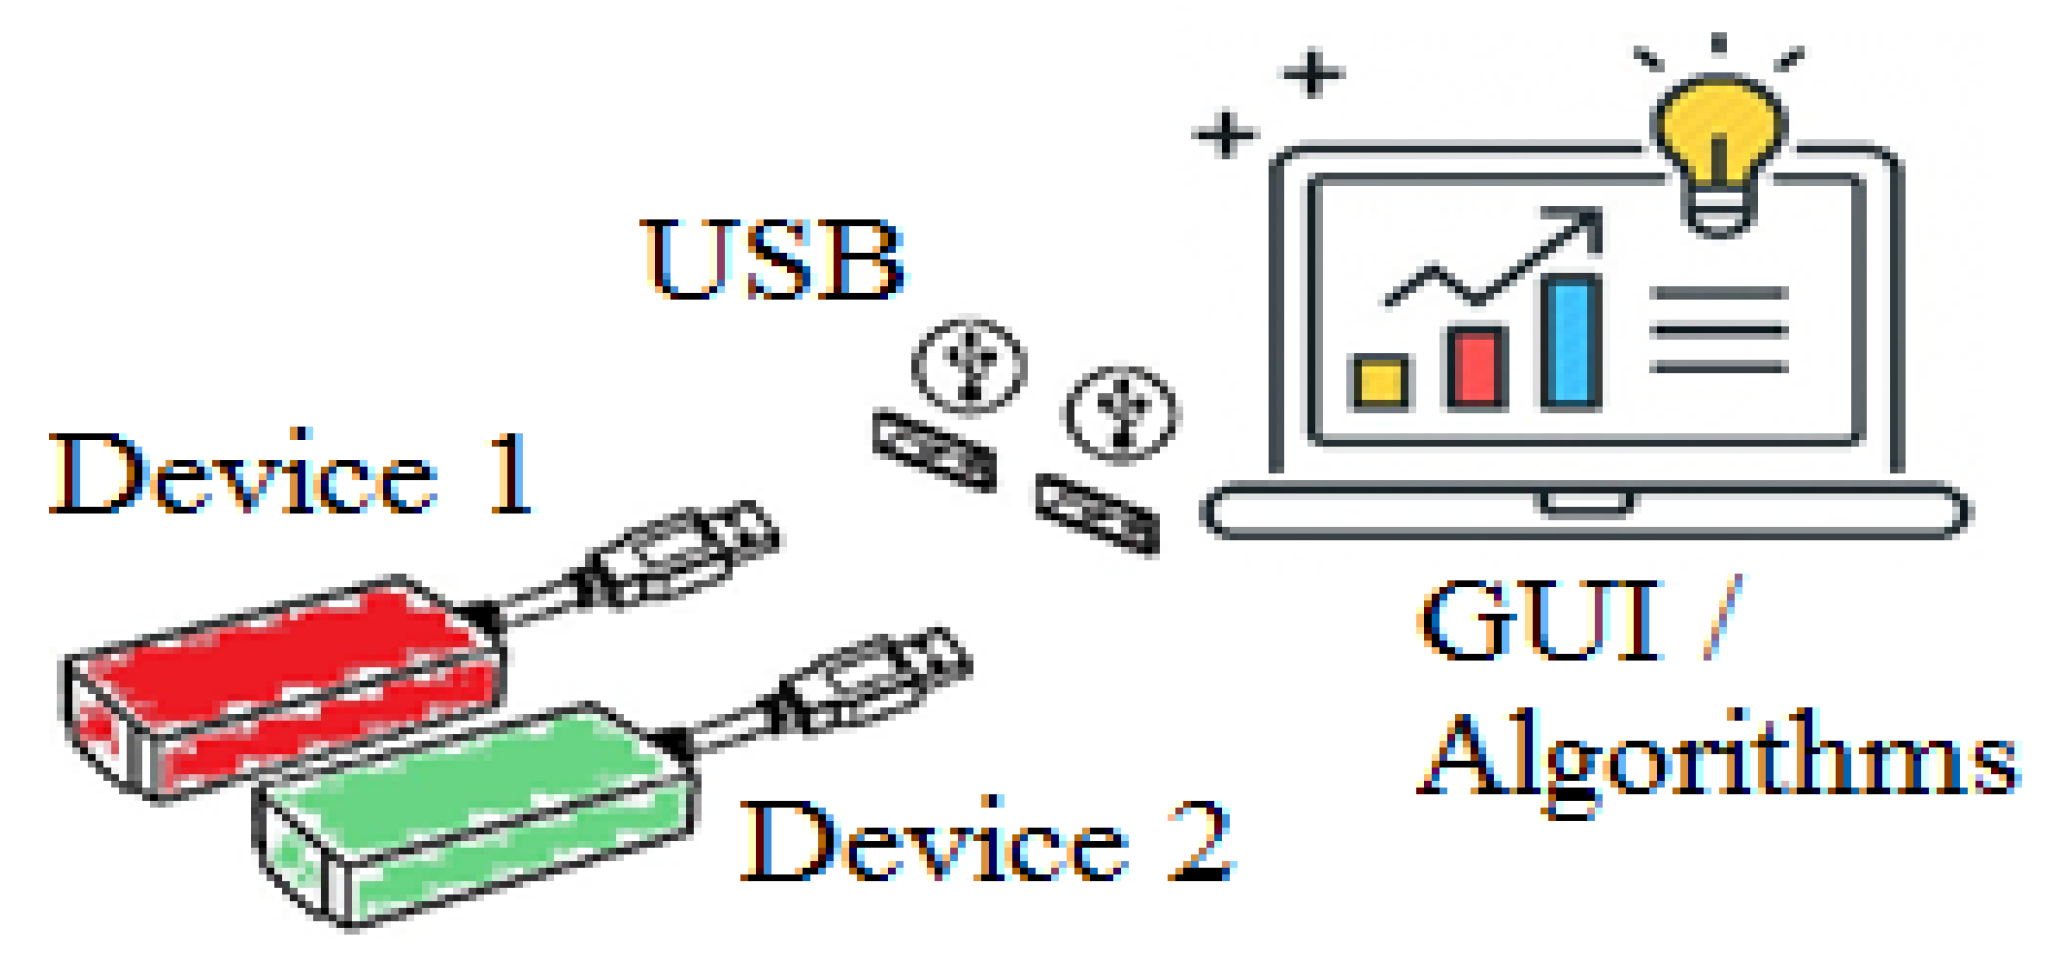
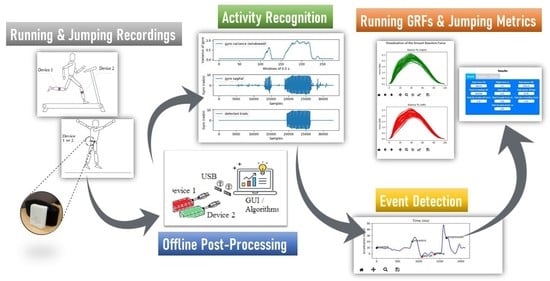
Complex back-end analytics, including activity recognition algorithms to automatically separate the time segment of interest for the analysis, are used separately on a computer to provide the various metrics requested for the different activities based on the data stored on the plugged-in device. A graphical user interface (GUI) has been developed and integrated in the system to visualize, export and save the results of the analysis and to allow coaches and athletes to interact with the system. A graphical depiction of the system adoption is shown in Figure 2.

3. Hardware Design

The following section deals with the design and development of the hardware components of the proposed wearable system for performance assessment in sport tasks.

3.1. Hardware Platform

The requirements of the developed wearable solution involved the ideation of a system easy to use and to wear, requiring no physical connection between the two devices placed on the legs, while the units must exchange information wirelessly and allow easy access to the data from a computer. For this purpose, two identical boards were developed and designed to be autonomous from each other in terms of power supply and computational perspectives. When the units are located on the shanks while running, they store inertial data, which are wirelessly synchronized to each other by keeping the two devices connected with a constant wireless Bluetooth connection.
In addition, both units can work in a stand-alone asynchronous mode in order to analyze jumping tasks. In this case, the user can choose either of the two devices and use it to record and analyze the jumping activity.
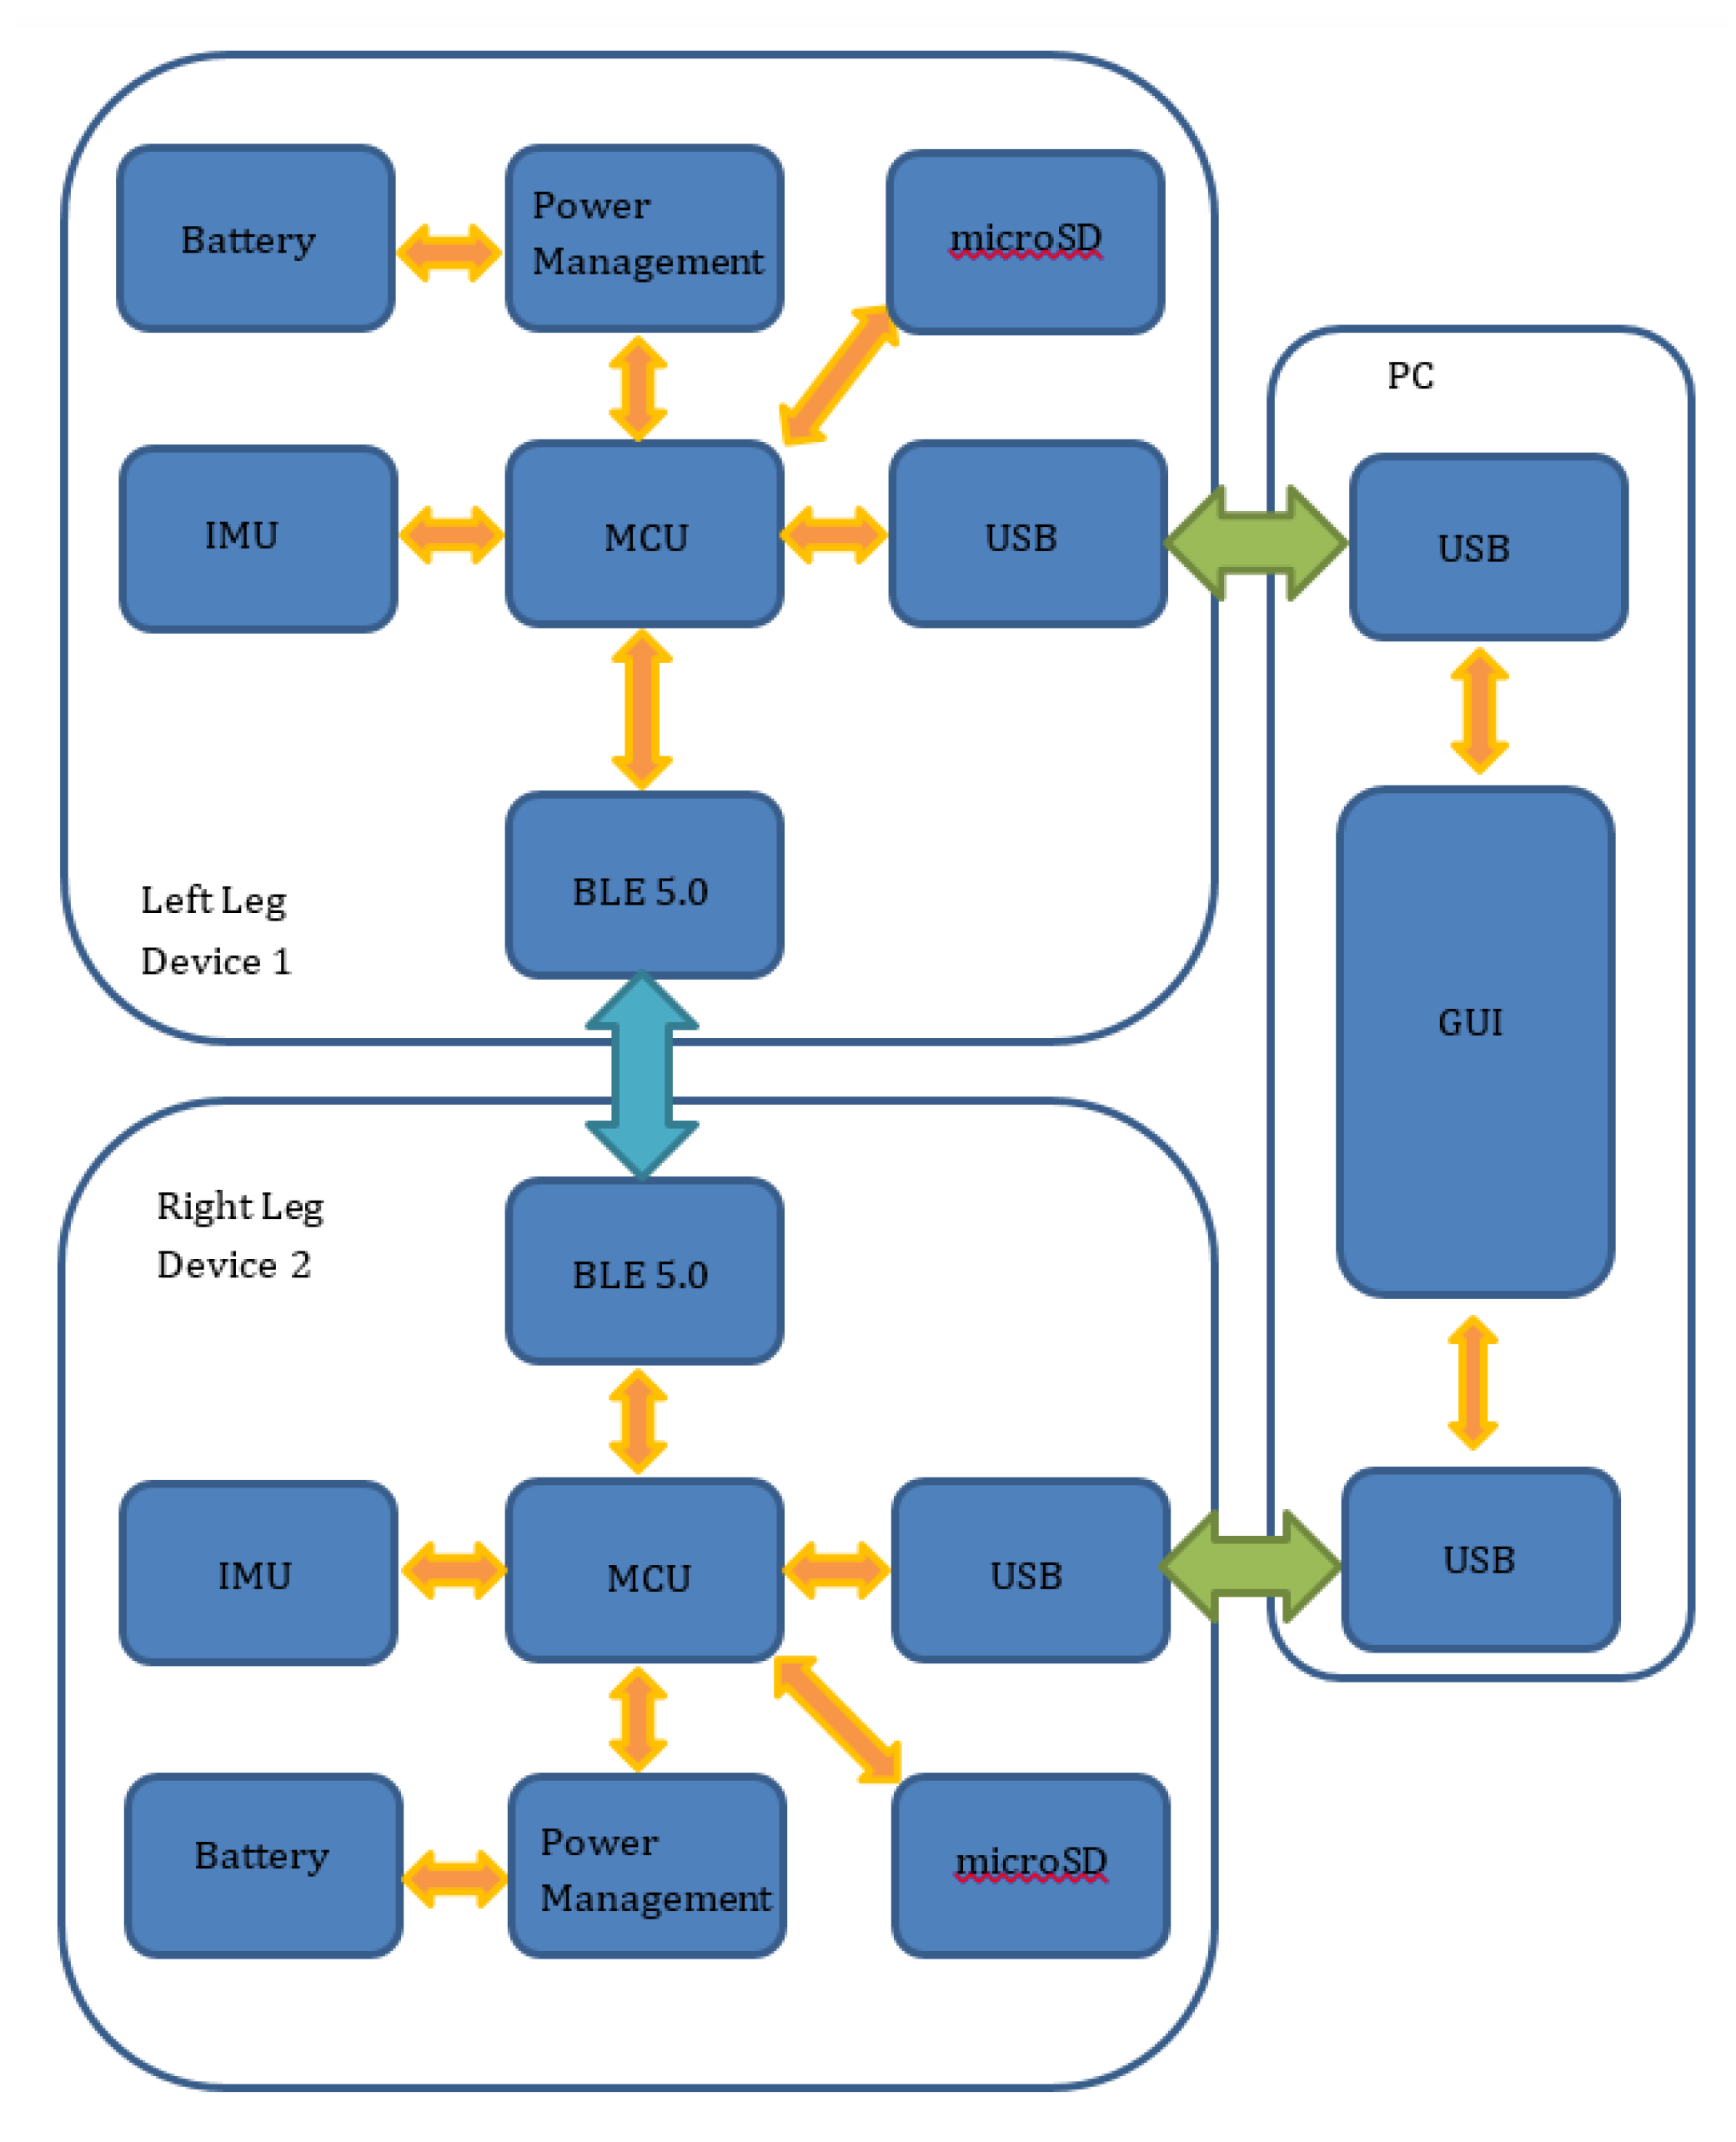
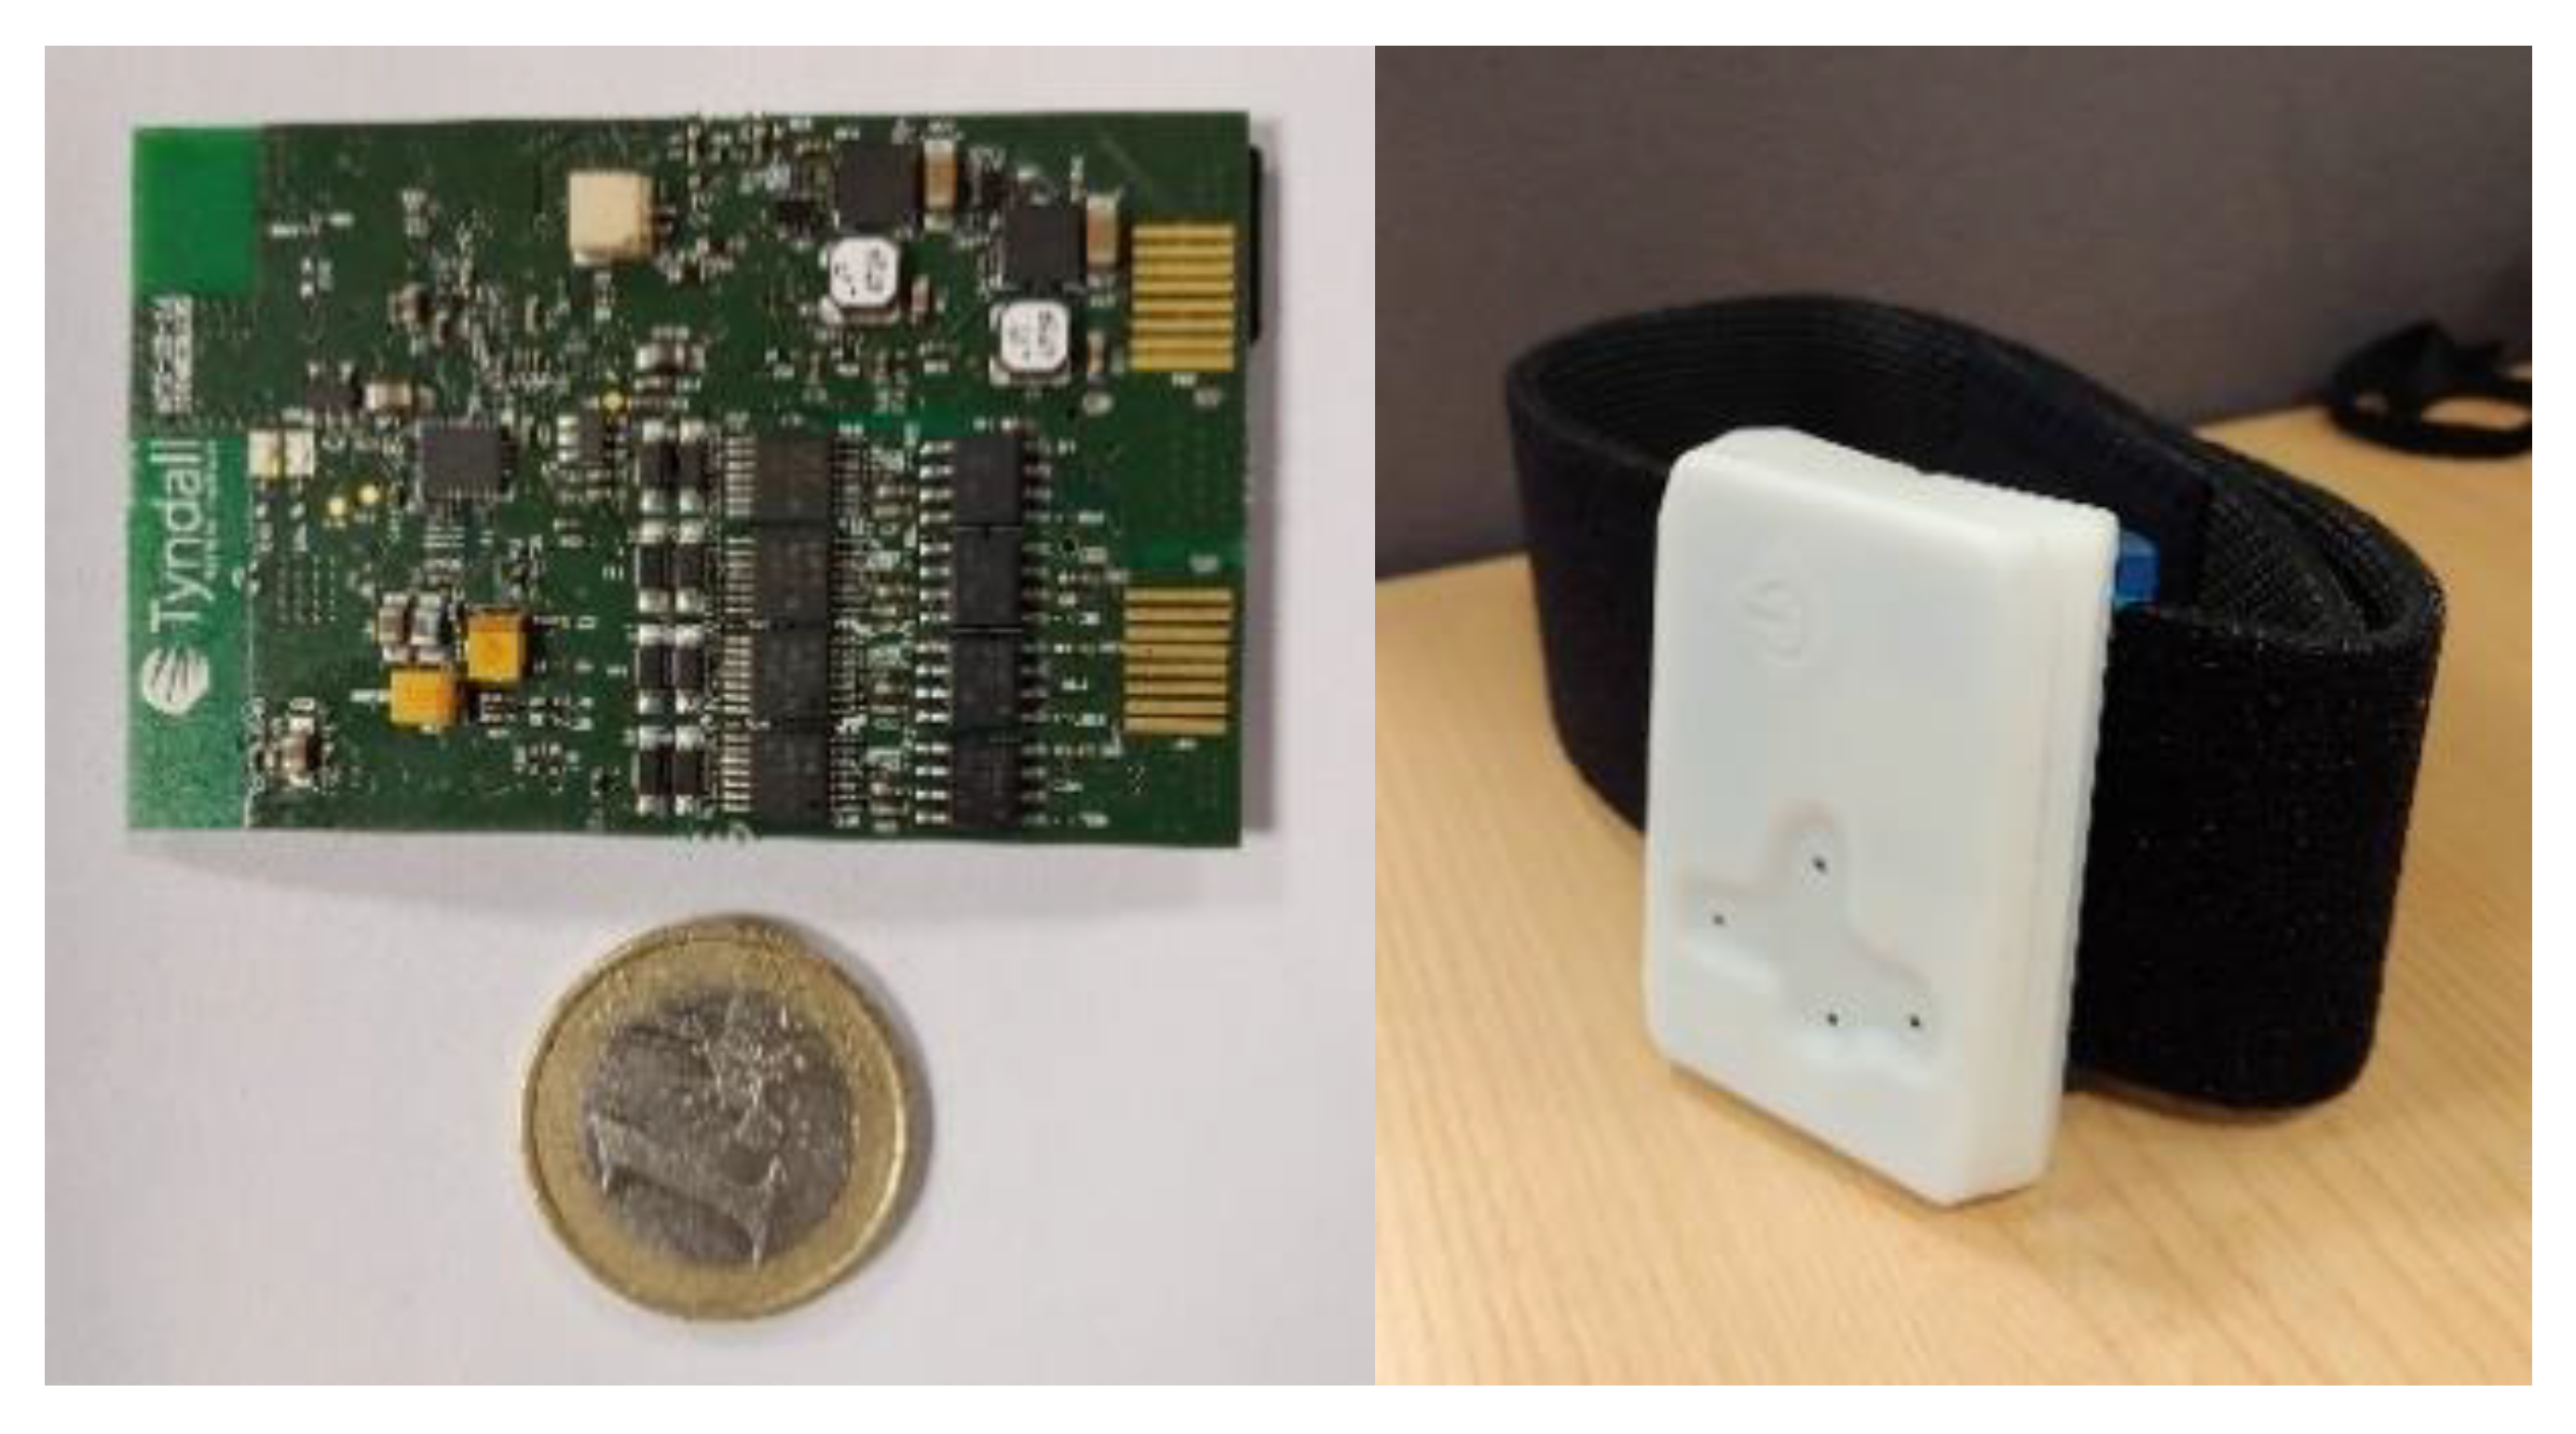
Each board consists of a number of building blocks. Overall, the microcontroller is the main component of the system as it deals with the motion sensors, the wireless communication, the power management, the memory for data storage, and the computer interface to guarantee access to the files stored in the memory card for post processing. The microcontroller selected is the STM32F417IG from STMicroelectronics [30] as it offers low-power operations and high-performance by relying on an ARM®® Cortex®®-M4-based 32 bit architecture, with a single precision floating point unit, and an operating frequency of up to 168 MHz, and up to 1MB of Flash and 196 Kbytes of RAM. The board also includes a 9 DoF IMU (MPU-9250 from InvenSense [31]) connected to the microcontroller via I2C interface, with ranges of 16 g and 2000 dps for the accelerometer and the gyroscope, respectively. However, a magnetometer was not adopted due to the impact that magnetic interferences may have on the measurements. As recommended by the manufacturer, the IMU calibration process relied on the IMU’s on-chip factory-trimmed scale factors to eliminate the need of an end-user calibration. The wireless communication is based on the BLE 5.0 protocol implemented on the “NRF52840” BLE 5.0 module from Nordic [32] and the associated ceramic chip antenna ACAG0801-2450-T from Abracon®® [33]. A microSD card reader is included for storing data on-board and is directly connected to the microcontroller with the SDIO (secure digital input output) card interface. A 604040 Li-ion battery (1100 mAh) is also included, which can be recharged through a type-C USB connection. Finally, a touch button is used to interact with each device, along with four LEDs for user feedback. Figure 3 shows the block diagram of the system, while Figure 4 illustrates the designed PCB board and the 3D printed plastic enclosure used to fit the electronics.
The devices are worn with the touch button on the top side (Figure 4, right). When running, the devices are worn on the external side of the shanks, at approximately two thirds of the lower leg height. For jumping, a unit must be worn as close as possible to the center-of-mass on the lower back.
The developed hardware platform measures 50 mm × 90 mm × 10 mm and weighs 40 g (battery included). The sampling rate is set at 238 Hz and the achieved throughput is 1 Mbps with a communication range greater than 10 m in a NLOS (non-line-of-sight) scenario. The high sampling rate was required to accurately estimate GRF data in highly dynamic movements, as indicated in [34], which highlighted the need to adopt sampling rates higher than 200 Hz for these tasks. The power consumption is less than 100 mA (250 mW) and the system can operate continuously for more than 4 h. The full-battery charging time is 2–3 h.

3.2. Hardware Operations

The touch button on the board is used to switch the device ON, which after some preliminary checks (e.g., SD card successfully mounted) enters into “USB” mode. The “USB” mode is a standby mode allowing communication between a computer and the devices over a wired connection. In order to avoid errors in the stored data files, only when the device is in “USB” mode is the user allowed to switch the device OFF, to connect to a computer, or to switch to “running” or “jumping” modes.
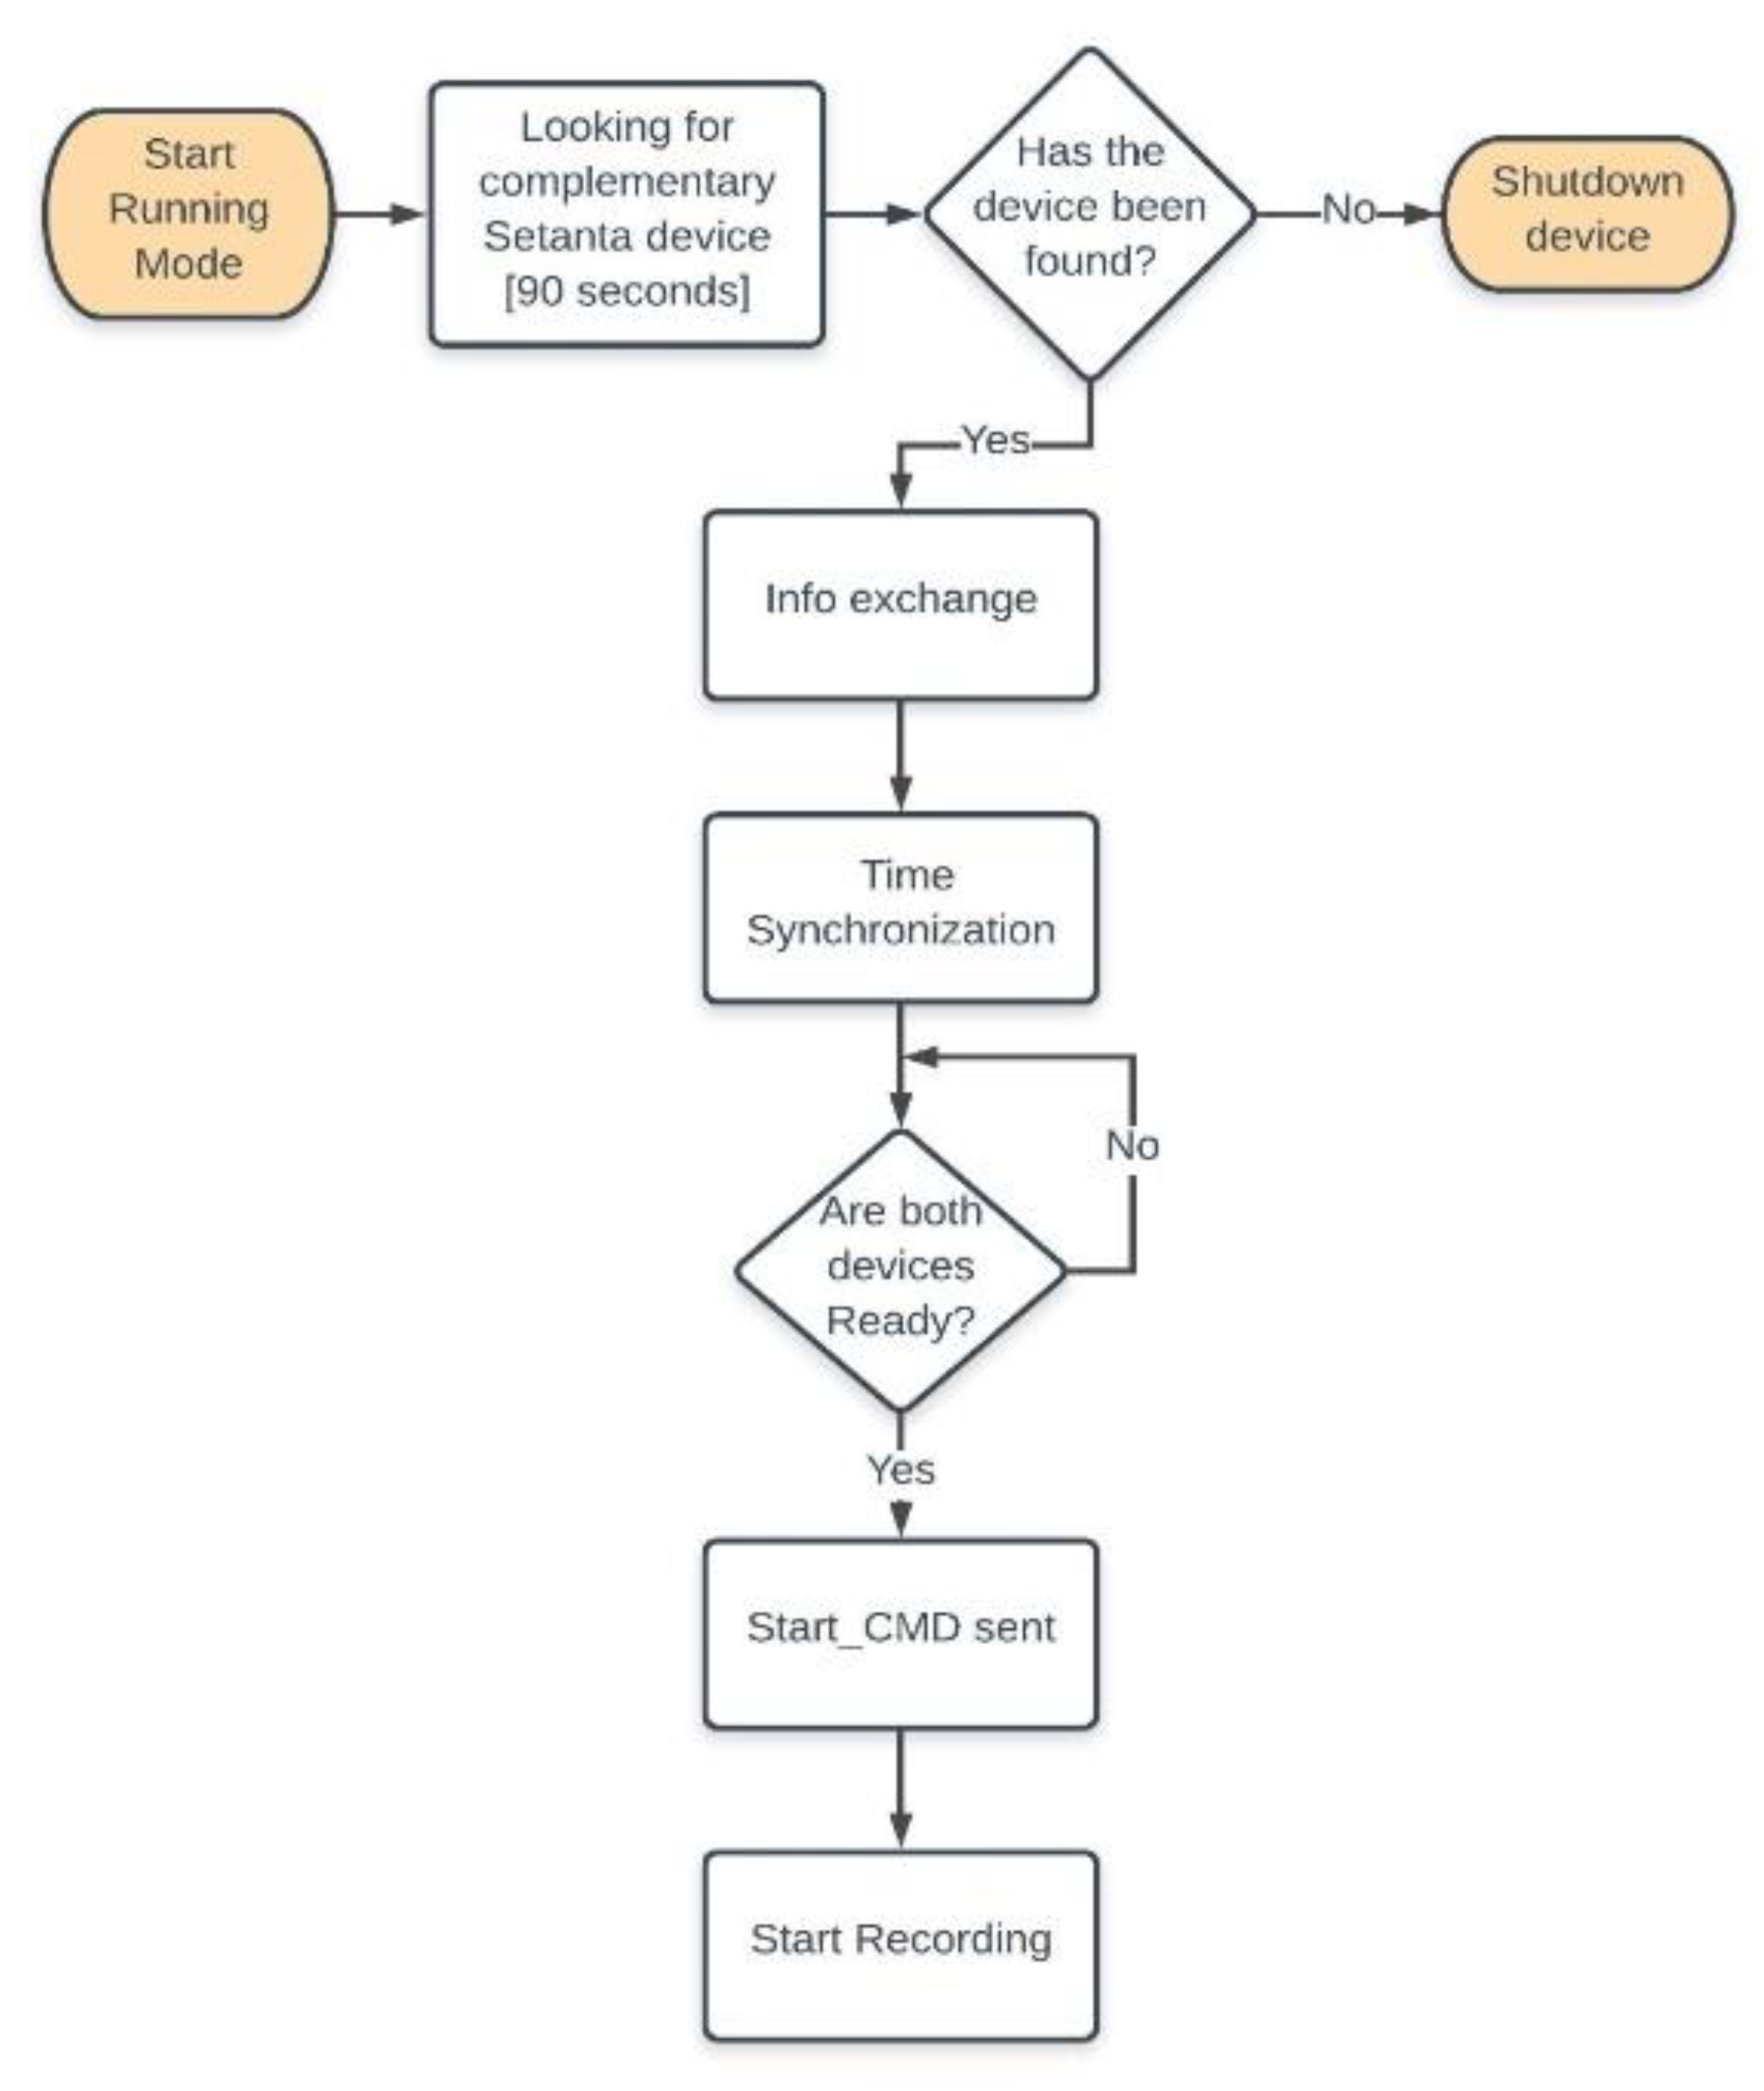
If two units are required for the analysis of running tasks (e.g., “running” mode), then a double tap on the touch button of both devices (while the devices are in “USB” mode) will switch the units ON and start wirelessly scanning for other nearby devices. During the scanning time (90 s), both devices apply the synchronization protocol described in Section 3.3. If 90 s elapse with no other device found, the unit will automatically switch OFF. The synchronization protocol allows the boards to start the recording of the inertial data simultaneously, with the time-synchronized data being stored on the SD cards. During data recording, the user can tap the touch button of either board twice and automatically stop the data capture for both units at the same time, forcing the units to switch back to “USB” mode.
Alternatively, when a single unit is required for the monitoring of jumping tasks (e.g., “jumping” mode), then a double tap on the touch button of the device, currently in “USB” mode, followed a few seconds later by the user tapping the touch button twice, will start recording data on a single unit. Again, while the device is recording, the user can stop the data collection at any moment by tapping the touch button three times which forces the unit to switch back to “USB” mode. Pressing the touch button for six seconds will switch the device OFF at any moment.

3.3. Wireless Synchronization Protocol

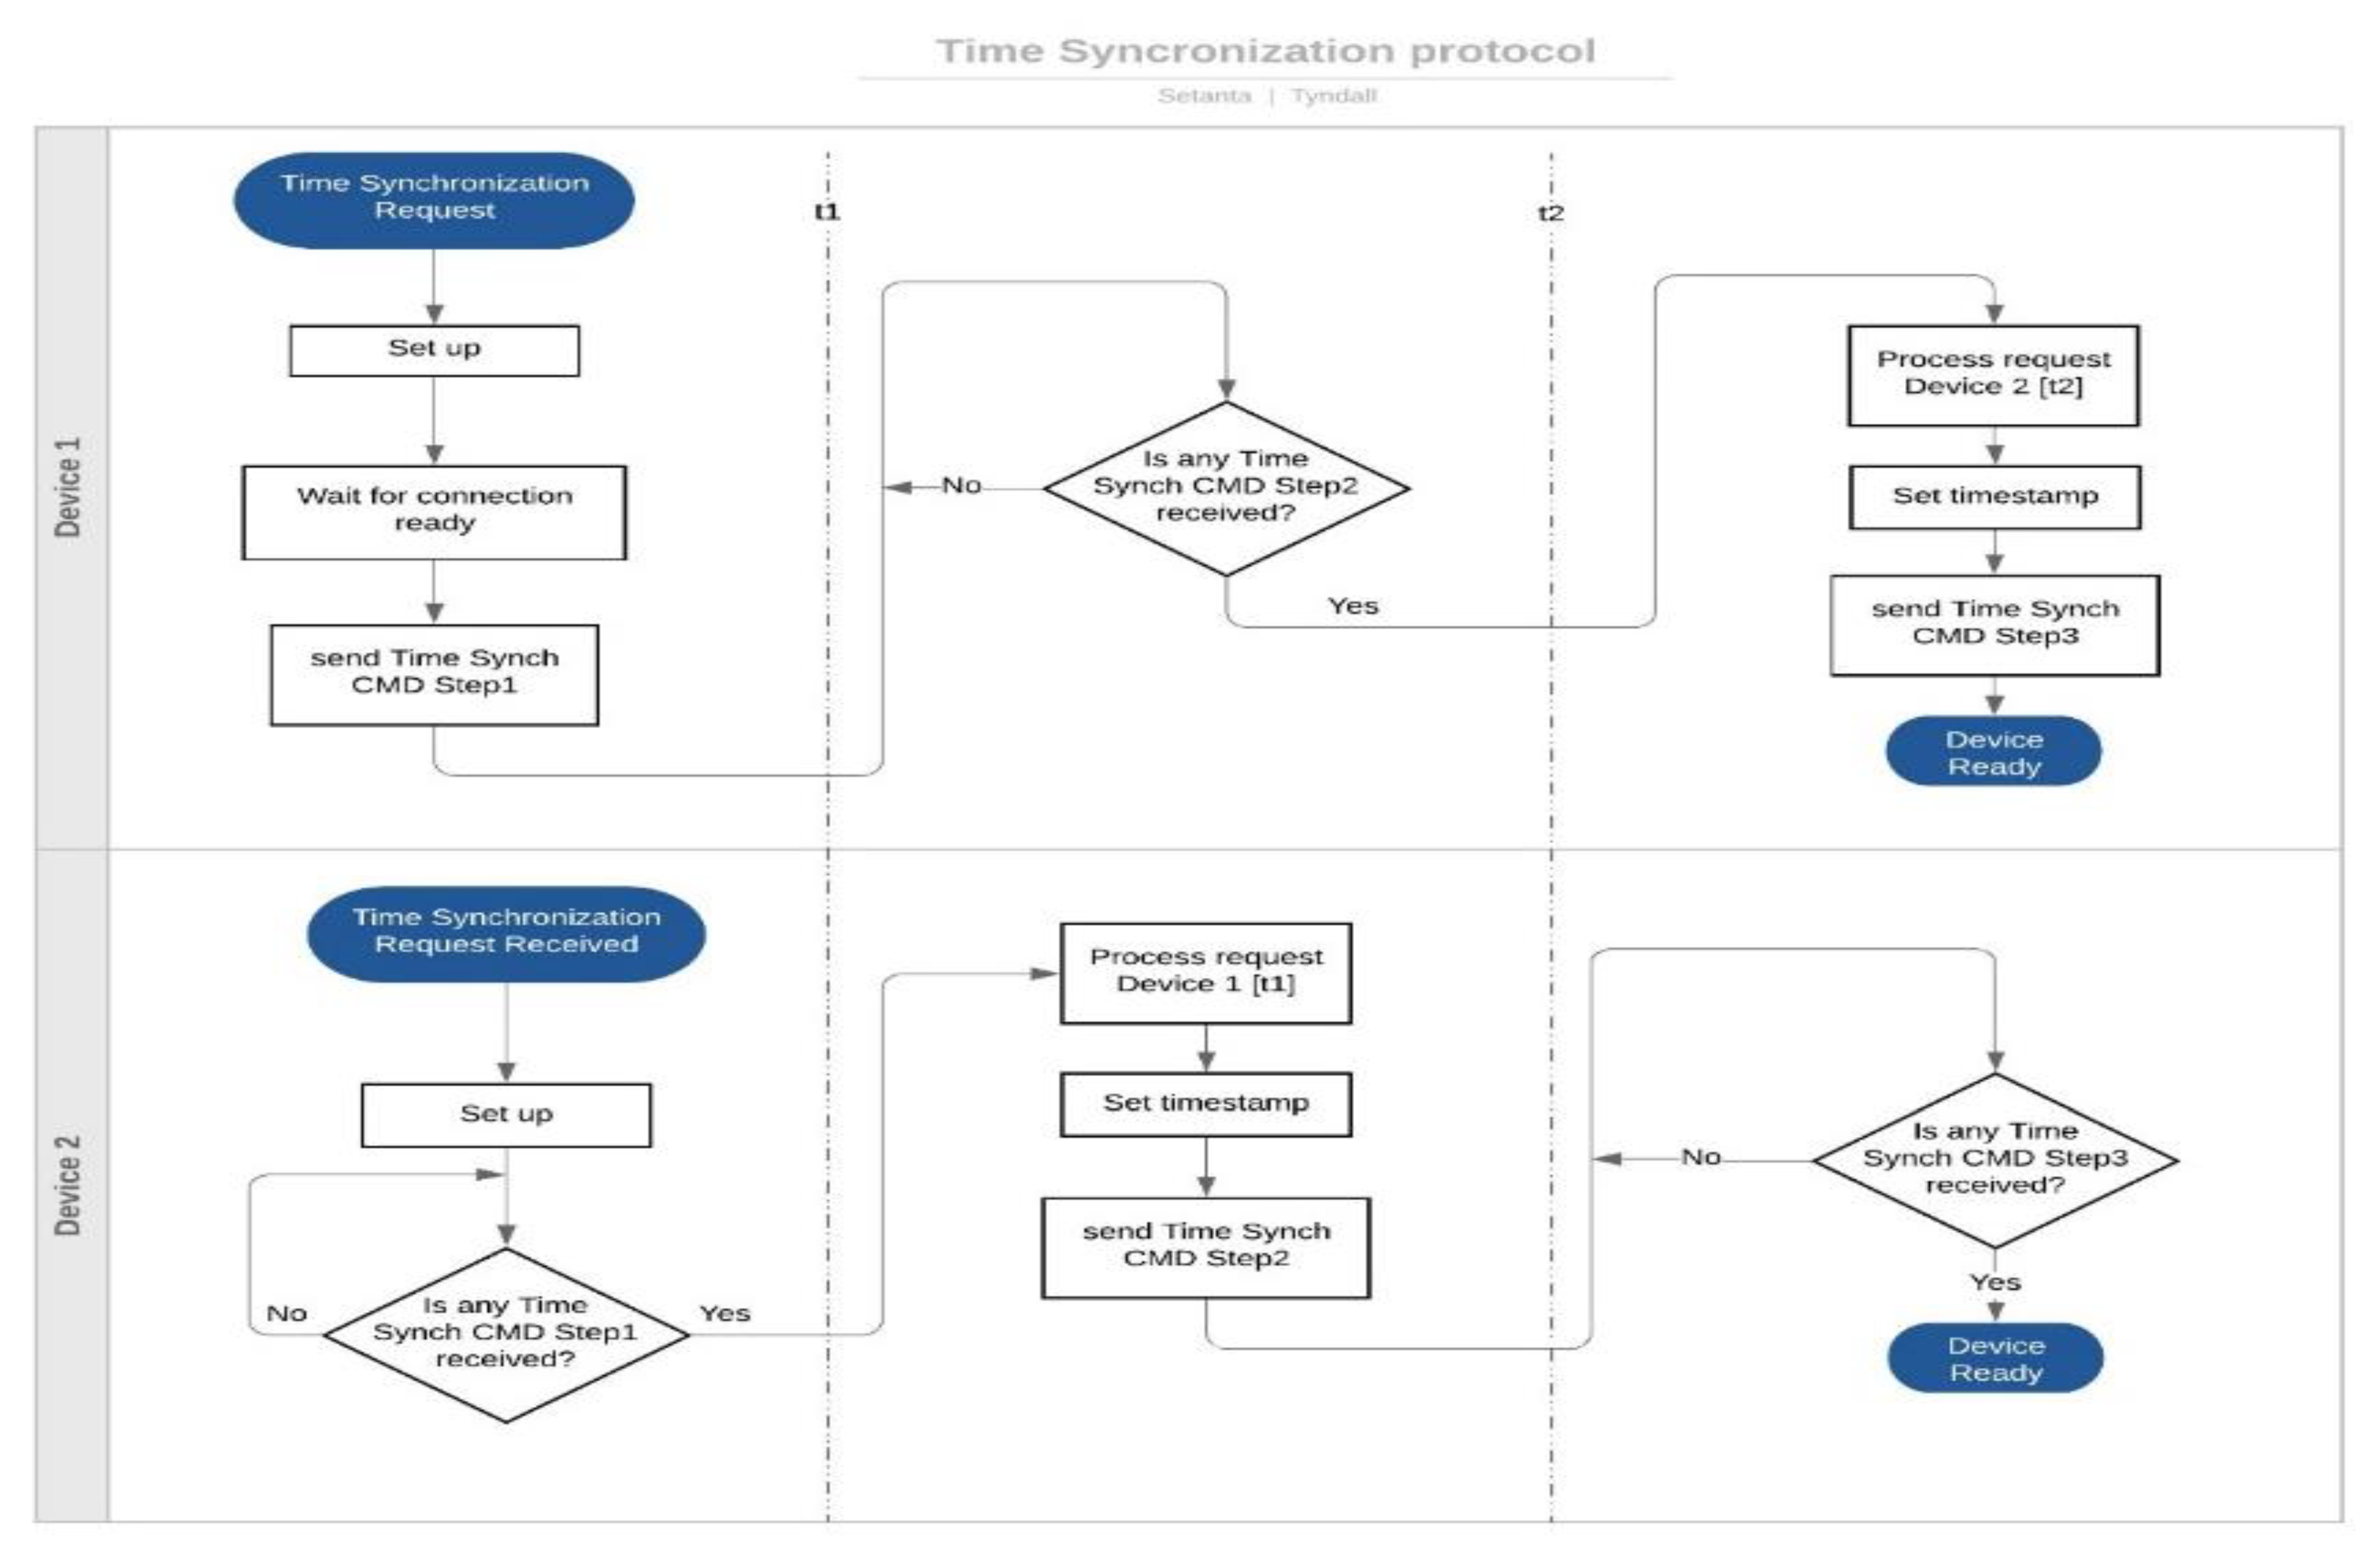
Before recording a running task, it is required that the two units be within the BLE communication range and in-synch with each other. A flowchart of the synchronization protocol is shown in Figure 5.
The first device (“Device1”) starts searching for a pairing device (“Device2”), which is in turn waiting for a time synchronization request. Three stages of command (CMD) exchange, as shown in the graphical description in Figure 6, are required before the devices are ready for data recording:
  • Set-up: Device1 sends a time_synchronization_request and waits for the Device2 set-up.
  • Device2 time synchronization: this phase starts when Device1 sends the CMD_Step1 command (at time t1d1) to Device2 which is received at time t1d2 = t1d1 + δt (δt is the time required for the command to be transmitted between the two devices).
  • Device1 time synchronization: after that CDM_Step1 is processed by Device2 (which requires a time slot x), this phase starts when Device2 sends the CMD_Step2 command (at time t2d2 = t1d2 + x) to Device1. Device1 then receives CMD_Step2 at time t2d1 = t2d2 + δt.
  • Data recording: after that CDM_Step2 is processed by Device1 (which requires another time slot x), this phase starts when Device1 sends the CMD_Step3 command (at time t3d1 = t2d1 + x) to Device2, and then starts immediately the data recording. Device2 receives CMD_Step3 at time t3d2 = t3d1 + δt and after processing the received packet starts the data recording.
Following this process, the post-processing analysis embedded in the back-end analytics estimates the time difference between t3d1 and t3d2 to re-align the two data streams. If for some reason (i.e., packet loss) the synchronization process is not successful during the command exchange (e.g., one device does not receive a reply by 60 s) both boards automatically switch OFF.
Finally, when the user taps the touch button of one device twice to complete the data collection, the device sends a stop command to the pairing device and the recording is terminated in both units.
In summary, the time synchronization procedure is required to temporally align the timestamps in the two boards, while considering that the clock of the boards may be slightly shifted. This process is essential in order to calculate running metrics which are dependent from an accurate estimation of the temporally synchronised gait events in both left and right legs. As indicated in [35], the efficient time-synchronization of a multi-unit, multi-sensor acquisition system for kinematic and static analysis is still considered a challenge in research, given the requirement to ensure a strict time synchronization between all the units to guarantee correct parameter estimation, and with off-the-shelf solutions requiring extra non-portable and complex hardware or without specifying details on the achieved accuracy.
It is worth underlining that in the developed protocol both units can act as “Device1” or “Device2” and those labels are not hard-wired: the label “Device1” is automatically assigned to the unit starting the synchronization communication, while the second unit is thus labeled “Device2”. As a result, the labels “Device1” or “Device2” could be swapped between the two units during different running data collections.

4. Data Processing and Algorithms

The following sections deal with the description of the offline data post-processing and the implemented algorithms in the proposed wearable system. As the magnetometer is not considered in this system, no orientation has been calculated from the IMU and, thus, only raw accelerometer and gyroscope data in the local reference frame are used in all analyses.

4.1. Running Activity Recognition

Even after the devices’ synchronization, it is essential to separate the collected inertial data into windows corresponding to the tasks of interest. This is particularly vital since each recording during a training trial may contain data from activities other than running, such as standing or walking. Therefore, a method able to detect the required activities and separate the corresponding windows of data was implemented based on the works by Olivares et al. [36].
In detail, the implemented algorithm uses the sagittal angular rate collected during a data capture and splits that signal in small windows of 0.5 s of length. Then, the variance of the signal in each of these windows is computed and if the obtained value is above or below a predefined threshold then the window is accordingly marked as active or inactive.
Finally, the process finds all the sequences of consecutive windows marked as active, and if the total duration of each active sequence is longer than a specific time threshold (for running the threshold was set to 20 s), then that sequence is recognized as a running trial; otherwise, the algorithm skips that sequence and checks the following one. Figure 7 demonstrates an example of the employed algorithm.

4.2. Running-Related Metrics and Vertical GRF

Following running activity detection, the recorded accelerometry data associated with the running sequences are filtered with a low-pass, second order, zero-phase shift Butterworth filter with cut-off frequencies of 15 Hz, as performed in [24]. The angular velocity was used for the detection of the gait events (heel-strike and toe-off), as presented in [37]. Accelerations were scaled to 100 samples from heel-strike to toe-off (100% of stance phase).
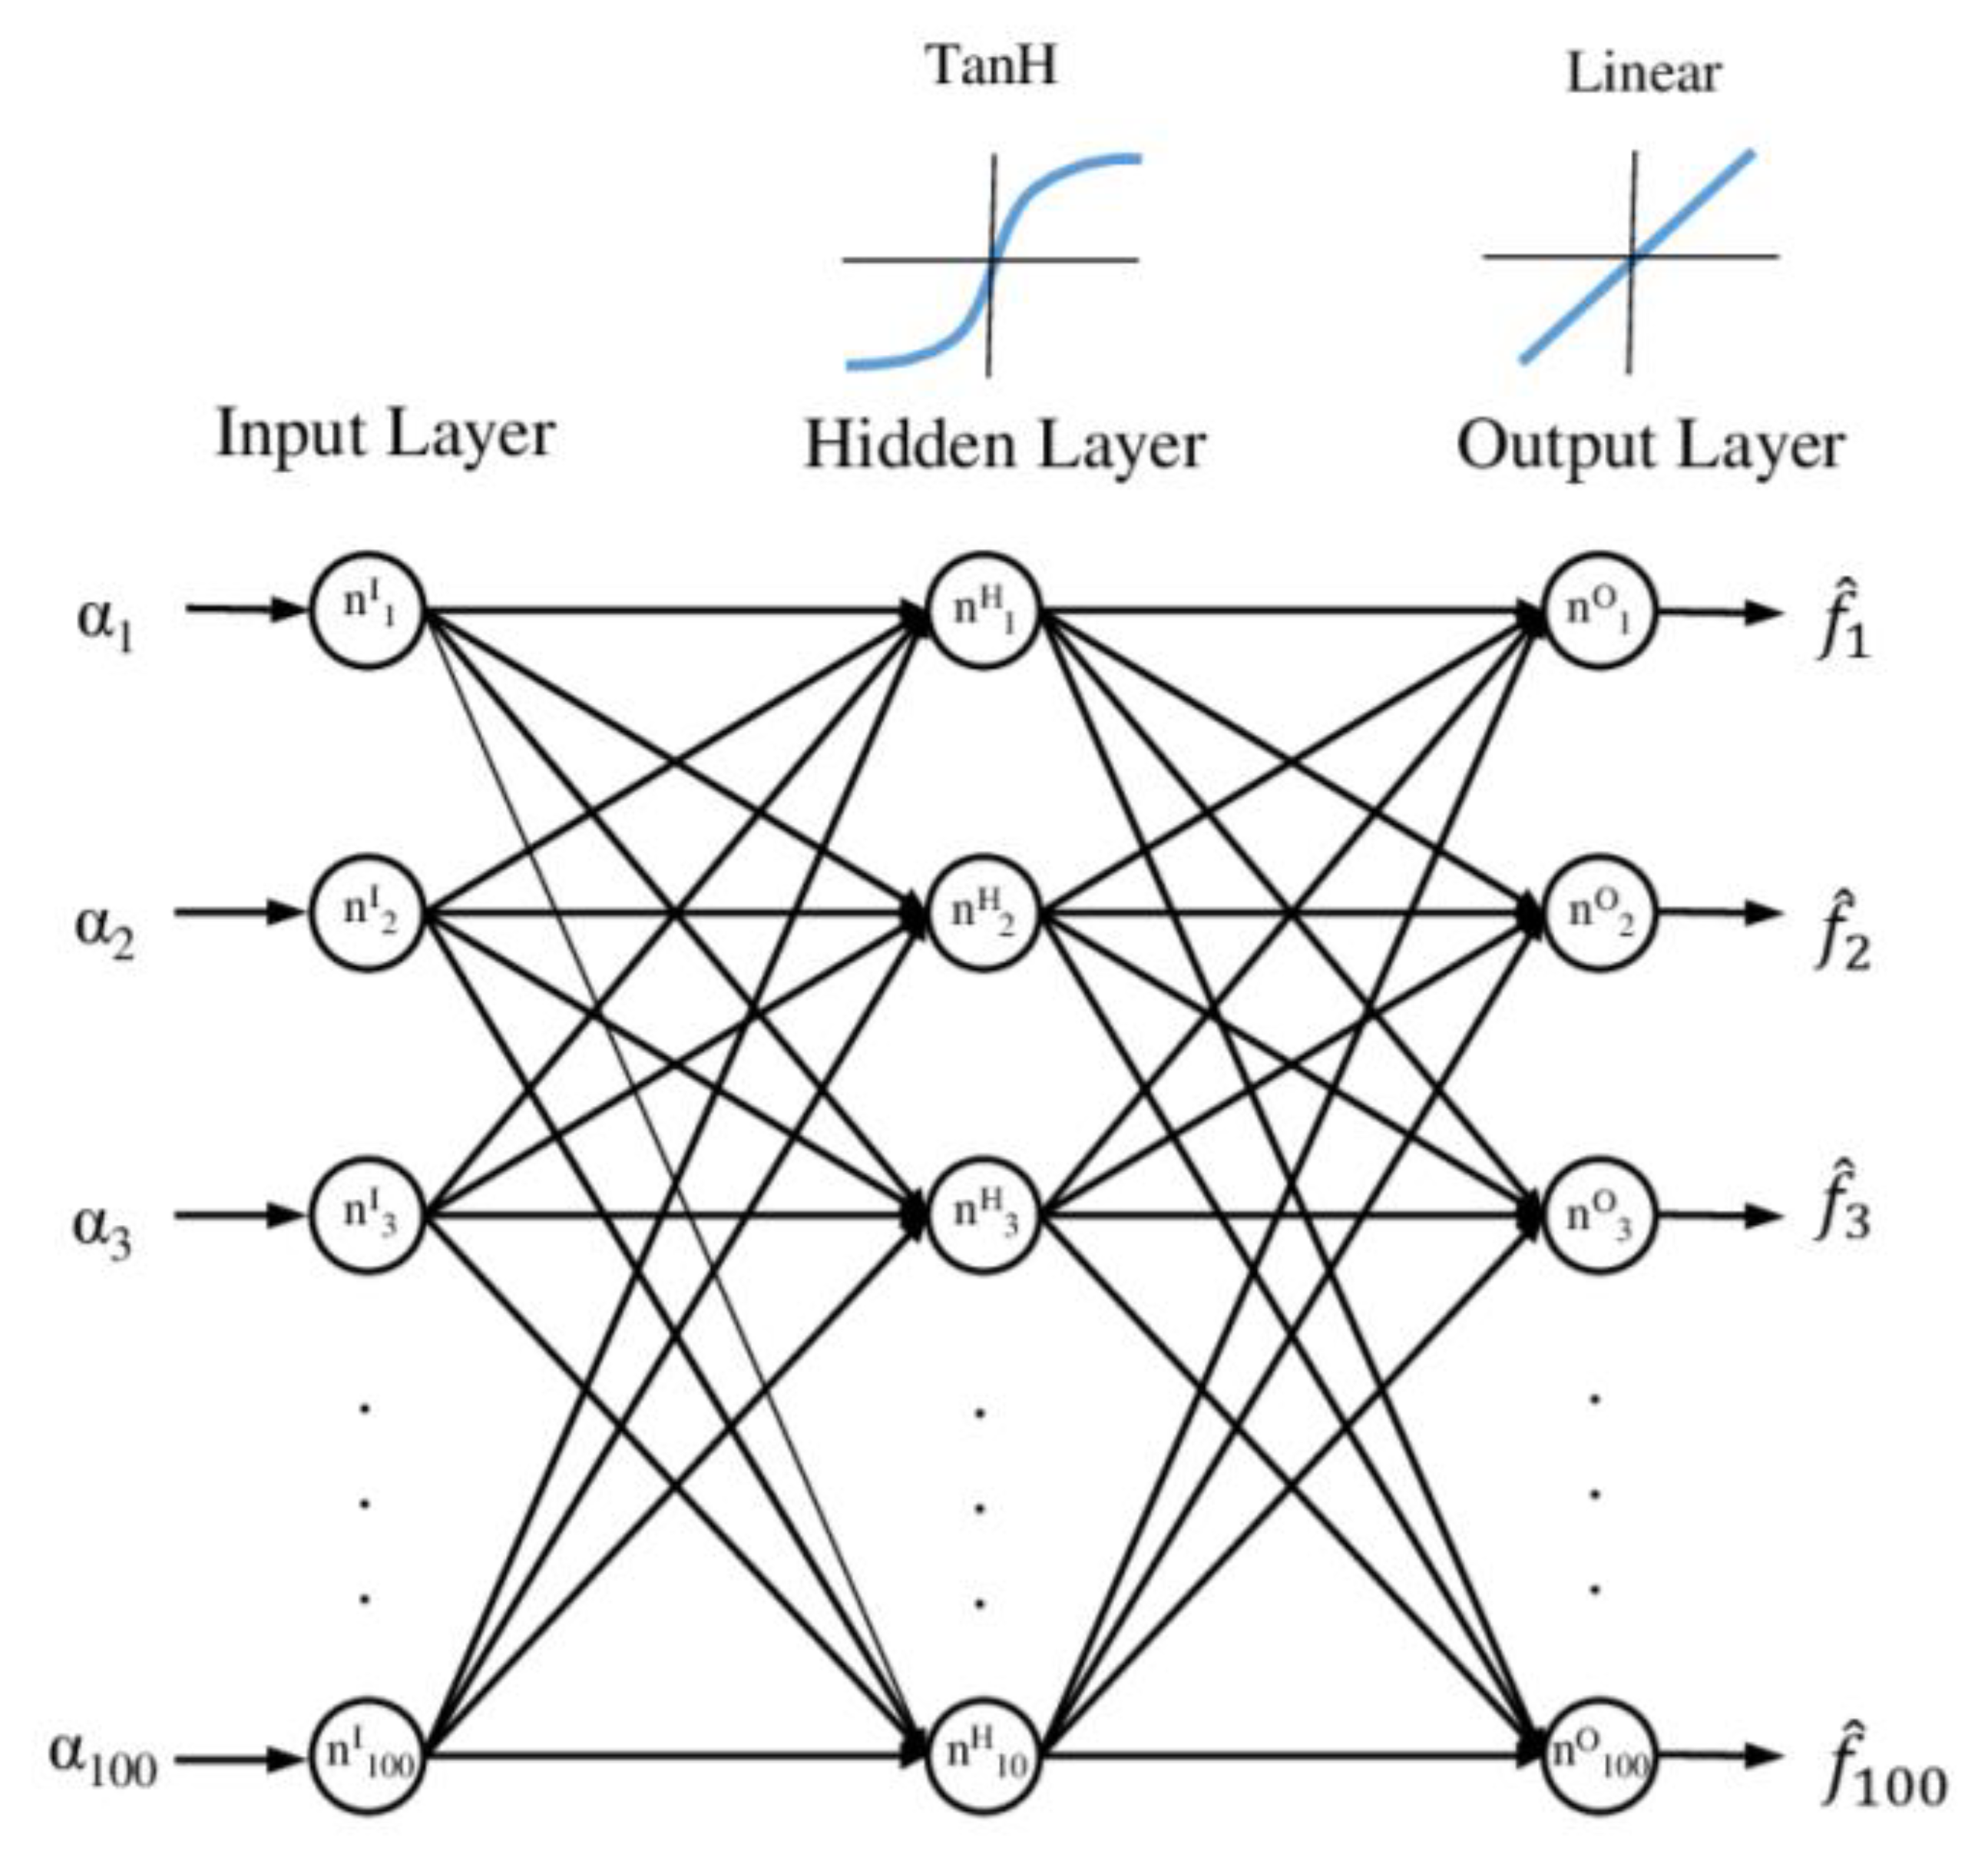
The prediction of the vertical GRFs is performed with the development of an artificial neural network (ANN). The developed regression model is fed with the vertical local component of the IMUs’ acceleration signal (e.g., shank’s longitudinal acceleration) and is trained to estimate the vertical GRF component in the global frame. The developed regression ANN (Figure 8) consisted of three layers, with the input layer composed of 100 neurons, a hidden layer of 10 neurons (with tanh as activation function, and dropout regularization), and an output layer of 100 linear neurons. Further details on the ANN model developed are available in [23,24].
Finally, based on the recorded acceleration signals and the GRF predictions, a series of running metrics is calculated for each recorded trial. All reported metrics are the average of all stances that are included on each recording, apart from the total force metric. Additionally, every metric is calculated for each leg separately, apart from cadence and asymmetry. The considered metrics are as follows:
  • Num. Contacts: number of stances in each trial as determined by the event detection algorithm
  • Contact time: average stance time of all recorded steps in milliseconds
  • Swing time: average time between toe-off and heel-strike for each leg in milliseconds
  • Step time: average time between heel-strikes for each leg in milliseconds
  • Cadence: number of steps per minute (steps/min)
  • Peak time: average time of the maximum force, expressed as percentage of the stance phase
  • Peak force: average maximum force during stance, expressed in body weight (BW)
  • Mean force: average force during stance, expressed in BW
  • RMS force: average root mean square of the force during stance, expressed in BW
  • Total force: sum of the peak forces of all stances, expressed in BW
  • Asymmetry: average absolute error between the force peaks of both legs in all stances as a percentage [38]. Values closer to 0 indicate stronger symmetry in movements
  • Stability: absolute error between the GRF of two consecutive stances expressed as a percentage, and averaged over all the steps [39]. Again, values closer to 0 indicate better stability
  • Fatigue: a dimensionless coefficient which is calculated as the slope of the linear regression line that fits the angular rate at the mid-swing events over all gait cycles [40].

4.3. Jumping Activity Recognition and Event Detection

Similar to the running trials detection, a targeted algorithm was developed for the activity recognition of the jumping tasks. Jumping events and performance parameters were calculated solely using the acceleration and angular rates of a single IMU placed on the subject’s pelvis. Countermovement and squat jumps were considered in this work. When a jump is detected, the acceleration signal is double integrated with respect to time, resulting in the computation of the body’s center-of-mass velocity and position in three dimensions with respect to the local reference system.
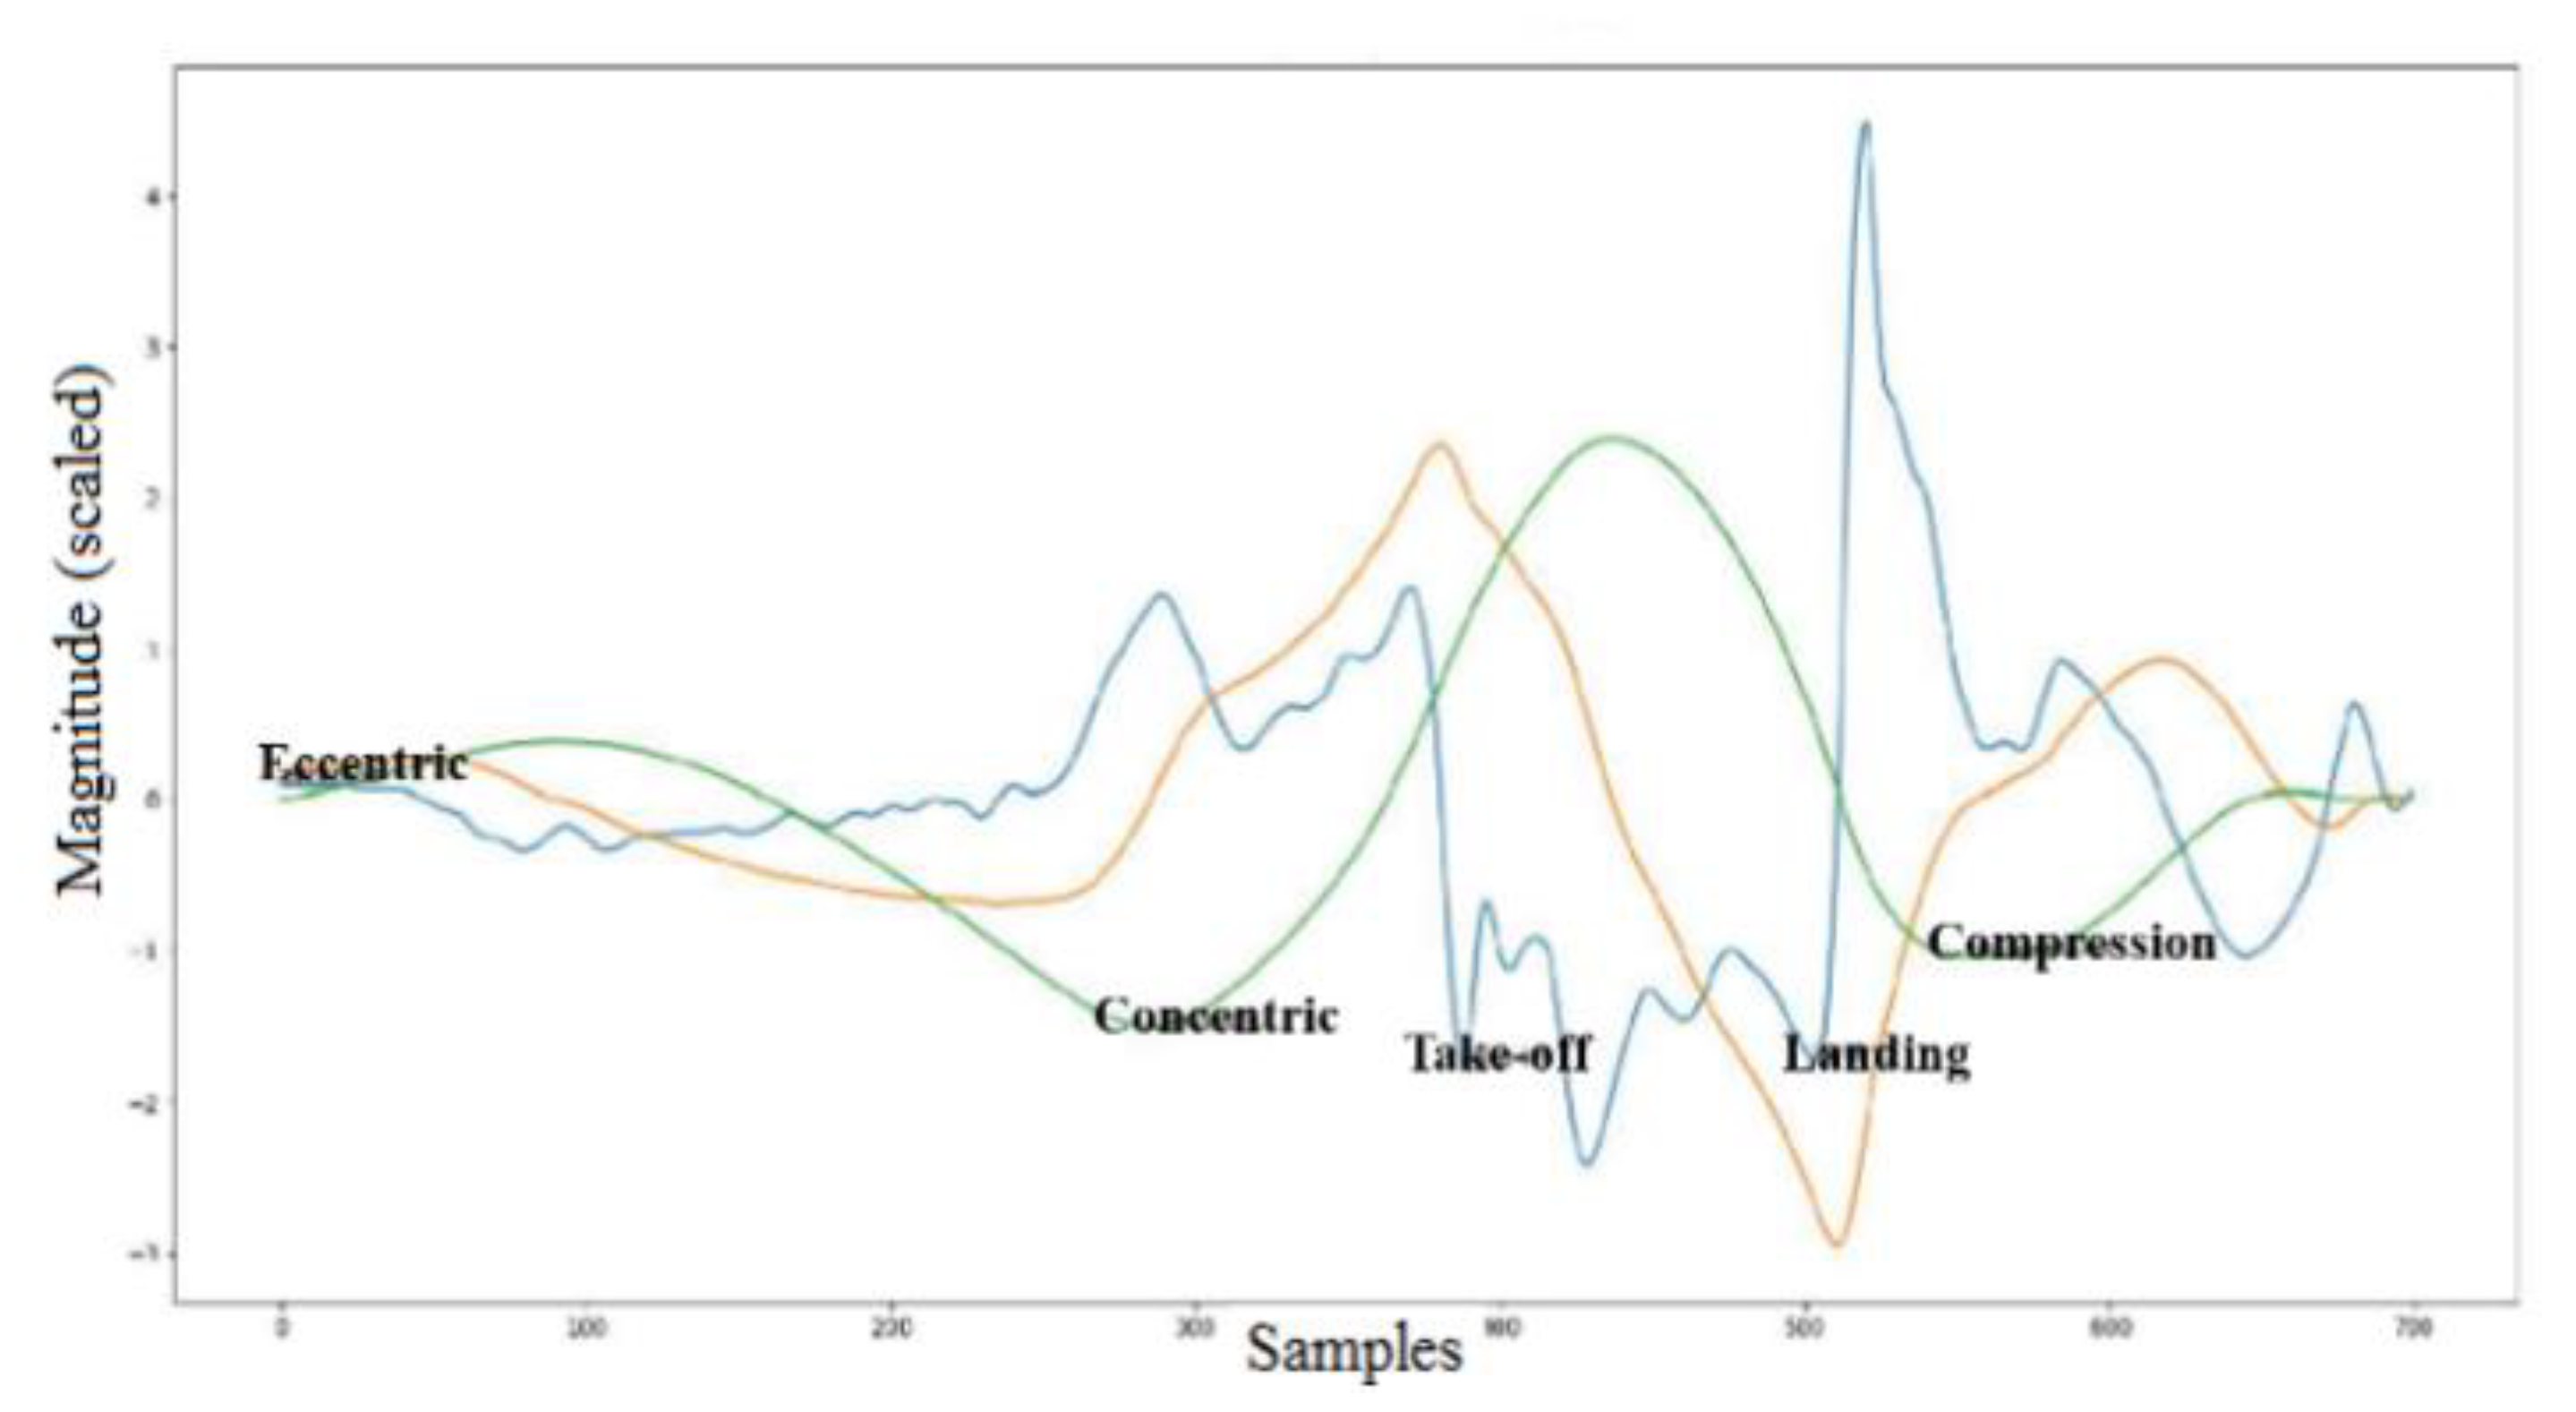
Specifically, for event detection, the proposed approach utilized both the vertical accelerations and sagittal angular rates recorded by the IMUs during data capture. The algorithm initially searches for the peaks of the linear acceleration signal which correspond to the landing of each separate jump. Subsequently, changes in variance in the angular rates are used to detect the initiation of the eccentric and concentric phases. In more detail, the start of the eccentric phase is identified as the time at which the variance of the sagittal angular rate is higher than a predefined threshold. The start of the concentric phase is, alternatively, identified as the time at which the velocity changed sign from negative to positive, which also corresponds with the instant when the change in the displacement becomes positive.
Additionally, take-off is identified as the first local minimum of the acceleration after the absolute maximum of the velocity signal, corresponding to the time just before take-off. Landing is identified as the previous local minimum in acceleration with respect to the absolute maximum in the force, corresponding to the time just after landing. The phases and event detection definitions are taken from Cormie et al. [41].
Finally, the type of jump is also recognized: if the time between the initiation of the movement and landing is shorter than three seconds, then the task is identified as a countermovement jump, otherwise it is identified as a squat jump. The threshold was set at three seconds since, generally, when performing a squat jump, athletes are required to maintain the squat position for at least 1–2 s.
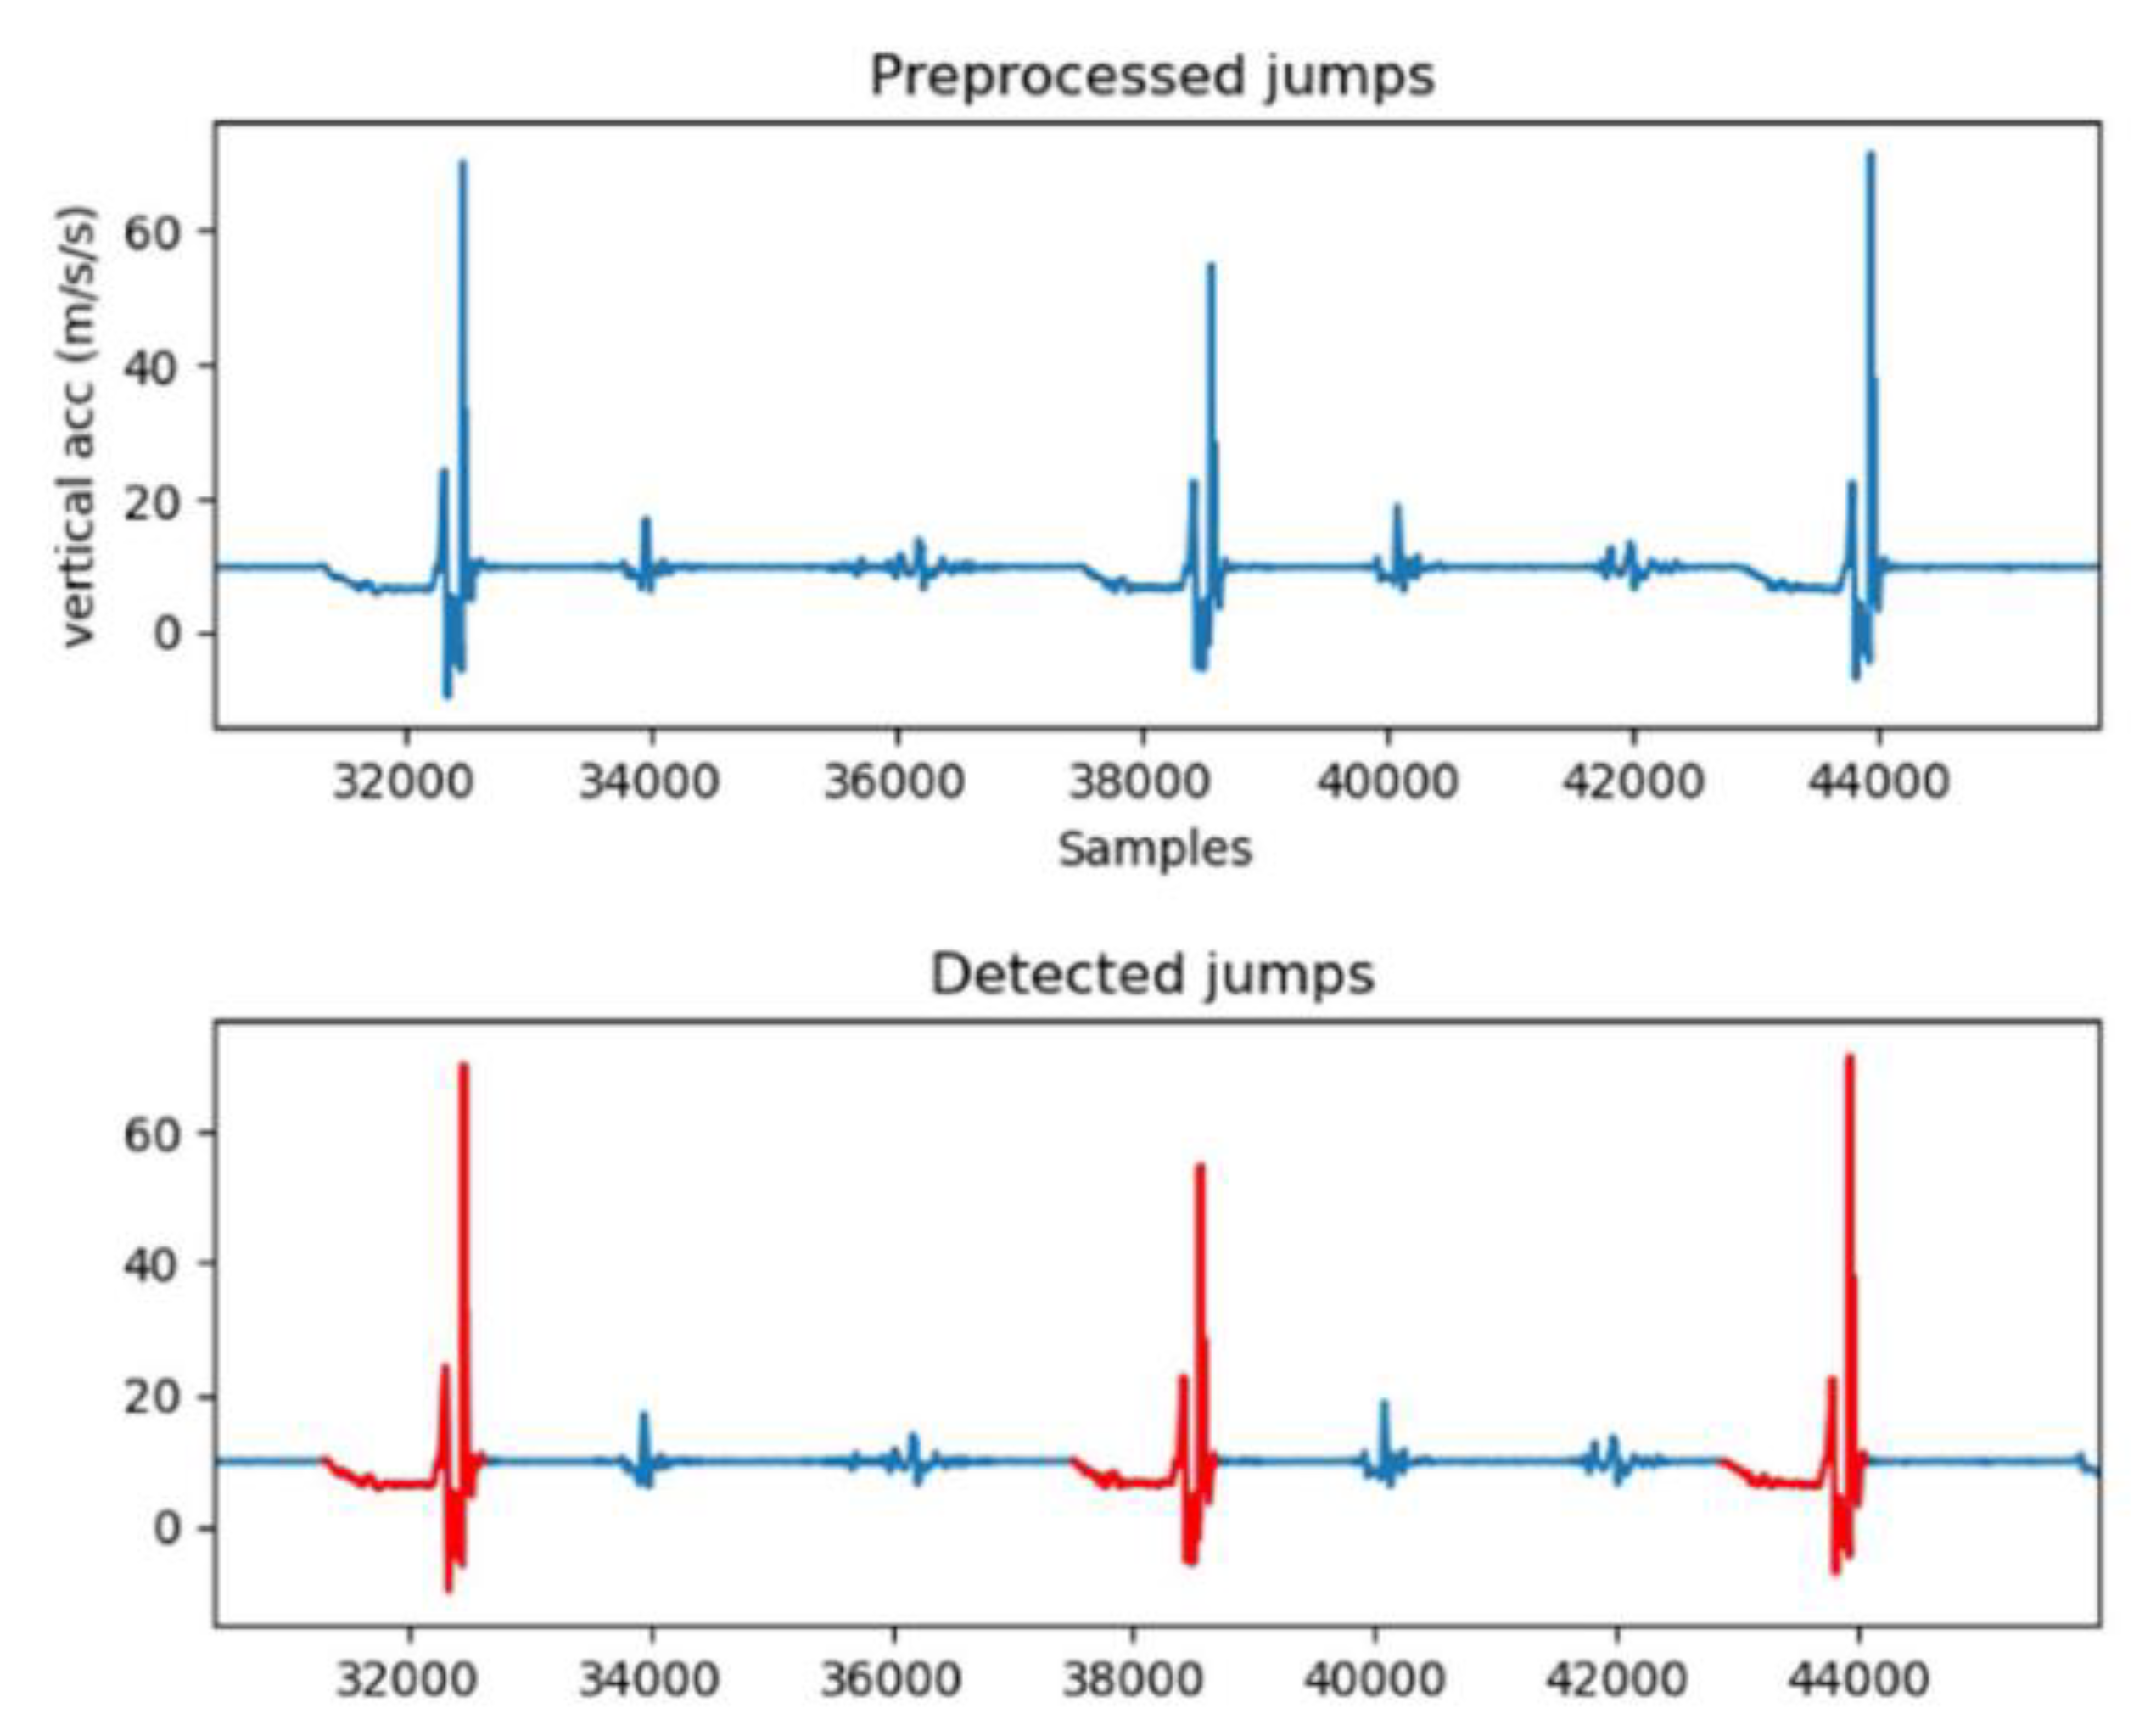
Figure 9 shows an example of the implemented algorithm for the jumping task recognition. Following the jump task recognition, the algorithm proceeds in the detection of the temporal events (take-off, landing, etc.) for each separate jump. Figure 10 shows an example of the result of the event detection as performed by the algorithm.

4.4. Jumping-Related Metrics

Following the activity and event detection, jumping metrics can be calculated for each jump. In particular, the force curve is obtained as the product of the vertical acceleration of the pelvis and the mass of the subject. The velocity curve is calculated as the time integral of the vertical acceleration of the pelvis, while the displacement curve is estimated as the time integral of the velocity signal. The power curve, finally, results as the product of the estimated force and velocity.
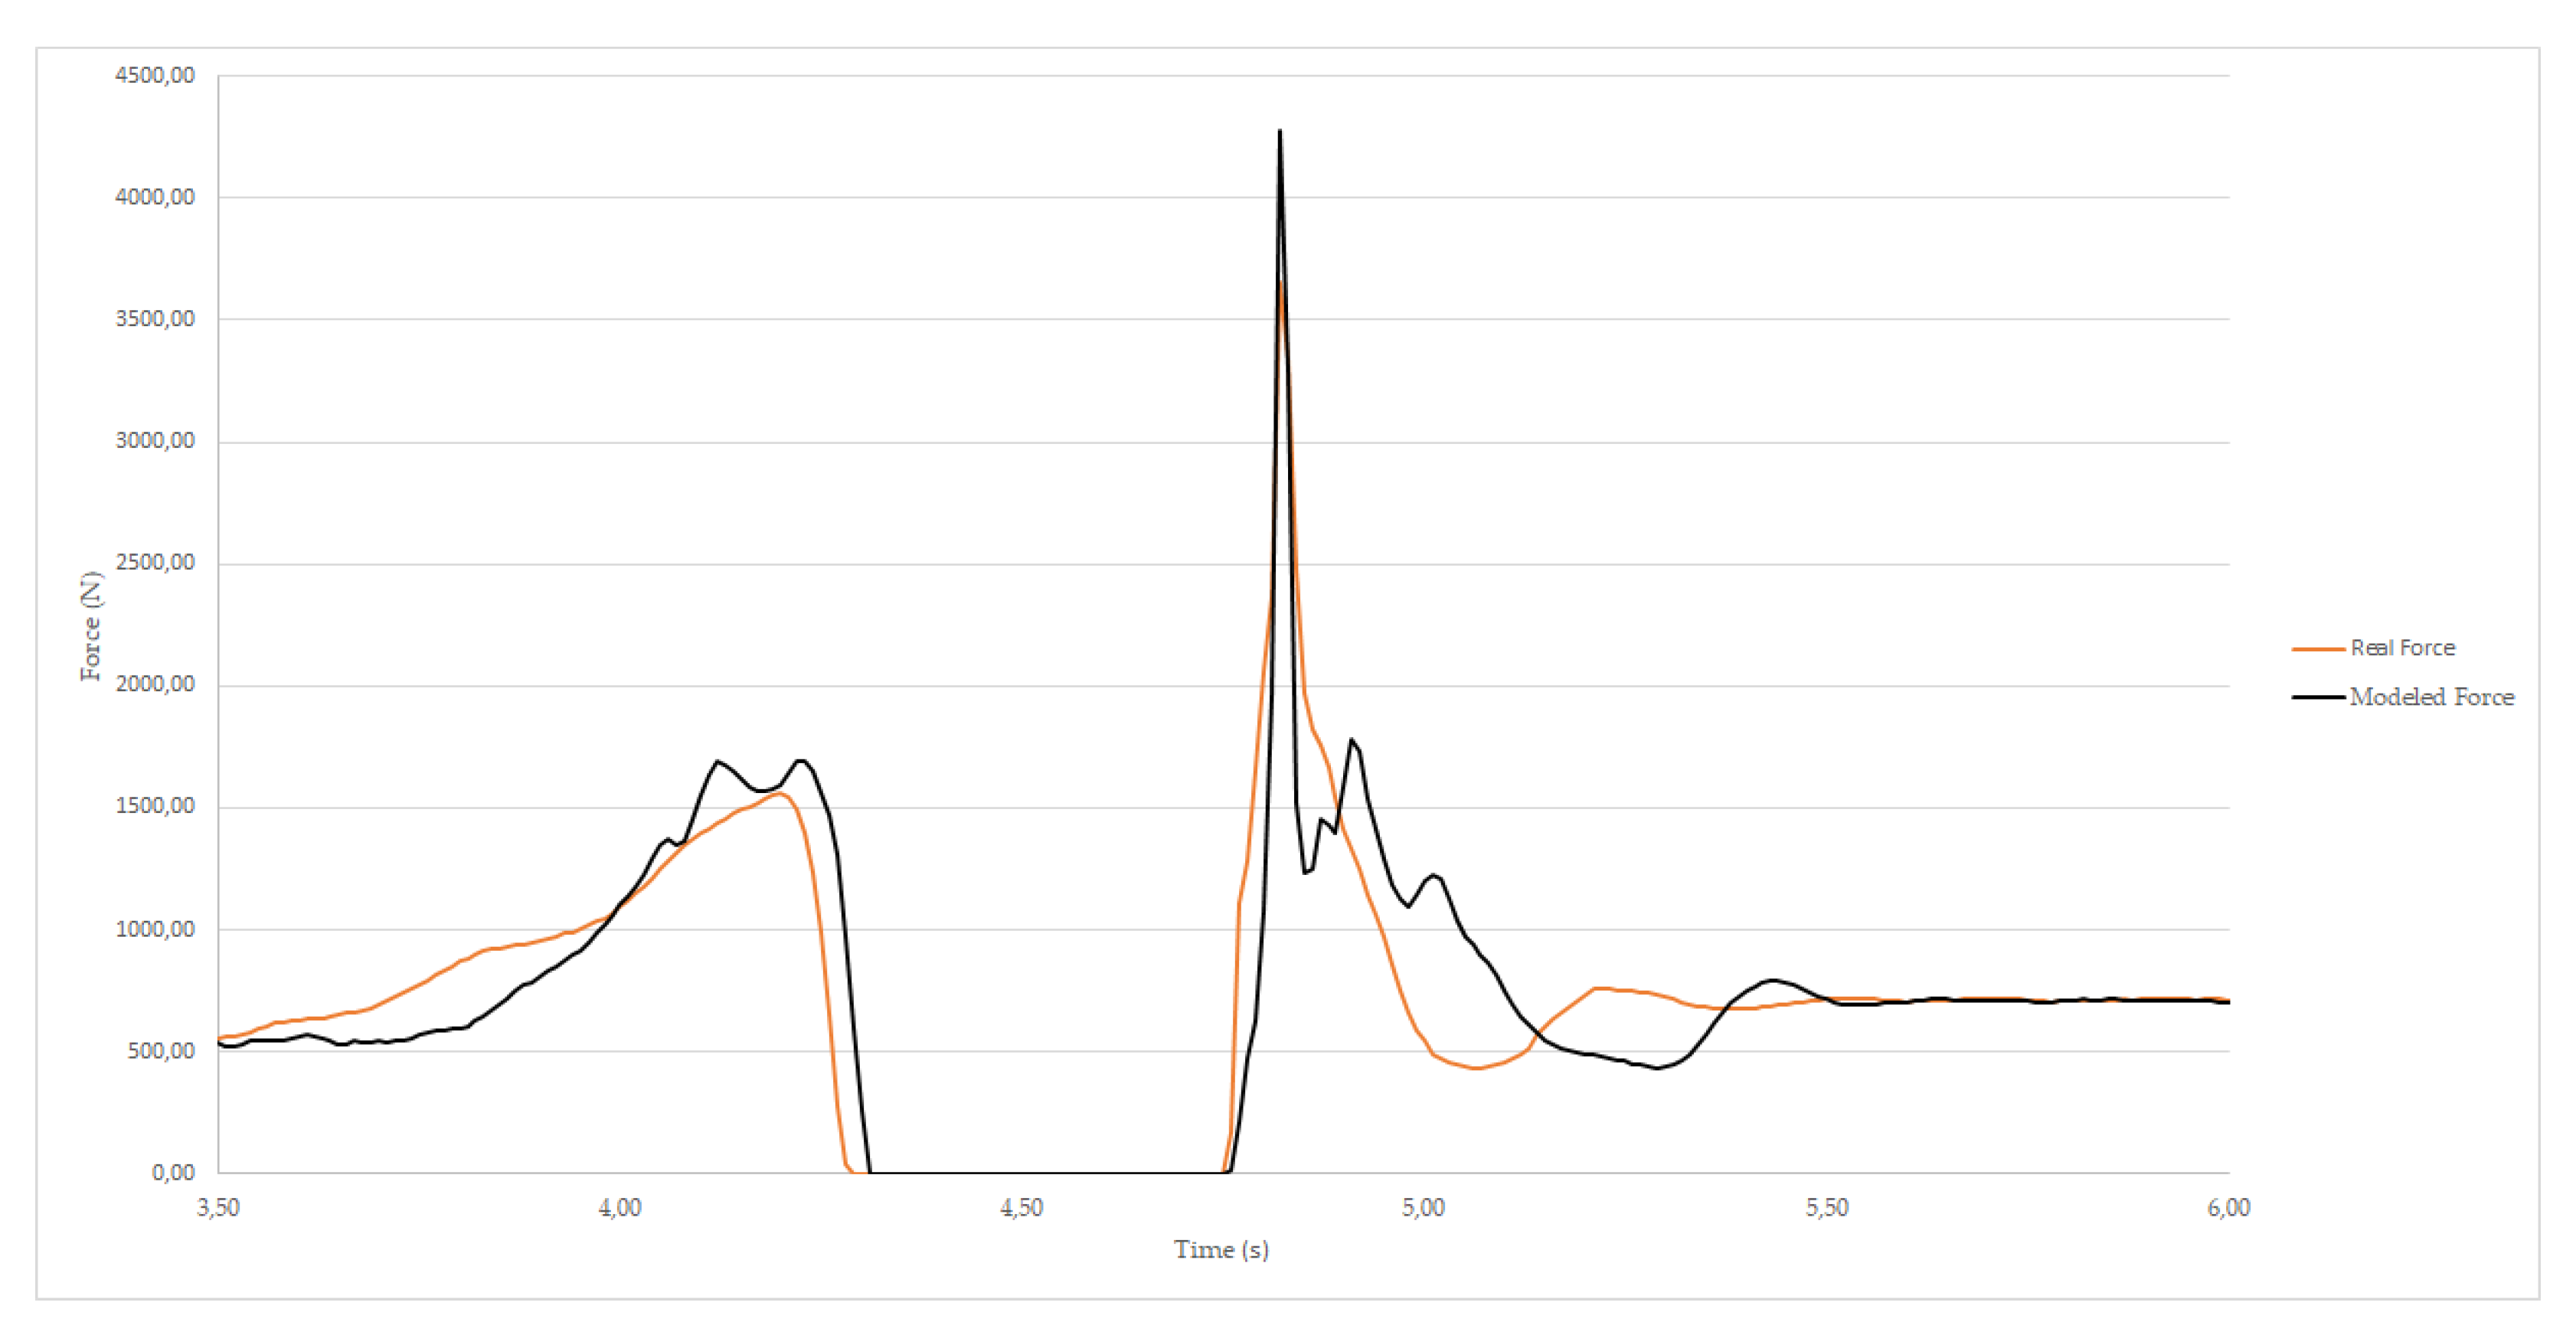
The peak force and peak power at the concentric and eccentric phases are defined as the corresponding maximum metrics between the initiation and the end of the two phases. The peak force at landing corresponds to the overall maximum estimated force. Velocities at take-off and landing correspond to the estimated velocities at the two events, whereas flight time is the time between the landing and take-off events. Finally, jump height is obtained from the flight time using the formula discussed in [42] (Equation (1), where tFLIGHT is the time flight and g the gravitational acceleration). Figure 11 shows an example of the comparison between the actual and the modeled force curves during a jump.
height = g × tFLIGHT2/8

5. Graphical User Interface (GUI)

A GUI was developed with the two-fold objectives of allowing the end-users to interact with the hardware platform and the back-end analytics, as well as a tool for the visualization of the results. Based on the end-user requirements, the GUI specifically allows the user to:
  • Load the data collected and stored on-board the SD cards of the hardware platforms (when the boards are connected via USB to the computer). This step will automatically start the activity recognition process with the goal of detecting every data collection carried out and, for each of them, the number of running trials/jumps performed.
  • Annotate the demographic/anthropometric information for the athlete under test.
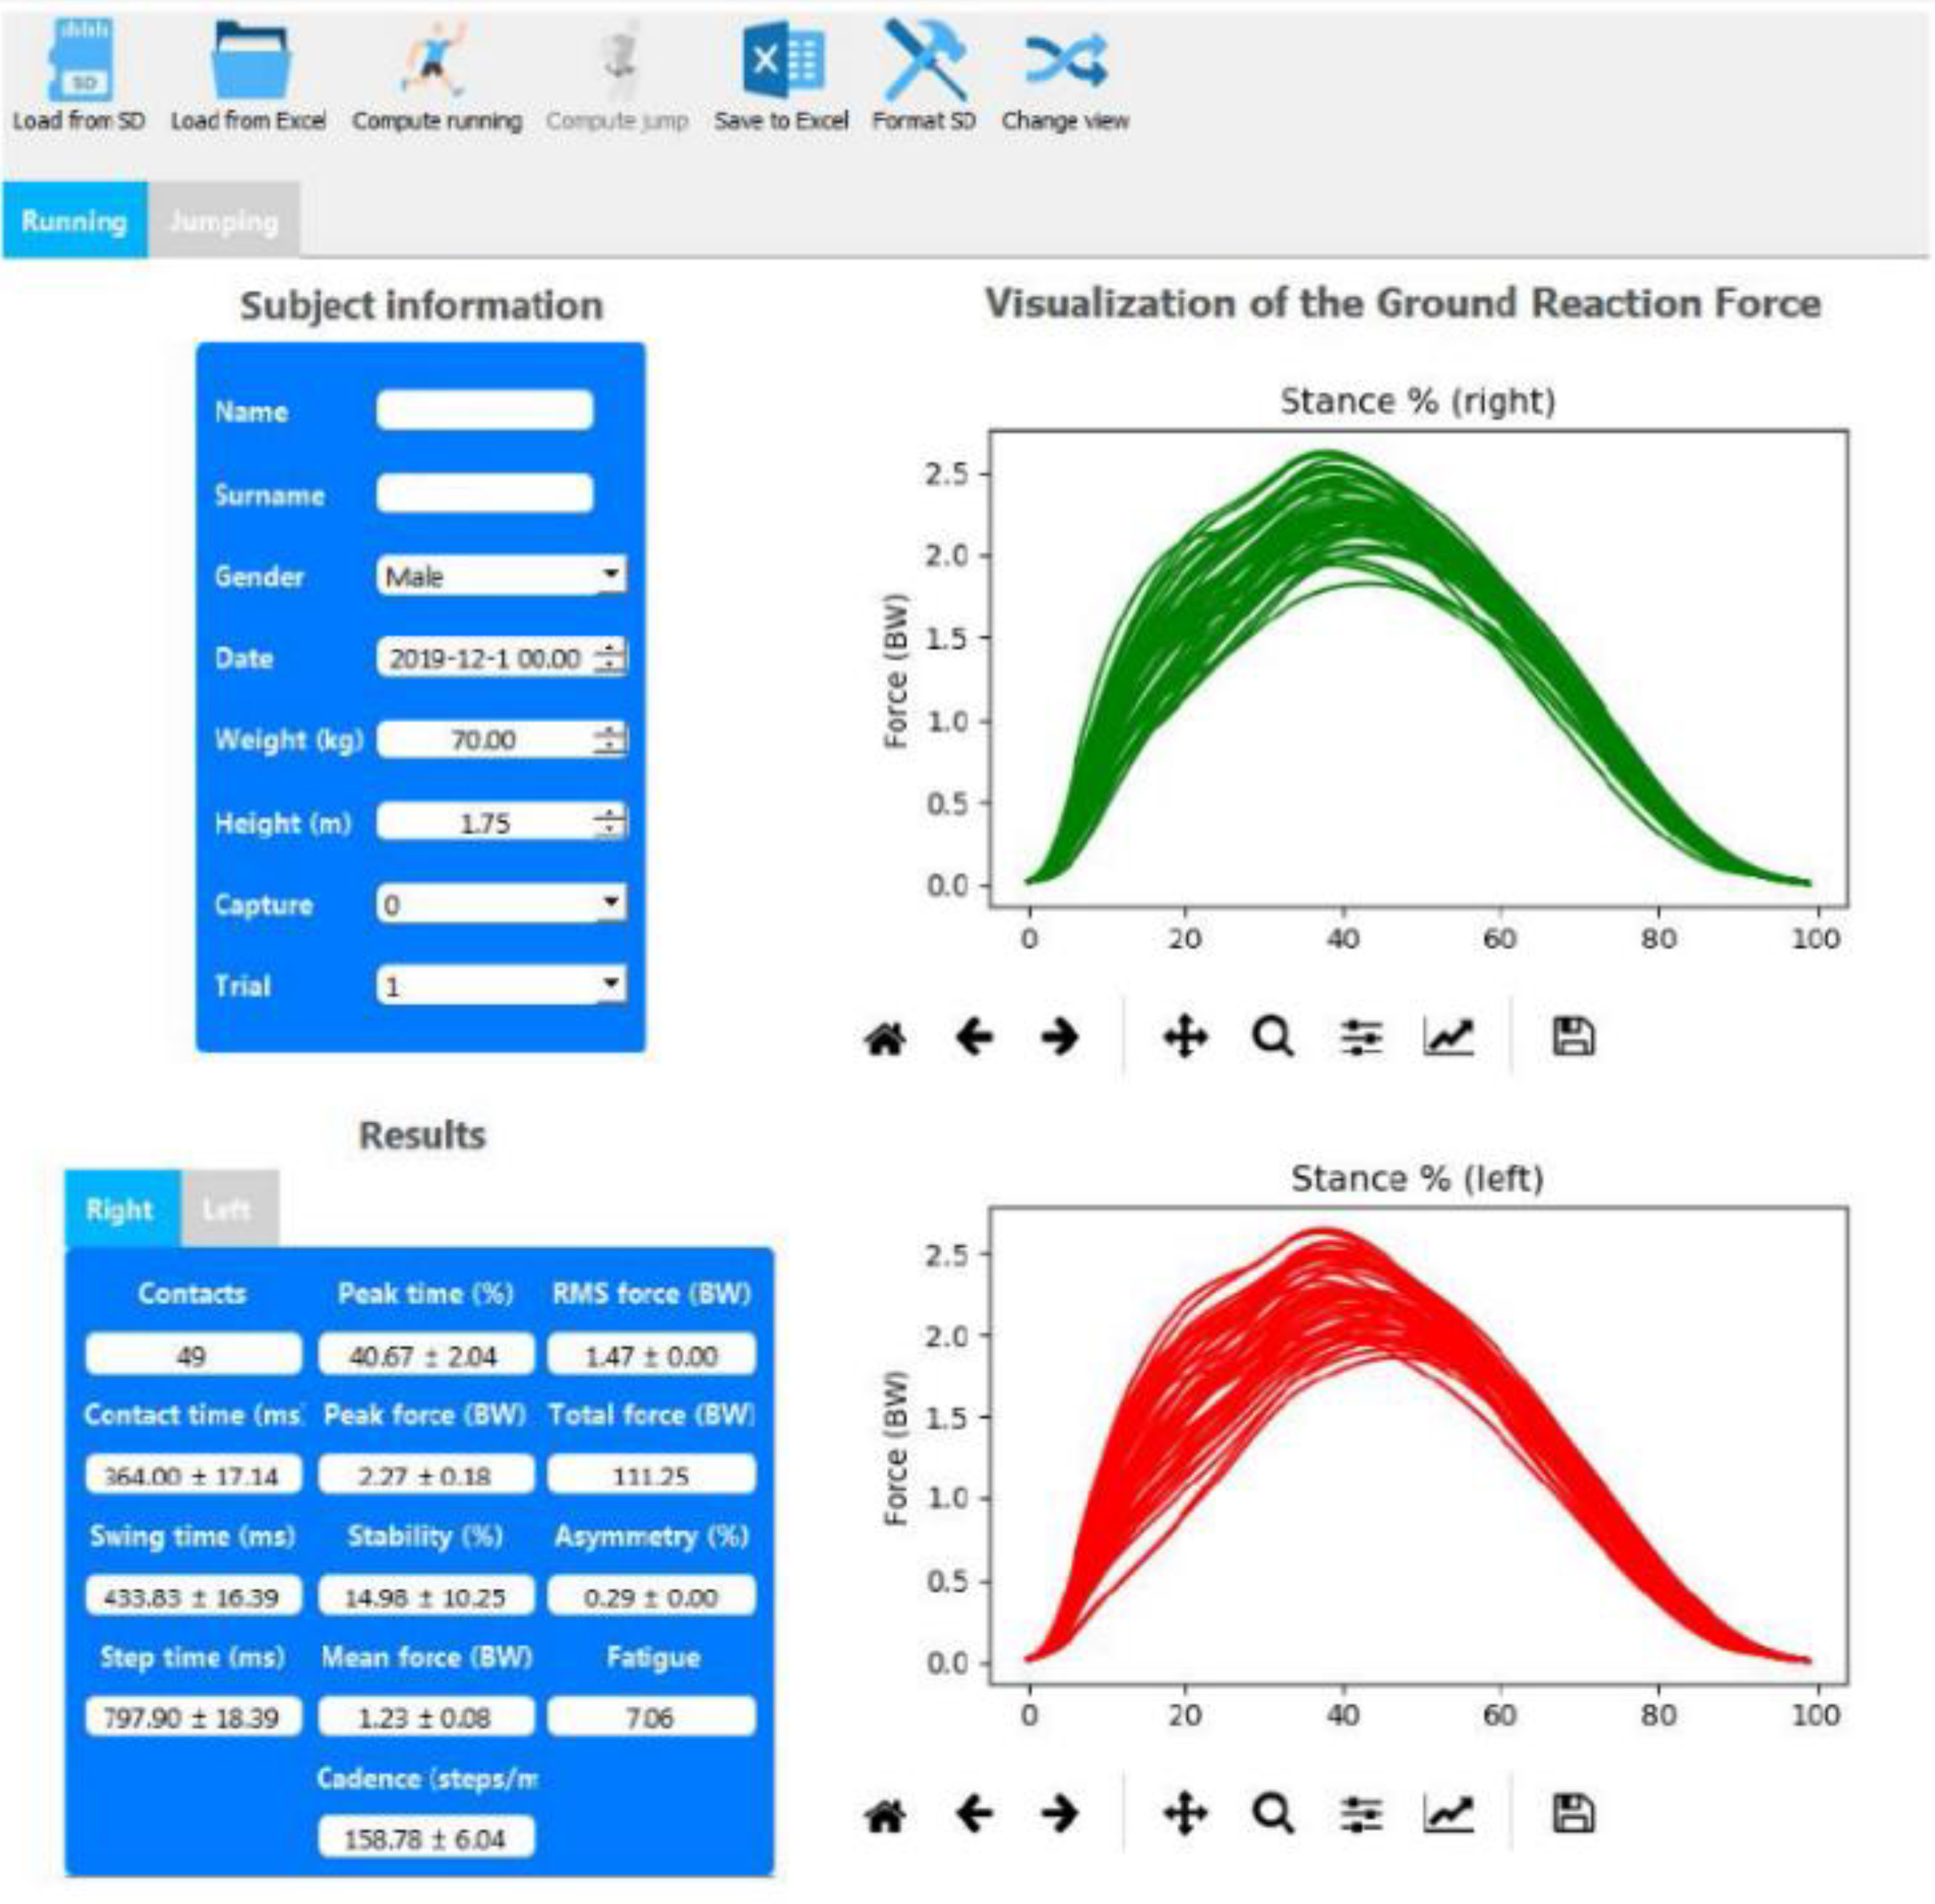
  • Analyze a specific running trial and compute the vertical GRFs and the running metrics from that trial showing the results graphically (Figure 12). The average GRF curves are also visible when clicking on the “Change View” Table.
  • Analyze a specific jump and compute the related metrics separately for eccentric and concentric phases, as well as visualizing the vertical acceleration, along with the jump events (start of the eccentric phase, start of the concentric phase, take-off, landing, and maximum compression). An example is depicted in Figure 13.
  • Export the computed results, subject information, and raw inertial data of a specific running/jumping analysis on an Excel file.
  • Load the results of an analysis previously saved on an Excel file.
  • Format the SD cards of the hardware platforms, without the need to remove the SD cards from the boards.
The GUI and all the required algorithms were written in Python and then converted in a single user-friendly executable file of approximately 15 Mb working on computers with Windows 7/8/10 as the operating system. As a result, the end-user does not require to install specific libraries or license when using the executable file.

6. System Test and Analysis of Results

For the test and validation of the developed system, fourteen healthy volunteers were recruited (14 subjects; 10 males; mass 70 ± 8 kg; age 29 ± 3.4 years). Participants were excluded if they reported any previous musculoskeletal disorder. Recruits were aged between 20 to 40 years of age and were able to comfortably perform physical activity.
The gold-standard systems used for validation purposes included the Loadsol pressure in-soles (Novel, Germany) [43] for running tasks and the Podium’s force plates (BTS Bioengineering, Italy) [44] for jumping tasks. The Loadsol system measures vertical GRFs on the plantar surface of the foot in static and dynamic movements and has been recently validated in running scenarios [45,46]. Those studies [45,46] showed that the mean bias of ground contact time, impulse, peak force, and time to peak ranged between 0.6% and 3.4%, demonstrating high accuracy, while for these same parameters, the limits of agreement analysis showed that 95% of all measurement differences between insole and force plate measurements were less than 12%, demonstrating high precision. Moreover, the Loadsol system showed excellent between-day reliability (>0.76).
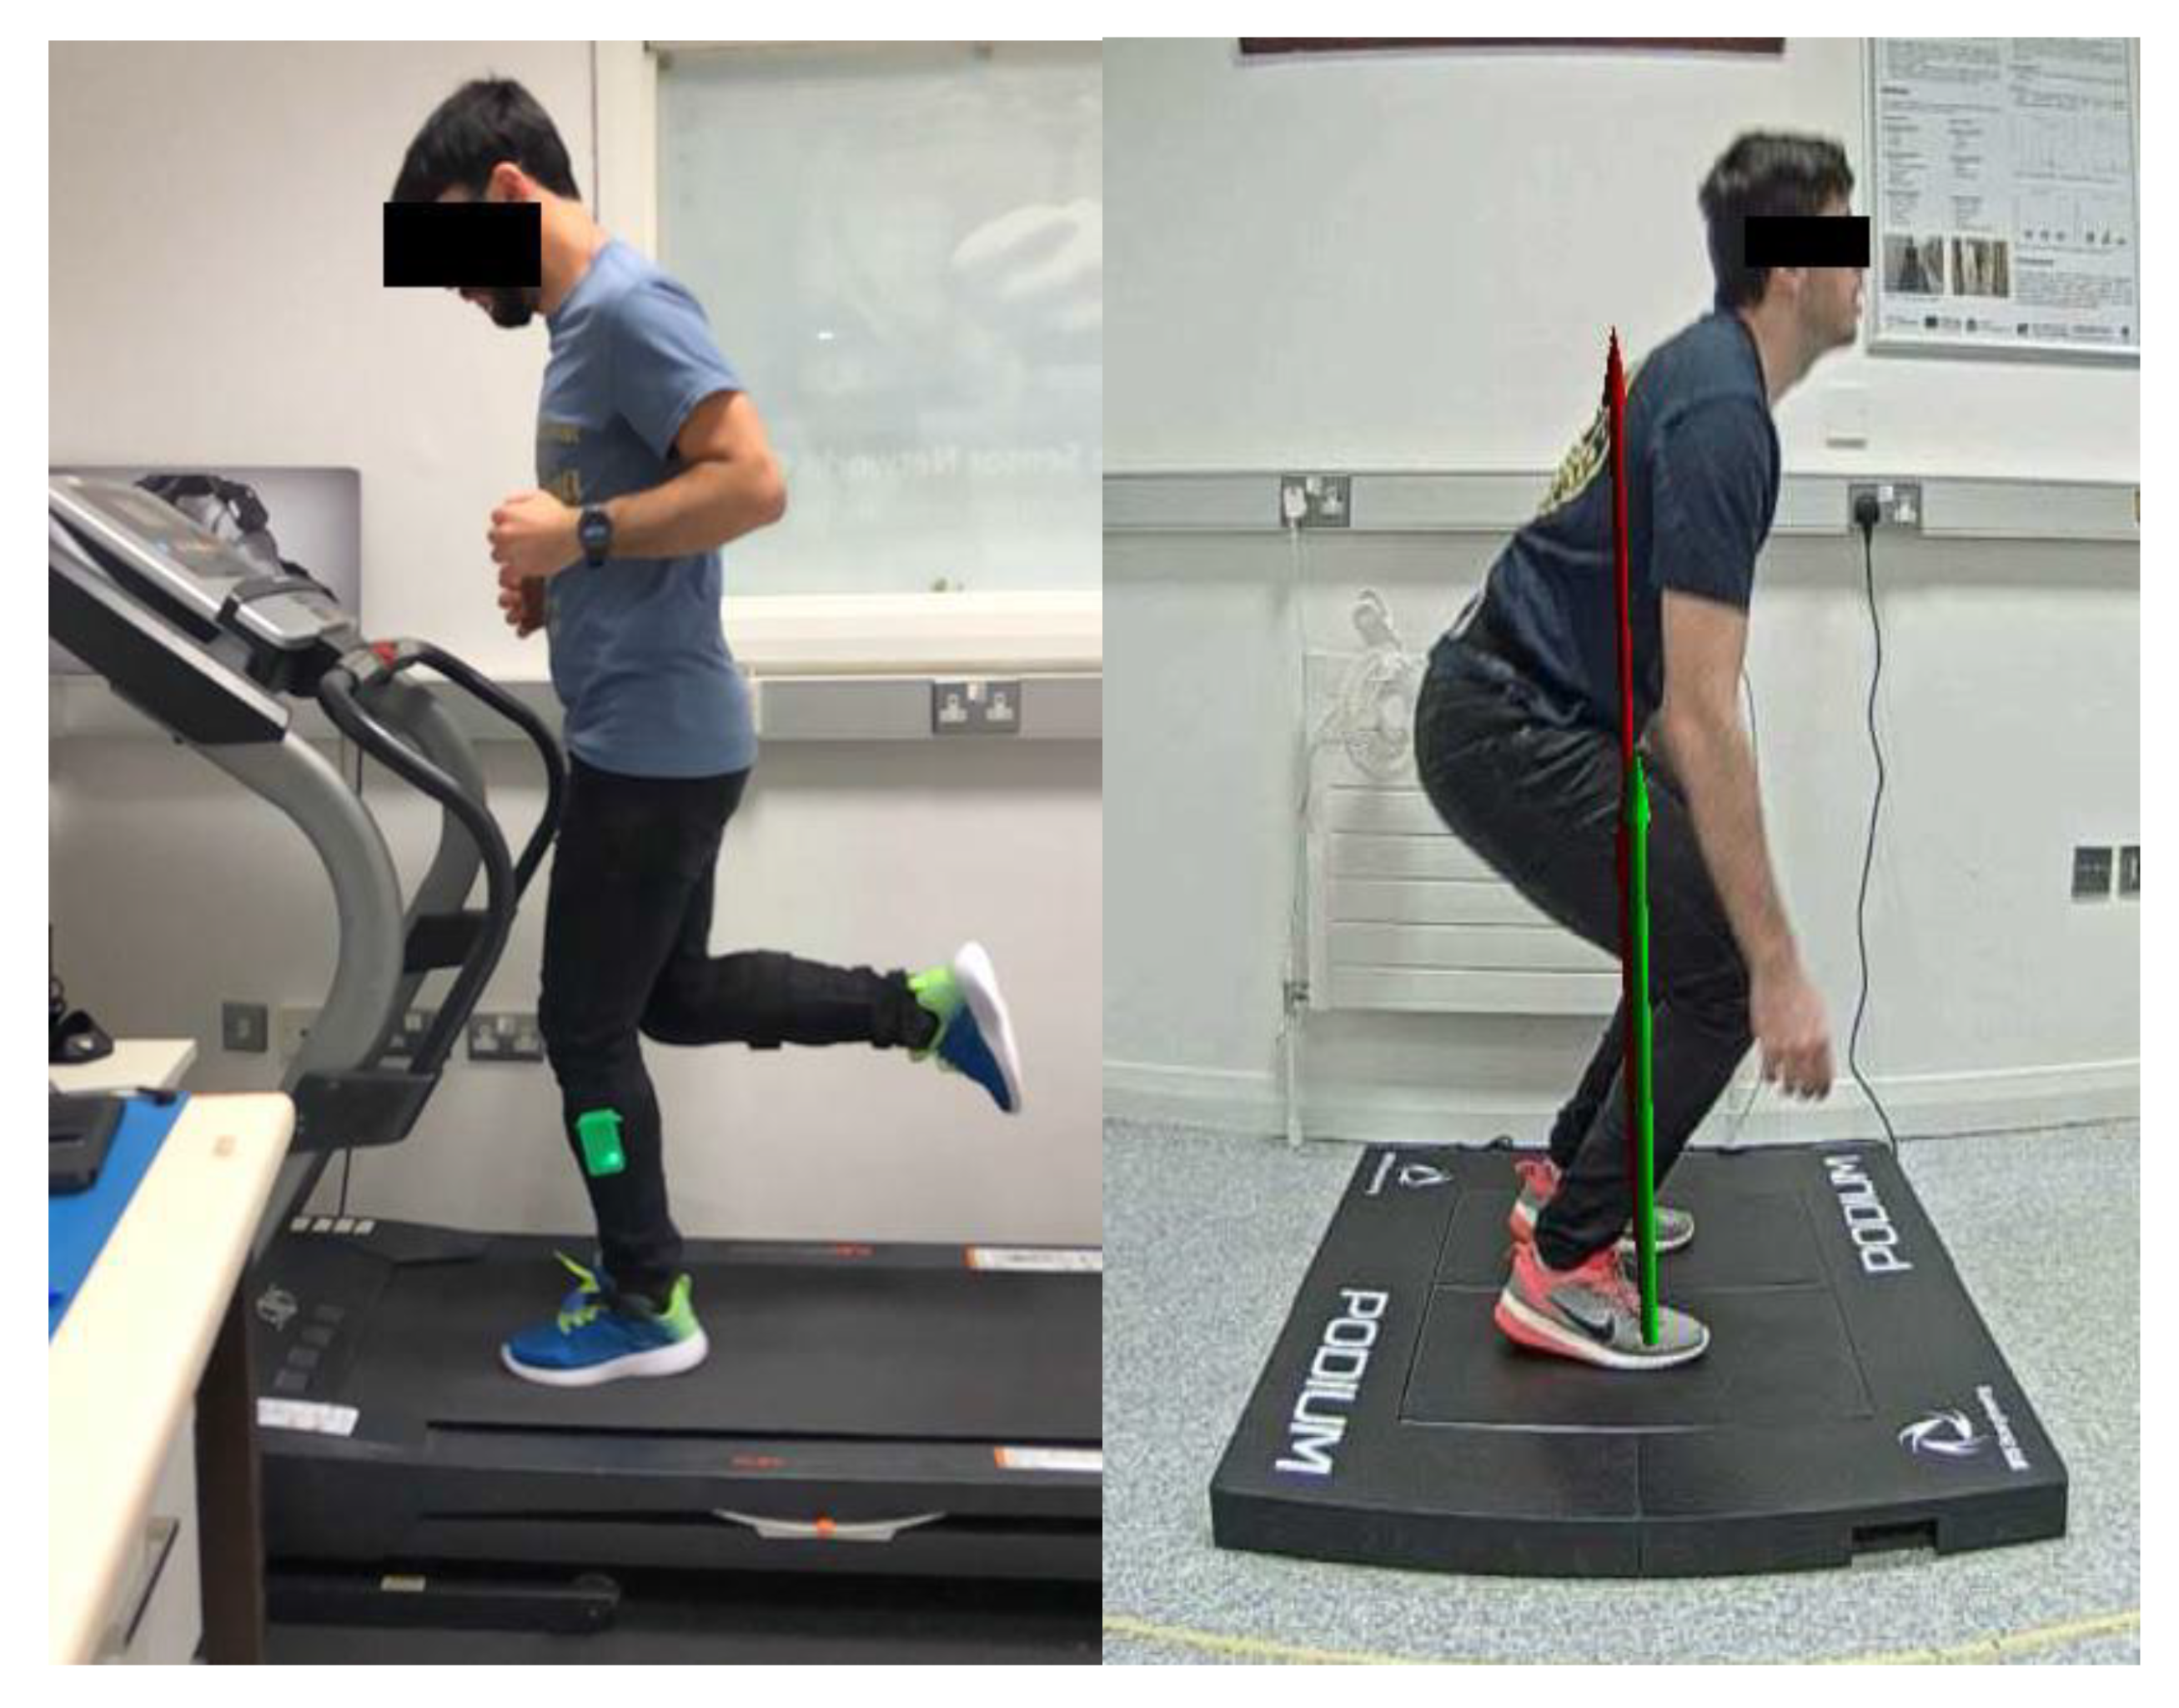
Participants were asked to attend a single session and run on a treadmill at different speeds (8, 10, and 12 km/h) for approximately 30 s per recording, as shown in [23,24]. Each participant was fitted with two IMUs attached on the lateral side of the shanks with elastic bands and with a pair of shoes (same model) equipped with the pressure in-soles (Figure 14 left). IMU data were stored on the developed devices, while kinetics were stored on the tablet used to interact with the pressure in-soles. The IMUs were automatically synchronized with each other as described in Section 3.3. The data sets from the developed IMUs and the gold standard pressure in-soles used for validation were synchronized manually during the post-processing process through the use of a recognizable event (a vertical jump generating a spike in both foot pressure and acceleration signals) as a reference for alignment. A threshold of 20 N in the vertical component of the GRFs was also employed for the identification of the strides. Overall, 42 running trials of 30 s with 60–70 stances each were used for the analysis.
Following the running session, four subjects were asked to perform a series of countermovement and squat jumps on the Podium’s force plates. A single IMU sensor was placed with an elastic band on the pelvis of each person approximately at the midpoint of the posterior superior iliac spine (Figure 14, right). Acceleration signals from the IMU along with the kinetic data from the Podium were recorded for each jump and synchronized manually in post-processing. Overall, twenty jumps were considered for validation. The study was conducted according to the criteria set by the declaration of Helsinki and approved by the Clinical Research Ethics Committee (CREC) of the Cork Teaching Hospitals at the University College Cork (Reference Number: ECM 4 (u) 22 October 2019 and ECM 3 (ppp) 14 January 2020).

6.1. Running Activity Results

Predicted and measured GRF waveforms were averaged and plotted for all the stances of the test set (Figure 15). The root mean square error (RMSE) was used as a metric of comparison between predicted and measured GRF as already performed in literature [19,20,23,24]. As confirmed from the RMSE in Table 1, predictions of the vertical GRFs (dashed orange line) were highly precise for all running speeds. Additionally, it appears that estimates made by the ANNs were generally independent of running speed since RMSE were very low for all conditions and returned an average error of approximately 0.148 BW. Predictions were very precise when compared to similar estimates from other studies in the literature. For example, Wouda et al. [19] used inertial sensors at the lower legs and pelvis along with an ANN to estimate vertical GRFs with an RMSE less than 0.27 BW. Moreover, also GRF-related metrics, such as the peak force, were reliably estimated (relative error approx. 5%), as shown in Table 2. Finally, the activity recognition algorithm detected 100% of the running trials carried out for validation purposes.

6.2. Jumping Activity Results

Jumping metrics results are summarized in Table 3. The table presents the relative error between the estimations obtained with the implemented algorithm and the force platform metrics. A positive sign of the error indicates an underestimation by the proposed system, whereas a negative sign indicates the opposite.
Some variables were estimated within an acceptable error range (±10%), while others presented only tolerable (±20%) errors. Those error thresholds were defined based on the suggestions in [47,48,49,50]. Some metrics presented larger errors as this is due to the fact that accelerometers are good at measuring acceleration but poor at estimating position, because of problems when integrating data, therefore inevitably introducing errors when estimating the velocity and position curves from an acceleration signal [51]. As a result, metrics calculated from the acceleration signal tend to be more accurate than metrics which, on the other hand, are estimated from the signal obtained following double integration over time. Therefore, it can be concluded that, even though the precision achieved may not be sufficient for some metrics, overall, the developed wearable system may satisfactorily predict some of the considered jumping metrics and provide an acceptable monitoring system for athletes’ performance. Again, the recognition algorithm detected 100% of the jumps carried out during testing.
A limitation of the system arises from the global force curve being calculated as the product of the vertical local acceleration of the IMU and the mass of the subject; this may cause errors in specific jumping phases (e.g., while the subject is in air, the predicted force should be instead close to zero, Figure 10) since the local IMU and global vertical axes are not always aligned.

7. State-of-the-Art Comparison

Wearable technology has been used by athletes and sport teams for a number of years with the goal to provide actionable insights to increase productivity and performance. It is expected that the wearable devices in sports market will register a growth of 9.82% between 2018 and 2023 [52] driven by increasing demand, technology progression, healthcare awareness, and increasing application of Big Data. The competitive landscape for IMU-based consumer-level wearables in sport includes a number of products whose characteristics are summarized in Table 4.
It is evident from Table 4 that only a few devices (i.e., Xybermind, IMeasureU, MyVert) are able to provide both running and jumping metrics. However, in the case of Xybermind, magnetic barriers are also used to provide the required variables. It is also worth noting that most of the products in Table 4 show impact-related features which, however, are simply associated with or derived from the peak landing acceleration (i.e., “g-landing”, “impact-gs” or “cumulative bone stimulus”), often accompanied by ambiguous terminology and without proper validations. Only RunScribe and ViPerform provide metrics obtained from the actual GRF curve; that is the peak vertical GRF and the horizontal and vertical GRF rate for the former, and the average GRF for the latter. However, it is evident that no device currently on the market provides as a running parameter the estimation of the full GRF waveforms from which well-known and standardized loading rate variables could be accurately extrapolated, representing a viable solution to support athletes, coaches, and sport scientists in their daily practice. As a consequence, the developed device fills a gap in the current technology landscape in which a single platform can be used to automatically detect every individual jump performed and each running stride from both legs, and provide running performance metrics and the full vertical GRF waveforms (and related variables) for each stride for both legs, as well as jumping metrics.

8. Discussion

Despite the various technologies currently adopted for injury prevention, the injury rate in sport is increasing [67]. This may be due to the current technology not yet providing key metrics to allow both the coach and athletes to make training and performance-related decisions (i.e., athlete wellness, musculoskeletal screening scores, training load, fitness, and fatigue) in real-time and on-the-field. Additionally, compared to specific orthopedic conditions for which clinical prediction rules exist, athletic training is lagging significantly behind in the area of clinical prediction modeling [68].
Wearables have been already used by athletes and sports teams for a number of years, in particular for tracking information associated with health and fitness. However, the development of tools for performance evaluation and prevention of running-related injuries is still in its infancy [68].
A number of works [69,70] have indeed considered the use of in-soles for pressure plantar monitoring and for the estimation of biomechanical loads associated with running injuries, and several companies have launched such products as shown in the review by Ramirez-Bautista et al. [71]. However, most of the products on the market focus only on the pressure heat map/distribution and they are still accompanied with practical long-term issues related to reliability, short lifespan, rapid degradation, feebleness, and high cost.
IMU-based wearable products (i.e., RunScribe [56], GaitUp [58], Stryd [62], IMeasureU [63], ViPerform [64]) are well-known already for providing biomechanical variables, such as contact time, swing time, cadence, stride time, stride length, speed, pronation angle, foot-strike type, distance covered, asymmetry, stiffness, and impact. However, current IMU-based wearable devices on the market provide loading parameters without specifying how they have been extrapolated or correlated to the GRF curve. Moreover, several devices fail to provide scientific evidence and validations on how accurate their outcomes are. Finally, those wearable devices often employ ambiguous terminology, such as “bone load”, “limb load”, “step intensity”, “impact score”, or “biomechanical load”, which could be confusing and misleading for end-users [72].
As a result, biofeedback from existing wearable devices may be ambiguous, not validated and potentially harmful for users [72]. Yet, the estimation of the full GRF waveforms from which well-known and standardized loading rate variables (i.e., impact peak, active peak, loading rate, and impulse) could be accurately extrapolated, may represent a viable solution to aid in the decision-making of coaches and sport scientists. In this direction, the system and prototypes developed and described in this paper, encompasses the design and integration of a performance-evaluation system able to reliably support coaches and athletes in their real-world practice in a number of sports, such as soccer, rugby, etc. The developed system meets the requirements set by the targeted task in terms of low-power, sampling rate (>200 Hz), wireless synchronization, activity detection, accuracy, number of metrics provided, and graphical visualization. Future work will investigate the possibility to adopt the developed system in agonistic settings, such as a real soccer match, and collect appropriate feedback on its usefulness from actual professional end-users.
The developed system, however, presents some limitations. The implemented activity and event recognition algorithms are specific for the considered case study, and may not be suitable for recognizing running and jumping from other activities (e.g., walking, sprinting). The adoption of machine learning-based human activity recognition approaches [73,74,75] will be considered for future developments, as well as possible improvements (such as the use of machine learning models) related to the estimation of specific jumping-related metrics (e.g., depth). Moreover, this study did not consider the impact that different running surfaces or running shoes may have on the gait of the athletes [76] and, consequently, on the system performance. Further field-testing is required to investigate the effect of the running surface, as well as runners’ fatigue, on the developed system. Finally, the enhancement of the Device1–Device2 wireless link reliability via automatic adjustment of communication factors (i.e., packet size, sampling rate) [77] for a more robust synchronization will also be considered. Further investigations will be also carried out with regards to the industrial design of the system so as to ensure that sensor placement is always correct in terms of orientation and position, and to guarantee the absence of gradual changes which could affect the accuracy of the system.
It is also worth noting that, at the current stage, the developed system does not provide a measure of “correctness” (e.g., if a test subject is running or jumping “safely”), but it provides all the considered metrics to the coaches involved in the training and leave the ultimate decision on the exercise “correctness” to the human user. However, a fully automated evolution of the system will be also taken into consideration in future work through the implementation of a traffic-light alarm system which would indicate how “safely” the exercise is performed (for example, green may be interpreted as things should continue as per normal, amber suggests caution that if left unattended could pose a risk, while red raises an alarm and indicates action is required). Indeed, the concept of traffic-light systems is currently widespread in sport science thanks to its ease of use [78]. However, the implementation of these traffic-light alarms would require the acquisition of massive datasets with the final aim of providing personalized red/amber/green feedbacks to the end-users based on baselines/benchmarks obtained from each athlete under testing.
Finally, it must be recognized that the literature lacks a consensus regarding the accuracy levels required by coaches to find the technology acceptable. While, for example, for consumer-level wearable activity trackers against gold-standards, some studies recommend that an acceptable measurement error for clinical or research purposes is within ±3%, and under free-living conditions is within ±10%, with other studies recommending that mean errors of less than 20% have acceptable validity for clinical purposes [47]. Moreover, according to new United States technological standards, a device may have up to 10% error during walking, jogging, and running [48]. However, a similar indication is not provided in the sport field for sport performance devices. Nevertheless, previous literature has suggested that test reliability standards should ultimately be judged by the individual researcher or practitioner based in accordance with their intended use, and that the most reliable variables may not necessarily be the most efficacious in athlete monitoring and performance testing regimens [49,50]. Therefore, based on the previous indications, this investigation considers the validity criteria of 20% error threshold as tolerable and 10% error as acceptable for consumer-level technology.

9. Conclusions

In this paper, a novel wearable IMU-based system has been presented for athletic performance assessment during running and jumping tasks. The system consists of custom hardware platforms required to be developed so as to give the necessary system functionality, embedded firmware for allowing human–boards interaction, wireless synchronization between platforms, automatic recognition algorithms of running and jumping activities and specific event detection, biomechanical algorithms for the estimation of running- and jumping-related metrics, ANN-based vertical GRF waveform estimation, and a GUI for visualization purpose and for allowing the end-users to interact with the back-end analytics and the hardware platforms.
This solution will facilitate the exercise science research by giving the possibility to collect a multitude of movement data and by identifying and providing useful insights based on the analysis of a substantial amount of data collected.
The developed system is low-power, sufficiently small for real-world scenarios, easy to use, and achieves the required communication range, with a high sampling rate, and high performance to meet the needs of sport scientists in their analysis of human performance. The system was also tested in terms of the accuracy of the activity recognition algorithms, the estimated running- and jumping-metrics, and the vertical GRF predictions with satisfying outcomes (i.e., RMSE vertical GRF: 0.148 BW, error < 10% for most jumping metrics, and accurate trial detection). As a result, the developed system may be suitably adopted as a performance evaluation tool able to support coaches and athletes in their real-world practice.

Author Contributions

Conceptualization, S.T., J.B., and L.H.; methodology, S.T., and L.H.; software, D.A., E.P.-V., and D.-S.K.; validation, S.T., D.A., E.P.-V., D.-S.K., and L.J.; formal analysis, S.T., E.P.-V., and D.-S.K.; investigation, S.T., D.A., E.P.-V., D.-S.K., and L.J.; resources, S.T., and B.O.; data curation, E.P.-V., and D.-S.K.; writing—original draft preparation, S.T.; writing—review and editing, S.T., D.A., E.P.-V., D.-S.K., L.J., M.B., J.B., L.H., and B.O.; visualization, E.P.-V., and D.-S.K.; supervision, S.T., L.H., and M.B.; project administration, S.T.; funding acquisition, S.T., J.B., and B.O. All authors have read and agreed to the published version of the manuscript.

Funding

This publication was supported by Enterprise Ireland and Setanta College Ltd. under grant agreement no. IP 2017 0606. This project is co-funded by the European Regional Development Fund (ERDF) under Ireland’s European Structural and Investment Funds Programmes 2014–2020. Aspects of this publication have emanated from research conducted with the financial support of Science Foundation Ireland under Grant number 12/RC/2289-P2 INSIGHT-2 which is co-funded under the ERDF.

Institutional Review Board Statement

The study received approval by the Clinical Research Ethics Committee (CREC) of the Cork Teaching Hospitals at the University College Cork (Reference Number: ECM 4 (u) 22 October 2019 and ECM 3 (ppp) 14 January 2020).

Informed Consent Statement

Informed consent was obtained from all subjects involved in the study.

Data Availability Statement

The data presented in this study are available on request from the corresponding author.

Acknowledgments

The authors would like to thank all the participants who voluntarily took part in the study.

Conflicts of Interest

The authors declare no conflict of interest.

References

  1. Sands, W.A.; Kavanaugh, A.A.; Murray, S.R.; McNeal, J.R.; Jemni, M. Modern Techniques and Technologies Applied to Training and Performance Monitoring. Int. J. Sports Physiol. Perform. 2017, 12, 63–72. [Google Scholar] [CrossRef] [Green Version]
  2. Thornton, H.R.; Delaney, J.A.; Duthie, G.M.; Dascombe, B.J. Developing athlete monitoring systems in team-sports: Data analysis and visualization. Int. J. Sports Physiol. Perform. 2019, 14, 698–705. [Google Scholar] [CrossRef]
  3. Seshadri, D.R.; Li, R.T.; Voos, J.E.; Rowbottom, J.R.; Alfes, C.M.; Zorman, C.A.; Drummond, C.K. Wearable sensors for monitoring the internal and external workload of the athlete. NPJ Digit. Med. 2019, 2, 71. [Google Scholar] [CrossRef]
  4. Papi, E.; Osei-Kuffour, D.; Chen, Y.-M.A.; McGregor, A.H. Use of wearable technology for performance assessment: A validation study. Med. Eng. Phys. 2015, 37, 698–704. [Google Scholar] [CrossRef] [PubMed] [Green Version]
  5. Adesida, Y.; Papi, E.; McGregor, A.H. Exploring the Role of Wearable Technology in Sport Kinematics and Kinetics: A Systematic Review. Sensors 2019, 19, 1597. [Google Scholar] [CrossRef] [PubMed] [Green Version]
  6. Camomilla, V.; Bergamini, E.; Fantozzi, S.; Vannozzi, G. Trends Supporting the In-Field Use of Wearable Inertial Sensors for Sport Performance Evaluation: A Systematic Review. Sensors 2018, 18, 873. [Google Scholar] [CrossRef] [PubMed] [Green Version]
  7. Park, J.; Na, Y.; Gu, G.; Kim, J. Flexible insole ground reaction force measurement shoes for jumping and running. In Proceedings of the 2016 6th IEEE International Conference on Biomedical Robotics and Biomechatronics (BioRob), Singapore, 26–29 June 2016. [Google Scholar]
  8. Willy, R.W. Innovations and pitfalls in the use of wearable devices in the prevention and rehabilitation of running related injuries. Phys. Ther. Sport 2018, 29, 26–33. [Google Scholar] [CrossRef] [PubMed]
  9. Gillen, Z.; Miramonti, A.A.; McKay, B.; Leutzinger, T.J.; Cramer, J.T. Test-Retest Reliability and Concurrent Validity of Athletic Performance Combine Tests in 6–15-Year-Old Male Athletes. J. Strength Cond. Res. 2018, 32, 2783–2794. [Google Scholar] [CrossRef]
  10. Marcote-Pequeño, R.; García-Ramos, A.; Cuadrado-Peñafiel, V.; González-Hernández, J.M.; Gómez, M.Á.; Jiménez-Reyes, P. Association Between the Force–Velocity Profile and Performance Variables Obtained in Jumping and Sprinting in Elite Female Soccer Players. Int. J. Sports Physiol. Perform. 2019, 14, 209–215. [Google Scholar] [CrossRef]
  11. Chelly, M.S.; Ghenem, M.A.; Abid, K.; Hermassi, S.; Tabka, Z.; Shephard, R.J. Effects of in-Season Short-Term Plyometric Training Program on Leg Power, Jump- and Sprint Performance of Soccer Players. J. Strength Cond. Res. 2010, 24, 2670–2676. [Google Scholar] [CrossRef] [PubMed] [Green Version]
  12. Xybermind. Available online: http://xybermind.de/achillex/achillex-jumpnrun/ (accessed on 2 August 2020).
  13. Wundersitz, D.; Josman, C.; Gupta, R.; Netto, K.J.; Gastin, P.B.; Robertson, S. Classification of team sport activities using a single wearable tracking device. J. Biomech. 2015, 48, 3975–3981. [Google Scholar] [CrossRef]
  14. Marin, F.; Lepetit, K.; Fradet, L.; Hansen, C.; Ben Mansour, K. Using accelerations of single inertial measurement units to determine the intensity level of light-moderate-vigorous physical activities: Technical and mathematical considerations. J. Biomech. 2020, 107, 109834. [Google Scholar] [CrossRef]
  15. Muniz-Pardos, B.; Sutehall, S.; Gellaerts, J.; Falbriard, M.; Mariani, B.; Bosch, A.; Asrat, M.; Schaible, J.; Pitsiladis, Y.P. Integration of Wearable Sensors Into the Evaluation of Running Economy and Foot Mechanics in Elite Runners. Curr. Sports Med. Rep. 2018, 17, 480–488. [Google Scholar] [CrossRef] [PubMed]
  16. Adams, D.; Pozzi, F.; Willy, R.W.; Carrol, A.; Zeni, J. Altering cadence or vertical oscillation during running: Effects on running related injury factors. Int. J. Sports Phys. Ther. 2018, 13, 633–642. [Google Scholar] [CrossRef] [Green Version]
  17. Koldenhoven, R.M.; Hertel, J. Validation of a Wearable Sensor for Measuring Running Biomechanics. Digit. Biomark. 2018, 2, 74–78. [Google Scholar] [CrossRef]
  18. Ancillao, A.; Tedesco, S.; Barton, J.; O’Flynn, B. Indirect measurement of ground reaction forces and moments by means of wearable inertial sen-sors: A systematic review. Sensors 2018, 18, 2564. [Google Scholar] [CrossRef] [Green Version]
  19. Wouda, F.J.; Giuberti, M.; Bellusci, G.; Maartens, E.; Reenalda, J.; Van Beijnum, B.-J.F.; Veltink, P.H. Estimation of Vertical Ground Reaction Forces and Sagittal Knee Kinematics During Running Using Three Inertial Sensors. Front. Physiol. 2018, 9, 218. [Google Scholar] [CrossRef]
  20. Ngoh, K.J.-H.; Gouwanda, D.; Gopalai, A.A.; Chong, Y.Z. Estimation of vertical ground reaction force during running using neural network model and uniaxial accelerometer. J. Biomech. 2018, 76, 269–273. [Google Scholar] [CrossRef]
  21. Pogson, M.; Verheul, J.; Robinson, M.A.; Vanrenterghem, J.; Lisboa, P. A neural network method to predict task- and step-specific ground reaction force magnitudes from trunk accelerations during running activities. Med Eng. Phys. 2020, 78, 82–89. [Google Scholar] [CrossRef] [PubMed]
  22. Johnson, W.R.; Mian, A.; Robinson, M.A.; Verheul, J.; Lloyd, D.G.; Alderson, J.A. Multidimensional Ground Reaction Forces and Moments From Wearable Sensor Accelerations via Deep Learning. IEEE Trans. Biomed. Eng. 2021, 68, 289–297. [Google Scholar] [CrossRef]
  23. Komaris, D.-S.; Pérez-Valero, E.; Jordan, L.; Barton, J.; Hennessy, L.; O’Flynn, B.; Tedesco, S. Predicting three-dimensional ground reaction forces in running by using artificial neural networks and lower body kinematics. IEEE Access 2019, 7, 156779–156786. [Google Scholar] [CrossRef]
  24. Tedesco, S.; Perez-Valero, E.; Komaris, D.-S.; Jordan, L.; Barton, J.; Hennessy, L.; O’Flynn, B. Wearable Motion Sensors and Artificial Neural Network for the Estimation of Vertical Ground Reaction Forces in Running. In Proceedings of the 2020 IEEE SENSORS, Rotterdam, The Netherlands, 25–28 October 2020. [Google Scholar]
  25. Komaris, D.-S.; Perez-Valero, E.; Jordan, L.; Barton, J.; Hennessy, L.; O’Flynn, B.; Tedesco, S. A Comparison of Three Methods for Estimating Vertical Ground Reaction Forces in Running. In Proceedings of the International Society of Biomechanics in Sports Proceedings (ISBS 2020), Online, 21–25 July 2020. [Google Scholar]
  26. Picerno, P.; Camomilla, V.; Capranica, L. Countermovement jump performance assessment using a wearable 3D inertial measurement unit. J. Sports Sci. 2011, 29, 139–146. [Google Scholar] [CrossRef]
  27. Dowling, A.V.; Favre, J.; Andriacchi, T.P. A wearable system to assess risk for anterior cruciate ligament injury during jump landing: Measurements of temporal events, jump height, and sagittal plane kinematics. J. Biomech. Eng. 2011, 133, 071008. [Google Scholar] [CrossRef]
  28. Wang, J.; Xu, J.; Schull, P.B. Vertical jump height estimation algorithm based on takeoff and landing identification via foot-worn inertial sensing. J. Biomech. Eng. 2018, 140, 034502. [Google Scholar] [CrossRef] [Green Version]
  29. Lee, Y.-S.; Ho, C.-S.; Shih, Y.; Chang, S.-Y.; Róbert, F.J.; Shiang, T.-Y. Assessment of walking, running, and jumping movement features by using the inertial measurement unit. Gait Posture 2015, 41, 877–881. [Google Scholar] [CrossRef]
  30. STMicroelectronics. Available online: https://www.st.com/en/microcontrollers-microprocessors/stm32f417ig.html (accessed on 1 August 2020).
  31. InvenSense. Available online: https://invensense.tdk.com/download-pdf/mpu-9250-datasheet/ (accessed on 1 August 2020).
  32. Nordic. Available online: https://www.nordicsemi.com/Products/Low-power-short-range-wireless/Bluetooth-5 (accessed on 1 August 2020).
  33. Abracon. Available online: https://abracon.com/datasheets/ACAG0801-2450-T.pdf (accessed on 1 August 2020).
  34. Naruhiro, H.; Robert, N.; Naoki, K.; Michael R, M.; William J, K.; Kazunori, N. Reliability of performance measurements derived from ground reaction force data during countermovement jump and the influence of sampling frequency. J. Strength Cond Res. 2009, 23, 874–882. [Google Scholar]
  35. Coviello, G.; Avitabile, G.; Florio, A. A Synchronized Multi-Unit Wireless Platform for Long-Term Activity Monitoring. Electronics 2020, 9, 1118. [Google Scholar] [CrossRef]
  36. Olivares, A.; Ramírez, J.; Górriz, J.M.; Olivares, G.; Damas, M. Detection of (In)activity Periods in Human Body Motion Using Inertial Sensors: A Comparative Study. Sensors 2012, 12, 5791–5814. [Google Scholar] [CrossRef]
  37. McGrath, D.; Greene, B.R.; O’Donovan, K.J.; Caulfield, B. Gyroscope-based assessment of temporal gait parameters during treadmill walking and running. Sports Eng. 2012, 15, 207–213. [Google Scholar] [CrossRef]
  38. Dai, B.; Butler, R.J.; Garrett, W.E.; Queen, R.M. Using ground reaction force to predict knee kinetic asymmetry following anterior cruciate ligament reconstruction. Scand. J. Med. Sci. Sports 2014, 24, 974–981. [Google Scholar] [CrossRef] [Green Version]
  39. Tedesco, S.; Urru, A.; Peckitt, J.; O’Flynn, B. Inertial sensors-based lower-limb rehabilitation assessment: A comprehensive evaluation of gait, kinematic and statistical metrics. Int. J. Adv. Life Sci. 2017, 9, 33–49. [Google Scholar]
  40. Strohrmann, C.; Harms, H.; Kappeler-Setz, C.; Troster, G. Monitoring Kinematic Changes With Fatigue in Running Using Body-Worn Sensors. IEEE Trans. Inf. Technol. Biomed. 2012, 16, 983–990. [Google Scholar] [CrossRef]
  41. Cormie, P.; McBride, J.M.; O McCaulley, G. Power-Time, Force-Time, and Velocity-Time Curve Analysis of the Countermovement Jump: Impact of Training. J. Strength Cond. Res. 2009, 23, 177–186. [Google Scholar] [CrossRef]
  42. Moir, G.L. Three Different Methods of Calculating Vertical Jump Height from Force Platform Data in Men and Women. Meas. Phys. Educ. Exerc. Sci. 2008, 12, 207–218. [Google Scholar] [CrossRef]
  43. Loadsol. Available online: https://www.novel.de/products/loadsol/ (accessed on 1 August 2020).
  44. BTSBioengineering. Available online: https://www.btsbioengineering.com/products/podium/ (accessed on 1 August 2020).
  45. Seiberl, W.; Jensen, E.; Merker, J.; Leitel, M.; Schwirtz, A. Accuracy and precision of loadsol®® insole force-sensors for the quantification of ground reaction force-based biomechanical running parameters. Eur. J. Sport Sci. 2018, 18, 1100–1109. [Google Scholar] [CrossRef]
  46. Renner, K.E.; Williams, D.B.; Queen, R.M. The Reliability and Validity of the Loadsol®® under Various Walking and Running Conditions. Sensors 2019, 19, 265. [Google Scholar] [CrossRef] [PubMed] [Green Version]
  47. Tedesco, S.; Sica, M.; Ancillao, A.; Timmons, S.; Barton, J.; O’Flynn, B. Validity Evaluation of the Fitbit Charge2 and the Garmin vivosmart HR+ in Free-Living Environments in an Older Adult Cohort. JMIR mHealth uHealth 2019, 7, e13084. [Google Scholar] [CrossRef]
  48. New CTS Standards for IoT Advance Functionality of Tech Monitoring of Consumer Health. Available online: https://www.cta.tech/News/Press-Releases/2016/October/New-CTA-Standards-for-IoTAdvance-Functionality-of.aspx (accessed on 1 December 2016).
  49. Heishman, A.; Daub, B.; Miller, R.; Brown, B.; Freitas, E.; Bemben, M. Countermovement Jump Inter-Limb Asymmetries in Collegiate Basketball Players. Sports 2019, 7, 103. [Google Scholar] [CrossRef] [Green Version]
  50. Cormack, S.; Newton, R.U.; McGuigan, M.R.; Doyle, T.L. Reliability of Measures Obtained During Single and Repeated Countermovement Jumps. Int. J. Sports Physiol. Perform. 2008, 3, 131–144. [Google Scholar] [CrossRef] [PubMed] [Green Version]
  51. Winter, D.A. Biomechanics and Motor Control of Human Movement, 4th ed.; Wiley: Hoboken, NJ, USA, 2009. [Google Scholar]
  52. MarketResearch. Available online: https://www.marketresearch.com/Mordor-Intelligence-LLP-v4018/Global-Wearable-Devices-Sports-Segmented-11643506/ (accessed on 24 December 2020).
  53. FootPod Garmin. Available online: https://buy.garmin.com/en-ER/ssa/p/15516 (accessed on 24 December 2020).
  54. Stride Sensor Polar. Available online: https://www.polar.com/en/products/accessories/stride_sensor_bluetooth_smart (accessed on 24 December 2020).
  55. Axiamo XRUN. Available online: http://www.axiamo.com/xrun/ (accessed on 24 December 2020).
  56. RunScribe. Available online: https://runscribe.com/ (accessed on 24 December 2020).
  57. RunTeq. Available online: http://www.runteq.com/ (accessed on 24 December 2020).
  58. GaitUp. Available online: https://gaitup.com/ (accessed on 2 August 2020).
  59. SHFT. Available online: http://shft.run/ (accessed on 24 December 2020).
  60. Moov. Available online: https://welcome.moov.cc/ (accessed on 24 December 2020).
  61. Tg Force. Available online: https://tgforce.com/ (accessed on 24 December 2020).
  62. Stryd. Available online: https://www.stryd.com/ (accessed on 2 August 2020).
  63. IMeasureU. Available online: https://imeasureu.com/ (accessed on 2 August 2020).
  64. ViPerform. Available online: https://www.dorsavi.com/us/en/viperform/ (accessed on 2 August 2020).
  65. MyVert. Available online: https://www.myvert.com/ (accessed on 24 December 2020).
  66. K-50. Available online: https://www.k-sport.tech/en-index.html (accessed on 29 May 2021).
  67. Waldén, M.; Hägglund, M.; Magnusson, H.; Ekstrand, J. ACL injuries in men’s professional football: A 15-year prospective study on time trends and return-to-play rates reveals only 65% of players still play at the top level 3 years after ACL rupture. Br. J. Sports Med. 2016, 50, 744–750. [Google Scholar] [CrossRef] [Green Version]
  68. Zadeh, A.; Taylor, D.; Bertsos, M.; Tillman, T.; Nosoudi, N.; Bruce, S. Predicting Sports Injuries with Wearable Technology and Data Analysis. Inf. Syst. Front. 2020, 136, 1–15. [Google Scholar] [CrossRef]
  69. Lin, F.; Wang, A.; Zhuang, Y.; Tomita, M.R.; Xu, W. Smart Insole: A Wearable Sensor Device for Unobtrusive Gait Monitoring in Daily Life. IEEE Trans. Ind. Inform. 2016, 12, 2281–2291. [Google Scholar] [CrossRef]
  70. Zhang, H.; Zanotto, D.; Agrawal, S.K. Estimating CoP Trajectories and Kinematic Gait Parameters in Walking and Running Using Instrumented Insoles. IEEE Robot. Autom. Lett. 2017, 2, 2159–2165. [Google Scholar] [CrossRef]
  71. Ramirez-Bautista, J.A.; Huerta-Ruelas, J.A.; Chaparro-Cardenas, S.L.; Hernandez-Zavala, A. A review in detection and monitoring gait disorders using in-shoe plantar measurement systems. IEEE Rev. Biomed. Eng. 2017, 10, 299–309. [Google Scholar] [CrossRef]
  72. Matijevich, E.S.; Branscombe, L.M.; Scott, L.R.; Zelik, K.E. Ground reaction force metrics are not strongly correlated with tibial bone load when running across speeds and slopes: Implications for science, sport and wearable tech. PLoS ONE 2019, 14, e0210000. [Google Scholar] [CrossRef] [Green Version]
  73. Zhuang, Z.; Xue, Y. Sport-Related Human Activity Detection and Recognition Using a Smartwatch. Sensors 2019, 19, 5001. [Google Scholar] [CrossRef] [Green Version]
  74. Scheurer, S.; Tedesco, S.; Brown, K.N.; O’Flynn, B. Human Activity Recognition for Emergency First Responders via Body-Worn Inertial Sensors. In Proceedings of the 2017 IEEE 14th International Conference on Wearable and Implantable Body Sensor Networks (BSN 2017), Eindhoven, The Netherlands, 9–12 May 2017. [Google Scholar]
  75. Scheurer, S.; Tedesco, S.; Brown, K.N.; O’Flynn, B. Using domain knowledge for interpretable and competitive multi-class human activity recognition. Sensors 2020, 20, 1208. [Google Scholar] [CrossRef] [PubMed] [Green Version]
  76. Worsey, M.T.O.; Espinosa, H.G.; Shepherd, J.B.; Lewerenz, J.; Klodzinski, F.S.M.; Thiel, D.V. Features Observed Using Multiple Inertial Sensors for Running Track and Hard-Soft Sand Running: A Comparison Study. In Proceedings of the ISEA 13th Conference of the International Sports Engineering Association (2020), Online, 22–26 June 2020. [Google Scholar]
  77. Sabti, H.A.; Thiel, D.V. Node Position Effect on Link Reliability for Body Centric Wireless Network Running Applications. IEEE Sens. J. 2014, 14, 2687–2691. [Google Scholar] [CrossRef] [Green Version]
  78. Robertson, S.; Bartlett, J.D.; Gastin, P.B. Red, Amber, or Green? Athlete Monitoring in Team Sport: The Need for Decision-Support Systems. Int. J. Sports Physiol. Perform. 2017, 12, S2-73–S2-79. [Google Scholar] [CrossRef] [Green Version]
Figure 1. Devices placement on shanks and pelvis during running and jumping tasks.
Applsci 11 05258 g001
Figure 2. Graphical depiction of the system adoption. After data collection for a specific task, the device(s) are plugged-into a computer via USB, where a GUI will use back-end algorithms to process the data gathered in the device(s) and visualize the results to the end-users.
Applsci 11 05258 g002
Figure 3. System block diagram.
Applsci 11 05258 g003
Figure 4. System block diagram. PCB board (left). The 3D printed enclosure with a Velcro strap (right).
Applsci 11 05258 g004
Figure 5. “Running” mode flowchart.
Applsci 11 05258 g005
Figure 6. Time synchronization process.
Applsci 11 05258 g006
Figure 7. The running activity recognition algorithm. The figure in the middle depicts the input signal; the top figure shows the calculated variance in each of the 0.5 s windows in which the signal is split; the bottom figure displays the part of the signal that is detected as running. It is worth underlining that the first bout of activity shown in the figure is not detected as running since its duration is lower than the 20 s threshold.
Applsci 11 05258 g007
Figure 8. ANN regression model [23,24].
Applsci 11 05258 g008
Figure 9. The jumping activity recognition algorithm. On top, the vertical acceleration signal of a recording including three consecutive jumps; the bottom figure (in red) depicts the part of the signal that the algorithm has classified as separate jumps.
Applsci 11 05258 g009
Figure 10. Example of event detection from the accelerometer in a countermovement jump. Force (blue), velocity (red), and displacement (green) curves are plotted and manually scaled to be shown in the same graph.
Applsci 11 05258 g010
Figure 11. Example of the comparison between the actual and the modeled force curves during a jump.
Applsci 11 05258 g011
Figure 12. View of a processed running trial showing GRF curves for each stride and running metrics for both legs.
Applsci 11 05258 g012
Figure 13. View of a processed jump showing the jumping metrics and the accelerometer graph.
Applsci 11 05258 g013
Figure 14. Data collection during running (left) and jumping (right).
Applsci 11 05258 g014
Figure 15. Predicted GRFs (orange) vs. actual GRFs (blue). Left (8 km/h), center (10 km/h), and right (12 km/h).
Applsci 11 05258 g015
Table 1. RMSE (±SD) between measured and predicted GRFs.
Speed (km/h)RMSE
80.13 (±0.026)
100.136 (±0.017)
120.17 (±0.03)
All0.148 (±0.024)
RMSE: root mean square error, GRF: ground reaction force, SD: standard deviation.
Table 2. GRF peak force metric evaluation: measured and predicted.
Proposed System (All Speeds)Actual Results (All Speeds)
2.28 (±0.09)2.41 (±0.15)
GRF: Ground reaction force.
Table 3. Jumping-related metric errors.
MetricError (%)
Peak force at concentric−16.07
Peak force at landing−7.08
Velocity at landing4.5
Flight time8.66
Jump height15.99
Peak power13.05
Start to peak power−5.58
Peak force at concentric: maximum force during the concentric phase in N; peak force at landing: maximum value of the force produced during landing in N; velocity at landing: velocity when the subject touches down the ground (landing) in m/s; flight time: amount of time the subject is in the air in s; jump height: maximum height reached by the subject during the jump in m; peak power: maximum power developed by the subject during the concentric phase in W; start to peak power: time between the start of the movement and the peak power in s.
Table 4. Competitive landscape.
ProductsSportParameters CalculatedNumber of Sensors/Body PositionSampling Frequency (Hz)
Foot pod (Garmin) [53]RunningDistance, cadence, speed1 per shoeNA
Stride sensor (Polar) [54]RunningDuration, distance, cadence, speed, stride length1 per shoeNA
Axiamo XRUN [55]RunningGround contact time1 per shoeNA
RunScribe [56]Running, walking, hiking12 basic metrics (efficiency, shock, motion), 33 advanced metrics (derived, plus, research), 12 sacral metrics (pelvis angles, vertical oscillation)1 per shoe (possibility to add 1 on the hip)500
RunTeq [57]Running6 body kinematics metrics, 6 workout metrics1 per shoe and 1 on chestNA
Achillex jump’n’run (Xybermind) [12]Jumping, sprintingRunning parameters, and jumping metrics for three different jump forms1 on the belt (with magnetic barrier infrastructure)400
GaitUp [58]Running, walking, physical activity, golf, swimmingRunning temporal (4 metrics), spatial (4 metrics), and performance (6 metrics)1 per shoe128
SHFT [59]Running12 full-body metrics (e.g., cadence, ground contact time, step length, g-landing, etc.)1 on one shoe and 1 on chestNA
Moov [60]RunningCadence, range of motion, tibial impact1 on ankleNA
TgForce [61]RunningPeak acceleration (in g), cadence1 on tibiaNA
Stryd [62]RunningGround contact time, vertical oscillation, running power, distance, leg stiffness, cadence1 on shoe1
IMeasureU [63]Jumping, sprinting, counter rotation, swimming, power meterSteps, cumulative impact load, cumulative bone stimulusUp to 8 sensors on the body (possibility to sync with VICON MoCap)500
ViPerform (DorsaVi) [64]Functional tests, hamstring tests, knee movement tests, running testsSymmetry, average ground reaction force, peak acceleration, ground contact time, cadence, distance, speed1 per tibia (with possibility to include video)100
MyVert [65]Jumping, runningJump metrics, landing impact features, drills features, energy feature, run feature, power/intensity features, stress features1 on center-of-massNA
K-50 (K-Sport) [66]Soccer-related movements300 parameters including physical, technical, and tactical information1 on the chest (also including GPS, UWB, and physiologic sensing)50
Proposed systemJumping, running13 running temporal, spatial, and performance metrics, full vertical GRF waveform, and jumping metrics for two different jump forms1 on each tibia (for running), 1 on center-of-mass (for jumping)238
Publisher’s Note: MDPI stays neutral with regard to jurisdictional claims in published maps and institutional affiliations.