Article

Three-Dimensional Reconstruction-Based Vibration Measurement of Bridge Model Using UAVs

School of Civil and Transportation Engineering, Guangdong University of Technology, Guangzhou 510006, China
*
Author to whom correspondence should be addressed.
Appl. Sci. 2021, 11(11), 5111; https://doi.org/10.3390/app11115111
Submission received: 24 April 2021 / Revised: 26 May 2021 / Accepted: 27 May 2021 / Published: 31 May 2021
(This article belongs to the Section Civil Engineering)

Abstract

:
This paper presents a measurement method of bridge vibration based on three-dimensional (3D) reconstruction. A video of bridge model vibration is recorded by an unmanned aerial vehicle (UAV), and the displacement of target points on the bridge model is tracked by the digital image correlation (DIC) method. Due to the UAV motion, the DIC-tracked displacement of the bridge model includes the absolute displacement caused by the excitation and the false displacement induced by the UAV motion. Therefore, the UAV motion must be corrected to measure the real displacement. Using four corner points on a fixed object plane as the reference points, the projection matrix for each frame of images can be estimated by the UAV camera calibration, and then the 3D world coordinates of the target points on the bridge model can be recovered. After that, the real displacement of the target points can be obtained. To verify the correctness of the results, the operational modal analysis (OMA) method is used to extract the natural frequencies of the bridge model. The results show that the first natural frequency obtained from the proposed method is consistent with the one obtained from the homography-based method. By further comparing with the homography-based correction method, it is found that the 3D reconstruction method can effectively overcome the limitation of the homography-based method that the fixed reference points and the target points must be coplanar.

1. Introduction

During the long-term operation process of bridges, various damage may occur and lead to the reduction of their bearing capacity inevitably. To ensure the safe operation of bridges and avoid collapse accidents, it is necessary to carry out real-time health monitoring for bridges. The anomaly detection methods, such as the temperature-driven moving principal component analysis (MPCA) method [1], threshold-based, and anomaly trend detection method [2], have been used for structural health monitoring (SHM). Currently, vibration-based damage detection of bridges plays a vital role in SHM [3]. A fundamental task of vibration-based detection methods is to measure the vibration responses accurately. Vibration measurement is mainly divided into contact methods and non-contact methods. The contact measurement methods are primarily to use the sensors installed on the structural surface, such as displacement sensors [4], acceleration sensors [5,6], and strain gauges [7] to collect structural responses. Although acceleration is commonly used for measurement, it is inaccurate in low-frequency vibration; in addition, the corresponding velocity and displacement time histories obtained show irrational drift and usually need to be corrected [8]. There are some other disadvantages for the contact methods. Firstly, a large number of sensors need to be deployed on the structure for the whole field measurement, which is costly or impossible in some cases, as the sensor weight may affect the measurement results in some light structures. In some situations, sensors are difficult to be deployed. Therefore, some non-contact measurement methods, such as the global positioning system (GPS) [9], and laser doppler vibrometer (LDV) [10], have been used to measure structural dynamic displacement under these situations. As the measurement accuracy and sampling frequency of GPS is low, it is generally used for bridges with large vibration amplitude [11]. Though the LDV system can be utilized to collect the vibration response of bridges at various locations, it is costly and time-consuming to measure vibration in practical applications [12]; moreover, it is not suitable for long-term bridge monitoring because it needs to be deployed on the ground underneath the bridge and supervised at all times [13].
With the rapid development of computer technology and image processing technology, the vision-based measurement methods [14,15,16] have been widely used as they are accurate, non-contact, and full-field. Compared with contact methods, the vision-based methods provide the possibility for displacement measurement of a bridge at a distance. Through the motion magnification analyses, the vision-based methods can identify modal parameters for SHM without providing displacement measurement [17]. In addition, it is more accurate and applicable than other non-contact methods, e.g., GPS. Moreover, the emergence of low-price and high-resolution cameras makes these methods more and more popular. Among the vision-based methods, the digital image correlation (DIC) [18,19] has been commonly used to measure the deformation and displacement of engineering structures. By calculating the correlation of gray-scale values between the reference subset and the target subset of a series of images, the deformation information of the region of interest (ROI) on the measured surface can be obtained [20]. Therefore, it is extensively applied in the motion tracking of the target points on bridges to obtain their displacement [21,22,23]. To ensure the measurement accuracy and efficacy, sufficient image stability, contrast for an optimal choice and track of target points should be considered. In addition, in an outdoor environment, the weather and lighting conditions (e.g., fog interference and illumination change, etc.) may also influence the measurement results, and a subpixel level method can be utilized to handle these negative factors [24]. In the vision-based measurement, cameras need to be fixed in a position with sufficient light and keep an appropriate distance from the measured bridge. It is, however, difficult to find an ideal place to deploy cameras for some bridges across rivers and valleys.
Consequently, many scholars use UAVs carrying high-resolution cameras instead of fixed-position cameras for SHM of bridges [25,26,27]. UAVs have been widely used in structural crack detection [28], safety inspections [29], and displacement measurement [30]. Moreover, UAVs have been used for 3D geometry reconstruction to obtain accurate numerical models (e.g., FEM models) [31]. Nevertheless, due to UAV ego-motion, the tracked displacement is the combination of the absolute displacement of bridges and false displacement induced by UAV motion [30]. Hence, the methods to eliminate the false displacement induced by the UAV motion have been proposed [26,30,32,33]. The camera parameters of each UAV video frame are calculated using triangulation [34], so that the world coordinates of the structure can be restored, and the absolute displacement can be obtained [30]. The absolute displacement is estimated by subtracting the UAV movement, which derived from an embedded Inertial Measuring Unit (IMU) [33]. The false displacement is regarded as the low-frequency noise caused by the UAV hovering, which can be filtered away by the high-pass filter method [26]. The planar homography transformation between the images before and after the UAV motion can be determined by direct linear transformation based on at least four sets of 2D-to-2D (two-dimensional) point correspondences [35,36]; according to this algorithm, the false displacement induced by the UAV motion can be corrected [32]. However, this method has a restriction that the reference points on the fixed object plane must be coplanar with the target points, that is, the selected fixed reference objects on the background should be close enough to the measured bridge; otherwise, there will be a significant error. To select reference points far from the target bridge in field measurements, it is necessary to find a way to overcome the above limitation.
In this paper, an improved correction algorithm is developed for eliminating the false displacement induced by the UAV motion by using 3D reconstruction. First, a video of bridge model vibration is captured by a UAV and analyzed by the DIC. Then, the projection matrices of each UAV motion are obtained by camera calibration, and the 3D coordinates of the target points on the bridge model are derived by the projection matrices. Then, the real displacement can be obtained by subtracting the coordinates of the target points on the first frame. The displacement time-histories of the target point are analyzed by the OMA; then, the natural frequencies can be extracted [37]. Finally, the results obtained from the homography-based method and 3D reconstruction method are compared. This work integrates Zhang’s calibration method [38] with a drone to provide a measurement method for bridge vibration. The outcome from this investigation demonstrates the efficacy of the proposed approach for obtaining dynamic displacement of bridges that are inaccessible to fixed-position cameras or sensors.

2. Methods

The general flowchart of this work is shown in Figure 1. The video captured by the UAV can be converted into a sequence of continuous digital images stored in frames. The DIC principle is provided to track the displacement of the points of interest at first; the homography transformation theory is then defined, which can be used to remove the false displacement induced by the UAV motion; the 3D reconstruction method is further presented to remove the false displacement and the results obtained by these two methods are compared.

2.1. Displacement Tracked by DIC

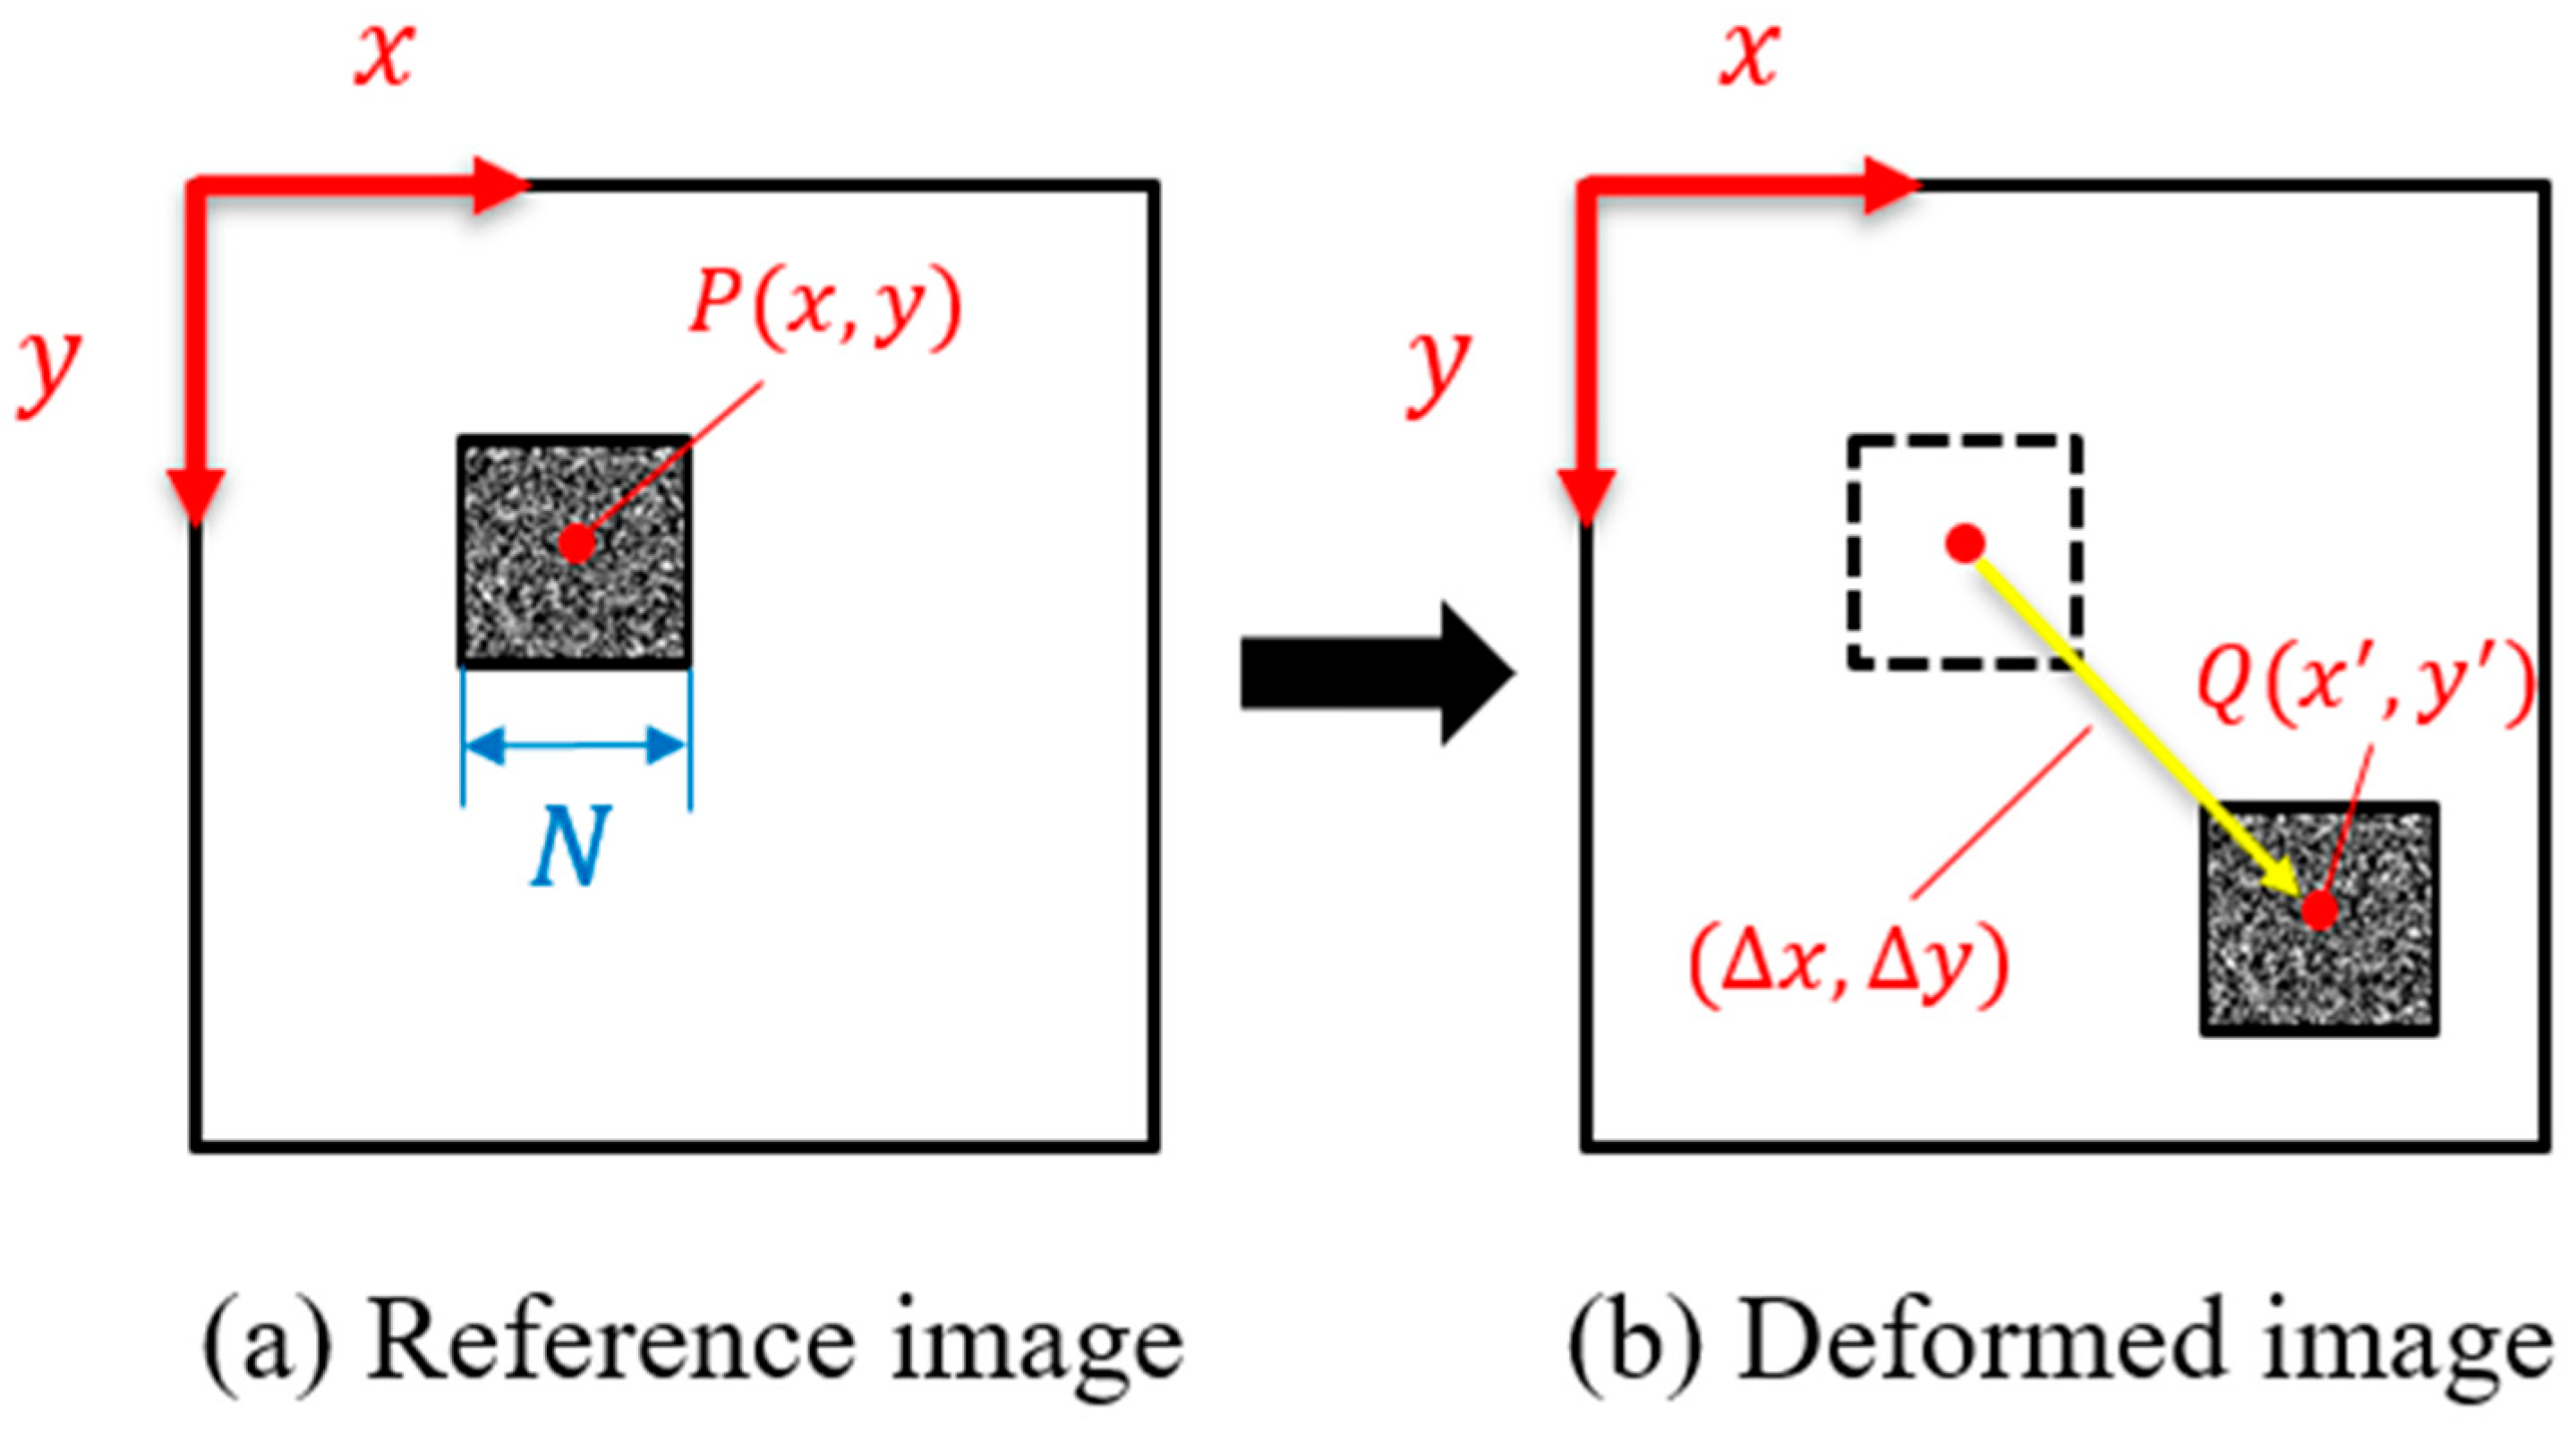
The DIC principle is shown in Figure 2. To track the movement of the measurement point P ( x , y ) on the image I ( x , y ) , the area of N × N pixels surrounding it is taken as the reference sub-region (Figure 2a), while the sub-region centered on Q ( x , y ) (where x = x + Δ x , y = y + Δ y ) on the deformed image J ( x , y ) is defined as the deformed sub-region; hence, the correlation between the two sub-regions can be expressed as [39]:
C ( Δ x , Δ y ) = S I ( x , y ) J ( x + Δ x , y + Δ y ) d x d y S I 2 ( x , y ) d x d y S J 2 ( x + Δ x , y + Δ y ) d x d y
where S is the area of two sub-regions; the real displacement of P ( x , y ) , ( Δ x , Δ y ) , maximizes the correlation coefficient C [32].
The pixel values of the points of interest in the process of bridge model vibration can be obtained by the DIC. The tracked displacement by the DIC is the combination of the absolute displacement of the measurement point and the false displacement induced by UAV motion. The next section introduces the homography transformation method to remove the false displacement.

2.2. Homography Transformation Method

Figure 1 shows the procedure of displacement correction based on homography transformation for UAV measurement, which consists of three steps: (1) The DIC principle is utilized to track the pixel values of the measurement points (step 1); (2) Four reference points are used to establish the homography matrix between the original frame and the frame to be corrected (step 2a); and (3) Remove the false displacement by the homography transformation to obtain the real displacement of the target points (step 3a). The above-mentioned steps can be realized by a MATLAB (MathWorks, Natick, MA, USA) program.
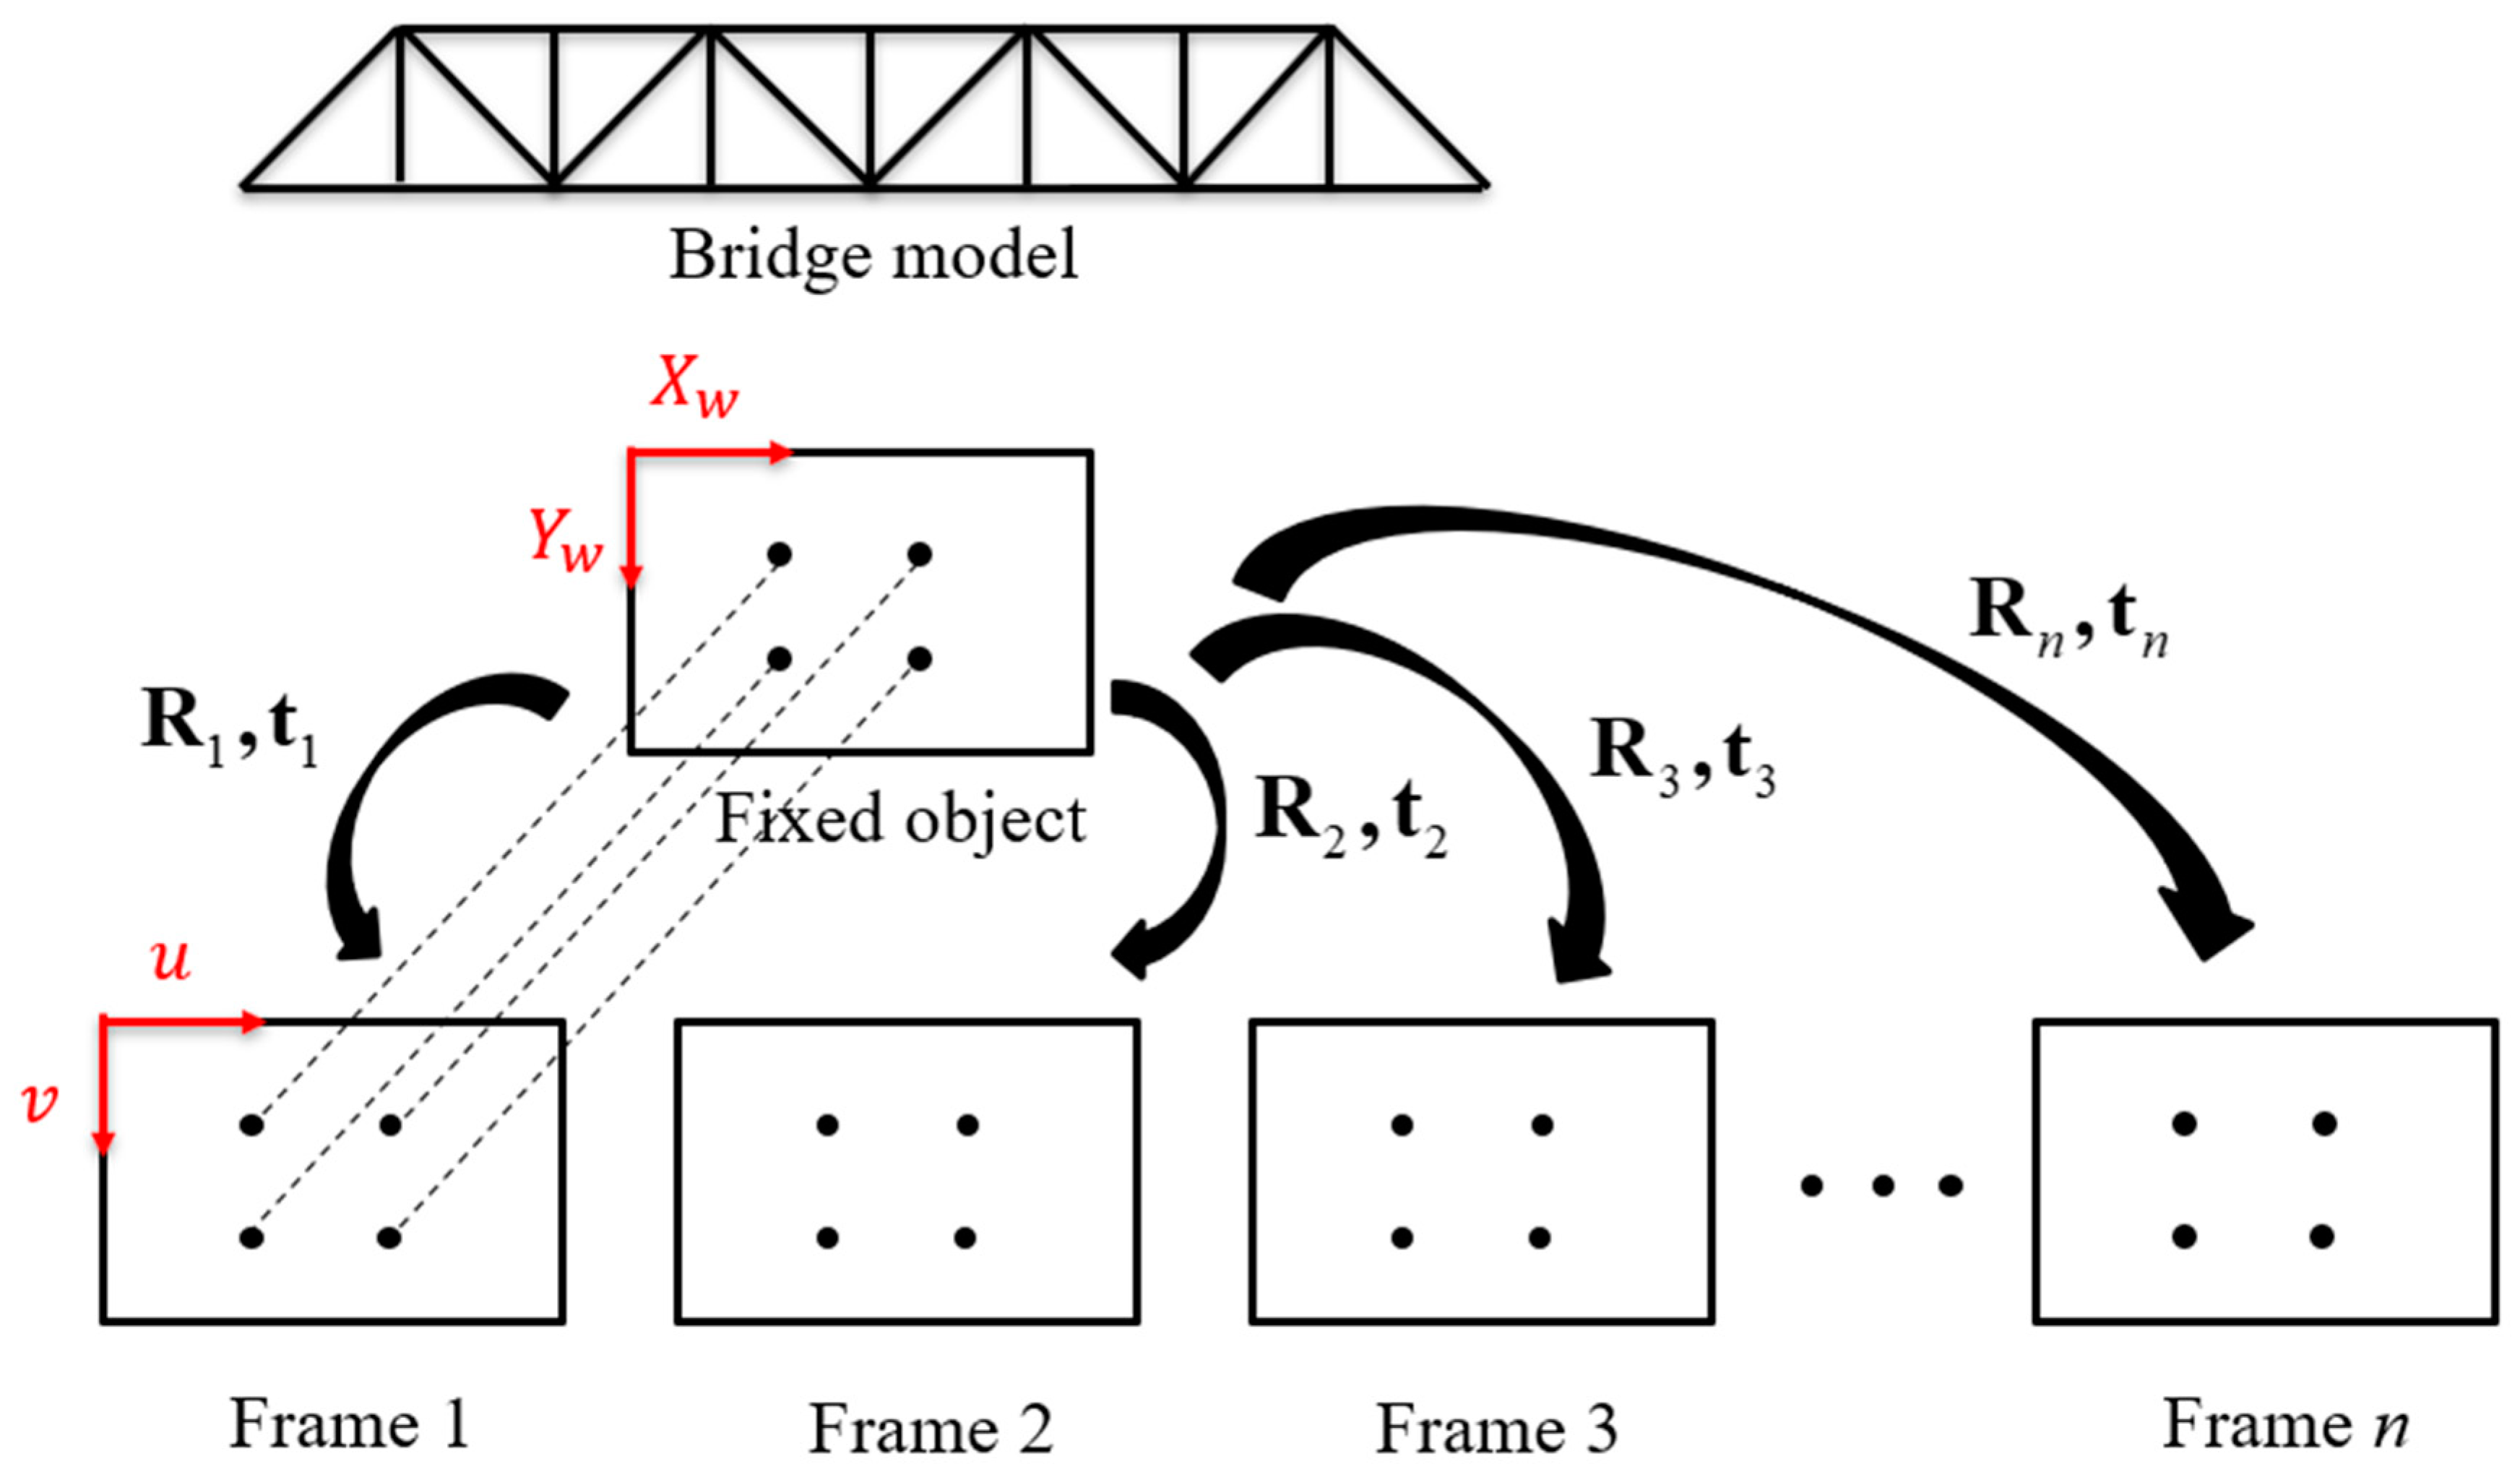
As shown in Figure 3, there exists a 2D projection mapping between every two frames of UAV images, which can be expressed as [32]:
s [ u v 1 ] = [ h 11 h 12 h 13 h 21 h 22 h 23 h 31 h 32 h 33 ] [ u v 1 ] = H i [ u v 1 ]
where s is a scale factor; H i   ( i = 1 , 2 , 3 , n 1 ) is called the homography matrix; u , v are the pixel coordinates of the reference points on the original frame, and u , v are the pixel coordinates of the reference points on the frame to be corrected. At least four reference points are needed to estimate the homography matrix between two frames:
[ u 1 v 1 1 0 0 0 u 1 u 1 u 1 v 1 0 0 0 u 1 v 1 1 u 1 v 1 v 1 v 1 u 2 v 2 1 0 0 0 u 2 u 2 u 2 v 2 0 0 0 u 2 v 2 1 u 2 v 2 v 2 v 2 u 3 v 3 1 0 0 0 u 3 u 3 u 3 v 3 0 0 0 u 3 v 3 1 u 3 v 3 v 3 v 3 u 4 v 4 1 0 0 0 u 4 u 4 u 4 v 4 0 0 0 u 4 v 4 1 u 4 v 4 v 4 v 4 ] · [ h 11 h 12 h 13 h 21 h 22 h 23 h 31 h 32 ] = [ u 1 v 1 u 2 v 2 u 3 v 3 u 4 v 4 ]
If there are more than four reference points, the least square method is used to solve the homography matrix.
The first frame of video can be regarded as the original reference frame, and the later frames are used to set up the one-to-one homography relationship with the first frame (Figure 3), separately. The corrected pixel coordinates of a target point are given as:
[ u j v j 1 ] = H j 1 [ u j v j 1 ]
where j is the frame number; [ u j v j ] T is the pixel coordinates of the target point on the j t h frame, [ u j v j ] T is the pixel coordinates of the target point after homography correction.
The real displacement of the target point can be obtained by subtracting [ u 1 v 1 ] T from [ u j v j ] T ; here, [ u 1 v 1 ] T is the pixel coordinates of the target point on the first frame. The unit of displacement is pixels, which can be transferred to physical values in millimeters by multiplying the conversion factor η = l / n (where l is the actual length in the real world, n is the pixel number in the image corresponding to the actual length). The homography transformation reflects the relationship between the image plane and the fixed object plane. Therefore, the fixed object plane must be coplanar with the bridge model plane if we want to correct the target point on the bridge model plane. However, it is hard to find a fixed object plane on the same plane as the bridge plane for practical applications.

2.3. Three-Dimensional Reconstruction Method

As shown in Figure 1, the vibration measurement based on 3D reconstruction is composed of three primary steps. Step 1 is to track displacement by DIC which is the same as Section 2.2. Step 2b is the UAV camera calibration, through which the projection matrices of the UAV camera can be estimated. Step 3b is to remove the false displacement induced by UAV motion to obtain the actual displacement by combining the output data from Step 1 and Step 2b.

2.3.1. Camera Calibration

Let [ X w , Y w , Z w ] T be the coordinates of a point in the 3D world coordinate system and [ u , v ] T the 2D projection of the point on the image. The relationship between the 3D world coordinates and 2D pixel coordinates can be written as [38]:
s [ u v 1 ] = A [ R t ] [ X w Y w Z w 1 ]
where s is an arbitrary scale factor; R = [ r 1 r 2 r 3 ] is the rotation matrix and t = [ t 1 t 2 t 3 ] Τ is the translation vector, [ R t ] represents the extrinsic matrix that converts the world coordinate system to the camera coordinate system; and A is the intrinsic matrix which is given by:
A = [ f x γ u 0 0 f y v 0 0 0 1 ]
where f x and f y are the scale factors in the x and y axes of the image plane, respectively; u 0 , v 0 are the pixel coordinates of the image center; γ is the skewness parameter.
According to Zhang’s calibration method [38], the solution of the camera projection matrix (camera calibration) consists of three parts: (a) Intrinsic parameter calibration; (b) Extrinsic parameter calibration; and (c) Minimizing the reprojection error.
By taking more than three pictures of the chessboard with different views, the intrinsic matrix A can be solved by Zhang’s method. The intrinsic parameters of the UAV camera are invariable, and the calibration algorithms are available in the Camera Calibrator app of MATLAB.
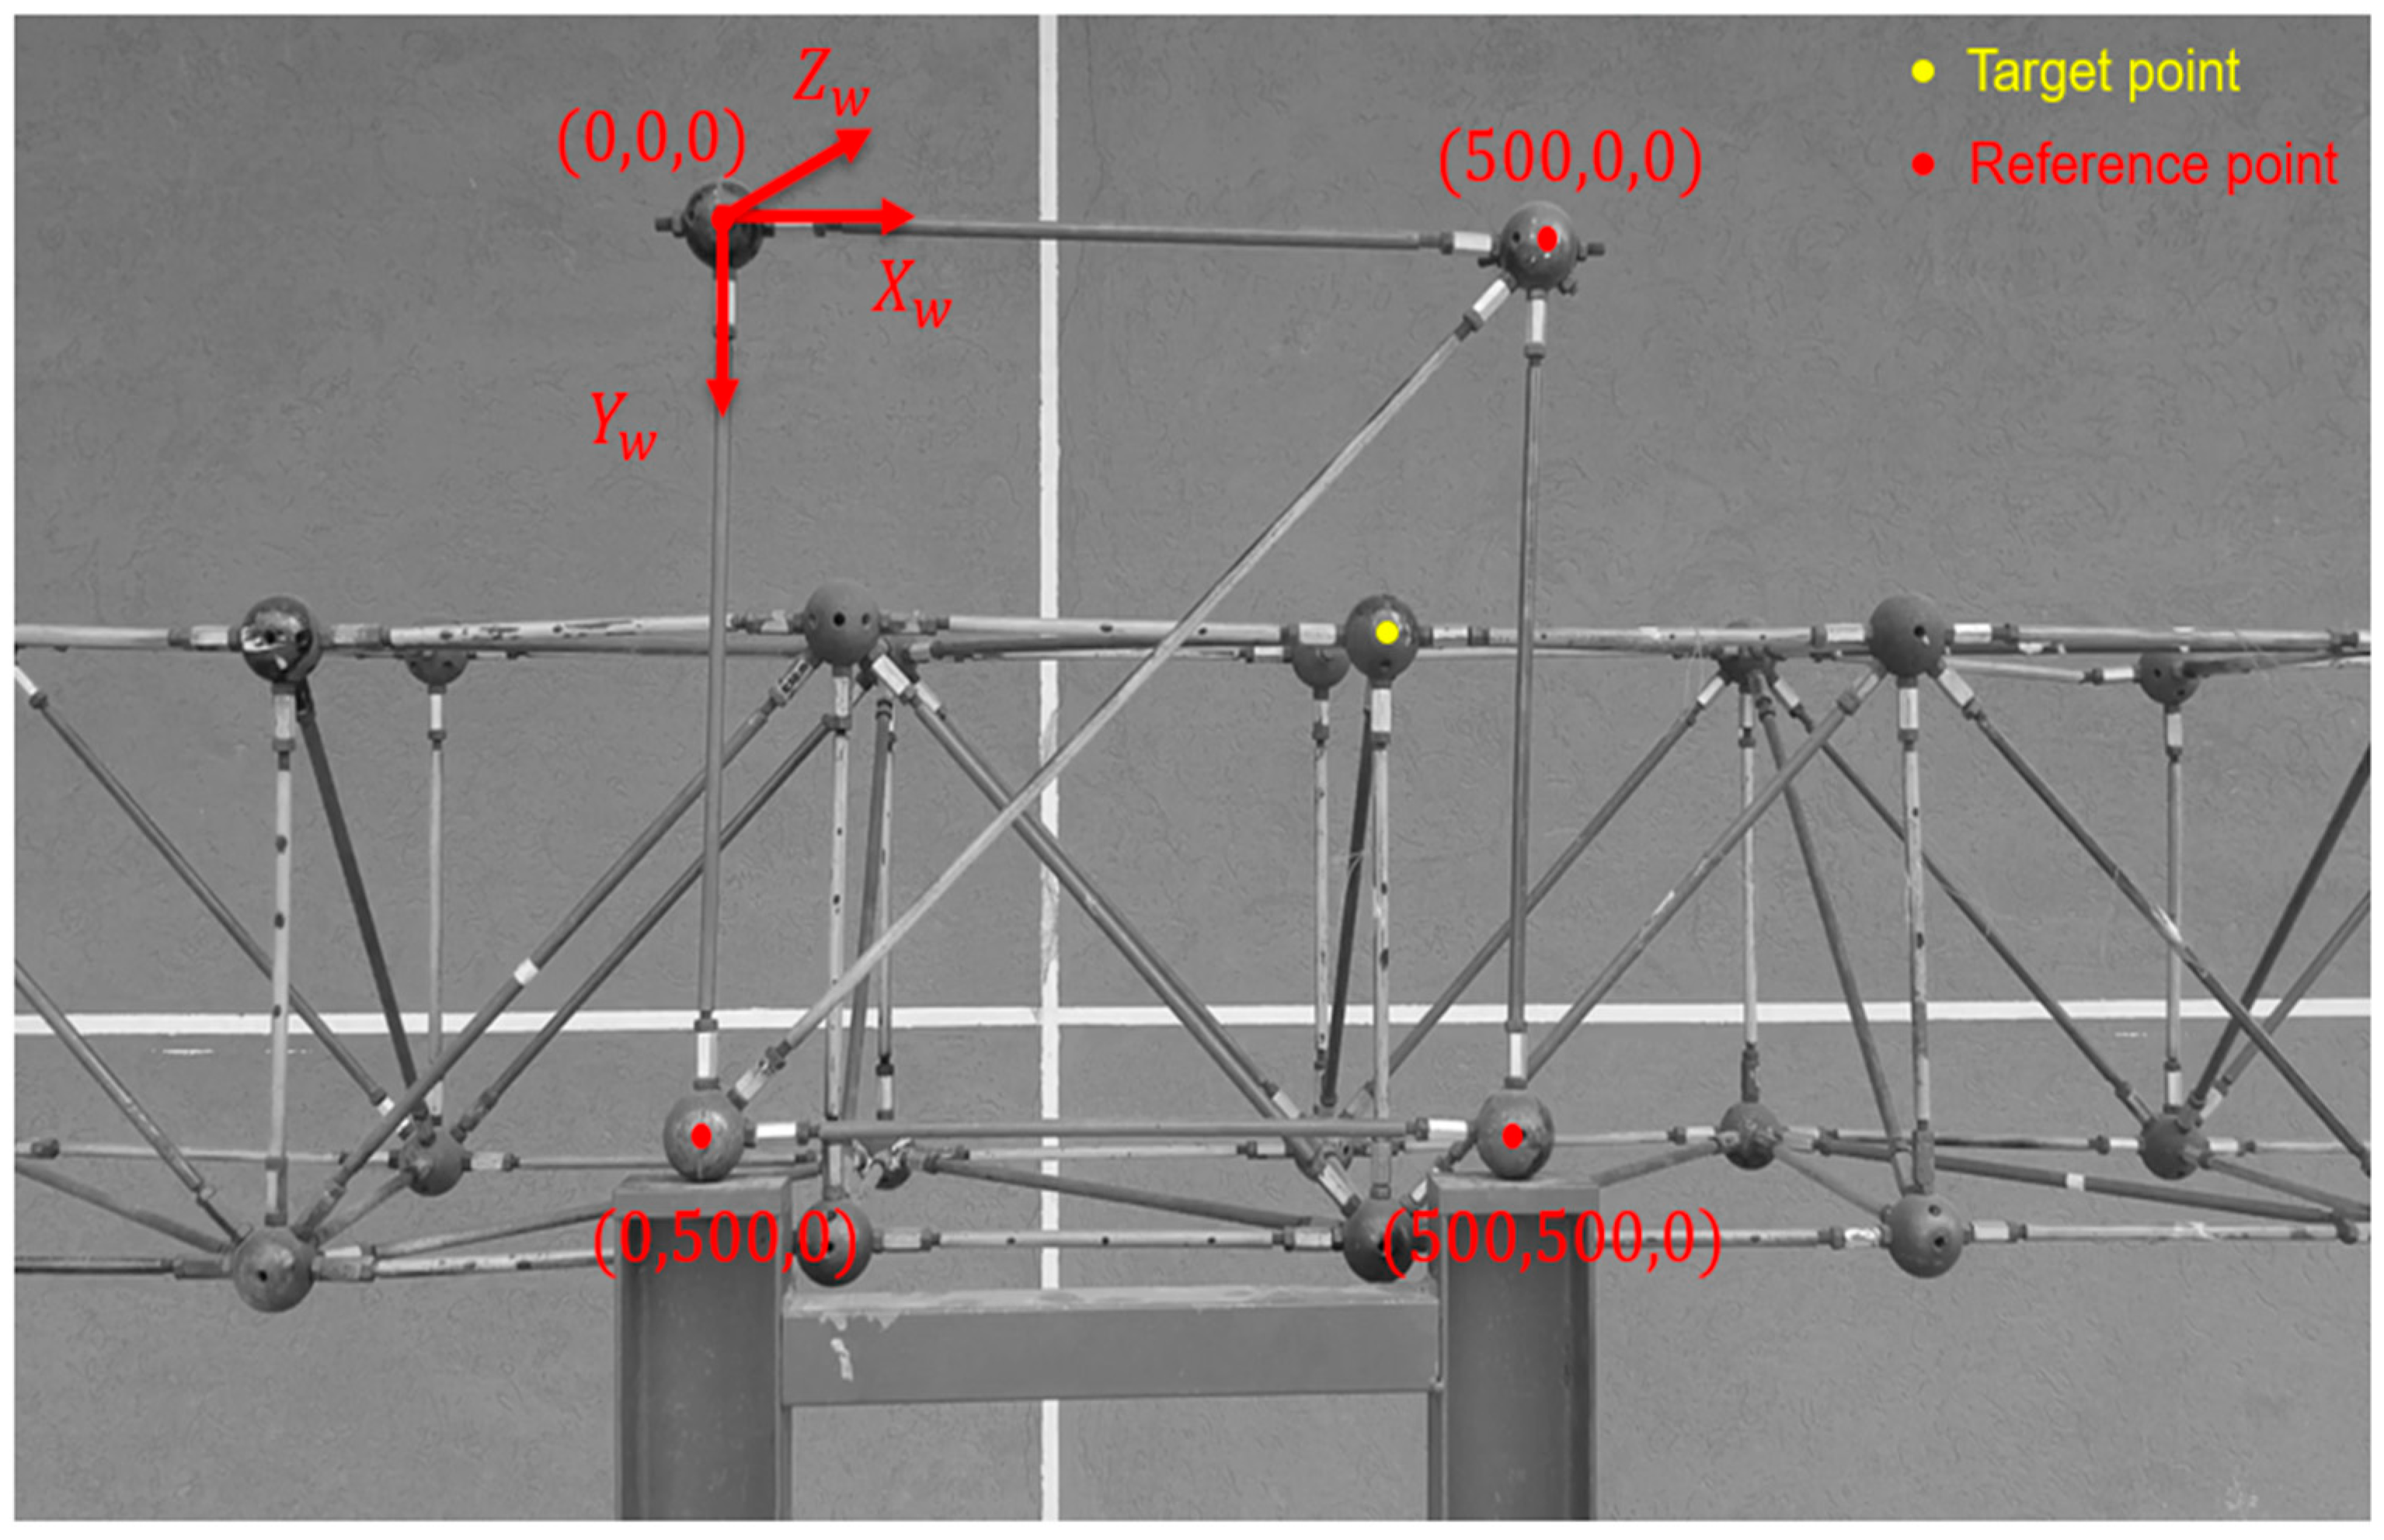
The extrinsic matrix represents the position and orientation of the UAV camera for different moments. As shown in Figure 4, the upper left corner of the fixed object plane can be set as the origin of the world coordinate system, the horizontal direction is the X w axis, and the vertical direction is the Y w axis. Once A is known, the UAV extrinsic matrix can be computed by at least four sets of world coordinates and their corresponding image pixel coordinates.
During calibration, the extrinsic parameters are estimated numerically by minimizing the reprojection errors for all calibration images, which is:
i = 1 n j = 1 m m i j m ( A , R i , t i , P j ) 2
where n is the number of frames. m is the number of points. m i j represents the j t h detected point in frame i ; m ( A , R i , t i , P j ) is the projection of world point P j in frame i , using the estimated R i and t i .
The solution of the extrinsic matrix is completed by applying the extrinsic function in the Computer Vision Toolbox of MATLAB. Once the matrices R i and t i   ( i = 1 , 2 , 3 , n ) for each UAV frame have been calculated, the projection matrices can be estimated by combining the intrinsic matrix A . The details of 3D reconstruction using a projection matrix will be introduced in the next section.

2.3.2. Recovering the 3D Coordinates

The projection matrix M can be obtained by combining the intrinsic and extrinsic parameters as follows:
s ( u v 1 ) = [ m 11 m 12 m 13 m 14 m 21 m 22 m 23 m 24 m 31 m 32 m 33 m 34 ] ( X w Y w Z w 1 )
Equation (8) can be written in the following form:
m 11 X w + m 12 Y w s u = m 14 m 13 Z w m 21 X w + m 22 Y w s v = m 24 m 23 Z w m 31 X w + m 32 Y w s = m 34 m 33 Z w
which leads to:
[ m 11 m 12 u m 21 m 22 v m 31 m 32 1 ] ( X w Y w s ) = ( m 14 m 24 m 34 ) Z w ( m 13 m 23 m 33 )
Then, the 3D world coordinates of the target points on the bridge can be calculated by:
( X w Y w s ) = [ m 11 m 12 u m 21 m 22 v m 31 m 32 1 ] 1 β
where β = ( m 14 m 24 m 34 ) Z w ( m 13 m 23 m 33 ) , Z w is the vertical distance between the fixed object plane and the bridge model plane. Finally, by substituting the pixel coordinates u and v of the target points into Equation (11), the 3D world coordinates of the points can be recovered. The real displacement of the target points can be calculated from the subtraction between Y w i Y w 1 (where i is the frame number, Y w 1 is the value of the original coordinate).
Ultimately, the approach mentioned above is compared with the homography transformation approach.

2.4. Operational Modal Analysis (OMA)

The Response Transmissibility (RT) is commonly used to identify the modal parameters of a structure in the OMA theory. The RT, T i o ( ω ) , between the degrees of freedom, i and o , can be defined as [40]:
T i o ( ω ) = X i ( ω ) X o ( ω )
where X i ( ω ) and X o ( ω ) are the Fourier transforms of x i ( t ) and x o ( t ) which represent the response time-histories at the degrees of freedom i and o , respectively.
The Power Spectral Density Transmissibility (PSDT), T ^ i o , is commonly used for modal identification [41]:
T ^ i o ( ω ) = S i , o ( ω ) S o , o ( ω ) = X i ( ω ) X o ( ω ) X o ( ω ) X o ( ω ) = T i o ( ω )
where X o ( ω ) is the conjugate of X o ( ω ) and S o , o ( ω ) is the Power Spectral Density (PSD) of x o ( t ) x o ( t ) , while S i , o ( ω ) , which is the Cross Power Spectrum (CPS) for x i ( t ) and x o ( t ) .
In summary, the natural frequency can be determined by picking the peaks in the PSD plots of the response of a degree of freedom [42].

3. Experiments

3.1. Experimental Setups

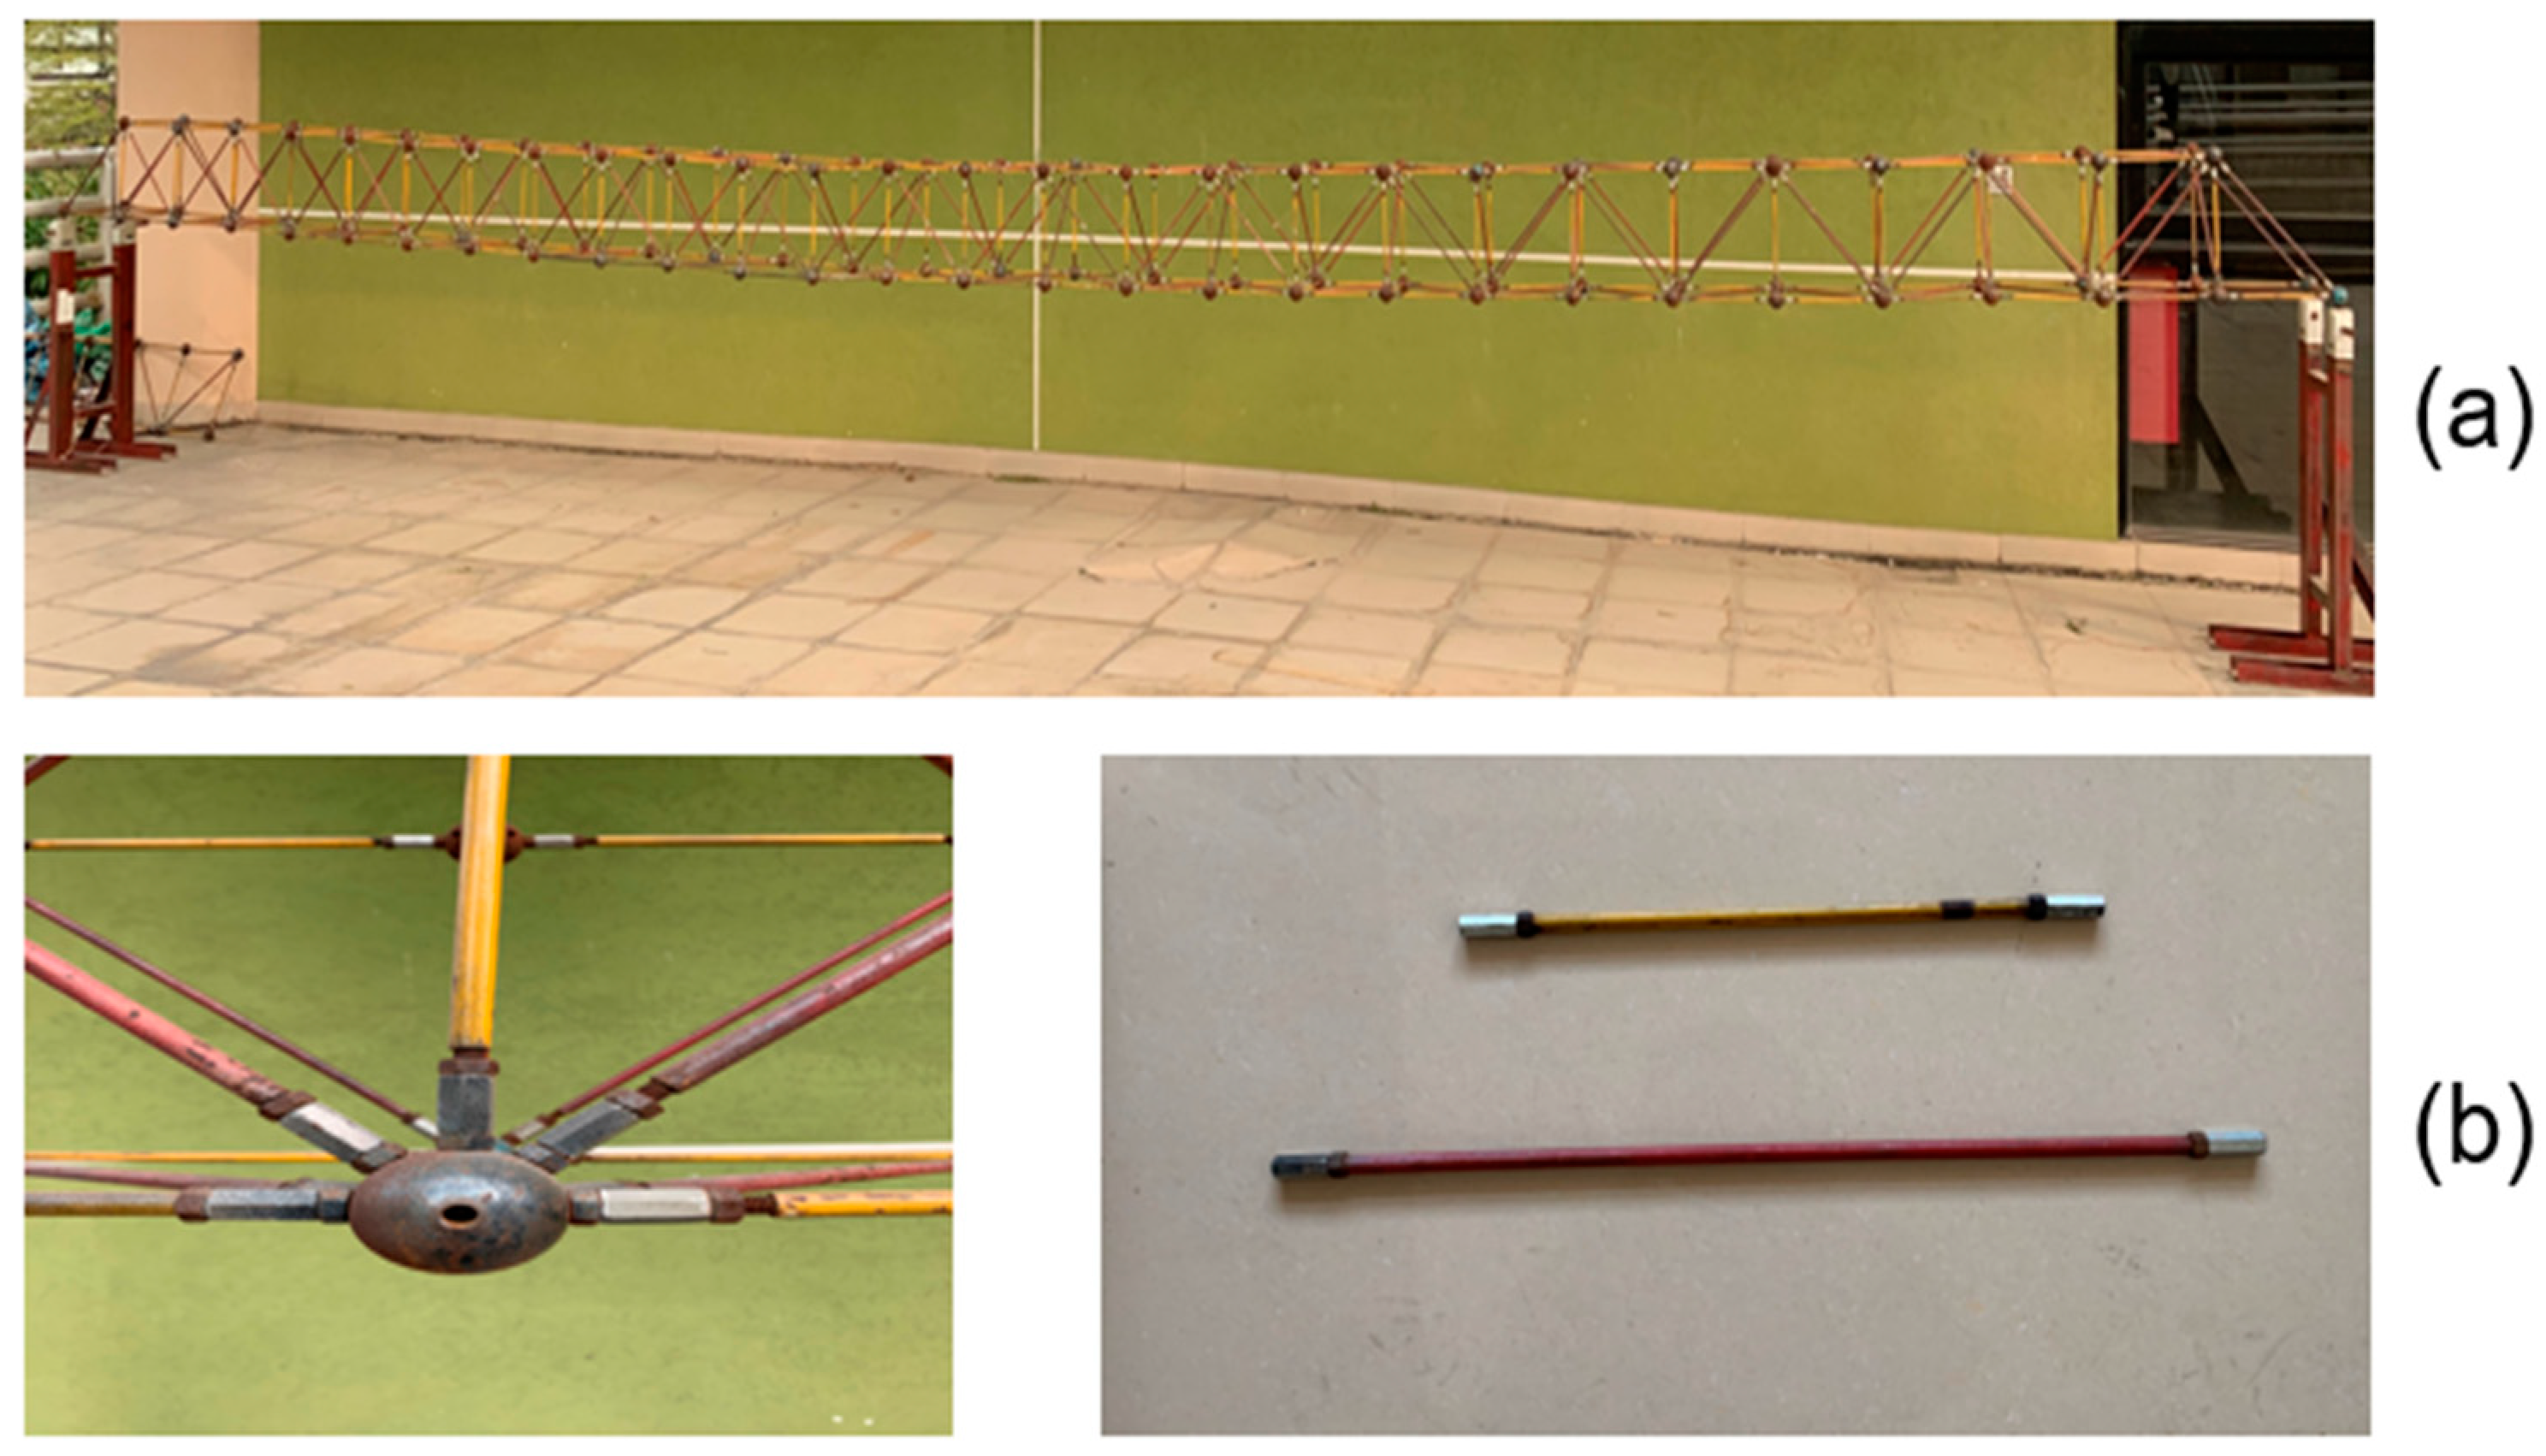
The bridge model has 28 spans, and its total length is 9.8 m (Figure 5a). Each span has dimensions of 0.35 m × 0.35 m × 0.35 m. The model components include bolted balls and rods (Figure 5b). The yellow rod has a length of 0.35 m, and the red rod has a length of 0.5 m. The truss is simply supported at both ends.
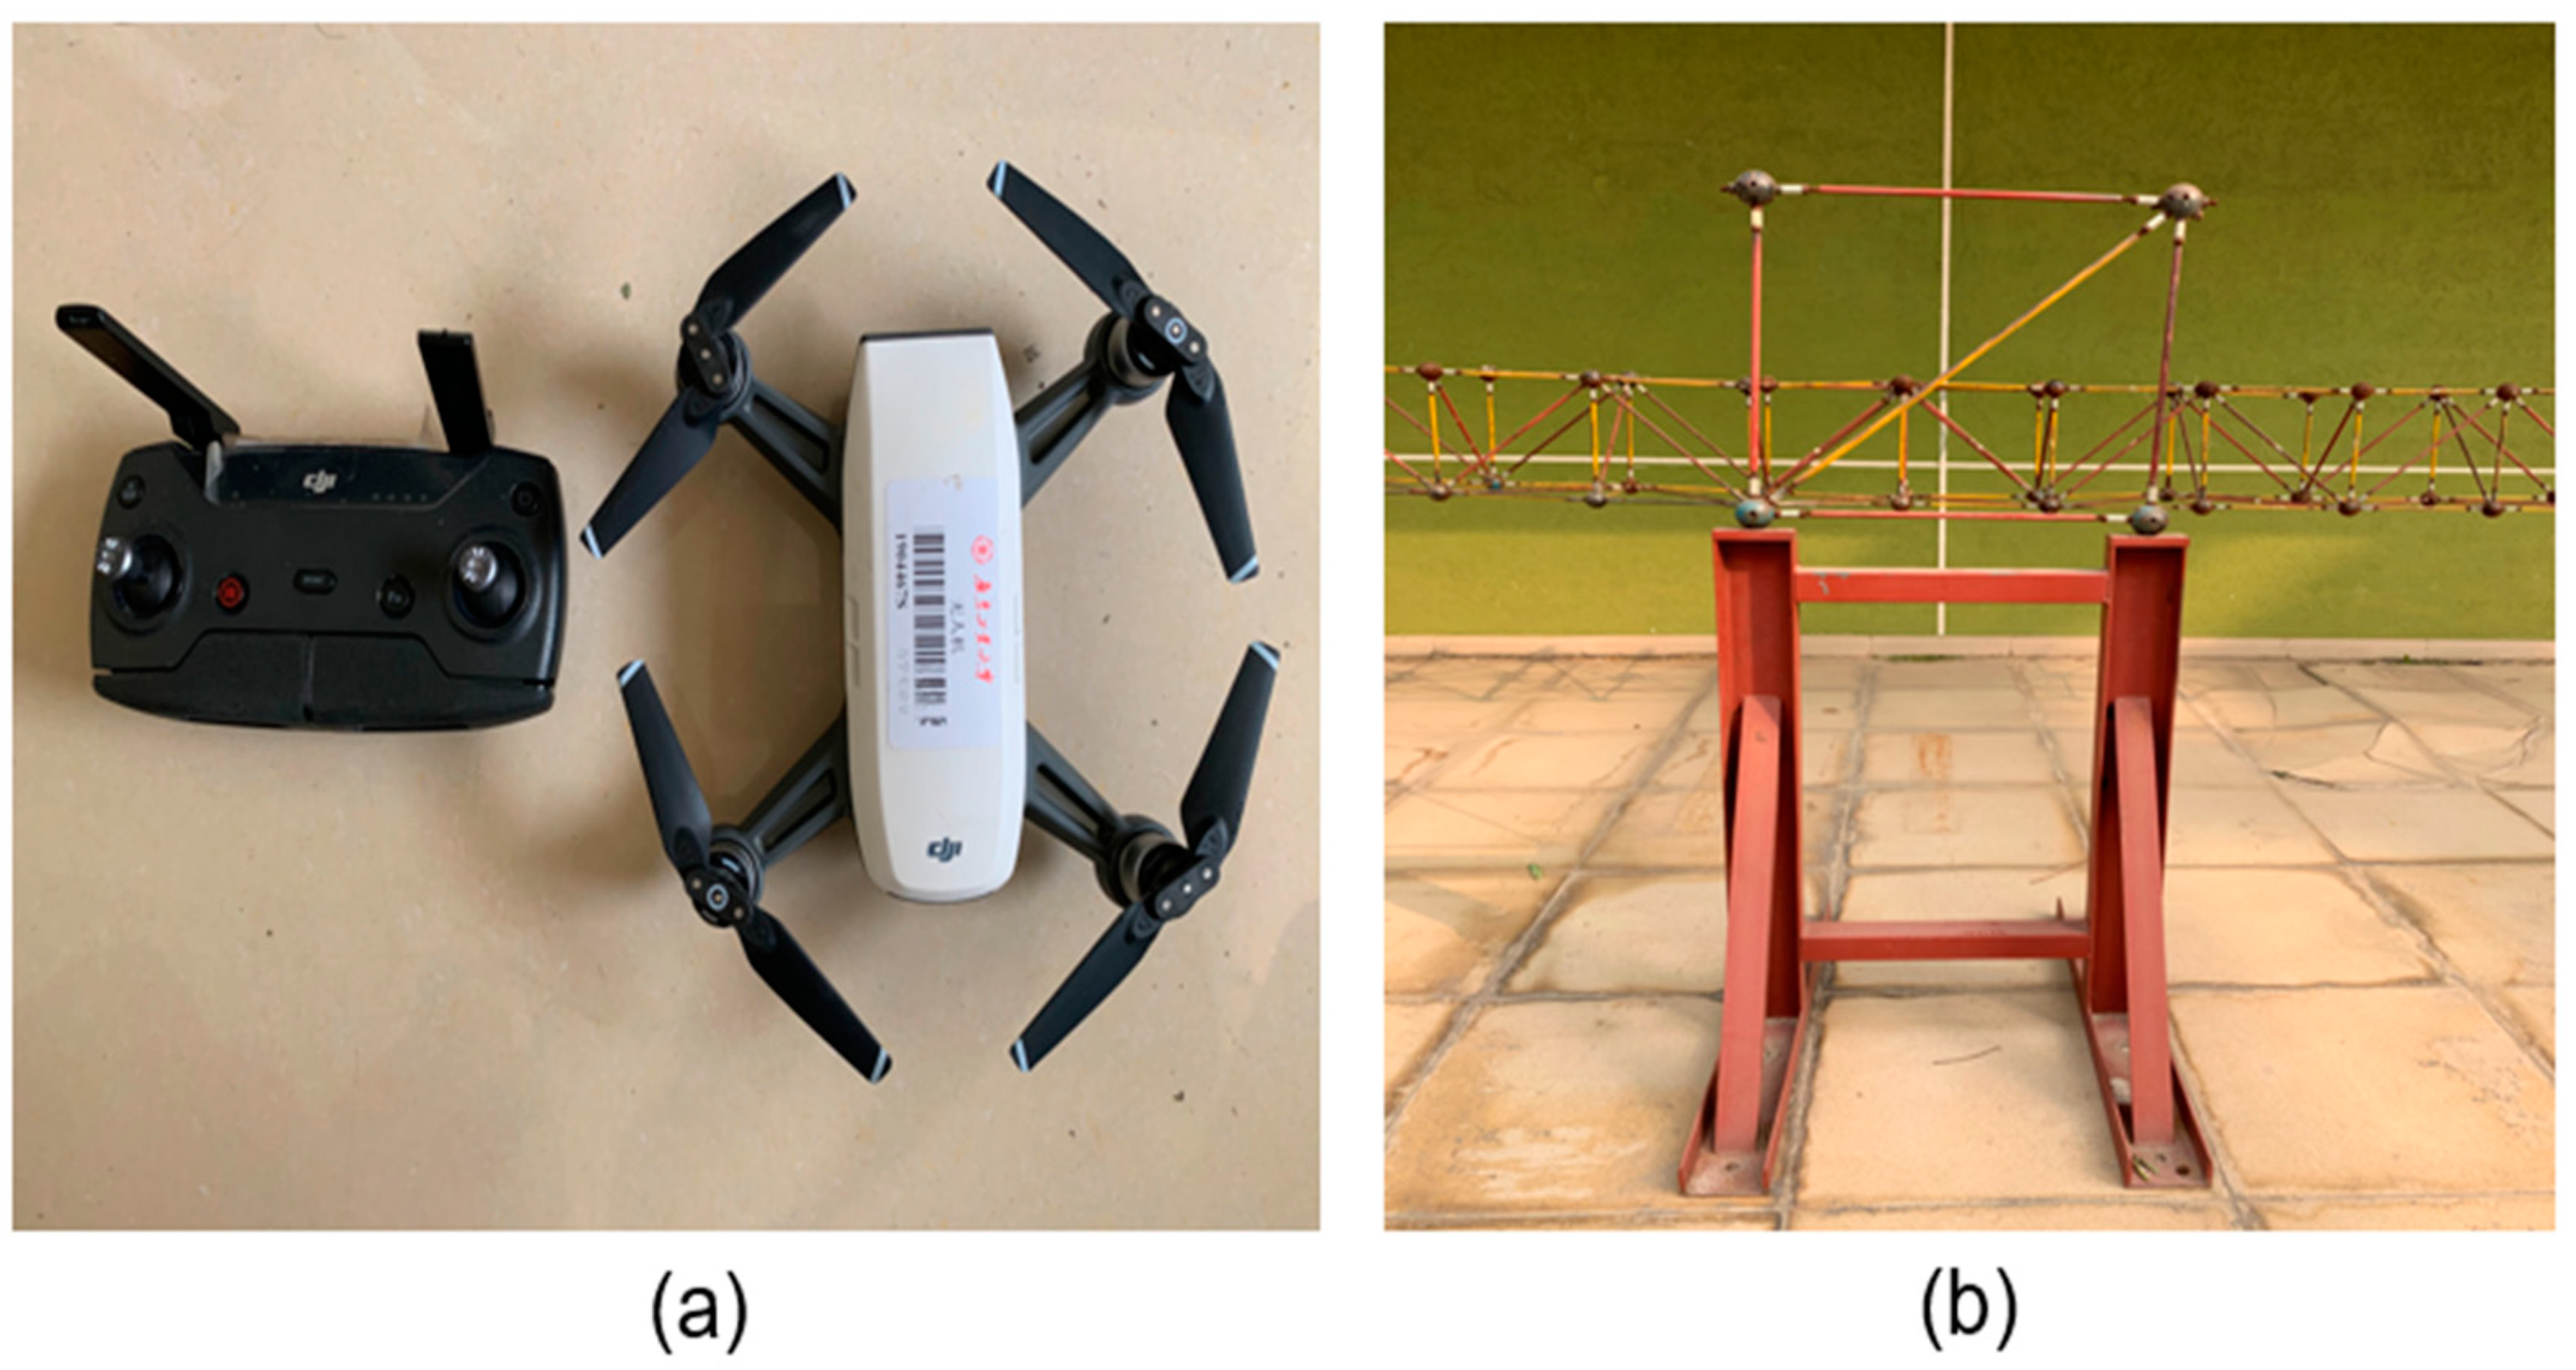
The quadrotor UAV (Spark, Da-Jiang Innovations, Shenzhen, China) used has a camera (Figure 6a) with a resolution of 1920 × 1080 pixels and a recording rate of 30 frames/second.
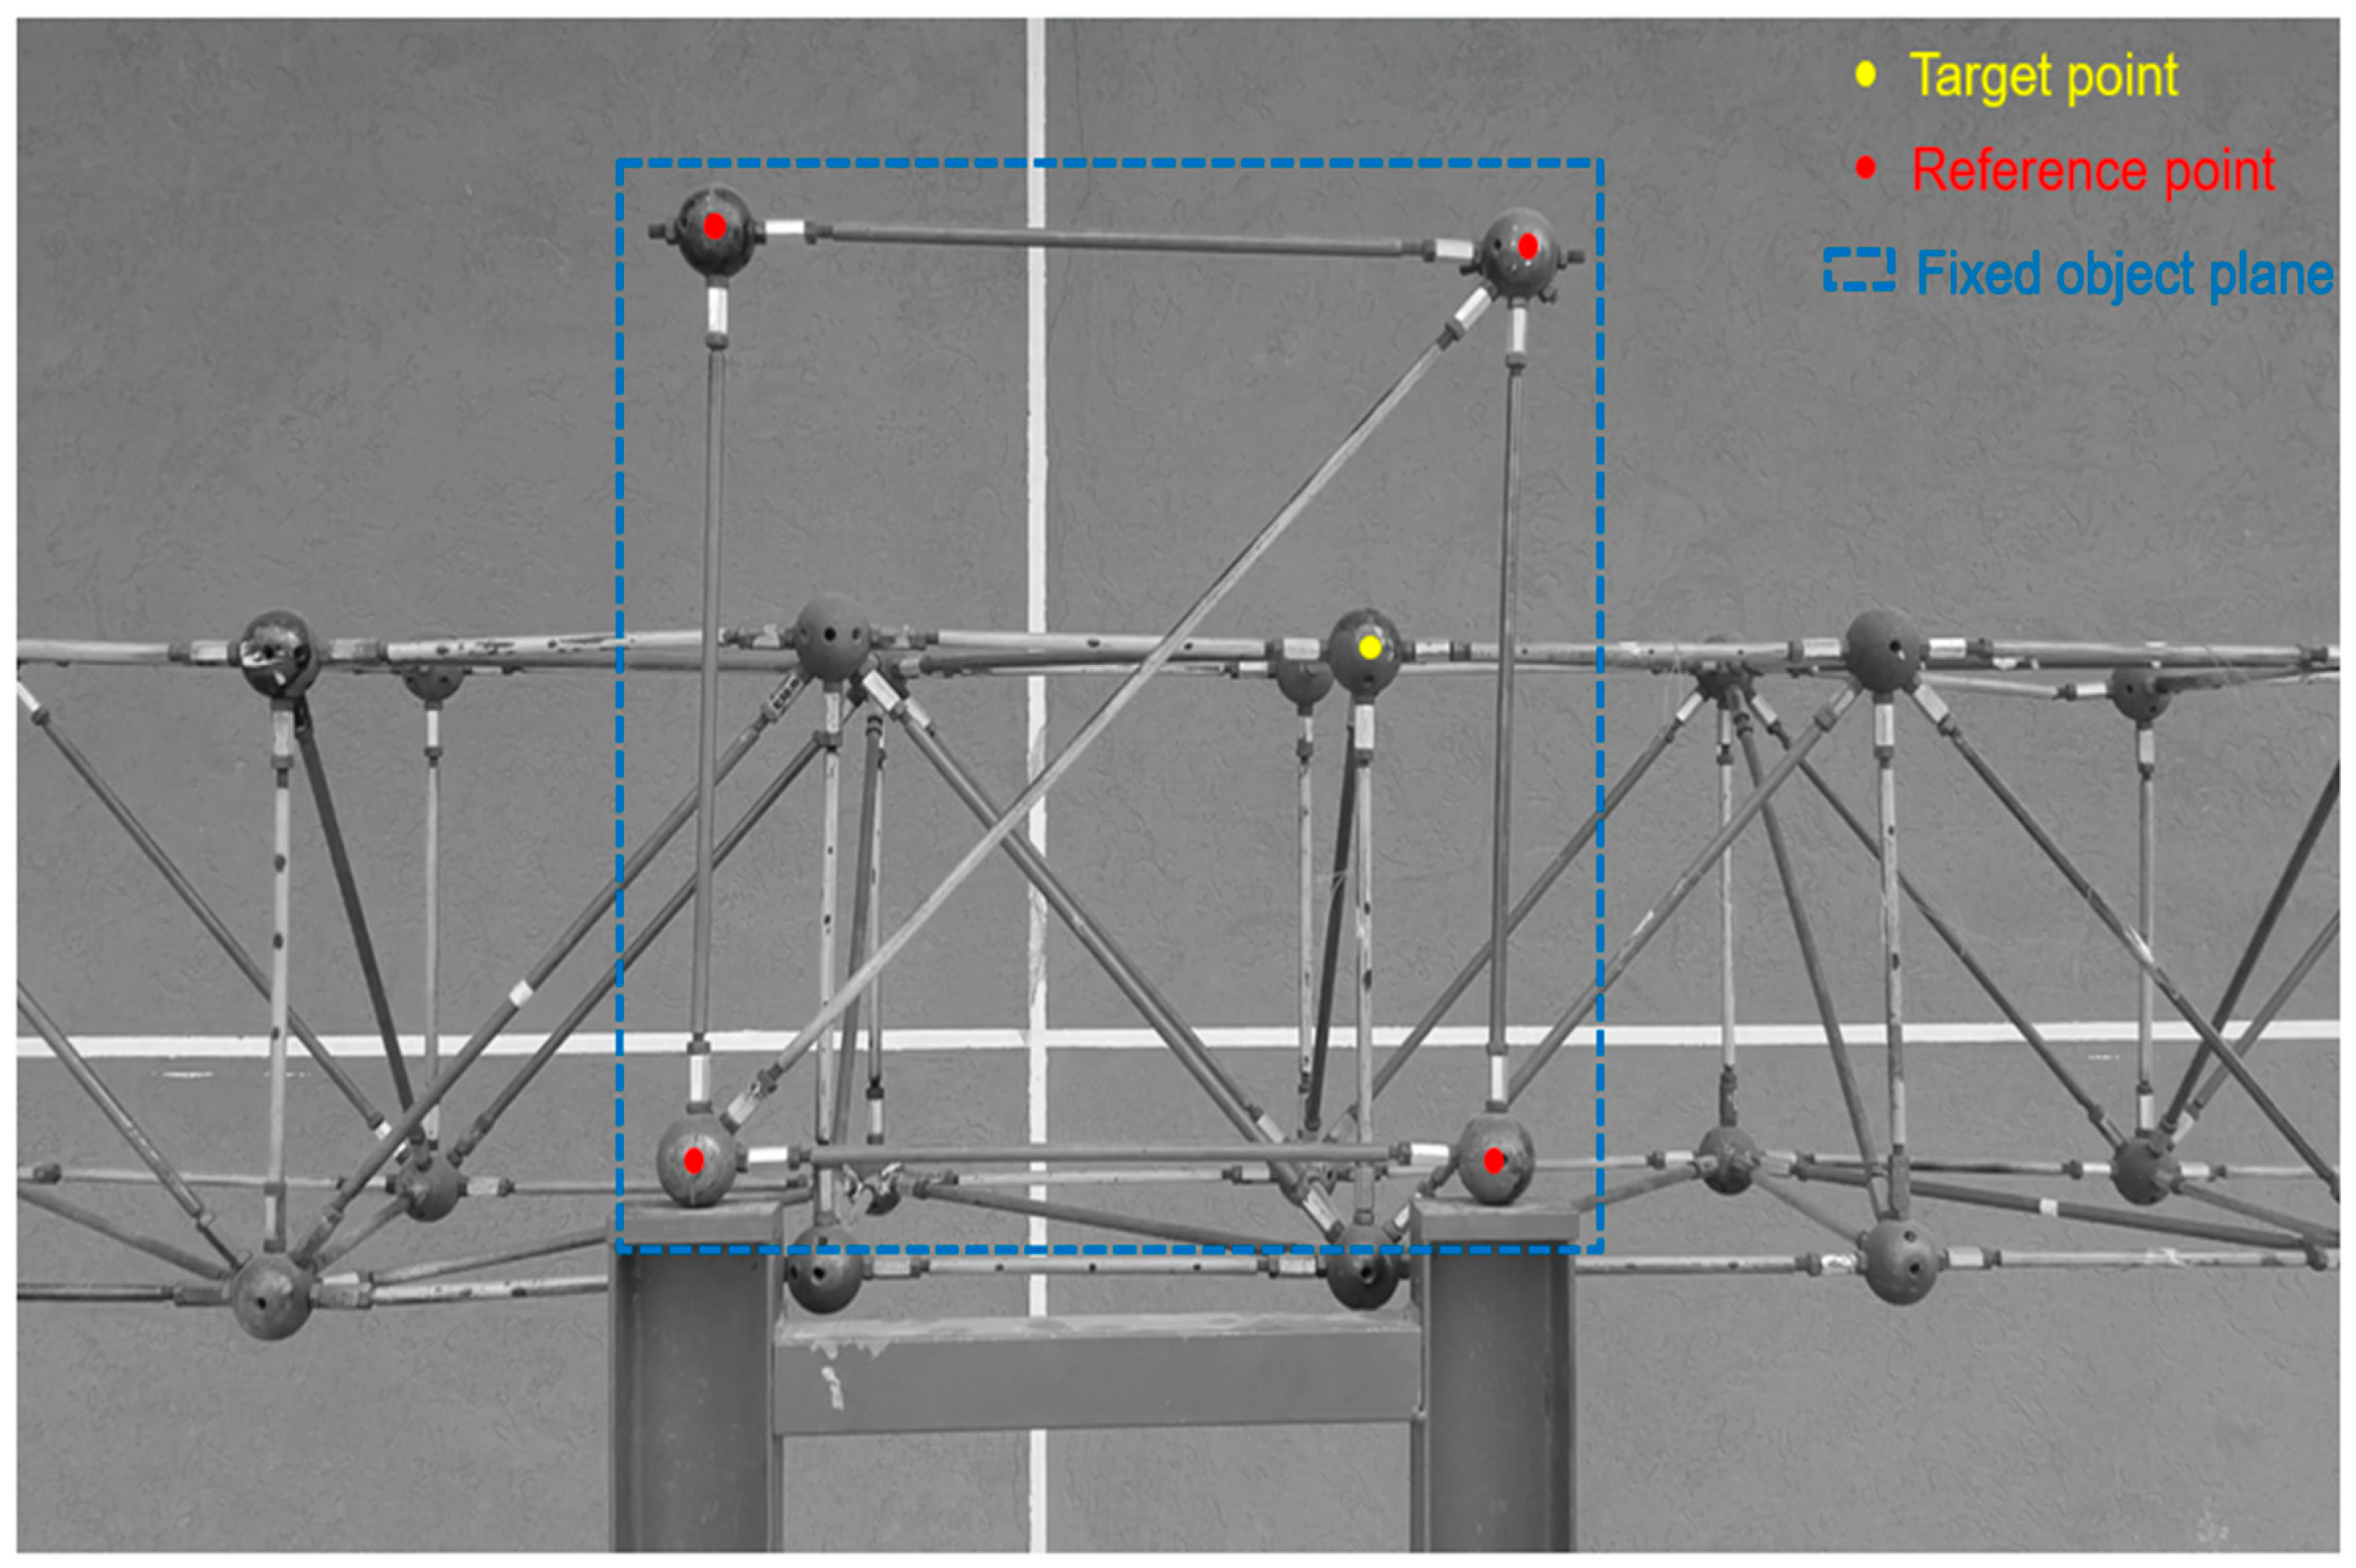
The fixed object is a rectangular steel frame as in Figure 6b. The four corner points at the rectangular frame plane are used as the reference points. For the homography-based correction approach, the fixed object plane should be as close to the bridge model as possible, but there is no such request for the 3D reconstruction approach.

3.2. Experimental Schemes

Figure 7 shows the four reference points (red points on the rectangular frame) and the target point (the yellow point on the bridge model). In the experiment, the bridge model is excited by an arbitrary force.
For the homography transformation approach, the four reference points can be used to establish the homography relationship between the original frame and the frame to be corrected.
For the 3D reconstruction approach, the fixed rectangular frame is the Xw–Yw plane of the world coordinate system (Figure 8). The top left corner point is its origin. The world coordinates of the four reference points are ( 0.0 , 0.0 , 0.0 ) , ( 500.0 , 0.0 , 0.0 ) , ( 0.0 , 500.0 , 0.0 ) , and ( 500.0 , 500.0 , 0.0 ) , respectively, and their corresponding pixel coordinates obtained from the first frame are ( 577.1 , 147.0 ) , ( 1245.2 , 165.1 ) , ( 559.2 , 806.9 ) , and ( 1228.2 , 804.9 ) , separately. Using the four sets of coordinate values and the intrinsic matrix A , R1 and t 1 can be computed using the extrinsic function of MATLAB.
Similarly, the pixel coordinates of the reference points from the 2 n d to the n t h frames can also be utilized to calculate the extrinsic matrices R i and t i for each frame of images. Ultimately, the projection matrices M i   ( i = 1 , 2 , 3 , n ) for each frame can be estimated.
In order to study the influence of the distance between the fixed object and the bridge model on the measurement accuracy, three working conditions are set up: (1) the reference points (on the fixed object plane) are coplanar with the target points, that is, the distance between the fixed object and bridge model is 0.0 m. In addition, the distance between the UAV and the bridge model is 3 m (Figure 9a); (2) the fixed object is 1 m in front of the bridge model, and the UAV-bridge model distance is 5 m (Figure 9b); (3) the fixed object is 1 m behind the bridge model, and the UAV-bridge model distance is also 3 m (Figure 9c).

4. Results

4.1. Correction through 3D Reconstruction

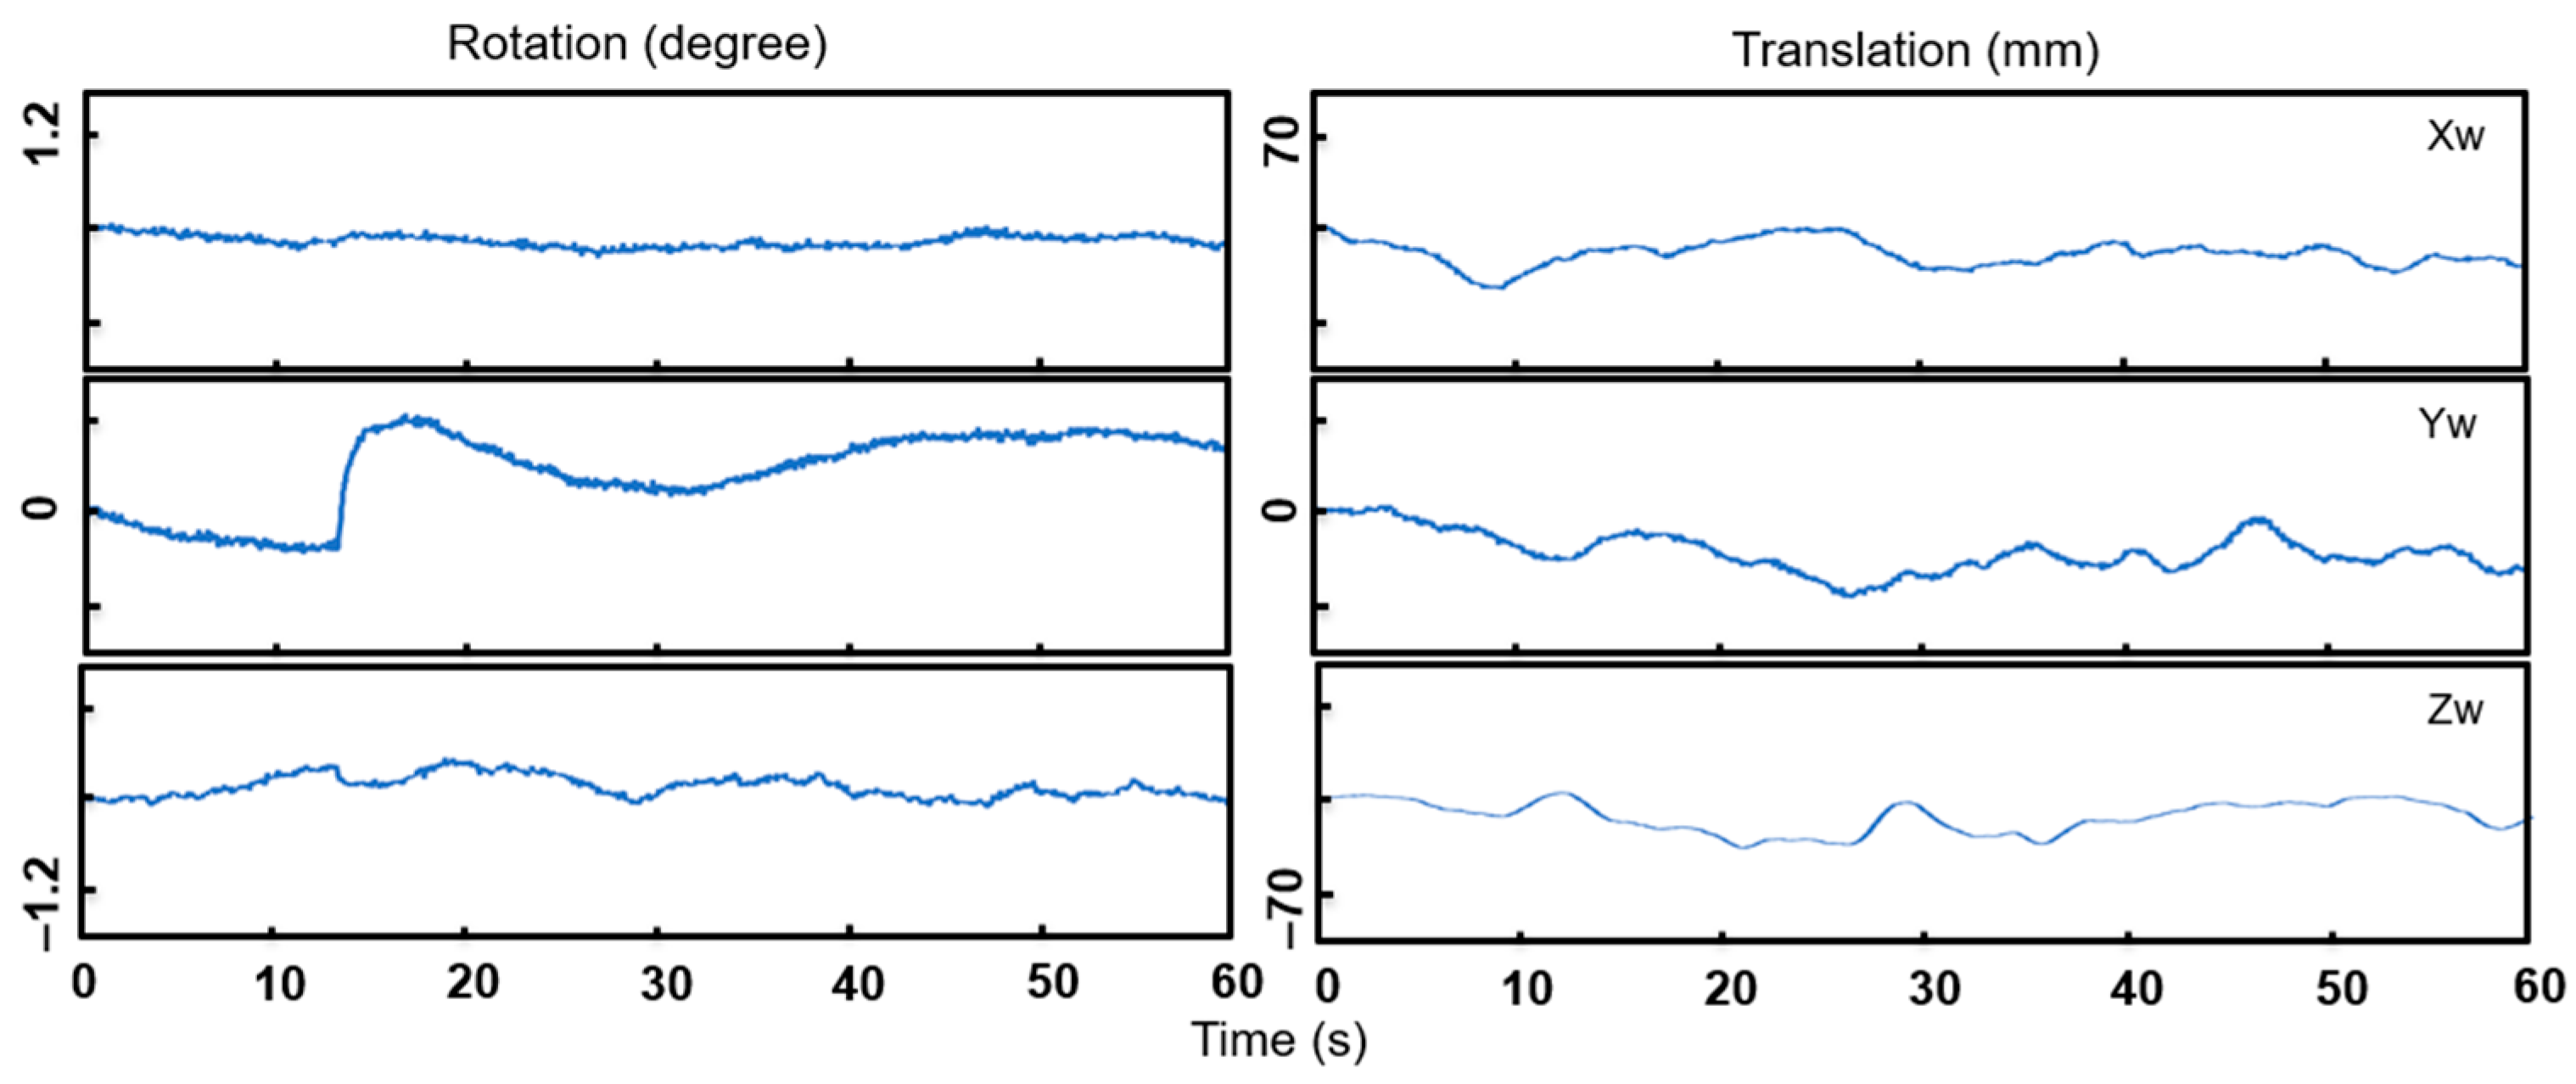
The six-degrees-of-freedom (6 DOF) UAV motion, including three DOF rotations and three DOF translations, can be obtained after the camera calibration (Figure 10). It represents the movement of the UAV camera around the three axes of the world coordinate system. During the experiment, the bridge model is excited five times; hence, there will be five peaks in the displacement curve.
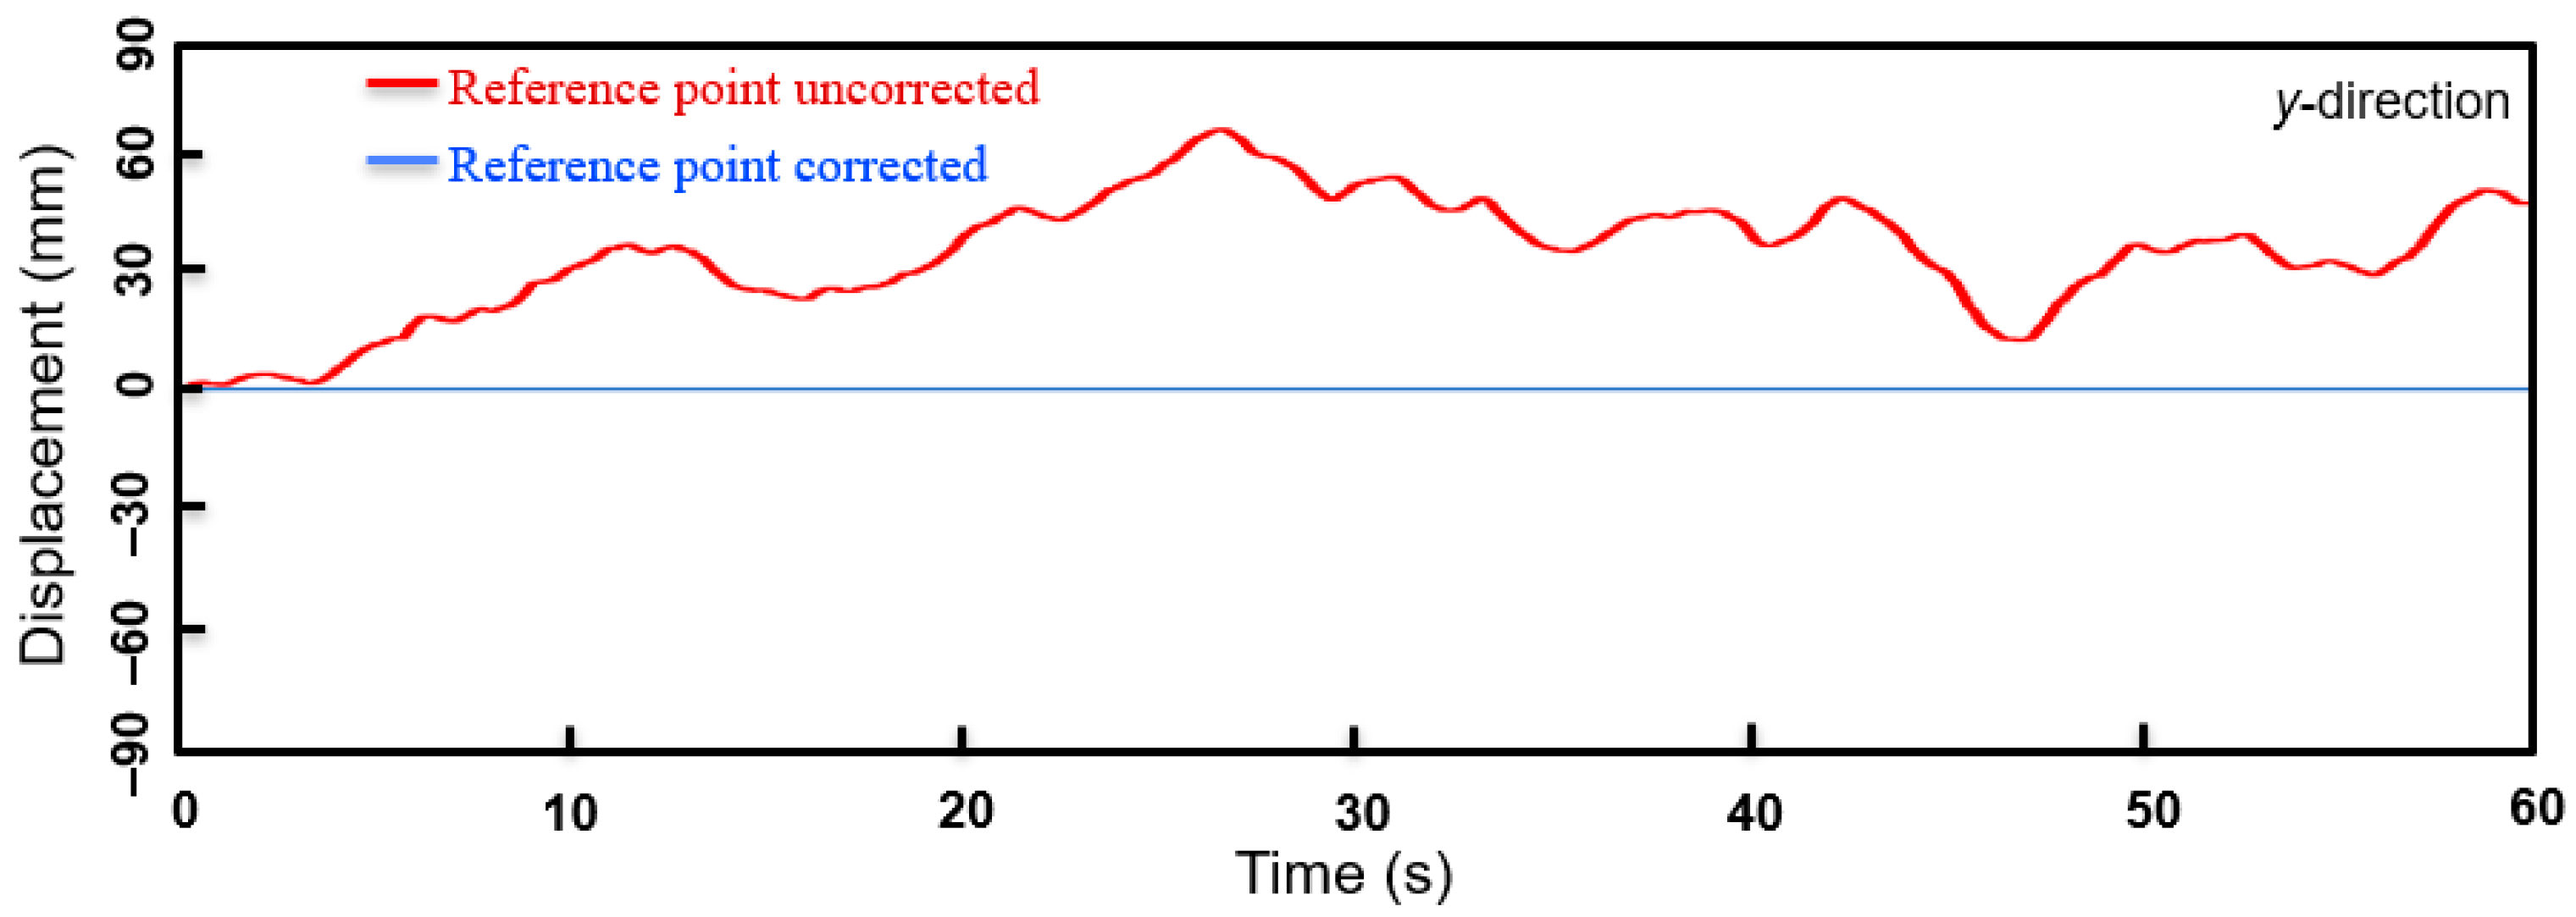
The displacement time–history curves (y-direction) of a reference point (the top left corner point) before and after correction are shown in Figure 11. Since it is a fixed point, its corrected displacement curve is almost a straight line along the x-axis. The uncorrected displacement of the target point collected by the UAV is presented in Figure 12, which contains the false displacement induced by UAV motion. The real displacement of the target point (y-direction) obtained by the 3D reconstruction method is also shown in Figure 12.
The OMA is used to analyze the modal parameters of the corrected displacement curve of the UAV, and the result is shown in Figure 13. It can be seen from Figure 13 that the first natural frequencies obtained by the two methods are 3.940 Hz, which demonstrates that the OMA successfully extracts the modal parameters from the 3D reconstruction-based displacement data.

4.2. Comparison of Homography Transformation and 3D Reconstruction

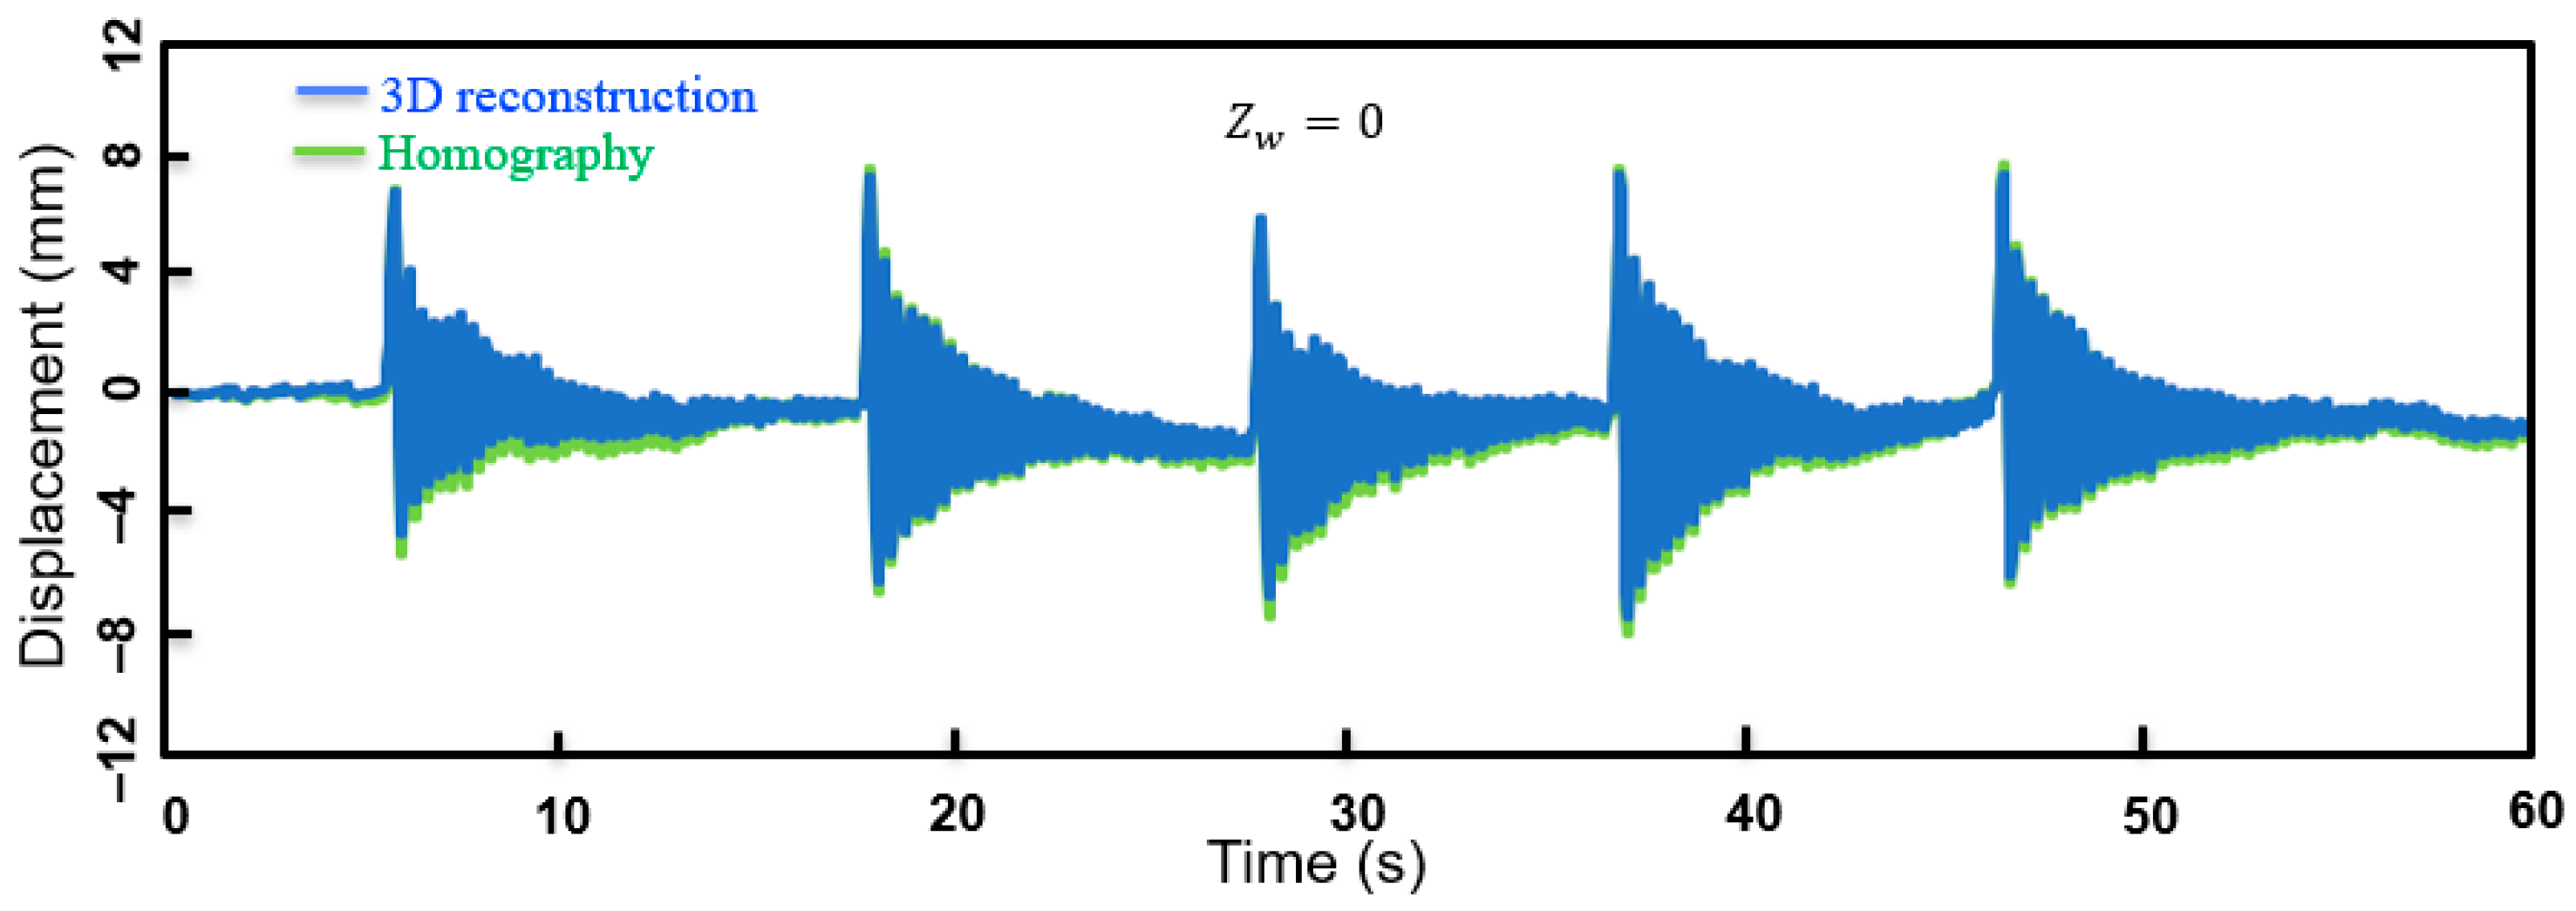
Figure 14 shows the displacement obtained by the two correction methods. The displacement curves are extremely similar to each other, and their maximum amplitudes are about 9 mm. Therefore, for the case that the reference points and the target point are coplanar ( Z w = 0 mm), the results of the homography transformation method and the 3D reconstruction method are consistent.
The following context will discuss the case in which the reference points and the target point are in different planes.
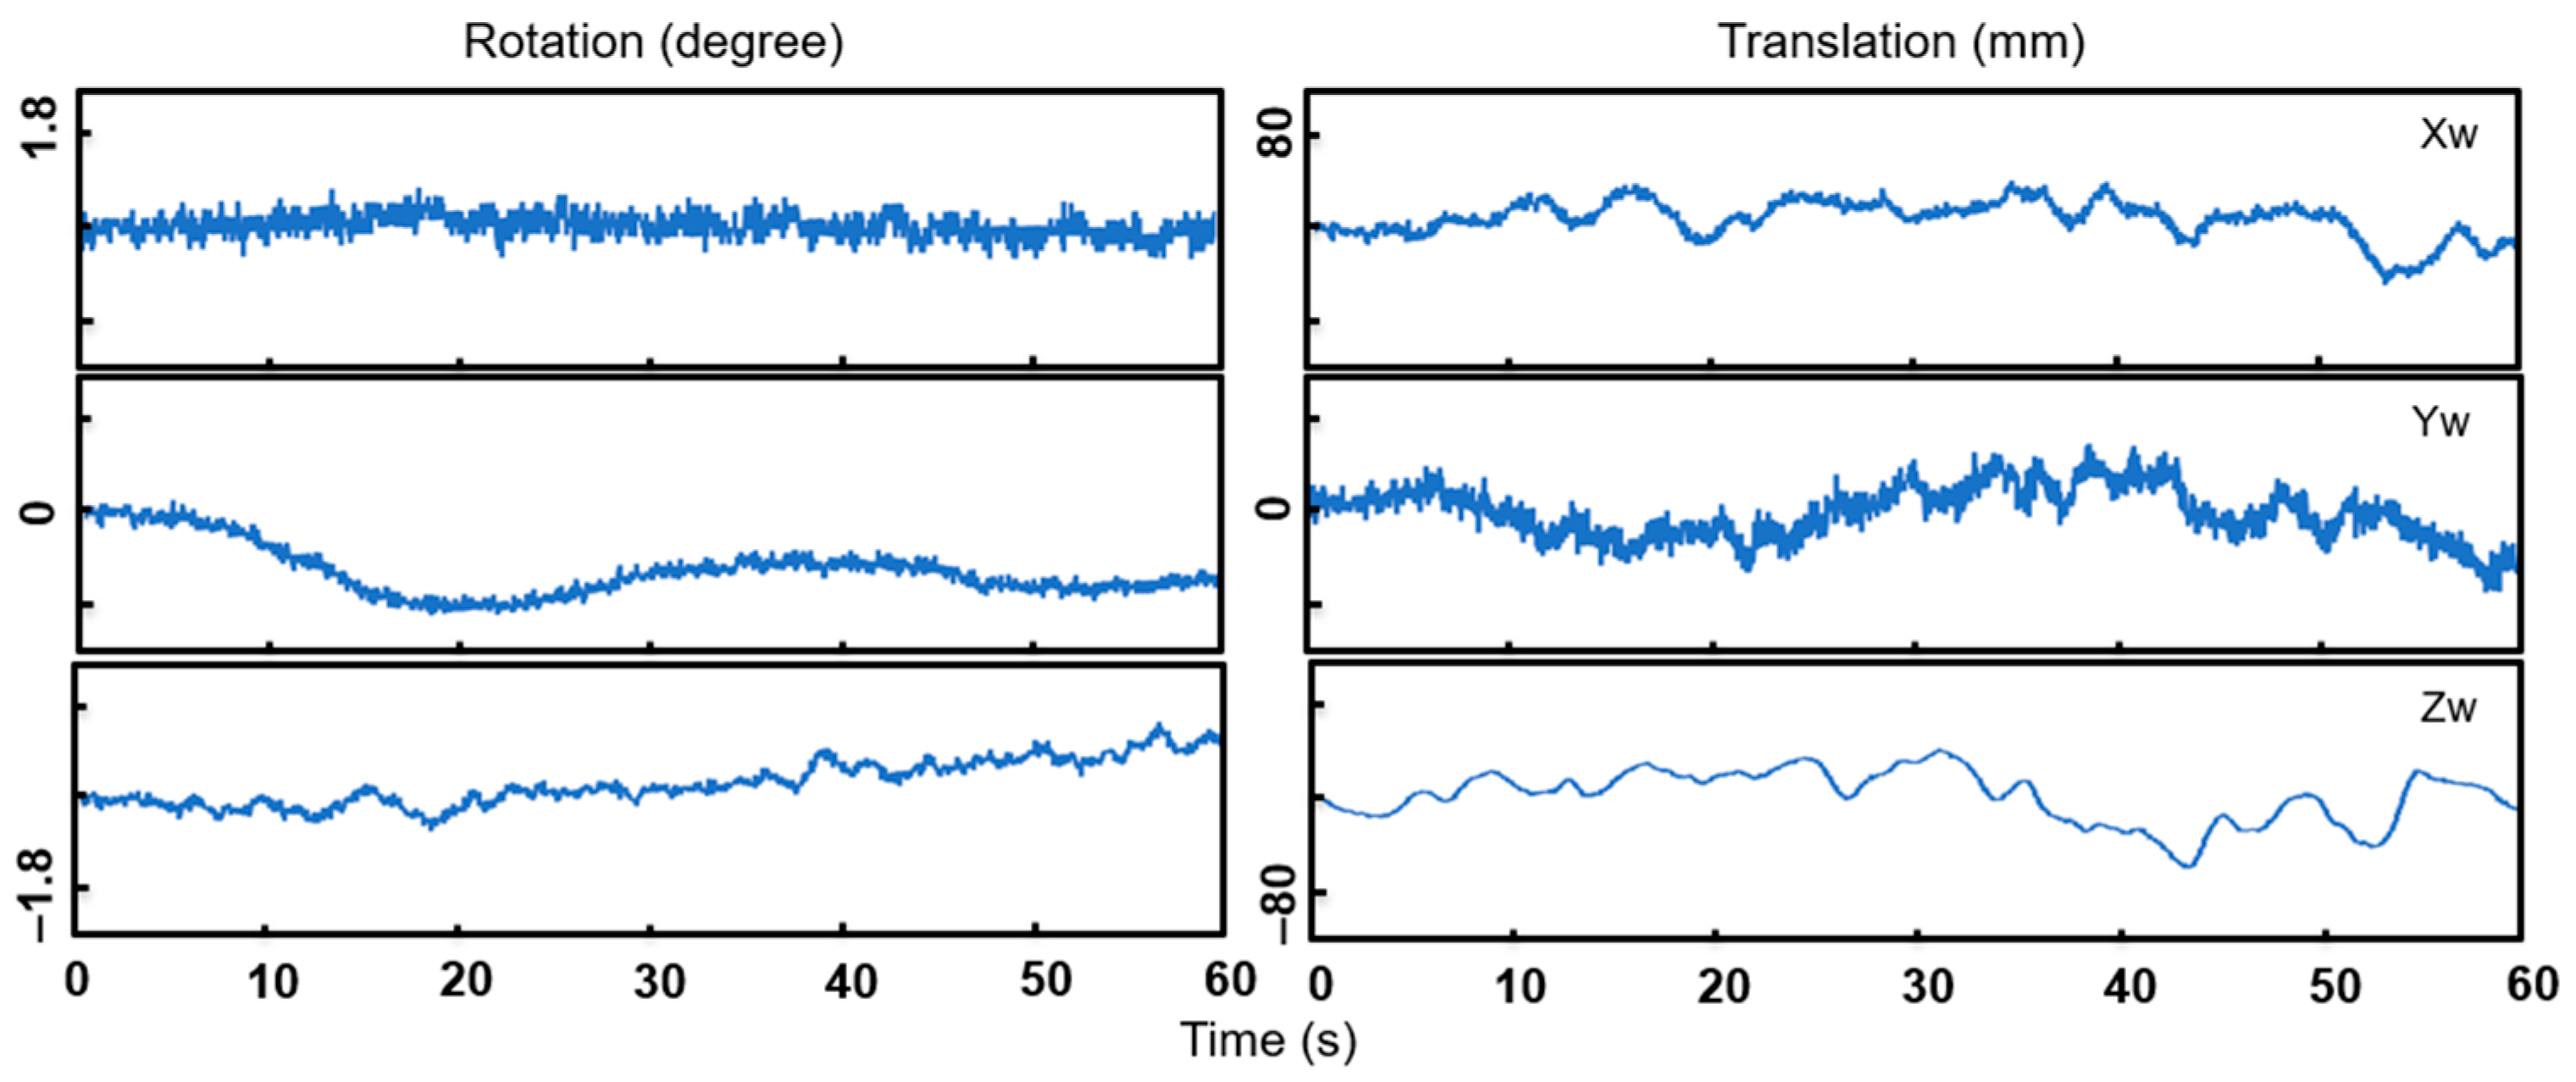
By moving the fixed objected 1 m towards the UAV camera, the reference points and the target point are non-coplanar ( Z w = 1000 mm). Figure 15 shows the 6 DOF UAV motion in this case. As demonstrated in Figure 16, the correction result of the homography transformation is entirely unacceptable, while the 3D reconstruction method is still effective. As the displacement PSD shows in Figure 17, the first natural frequency obtained by the proposed method is 3.927 Hz, which has a relative error of 0.33% compared to 3.940 Hz, while the one obtained by the homography-based method is 0.103 Hz.
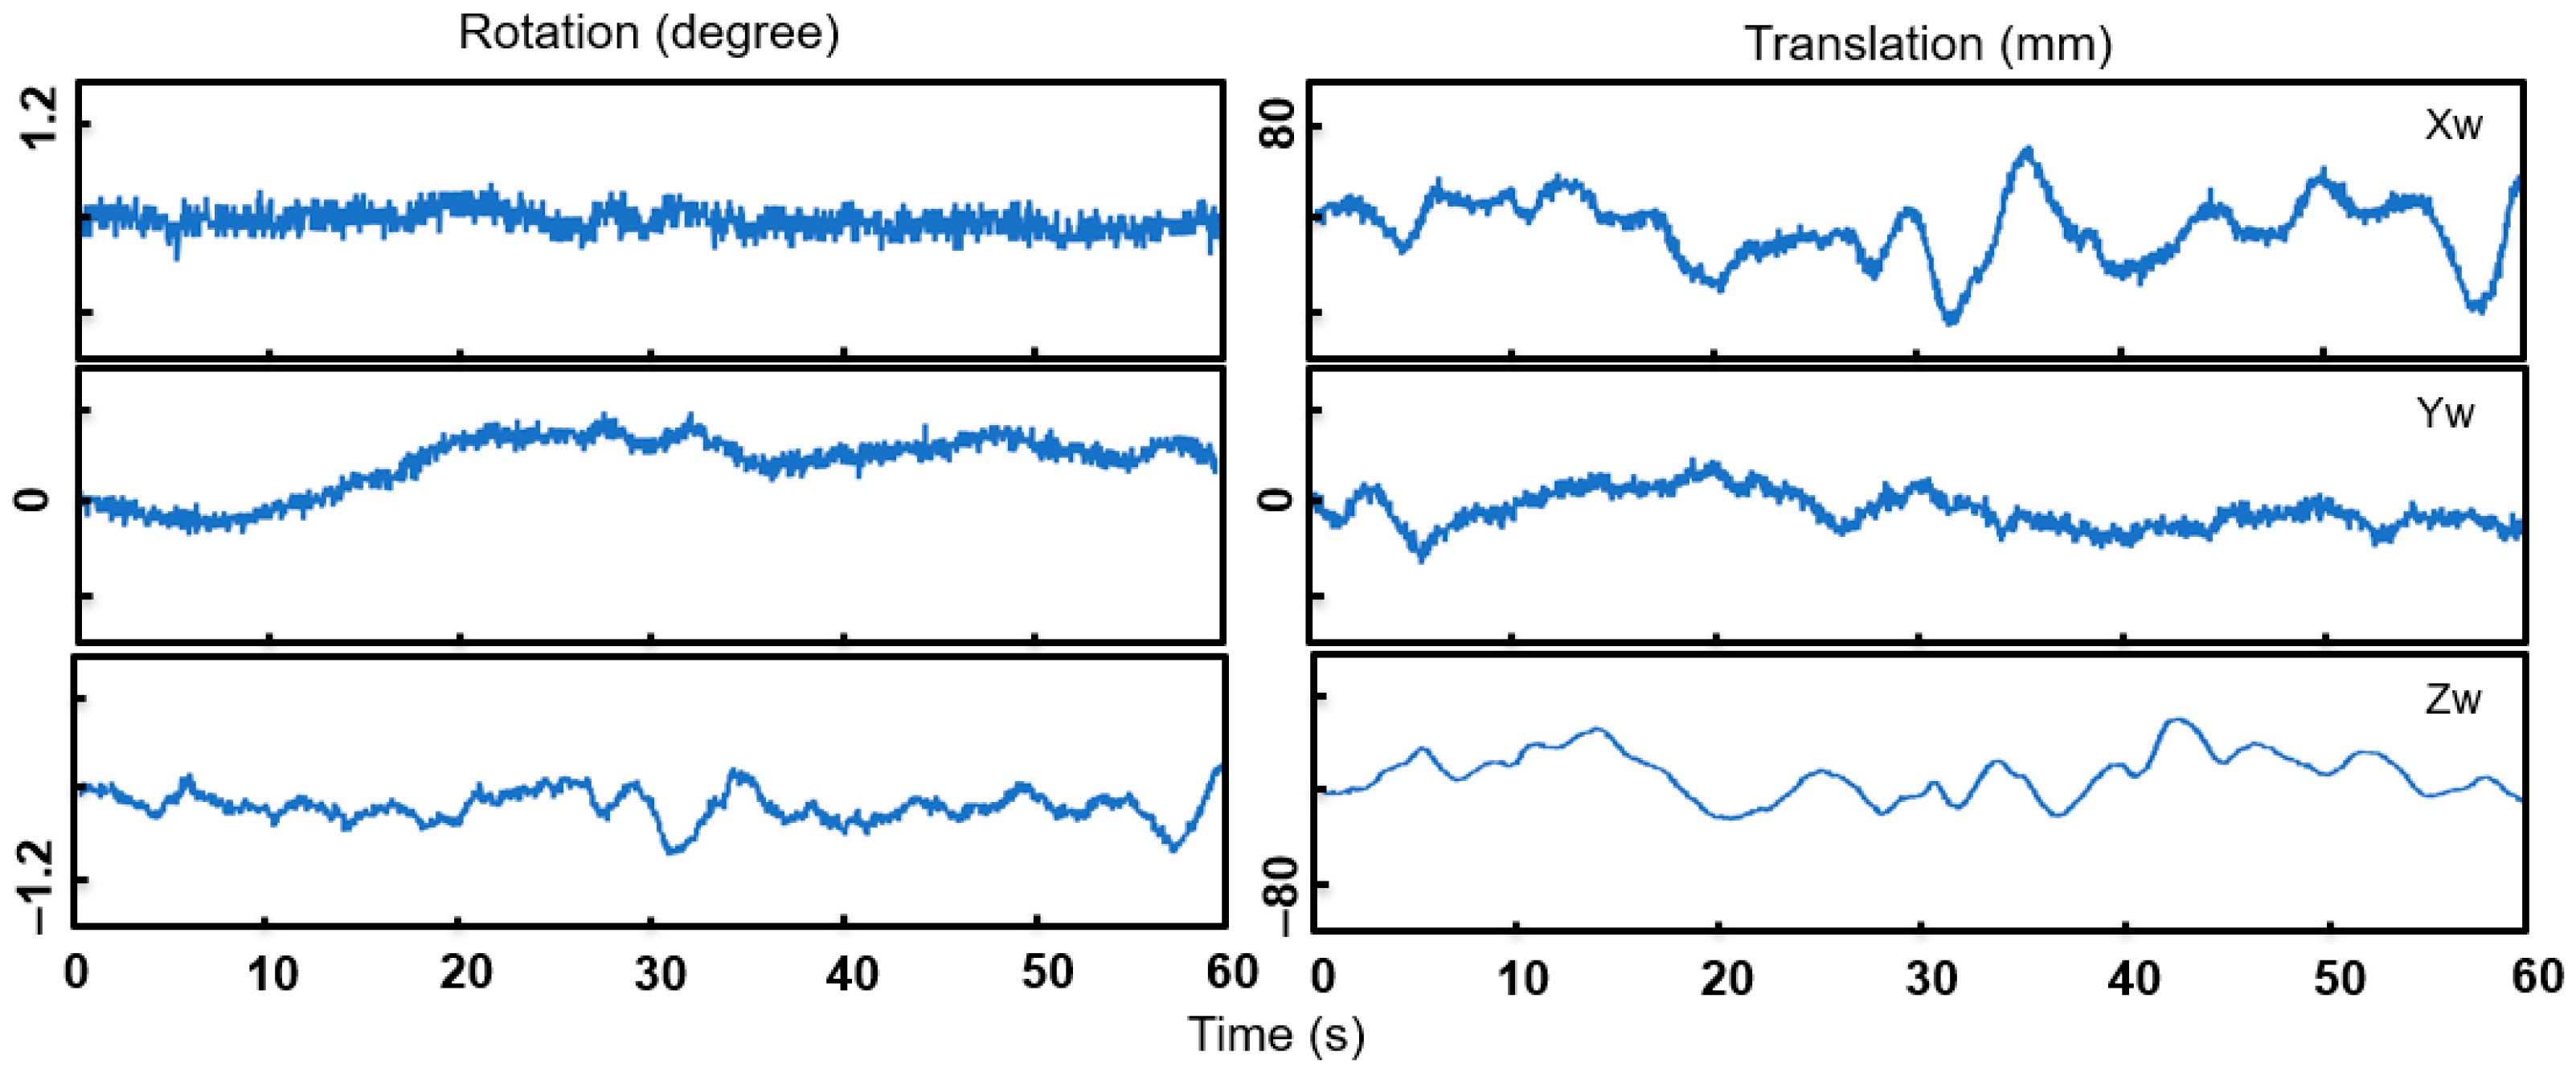
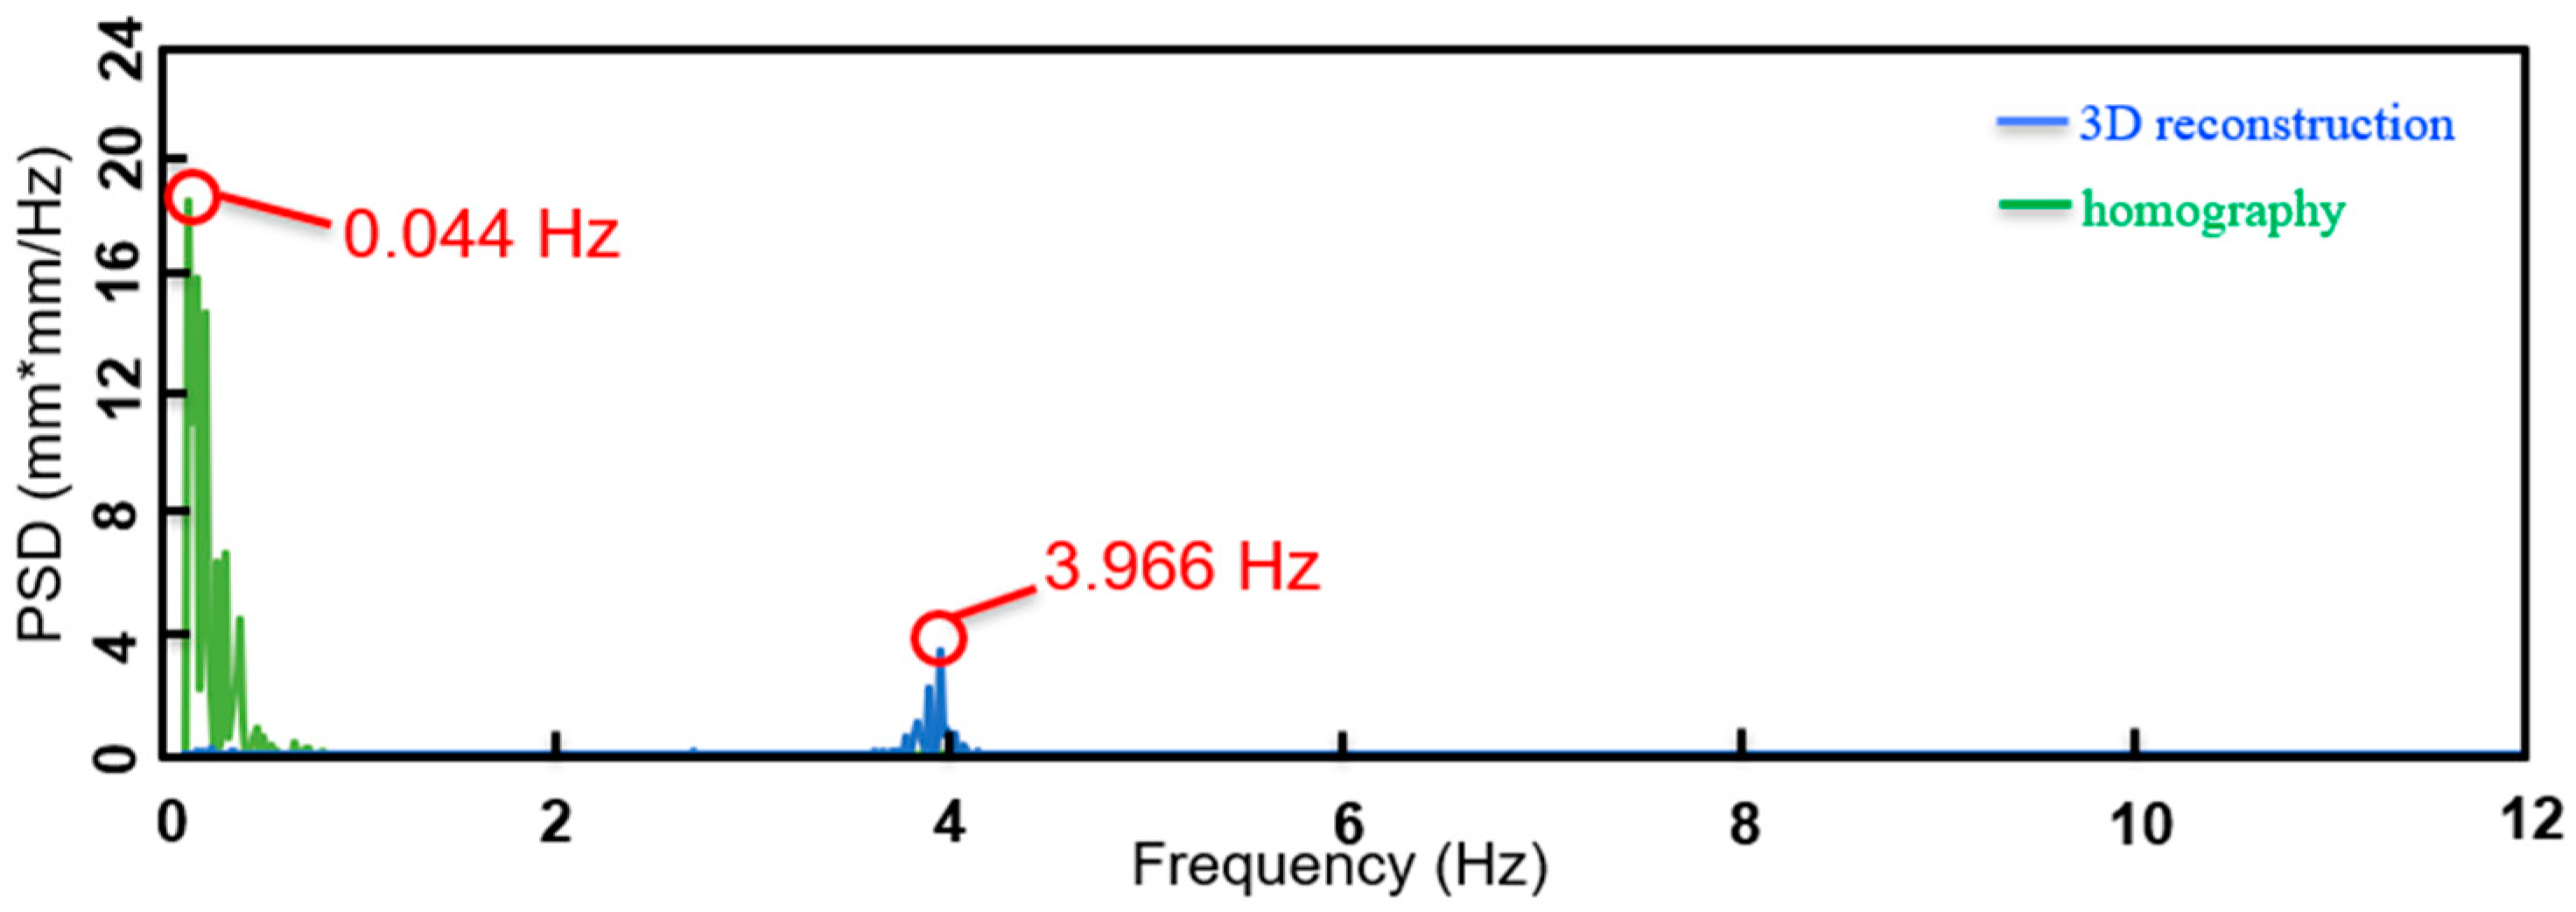
By moving the fixed object 1 m behind the bridge model, the distance between the plane of reference points and the plane of the target point is Z w = 1000 mm. Figure 18 shows the 6 DOF UAV motion in this case. The correction results of the two methods are also compared (Figure 19). In this case, the homography transformation method fails again, while the 3D reconstruction method is still effective. As shown in Figure 20, the obtained first natural frequency by the proposed method is 3.966 Hz, which has a relative error of 0.66% compared to 3.940 Hz, while the one obtained by the homography-based method is 0.044 Hz. Finally, Table 1 shows the frequencies obtained by two methods.

5. Discussion and Conclusions

5.1. Discussion

Our experimental results suggested that the two methods work well in the situation that the reference points are on the same plane as the target points. However, for the situation that the reference points and the target points are in different planes, the homography-based correction method is invalid, while the 3D reconstruction is still feasible. As the plane homography is defined as a projection mapping from one plane to another, the homography matrix calculated from the fixed object plane and image plane cannot be used for the points on the third plane. This is why the homography transformation fails if the fixed object plane is non-coplanar with the bridge model plane.
Although the proposed method shows a promising measurement result, there are still several problems that should be addressed in the future study:
  • For the monocular camera, the value of Z w is assumed to be constant, that is, the out-of-plane displacement ( Z w -direction) is ignored. In some structures with mainly in-plane displacement, the small change of Z w can be ignored. Nevertheless, there will be an obvious error for the structures with large out-of-plane displacement if the change of Z w is ignored. The structure-from-motion (SFM) technique can restore a bridge’s 3D model coordinates [31], including the Zw-direction, by processing high-resolution stereo-photogrammetric photos; it has been used for slow deformation monitoring. An image splitter system, which consisted of four fixed mirrors, is used to mimic four different views by using a single camera with a 45-degree horizontal angle with respect to the target [43]. However, it needs a large splitter and mirror to measure large bridges from a sufficient distance. Using two UAVs combined with a binocular vision principle to measure three-dimensional displacement needs further investigation.
  • The experiment is carried out in a laboratory environment. Its conditions, including light, weather, reference points, etc. are in the ideal state. It is, however, inevitable that some negative factors may occur in the real bridge measurement, for example, difficulty in finding fixed reference objects. An artificial fixed object needs to be deployed under this situation. It is expected that this method can be realized in the real bridge measurement in the near future.
  • In the current algorithm, the theory of planar homography is used to calculate the camera extrinsic matrix R and t. Hence, the four fixed reference points must be on the same plane with fixed-Zw. However, in some measurement circumstances, it is hard to guarantee that all four points are coplanar. Whether or not the reference points can be on different planes needs further study.

5.2. Conclusions

In this paper, we have described a 3D reconstruction correction method for bridge vibration measurement using a UAV. Through the UAV camera calibration, the projection matrix for each frame of images can be estimated, and the actual displacement of the bridge model can be obtained by recovering the 3D world coordinates using the projection matrices. With the development of computer vision theory and UAV technology in the future, the UAV-based method may play an important role in vibration measurement and damage detection of bridges. The above investigation suggested that:
The proposed method can estimate the intrinsic and extrinsic parameters (6 DOF motion) of the UAV camera using Zhang’s method, and then recover the 3D world coordinates of the target points through the projection matrices. The natural frequencies obtained by this method are consistent with the homography-based method. By using a fixed object on the background as the reference, the proposed method can be used to effectively remove the false displacement caused by the UAV motion.
To further confirm the applicability of the proposed approach for bridge vibration measurement, different positions of the fixed object are set up. The experimental results demonstrated that the proposed method is more applicable than the homography-based correction method. In practical measurement, it avoids the limitation that the reference points have to be coplanar with the bridge; they can be artificially arranged in any plane parallel to the bridge surface. Regardless of whether the fixed object is close enough to the bridge, the 3D reconstruction can be carried out as long as the distance between them is known, while the measurement results are more accurate for the short distance between the fixed object and the bridge.

Author Contributions

Conceptualization, G.C. and Q.D.; methodology, Z.W., G.C. and X.Y.; software, Z.W.; validation, Z.W.; Data curation, Z.W.; investigation, Z.W. and G.C.; resources, G.C. and Q.D.; writing—original draft preparation, Z.W.; writing—review and editing, G.C., B.Y. and X.Y.; supervision, G.C. and B.Y. All authors have read and agreed to the published version of the manuscript.

Funding

This research received no external funding.

Institutional Review Board Statement

Not applicable.

Informed Consent Statement

Not applicable.

Data Availability Statement

The data used to support the findings of this study are available from the corresponding author upon request.

Conflicts of Interest

The authors declare no conflict of interest.

References

  1. Zhu, Y.; Ni, Y.-Q.; Jin, H.; Inaudi, D.; Laory, I. A temperature-driven MPCA method for structural anomaly detection. Eng. Struct. 2019, 190, 447–458. [Google Scholar] [CrossRef]
  2. Xu, X.; Ren, Y.; Huang, Q.; Fan, Z.Y.; Tong, Z.J.; Chang, W.J.; Liu, B. Anomaly detection for large span bridges during operational phase using structural health monitoring data. Smart Mater. Struct. 2020, 29, 045029. [Google Scholar] [CrossRef]
  3. Magalhães, F.; Cunha, Á.; Caetano, E. Vibration based structural health monitoring of an arch bridge: From automated OMA to damage detection. Mech. Syst Signal Process. 2012, 28, 212–228. [Google Scholar] [CrossRef]
  4. Fukuda, Y.; Feng, M.; Narita, Y.; Kaneko, S.; Tanaka, T. Vision-based displacement sensor for monitoring dynamic response using robust object search algorithm. IEEE Sens. 2010, 13, 1928–1931. [Google Scholar] [CrossRef] [Green Version]
  5. Xiong, C.; Lu, H.; Zhu, J. Operational Modal Analysis of Bridge Structures with Data from GNSS/Accelerometer Measurements. Sensors 2017, 17, 436. [Google Scholar] [CrossRef] [Green Version]
  6. Li, L.; Ohkubo, T.; Matsumoto, S. Vibration measurement of a steel building with viscoelastic dampers using acceleration sensors. Measurement 2020, 171, 108807. [Google Scholar] [CrossRef]
  7. Kovačič, B.; Kamnik, R.; Štrukelj, A.; Vatin, N. Processing of Signals Produced by Strain Gauges in Testing Measurements of the Bridges. Procedia Eng. 2015, 117, 795–801. [Google Scholar] [CrossRef] [Green Version]
  8. Pan, B.; Qian, K.; Xie, H.; Asundi, A. TOPICAL REVIEW: Two-dimensional digital image correlation for in-plane displacement and strain measurement: A review. Meas. Sci. Technol. 2009, 20, 152–154. [Google Scholar] [CrossRef]
  9. Psimoulis, P.; Pytharouli, S.; Karambalis, D.; Stiros, S. Potential of Global Positioning System (GPS) to measure frequencies of oscillations of engineering structures. J. Sound Vib. 2008, 318, 606–623. [Google Scholar] [CrossRef]
  10. Siringoringo, D.M.; Fujino, Y. Noncontact Operational Modal Analysis of Structural Members by Laser Doppler Vibrometer. Comput. Civ. Infrastruct. Eng. 2009, 24, 249–265. [Google Scholar] [CrossRef]
  11. Yi, T.-H.; Li, H.-N.; Gu, M. Experimental assessment of high-rate GPS receivers for deformation monitoring of bridge. Meas. 2013, 46, 420–432. [Google Scholar] [CrossRef]
  12. Reu, P.L.; Rohe, D.P.; Jacobs, L.D. Comparison of DIC and LDV for practical vibration and modal measurements. Mech. Syst. Signal Process. 2017, 86, 2–16. [Google Scholar] [CrossRef] [Green Version]
  13. Nassif, H.H.; Gindy, M.; Davis, J. Comparison of laser Doppler vibrometer with contact sensors for monitoring bridge deflection and vibration. NDT E Int. 2005, 38, 213–218. [Google Scholar] [CrossRef]
  14. Hyungchul, Y.; Hazem, E.; Hajin, C.; Mani, G.-F.; Spencer, B.F. Target-free approach for vision-based structural system identification using consumer-grade cameras. Struct. Control Health Monit. 2016, 23, 1405–1416. [Google Scholar] [CrossRef]
  15. Lydon, D.; Lydon, M.; Taylor, S.; Del Rincon, J.M.; Hester, D.; Brownjohn, J. Development and field testing of a vision-based displacement system using a low cost wireless action camera. Mech. Syst. Signal Process. 2019, 121, 343–358. [Google Scholar] [CrossRef] [Green Version]
  16. Xu, Y.; Brownjohn, J.M.W. Review of machine-vision based methodologies for displacement measurement in civil structures. J. Civ. Struct. Health Monit. 2018, 8, 91–110. [Google Scholar] [CrossRef] [Green Version]
  17. Vincenzo, F.; Ivan, R.; Angelo, T.; Roberto, R.; Gerardo, D.C. Motion Magnification Analysis for Structural Monitoring of Ancient Constructions. Measurement 2018, 129, 375–380. [Google Scholar] [CrossRef]
  18. Yoneyama, S. Basic principle of digital image correlation for in-plane displacement and strain measurement. Adv. Compos. Mater. 2016, 25, 105–123. [Google Scholar] [CrossRef]
  19. Chu, T.C.; Ranson, W.F.; Sutton, M.A. Applications of digital-image-correlation techniques to experimental mechanics. Exp. Mech. 1985, 25, 232–244. [Google Scholar] [CrossRef]
  20. Schreier, H.; Orteu, J.-J.; Sutton, M.A. Image Correlation for Shape, Motion and Deformation Measurements: Basic Concepts, Theory and Applications; Springer: New York, NY, USA, 2009. [Google Scholar] [CrossRef]
  21. Sousa, P.J.; Barros, F.; Lobo, P.; Tavares, P.; Moreira, P.M. Experimental measurement of bridge deflection using Digital Image Correlation. Procedia Struct. Integr. 2019, 17, 806–811. [Google Scholar] [CrossRef]
  22. Murray, C.; Hoag, A.; Hoult, N.A.; Take, W.A. Field monitoring of a bridge using digital image correlation. Proc. Inst. Civ. Eng. Bridg. Eng. 2015, 168, 3–12. [Google Scholar] [CrossRef]
  23. Busca, G.; Cigada, A.; Mazzoleni, P.; Zappa, E. Vibration Monitoring of Multiple Bridge Points by Means of a Unique Vision-Based Measuring System. Exp. Mech. 2014, 54, 255–271. [Google Scholar] [CrossRef]
  24. Dong, C.-Z.; Celik, O.; Catbas, F.N.; Obrien, E.; Taylor, S. A Robust Vision-Based Method for Displacement Measurement under Adverse Environmental Factors Using Spatio-Temporal Context Learning and Taylor Approximation. Sensors 2019, 19, 3197. [Google Scholar] [CrossRef] [PubMed] [Green Version]
  25. Reagan, D.; Sabato, A.; Niezrecki, C. Feasibility of using digital image correlation for unmanned aerial vehicle structural health monitoring of bridges. Struct. Heal. Monit. 2018, 17, 1056–1072. [Google Scholar] [CrossRef]
  26. Hoskere, V.; Park, J.W.; Yoon, H.; Spencer, B.F., Jr. Vision-Based Modal Survey of Civil Infrastructure Using Unmanned Aerial Vehicles. J. Struct. Eng. 2019, 145, 04019062. [Google Scholar] [CrossRef]
  27. Ellenberg, A.; Kontsos, A.; Moon, F.; Bartoli, I. Bridge related damage quantification using unmanned aerial vehicle imagery. Struct. Control. Health Monit. 2016, 23, 1168–1179. [Google Scholar] [CrossRef]
  28. Kim, H.; Lee, J.; Ahn, E.; Cho, S.; Shin, M.; Sim, S.H. Concrete Crack Identification Using a UAV Incorporating Hybrid Image Processing. Sensors 2017, 17, 2052. [Google Scholar] [CrossRef] [PubMed] [Green Version]
  29. Zink, J.; Lovelace, B. Unmanned Aerial Vehicle Bridge Inspection Demonstration Project. 2015. Available online: https://trid.trb.org/view/1410491 (accessed on 7 June 2016).
  30. Yoon, H.; Shin, J.; Spencer, B.F. Structural Displacement Measurement Using an Unmanned Aerial System. Comput. Civ. Infrastruct. Eng. 2018, 33, 183–192. [Google Scholar] [CrossRef]
  31. Roselli, I.; Malena, M.; Mongelli, M.; Cavalagli, N.; Gioffrè, M.; De Canio, G.; De Felice, G. Health assessment and ambient vibration testing of the “Ponte delle Torri” of Spoleto during the 2016–2017 Central Italy seismic sequence. J. Civ. Struct. Heal. Monit. 2018, 8, 199–216. [Google Scholar] [CrossRef]
  32. Chen, G.; Liang, Q.; Zhong, W.; Gao, X.; Cui, F. Homography-based measurement of bridge vibration using UAV and DIC method. Meas 2021, 170, 108683. [Google Scholar] [CrossRef]
  33. Ribeiro, D.; Santos, R.; Cabral, R.; Saramago, G.; Montenegro, P.; Carvalho, H.; Correia, J.; Calçada, R. Calçada Non-contact structural displacement measurement using Unmanned Aerial Vehicles and video-based systems. Mech. Syst. Signal Process 2021, 160, 107869. [Google Scholar] [CrossRef]
  34. Hartley, R.; Zisserman, A. Multiple View Geometry in Computer Vision, 2nd ed.; Cambridge University Press: New York, NY, USA, 2003. [Google Scholar]
  35. Yoneyama, S.; Ueda, H. Bridge Deflection Measurement Using Digital Image Correlation with Camera Movement Correction. Mater. Trans. 2012, 53, 285–290. [Google Scholar] [CrossRef] [Green Version]
  36. Zhai, Y.; Shah, M. Visual attention detection in video sequences using spatiotemporal cues. In Proceedings of the 14th annual ACM International Conference on Multimedia-MULTIMEDIA ’06, Barbara, CA, USA, 21–25 October 2006; pp. 815–824. [Google Scholar]
  37. Chen, G.; Wu, Z.; Gong, C.; Zhang, J.; Sun, X. DIC-Based Operational Modal Analysis of Bridges. Adv. Civ. Eng. 2021, 2021, 6694790. [Google Scholar] [CrossRef]
  38. Zhang, Z. A flexible new technique for camera calibration. IEEE Trans. Pattern Anal. Mach. Intell. 2000, 22, 1330–1334. [Google Scholar] [CrossRef] [Green Version]
  39. Sutton, M.; Mingqi, C.; Peters, W.; Chao, Y.; McNeill, S. Application of an optimized digital correlation method to planar deformation analysis. Image Vis. Comput. 1986, 4, 143–150. [Google Scholar] [CrossRef]
  40. Devriendt, C.; Guillaume, P. The use of transmissibility measurements in output-only modal analysis. Mech. Syst. Signal Process. 2007, 21, 2689–2696. [Google Scholar] [CrossRef]
  41. Yan, W.-J.; Ren, W.-X. Operational Modal Parameter Identification from Power Spectrum Density Transmissibility. Comput. Civ. Infrastruct. Eng. 2011, 27, 202–217. [Google Scholar] [CrossRef]
  42. Brincker, R.; Zhang, L.; Andersen, P. Modal identification of output-only systems using frequency domain decomposition. Smart Mater. Struct. 2001, 10, 441–445. [Google Scholar] [CrossRef] [Green Version]
  43. Yunus, E.H.; Utku, G.; Markus, H.; Eleni, C. A Novel Approach for 3D-Structural Identification through Video Recording: Magnified Tracking. Sensors 2019, 19, 1229. [Google Scholar] [CrossRef] [Green Version]
Figure 1. Flowchart of the work.
Applsci 11 05111 g001
Figure 2. Moving points tracked by DIC.
Applsci 11 05111 g002
Figure 3. Homography transformation between frames.
Applsci 11 05111 g003
Figure 4. Extrinsic parameters of each frame.
Applsci 11 05111 g004
Figure 5. (a) Bridge model; (b) Model components.
Applsci 11 05111 g005
Figure 6. (a) DJI-Spark UAV; (b) fixed reference object.
Applsci 11 05111 g006
Figure 7. Measurement points.
Applsci 11 05111 g007
Figure 8. World coordinate system.
Applsci 11 05111 g008
Figure 9. Positions of the fixed object: (a) Zw = 0 m; (b) Zw = 1 m; (c) Zw = −1 m.
Applsci 11 05111 g009
Figure 10. Six degrees of freedom motion of the UAV (Zw = 0).
Applsci 11 05111 g010
Figure 11. Displacement of the reference point before and after correction.
Applsci 11 05111 g011
Figure 12. Displacement of the target point before and after correction.
Applsci 11 05111 g012
Figure 13. Comparison of PSD from 3D reconstruction and homography methods (Zw = 0).
Applsci 11 05111 g013
Figure 14. Comparison of displacement corrected by 3D reconstruction and homography methods (Zw = 0).
Applsci 11 05111 g014
Figure 15. Six degrees of freedom motion of the UAV (Zw = 1000).
Applsci 11 05111 g015
Figure 16. Comparison of displacement corrected by 3D reconstruction and homography methods (Zw = 1000).
Applsci 11 05111 g016
Figure 17. Comparison of PSD from 3D reconstruction and homography methods (Zw = 1000).
Applsci 11 05111 g017
Figure 18. Six degrees of freedom motion of the UAV (Zw = −1000).
Applsci 11 05111 g018
Figure 19. Comparison of displacement corrected by 3D reconstruction and homography methods (Zw = −1000).
Applsci 11 05111 g019
Figure 20. Comparison of PSD from 3D reconstruction and homography methods (Zw = −1000).
Applsci 11 05111 g020
Table 1. Frequencies obtained by two methods.
Zw (m)Homography3D ReconstructionHomography3D Reconstruction
Frequency (Hz)Frequency (Hz)Relative Error (%)Relative Error (%)
03.9403.94000
10.1033.92797.40.33
−10.0443.96698.90.66
Publisher’s Note: MDPI stays neutral with regard to jurisdictional claims in published maps and institutional affiliations.