1. Introduction
In the field of architecture, evidence-based design (EBD) is defined as the process of basing design decisions about the built environment on credible research and learning from previous evidence to achieve the best possible outcomes [
1,
2]. One of the easiest, quickest, and inexpensive methods to provide evidence for predicting or evaluating values in a built environment is using computational modeling. In a framework for evaluating evidence in EBD developed by Pati [
3], computer simulation is categorized under ‘experiment level’, which confirms the application of simulation for providing evidence. For example, in the study by Jakubiec and Reinhart [
4], simulation tools were used for the prediction of occupants’ visual comfort within daylit environments. The results illustrated that it is possible to use current simulation-based visual comfort predictions to predict occupants’ long-term visual comfort assessments in a complex daylit space.
Investigation regarding the application of simulation tools in the EBD process is ongoing [
5,
6,
7,
8,
9]. A conceptual framework was developed to integrate the use of lighting simulation within the EBD process in a systematic way: the EBD-SIM framework [
6]. The study concluded that the translation between the user evaluation and the simulation-based evaluation was a critical step in the integration of lighting simulation with EBD. Therefore, an initial validation study [
7] was dedicated to a first application of the EBD-SIM framework in a post-occupancy evaluation (POE) step.
POE is defined as ‘the process of evaluating buildings in a systematic and rigorous manner after they have been built and occupied for some time’ [
10] (p.3). POE’s purpose and methodology are varied, often depending on the type of building. For example, POEs of office buildings are, in most cases, interested in occupants’ comfort and productivity, utilizing both subjective and objective evaluations of indoor environmental quality (IEQ) [
11]. The recent literature review conducted by Dam-Krogh et al. [
12] investigated methods applied in previously performed POEs in office buildings with special attention to IEQ and productivity to compare and evaluate successful practices of POEs in office buildings. In more specific and recent POE studies, lighting quality of office buildings was investigated by [
13,
14,
15,
16,
17]. These studies were concerned with obtaining better insight on occupant satisfaction and acceptance about daylighting by conducting POEs while using photosensors, shading, and/or control systems. This is a key factor for proper lighting design by utilizing daylighting without neglecting human comfort and achieving responsive buildings. Having more information available about occupants’ behaviors, needs, and preferences enables architects to design better responsive elements of a building for optimal rates, scales, and types of changes.
While POEs are popular tools for the evaluation of different aspects of building from the occupant’s point of view, most POEs are one-off studies [
11]. Additionally, using POEs in a framework of EBD is not studied well (yet). One attempt to strengthen the EBD knowledge base by developing standardized POE tools was conducted by [
18]. In this study, based on a review of over 100 research publications, a conceptual framework and a set of standard tools were established to comprehensively evaluate building performance in terms of eight key design areas, including air quality, visual environment, thermal comfort, acoustic environment, hazardous materials, conservation of resources, overall climate response, and building envelope (façade).
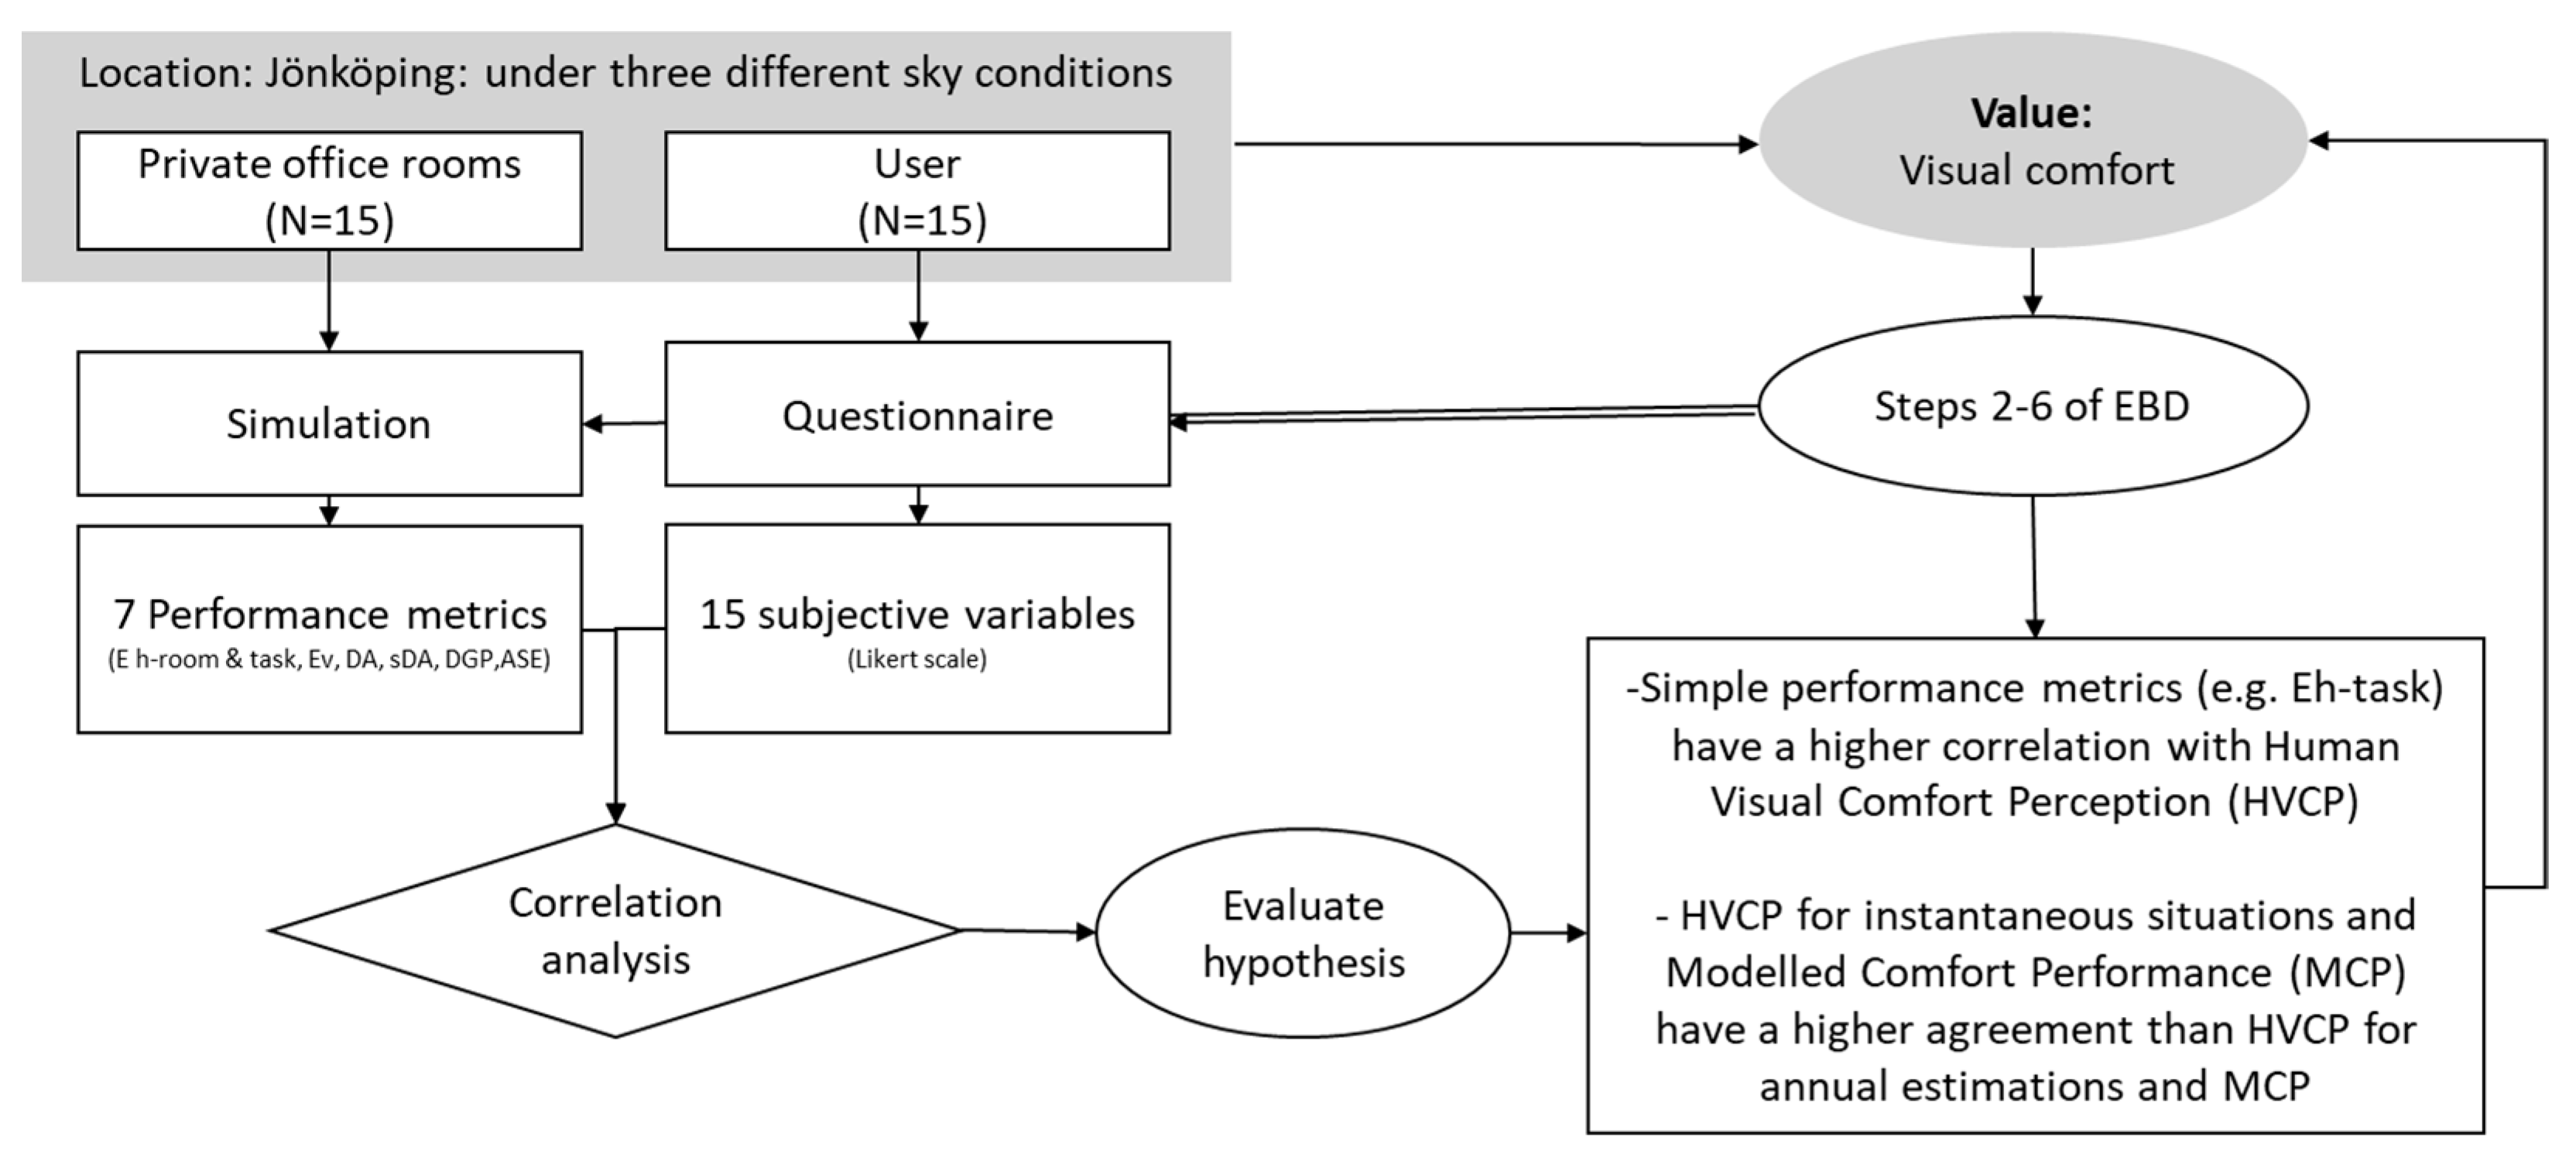
A real-time case study in a fully operational office building was conducted to analyze visual comfort from a subjective (‘the user’) and an objective (‘the simulation’) point of view to provide a systematic performance evaluation using the EBD-SIM framework [
7]. It covered both long-term and short-term evaluations of the light environment. The results showed that, although illuminance preference varies significantly among individuals, there was a positive correlation between the overall lighting quality perceived by the occupants and the amount of light on the task area. Regarding performance metrics, the results showed the highest correlation with point-in-time horizontal illuminance (E
h), especially on the task area (E
h-task) and human perception. The implementation of the study results in the EBD-SIM process model is schematically illustrated in
Figure 1.
The initial validation study [
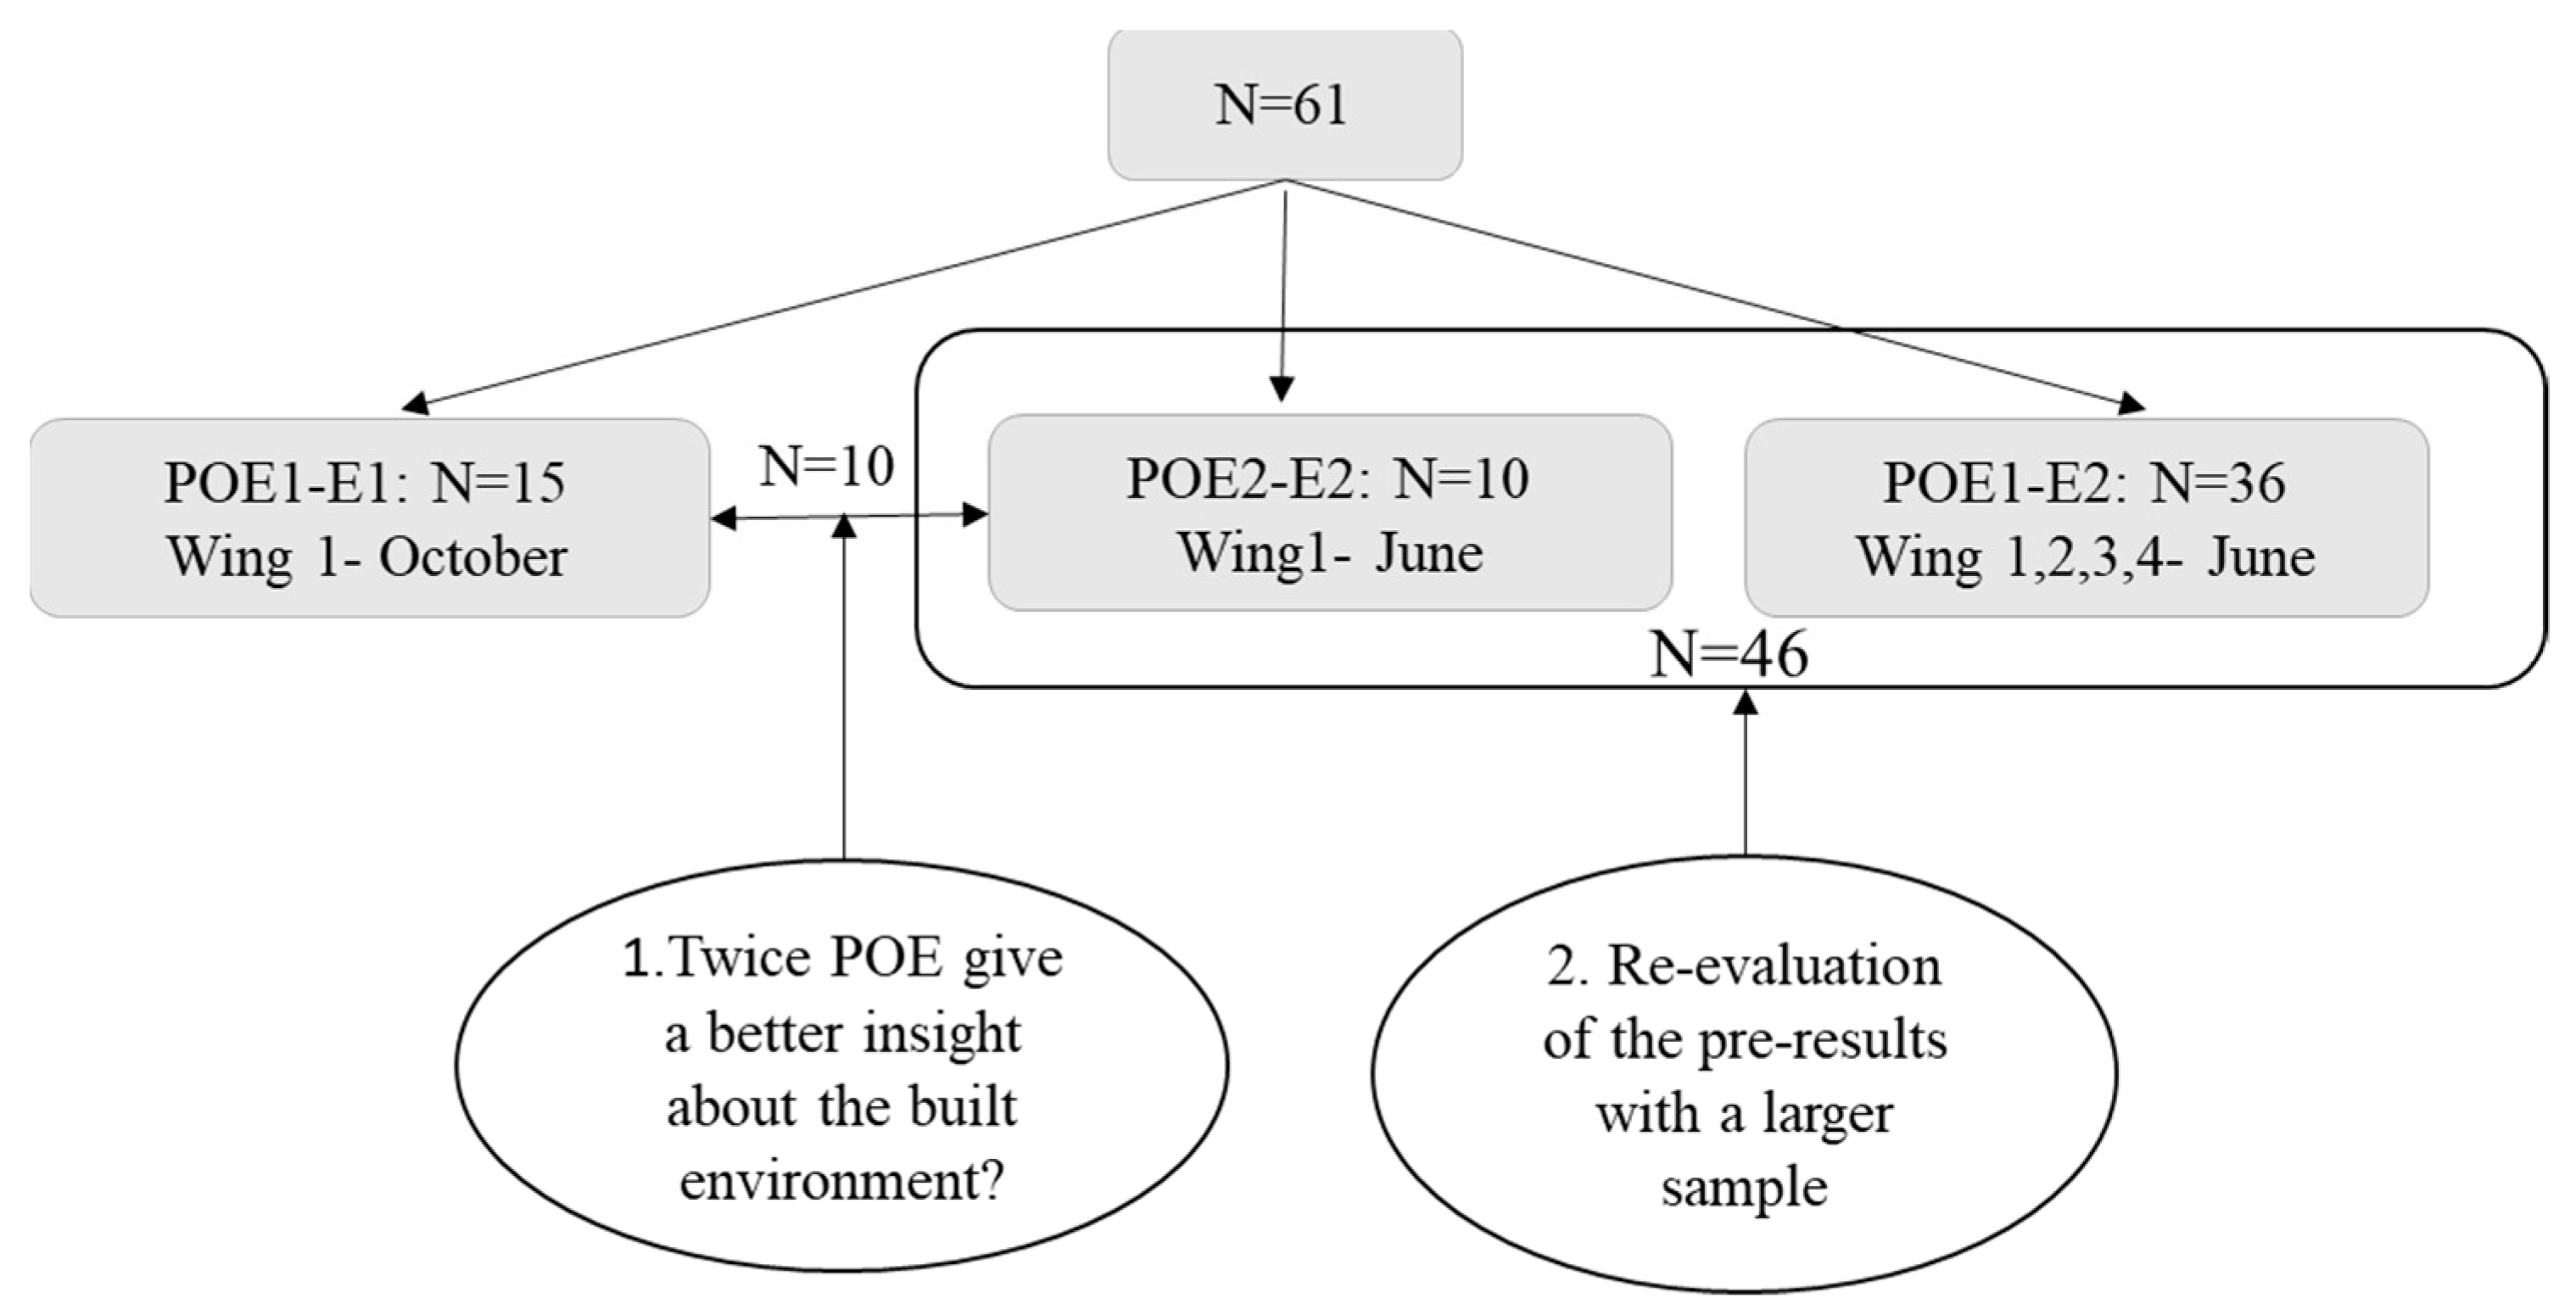
7] suggested that a POE should be conducted more frequently to obtain a better insight into user perception of daylight and, subsequently, the use of the new evidence to improve the design of the EBD-SIM model further. Therefore, the field study was repeated to perform a POE for a second time, including the same participants but at a different time of year to investigate the possible improvement in the reliability of a POE study (within-subjects study [
19]). In addition, a larger sample with a similar procedure was selected in which users experienced only one condition each (between-subject-study [
19]) to investigate if previous findings are confirmed with a larger sample or that results are just a coincidence and more detailed simulation of the actual/intended use of a space is required to forecast the visual comfort.
Even though a long-term goal is to show how the EBD-SIM framework can be used to incrementally develop evidence through several projects, the research questions for this project were as follows:
How do the most frequently used visual comfort metrics correlate with perceived occupant visual comfort?
To what extent do instantaneous and annual human visual comfort perceptions correlate with simulated comfort assessment?
How much would the usefulness of a POE improve if its frequency were increased?
Note that the first two questions are repeated from the preceding study [
7], though with a larger sample. The most frequently used visual comfort metrics were identified based on the state-of-the-art literature review conducted by [
7].
The third question was added specifically for the follow-up POE study.
3. Results
In this section, the objective, subjective, and correlation analysis of the follow-up POE study for ten participants who filled out the questionnaire two times during early October and June as well as the larger sample (N = 46) who filled out the questionnaire only once in June is reported.
3.1. Within-Subject Analysis (Follow-Up POE Investigation)
3.1.1. Objective Comparison
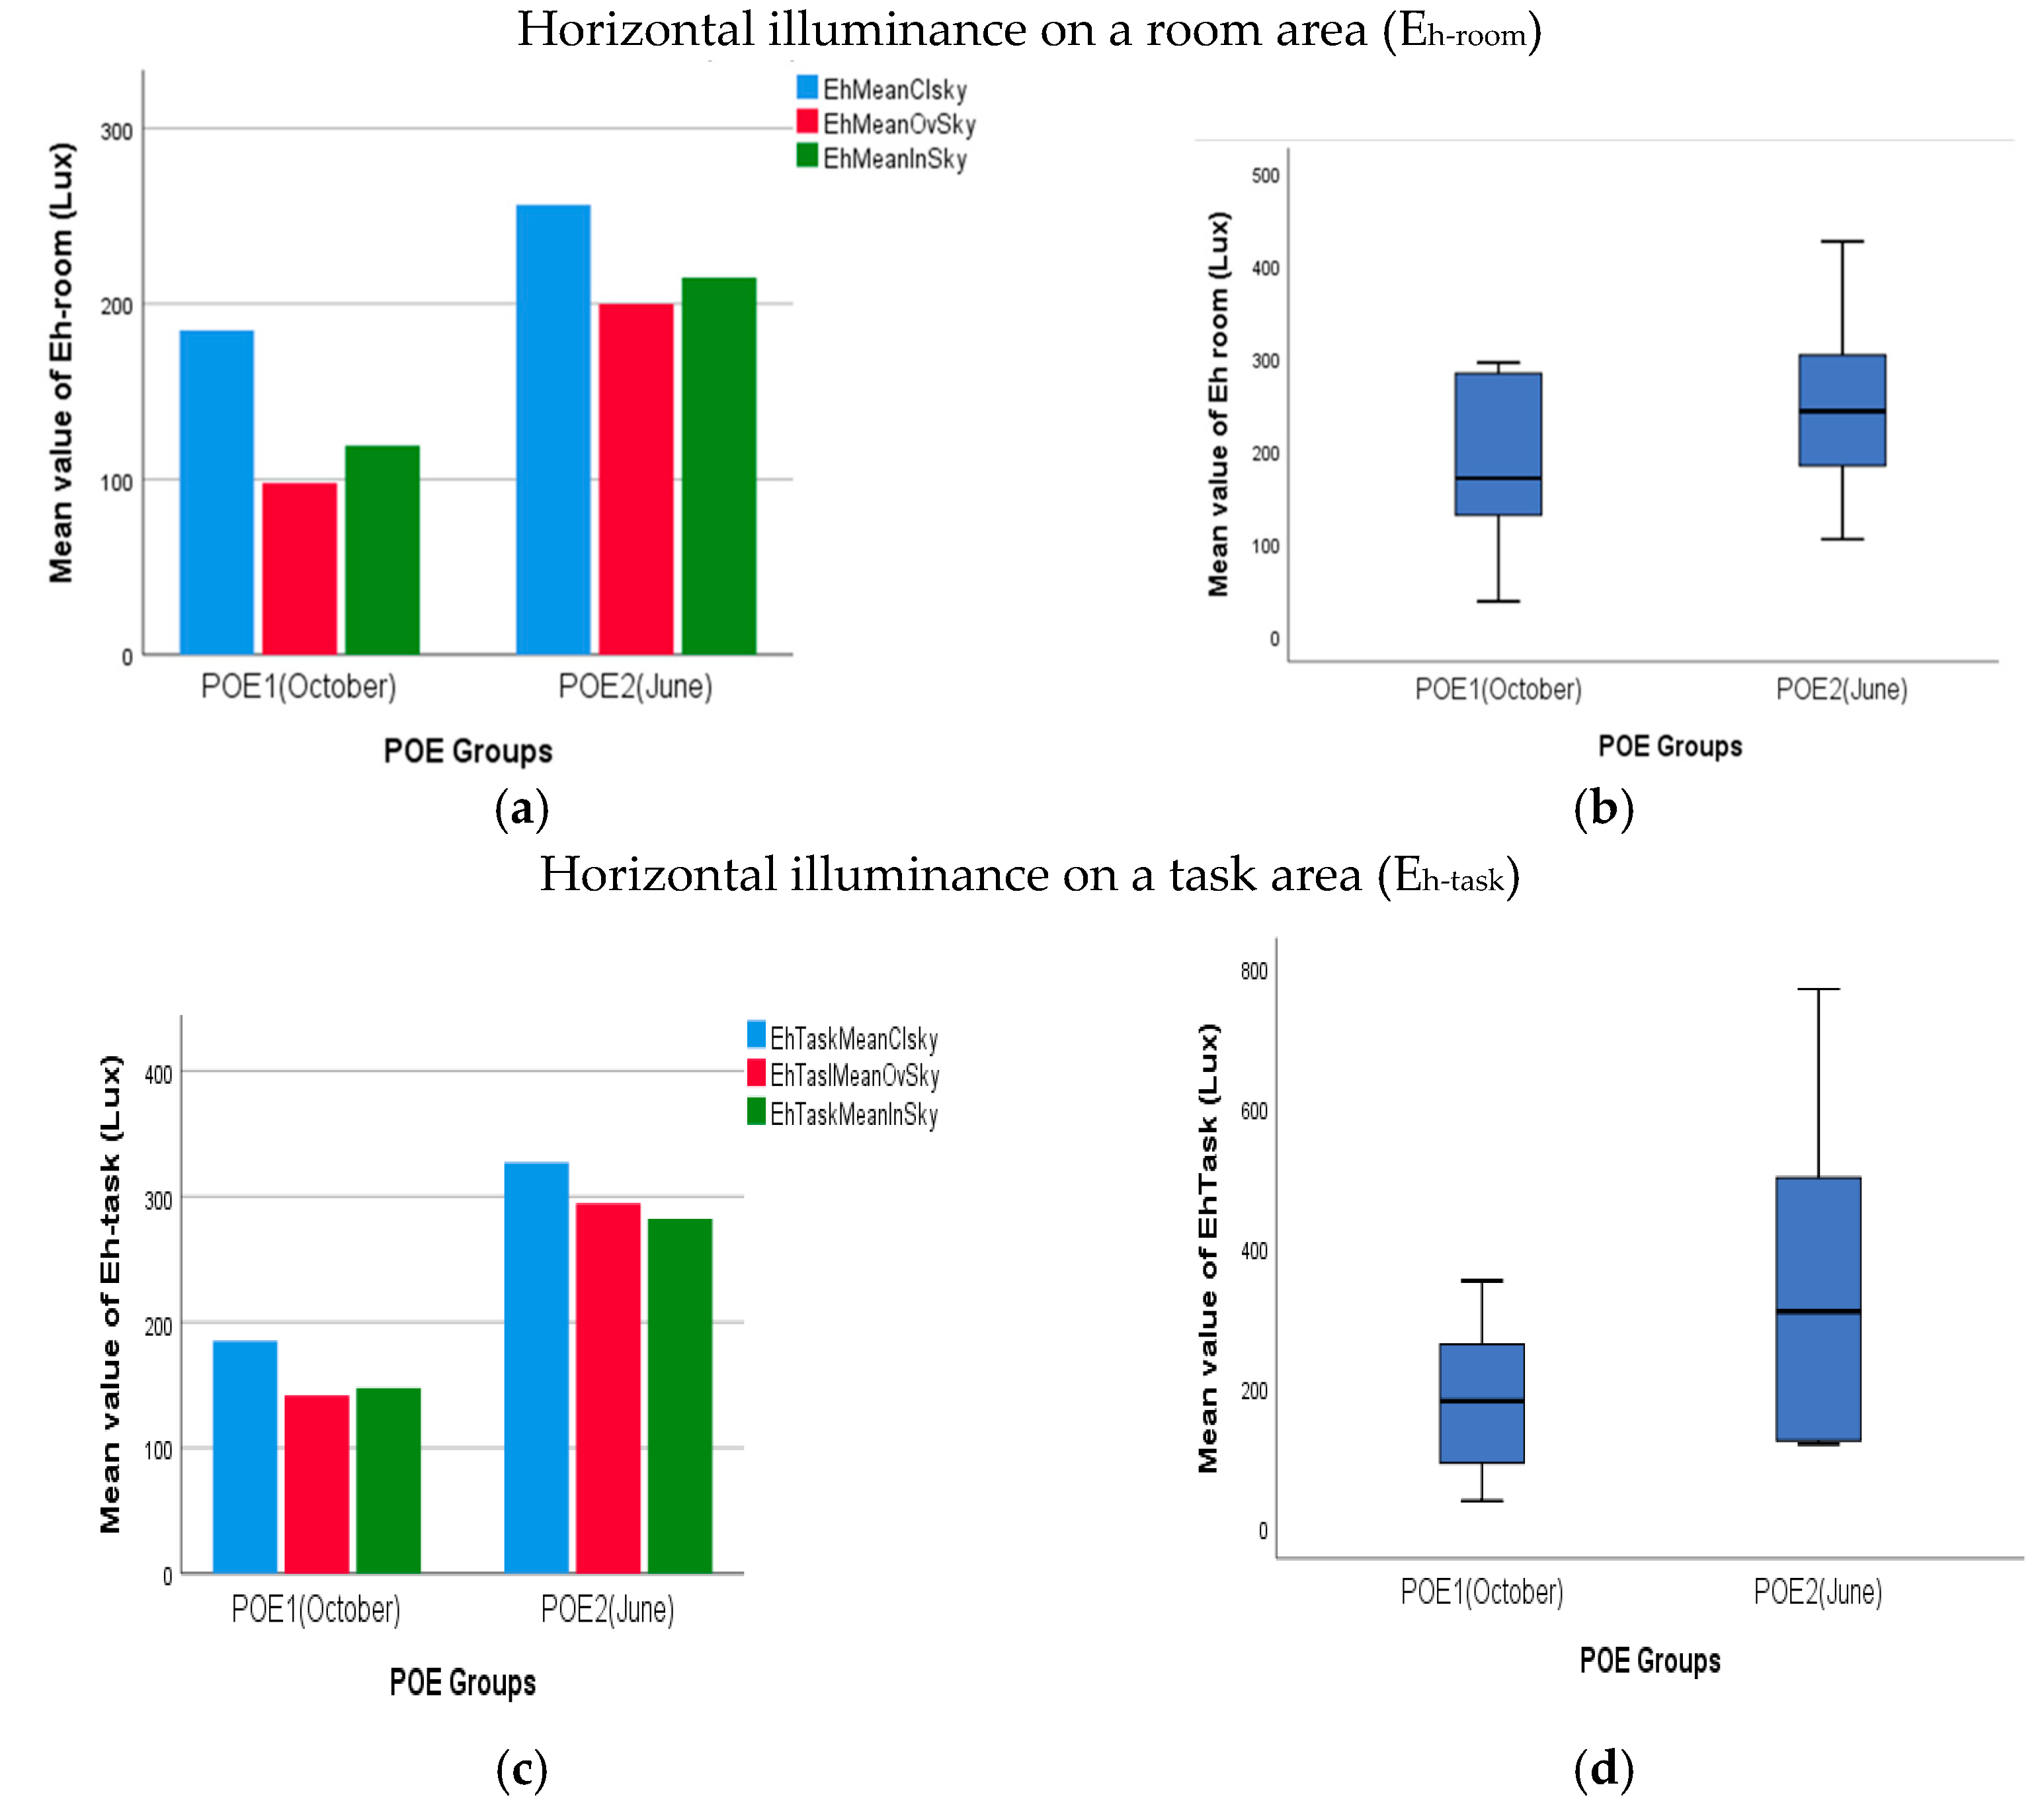
Horizontal illuminance on a room area (E
h-room)—The overview of the results for the mean value of horizontal illuminance E
h-room of the calculated sensor points of the ten rooms’ areas at the work plane height is shown in
Figure 4a,b. Where the mean E
h-room values in October were below 200 lux for all sky conditions, the amount of daylight increased, as expected, during the second POE in June. On average, the rooms received 200 lux or more horizontal illuminance during June. Since the participants mostly worked under the clear sky condition, more details of the results for the clear sky condition are illustrated in the right image.
Horizontal illuminance on a task area (E
h-task)—Based on the position of the desk area in each room, the mean horizontal illuminance received on task area E
h-task was calculated. As presented in
Figure 4c,d, on average, the amount of daylight received at the task area in June was approximately 100 lux higher compared to October. Under the clear sly condition, the areas received, on average, 300 lux with a variation between 100 and 800 lux (see
Figure 4d).
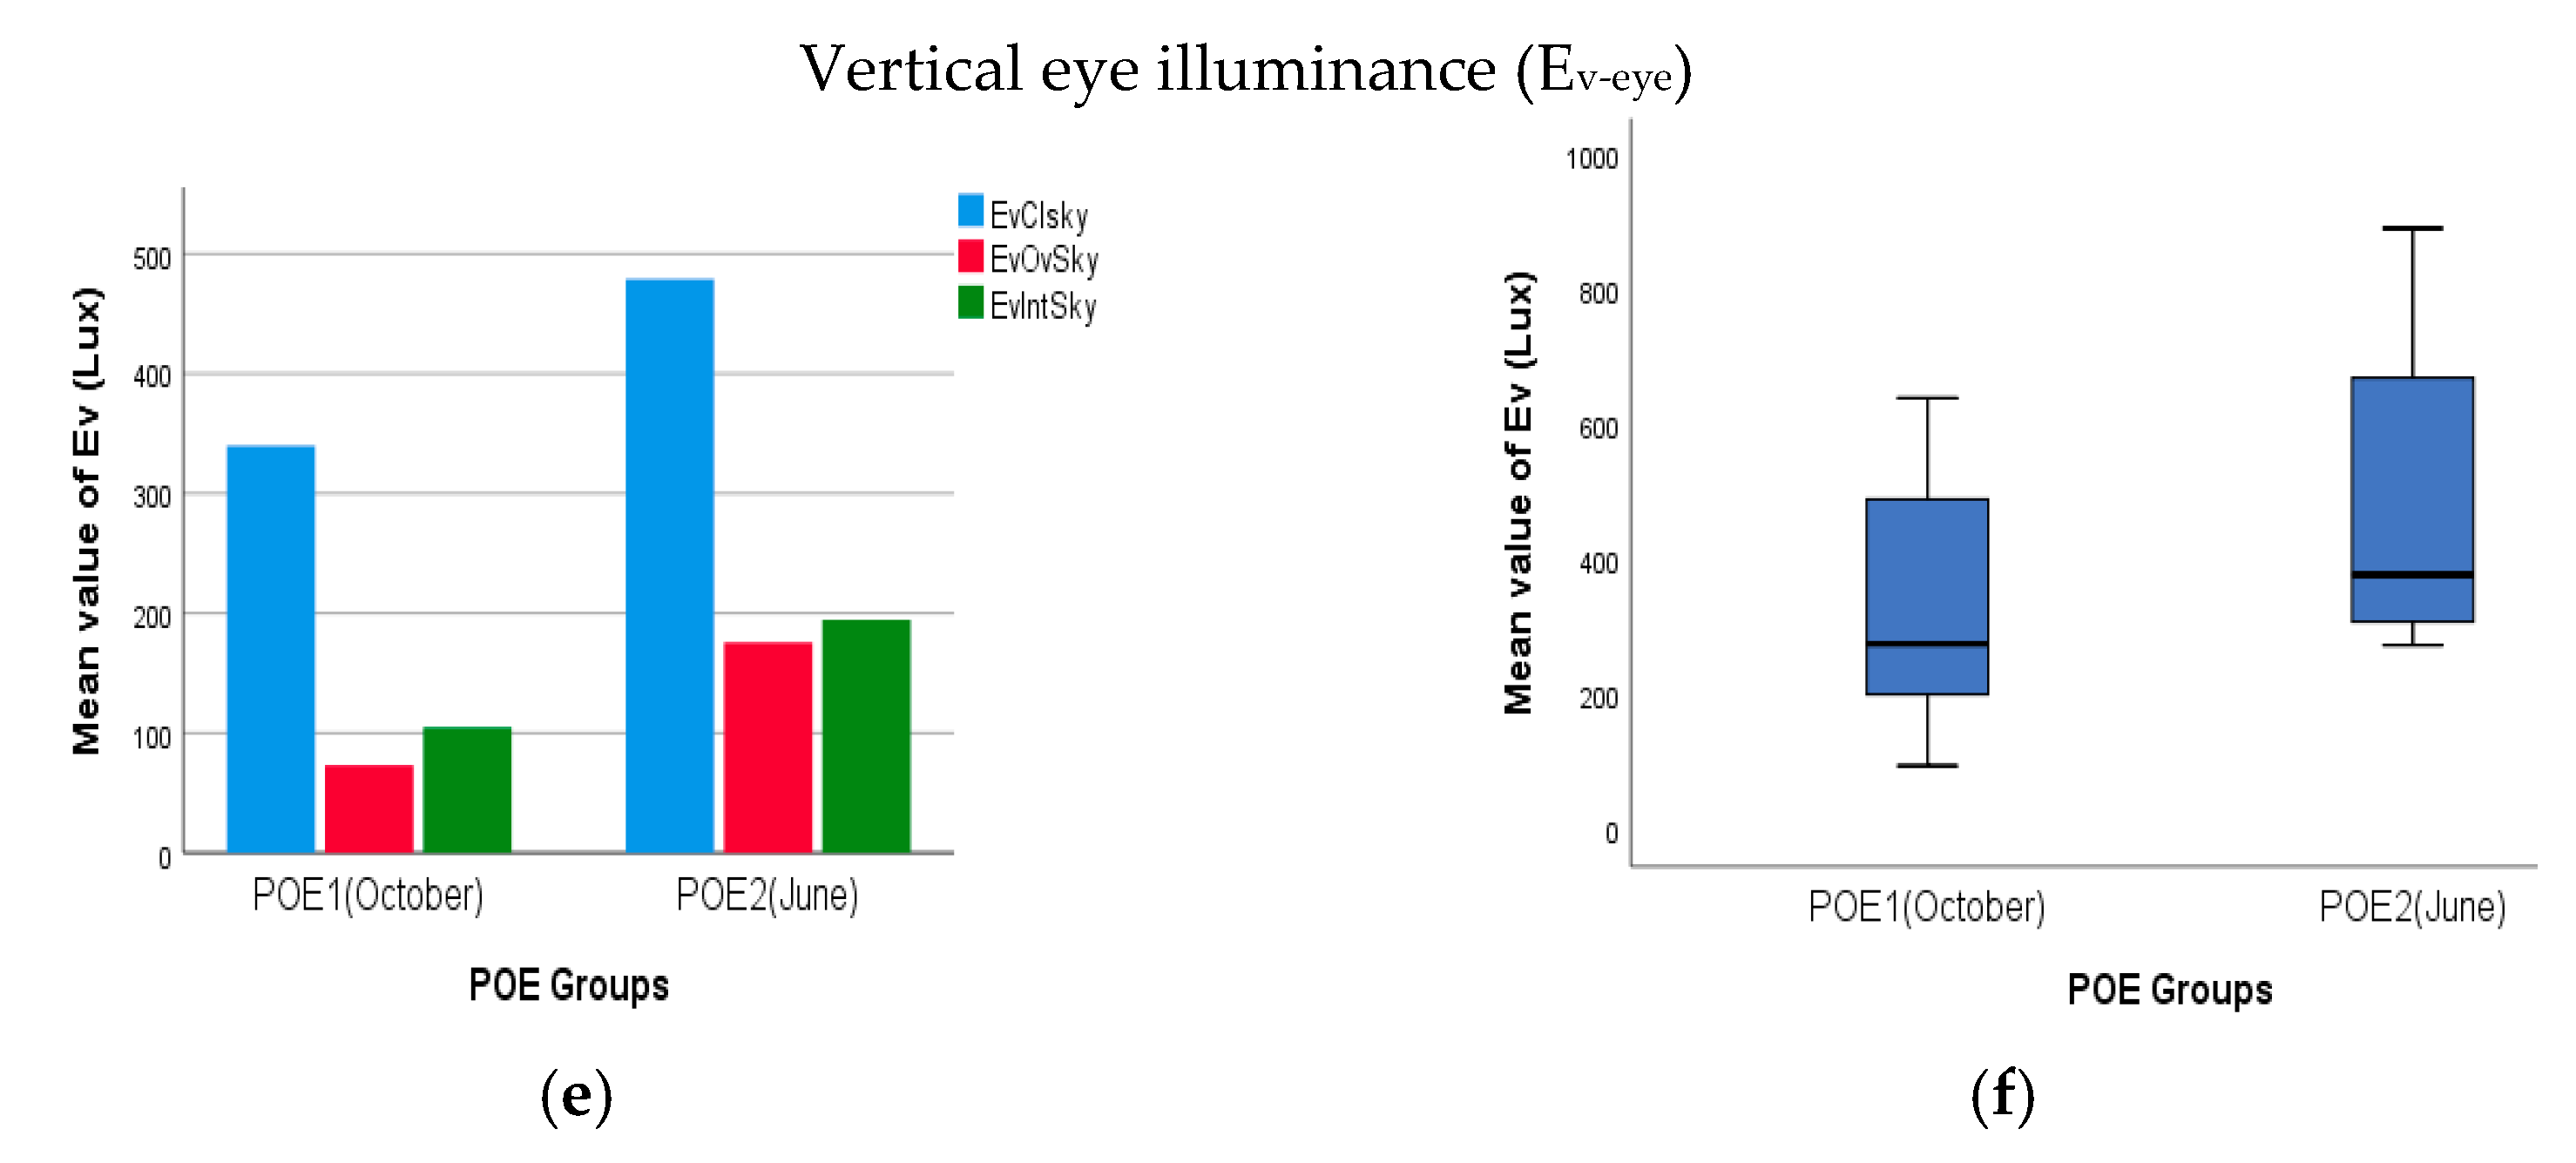
Vertical eye illuminance (E
v-eye)—Vertical eye illuminance E
v-eye was calculated at the center point of each room with a viewing direction towards the daylight opening. The results of E
v-eye under three different sky conditions are illustrated in
Figure 4e.
Daylight Autonomy (DA) and Spatial Daylight Autonomy (sDA)—The highest value for DA was found for the rooms on the second floor, with an average of 44 ± 8%. The rooms on the third floor at the north-east side had DA values around 29 ± 3%, and the south-west side had the lowest DA values around 2 ± 0.3%. sDA values of all rooms were lower than 50% of the space area.
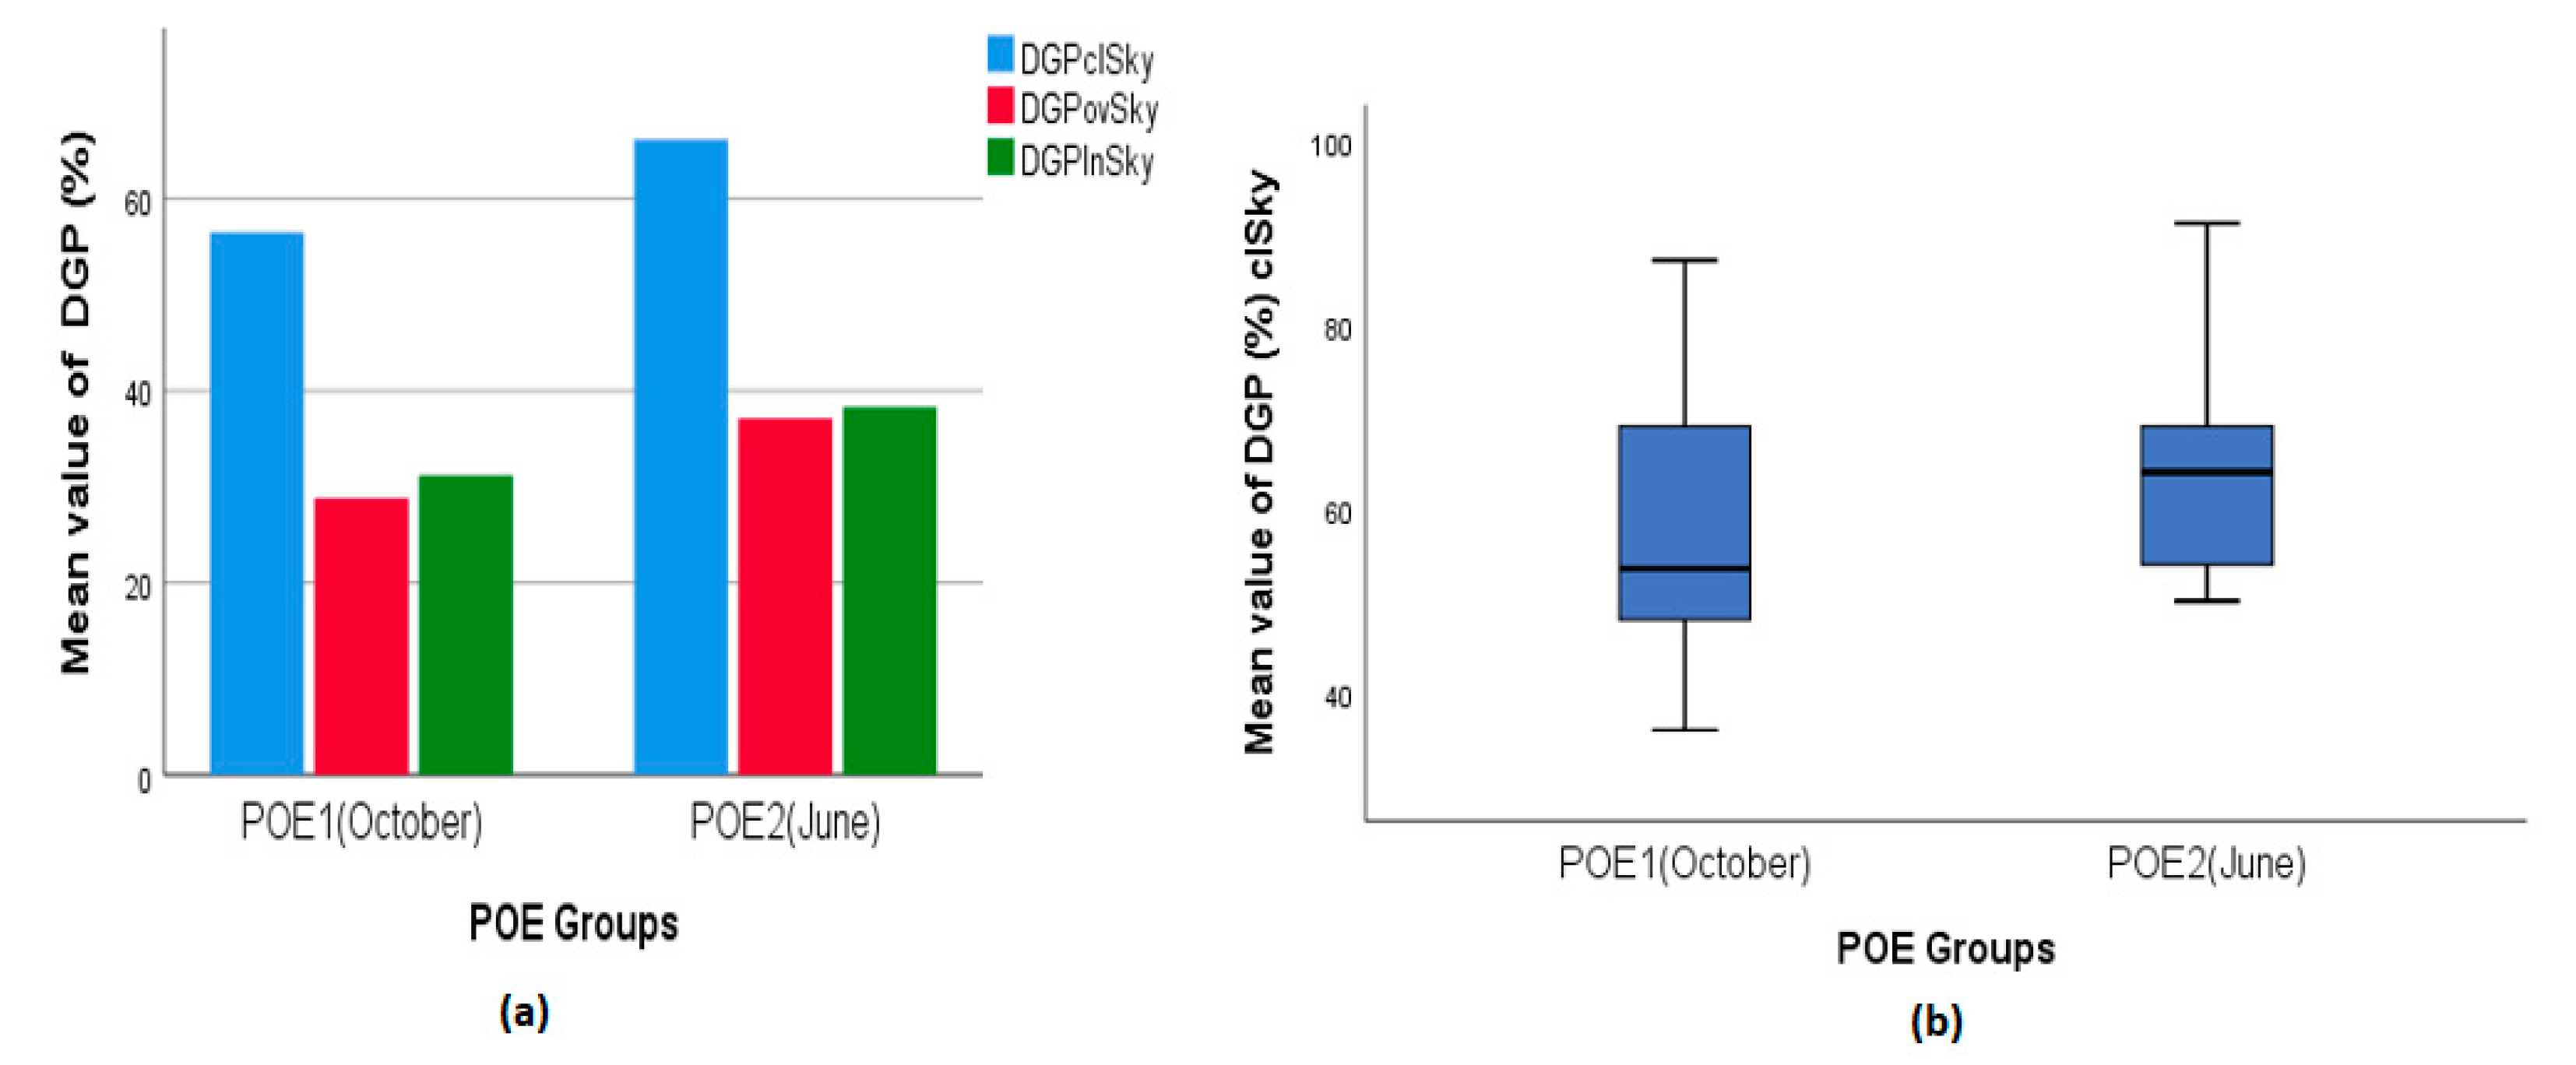
Daylight Glare Probability (DGP)—The center point of each room with a direction towards windows was elected for DGP analysis. The results of this analysis show that, under the ‘clear’ sky condition, DGP values were in the range of intolerable glare (DGP > 0.45) for 70% of the rooms in October and for all the rooms in June. Under ‘overcast’ and ‘intermediate’ sky conditions, DGP values were below the ‘imperceptible’ level (DGP < 0.35) in October and at the ‘perceptible’ level (0.40 < DGP < 0.35) in June. The mean DGP values for the rooms under the three sky conditions are presented in
Figure 5. The variations in DGP values under the clear sky condition are presented in the right image.
Annual Sunlight Exposure (ASE)—For all rooms, less than 10% of the areas had an illuminance value higher than 1000 lux/250 h per year, which means that, according to the LEED certification, the rooms are categorized as ‘a room with not too much direct sunlight during the year’ [
23].
3.1.2. Subjective Comparison
Descriptive statistics—Descriptive statistics analysis for all 15 satisfaction variables shows that the mean values of all variables except ‘Glare sun’ (satisfaction with glare from the sun at the moment) and ‘A-artificial’ (annual satisfaction with artificial lighting) were a bit lower for the second POE in June compared to October. On average, for the satisfaction values, the change was 0.4 points. This means people were more satisfied with the built environment in general in June (1 = very satisfactory, 7 = very unsatisfactory). Similarly, in October, the highest satisfaction belonged to ‘satisfaction with the job’, which increased slightly in June. Then, ‘satisfaction with daylight’ (both ‘annually’ and ‘at the moment’) had the highest satisfaction rate in June (
M = 2.3,
SD = 1.5). Satisfaction with daylight ‘at the moment’ with a 1.8 point improvement from October shows the highest increase in satisfaction. The least satisfaction in June belonged to artificial light (
M = 3.5,
SD = 1.58). See
Table 6 for more details on other variables.
Paired samples t-test—To determine whether there is statistical evidence that the mean difference between paired observations on a particular outcome is significantly different from zero, a paired sample t-test was run for ten participants who filled out the questionnaire two times during early October and June. The results show that, although the mean satisfaction values are increased from October to June for almost all variables, a significant difference was only found in scores for natural light from October to June (sig = 0.016, M = 1.80, SD = 1.93). In addition, a marginally significant difference was found for ‘A-Glare sun’ (sig = 0.052, M = 0.50 SD = 0.71) and ‘Light desk’ (sig = 0.053, M = 0.80 SD = 1.13).
Correlation analysis—The results show that there were ‘very strong’ (0.8 < r < 1) to ‘strong’ (0.6 < r < 0.79) degrees of correlations for all the variables between annual and at the moment evaluations except for ‘Natural light’ in October. In June (N = 10), the highest correlation was found for ‘Glare sunlight’ (0.95, p < 0.01) and ‘Glare artificial light’ (0.92, p < 0.01). This means that participants either perceived glare as similar all year round or found it hard to recall the difference between glare at the moment and annually.
3.2. Between-Subjects Analysis
All participants who responded to the survey in June (
N = 46) worked in individual office rooms. These rooms are located on the second, third, and fourth floors of the building’s four wings. Based on the location of the window, these rooms are categorized into four groups which are presented in
Table 7.
There are three rooms at the north-east side and one room at the south-west side with two windows on the same side. Five rooms at the south-east side have a second window at the south-west side. These rooms are highlighted in parenthesis in
Table 7.
3.2.1. Objective Evaluation Using Light Simulation
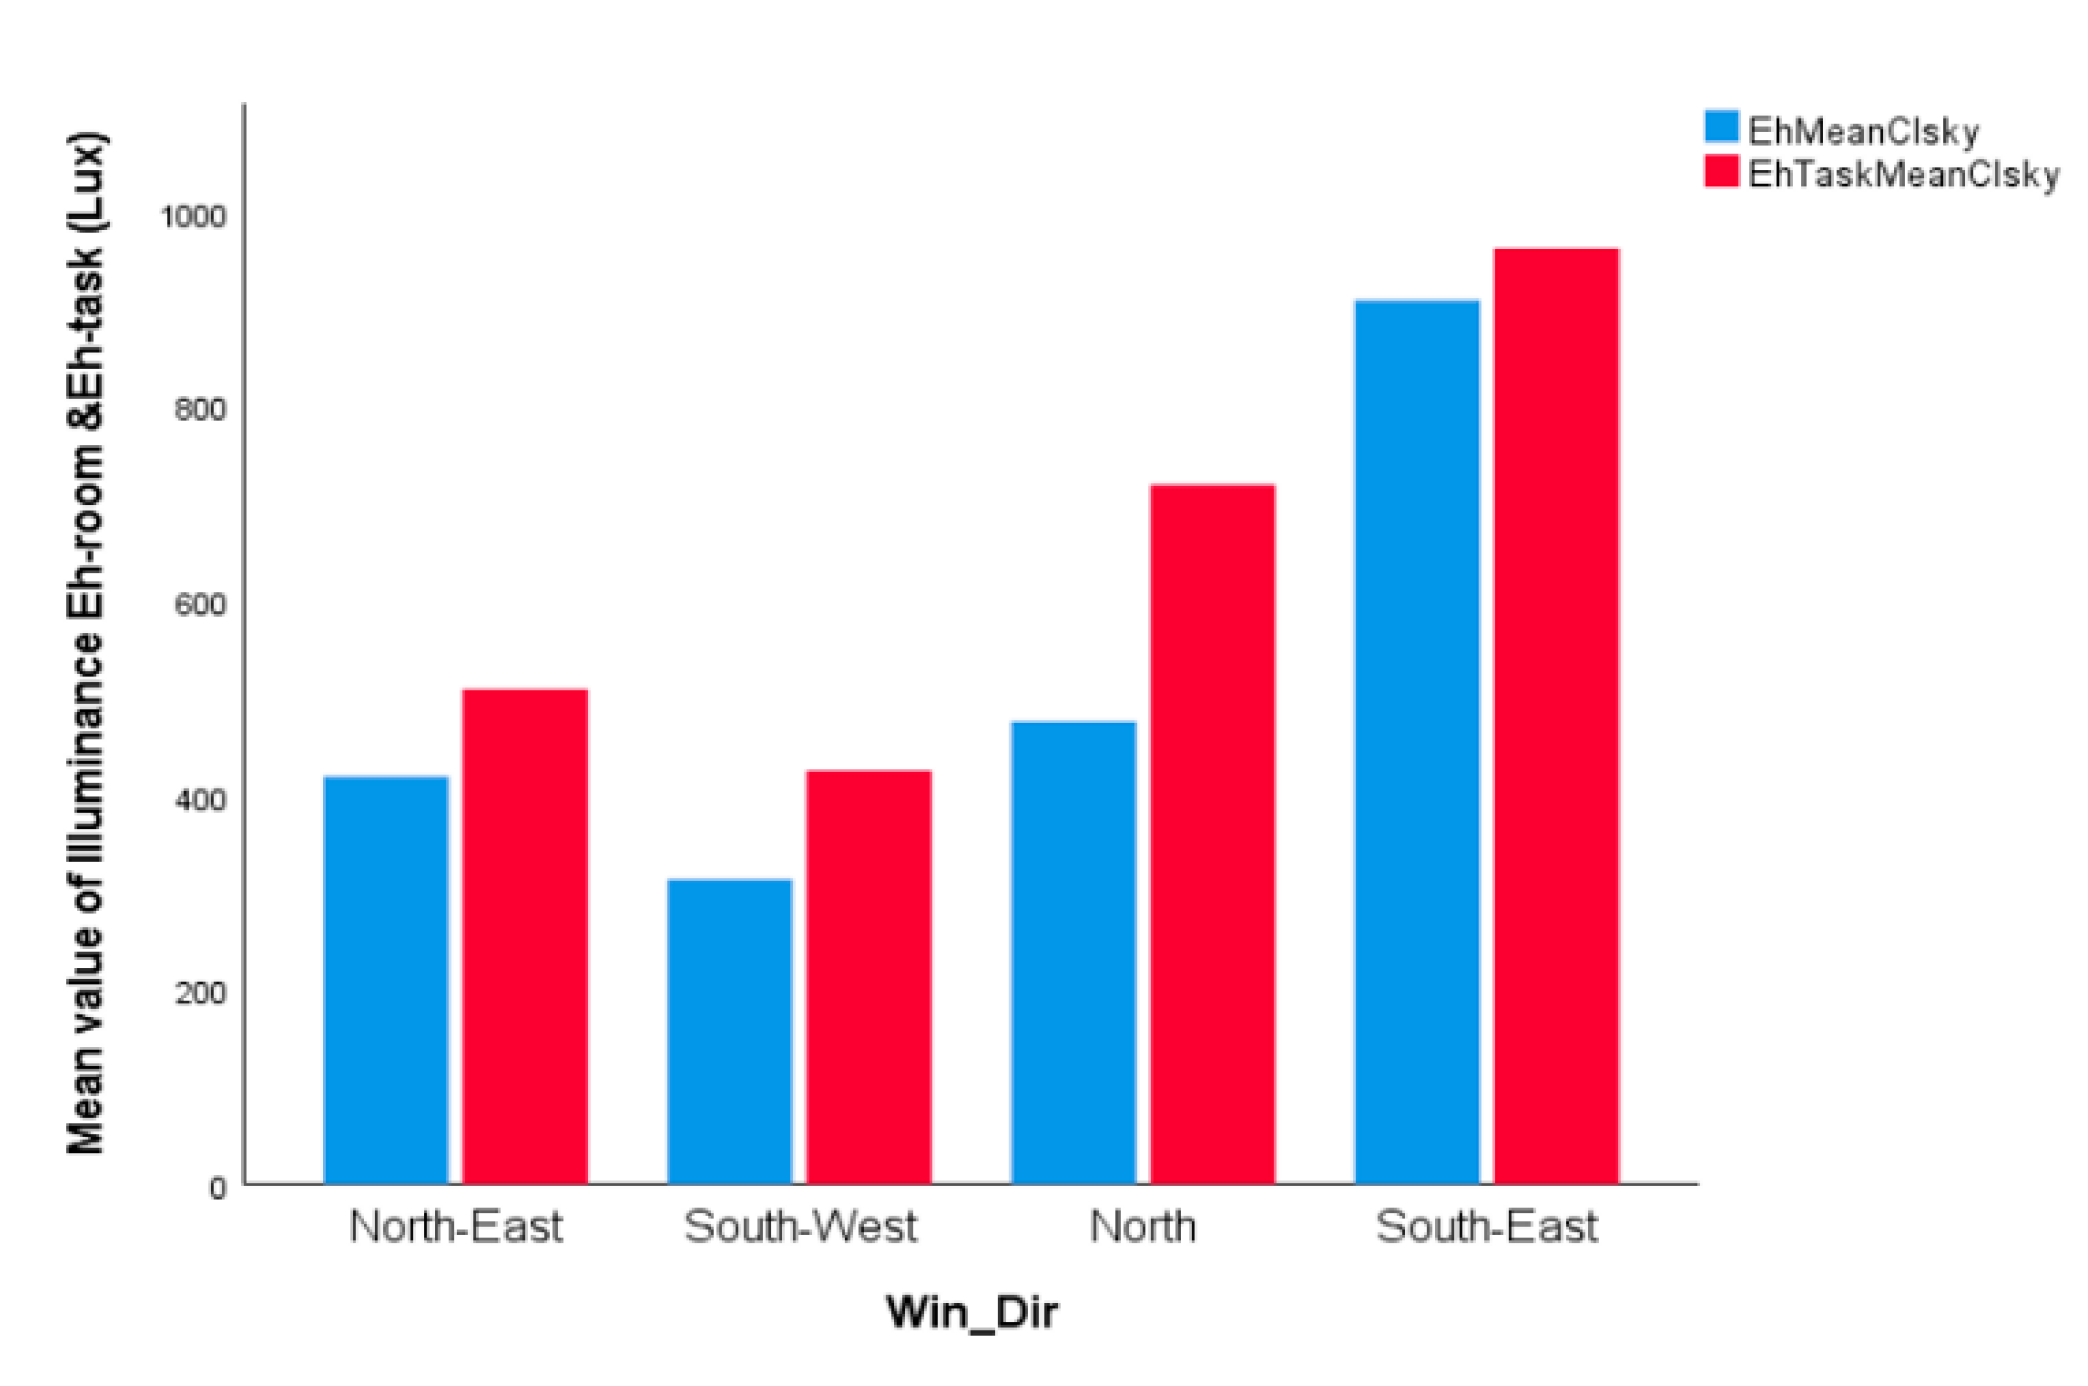
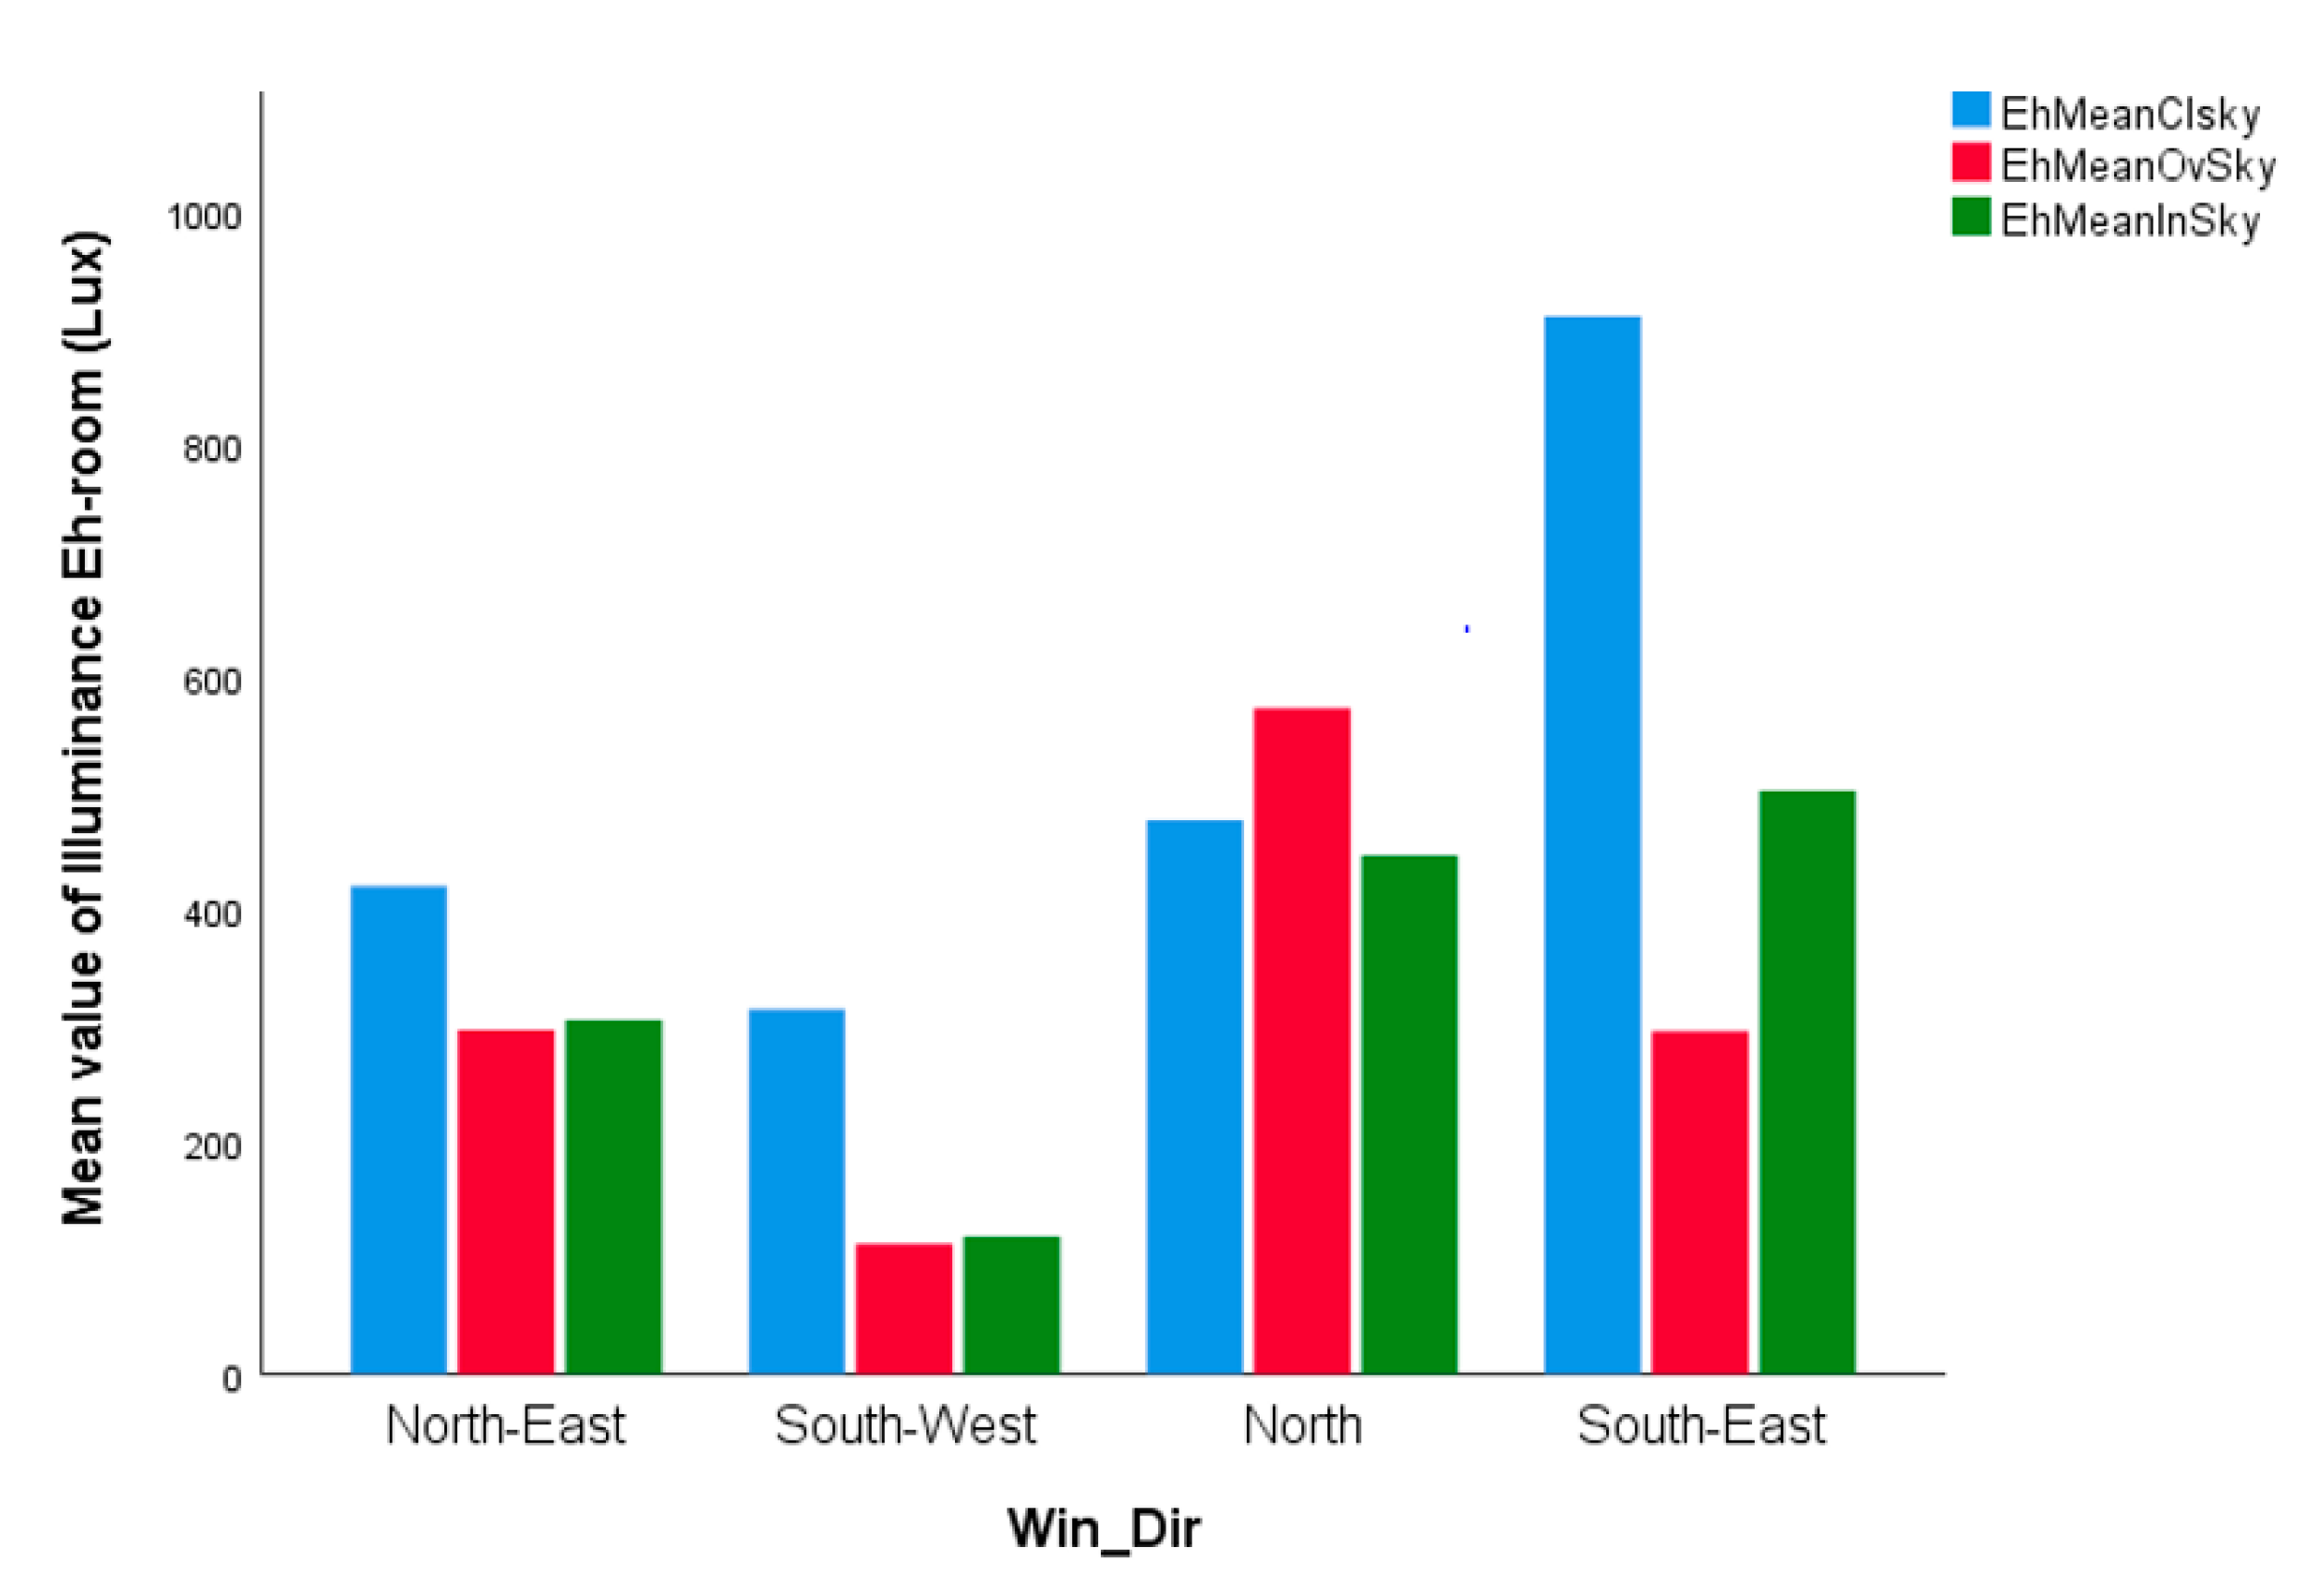
Horizontal illuminance in a room area (E
h-room)—The overview of the results for the mean value of horizontal illuminance E
h-room of the calculated sensor points of the room areas at work plane height is illustrated in
Figure 6. On average, the rooms received more than 300 lux light under the clear sky condition. Since most of the rooms on the south-east side have two windows, they receive the highest value of illuminance compared to the others. There is no surrounding building on the north side; therefore, this side received the second highest values with low variance for all three sky conditions.
Horizontal illuminance in a task area (E
h-task)—Based on the position of the desk area in each room, one sensor point was selected to calculate the horizontal illuminance incident on task areas. As illustrated in
Figure 7, on average, the amount of daylight incident at the task areas is slightly higher compared to the mean illuminance value of the rooms under the clear sky condition.
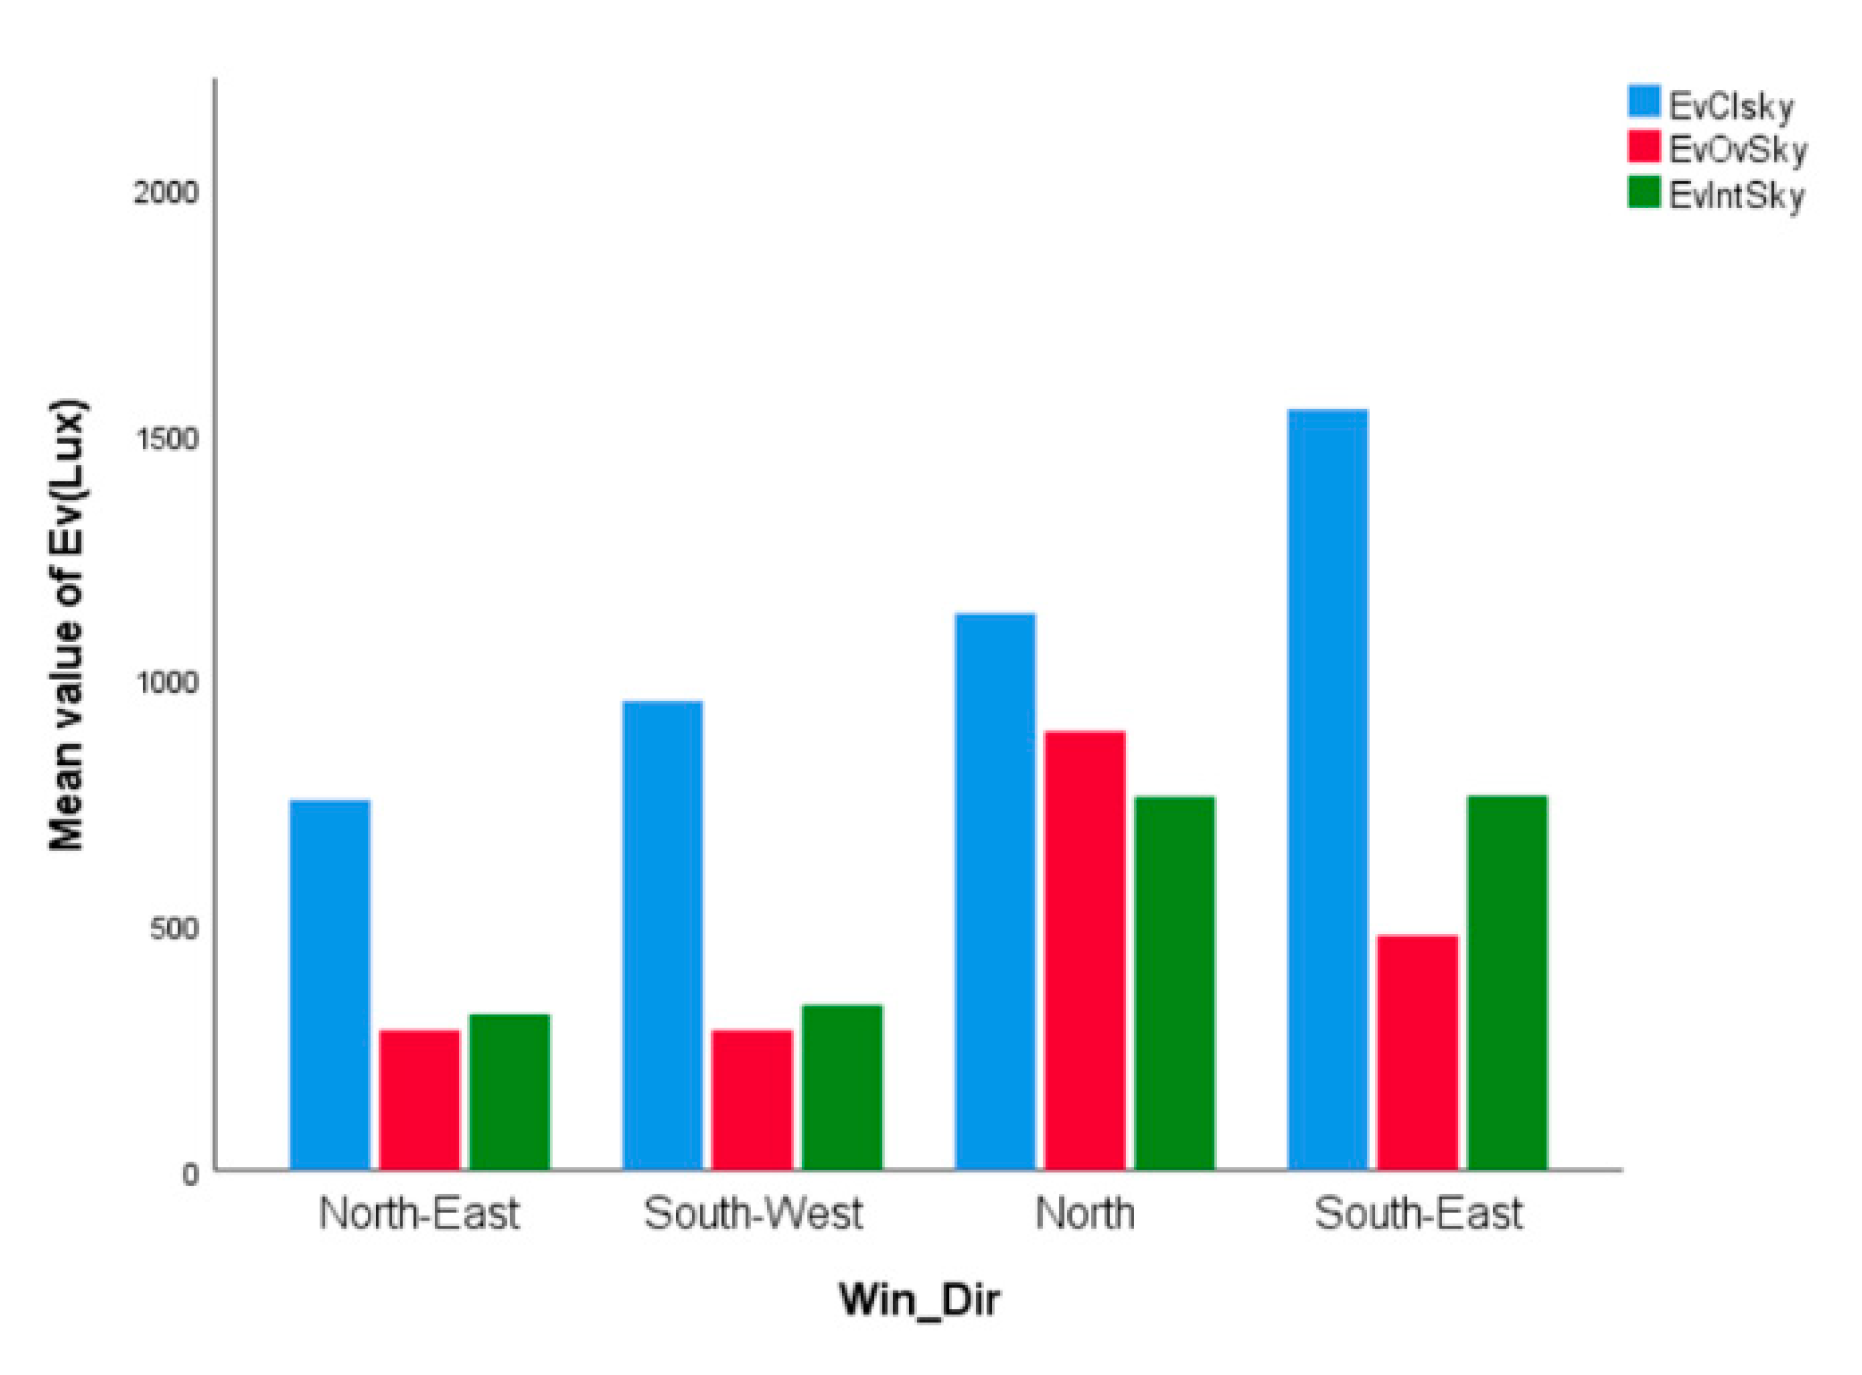
Vertical eye illuminance (Ev-eye)—In the center point of each room with a viewing direction towards the daylight opening, the vertical eye illuminance was calculated under three different sky conditions, and the results are illustrated in
Figure 8.
Daylight Autonomy (DA) and Spatial Daylight Autonomy (sDA)—The rooms on the north sides had DA values with a mean of (67.2 ± 3.5)%. The rooms on the south-east side had a mean DA value of (63 ± 13)%. At the north-east side, the mean value of DA was around (31.5 ± 9)%. The south-west side had the lowest mean DA value of (20 ± 14)%. The average of sDA values of all rooms was lower than 50% of the space area, but there are a few rooms on the south-east side with sDA values of around 70%.
Annual Sunlight Exposure (ASE)—None of the rooms at the north-east, north, and south-west sides exceed 1000 lux for more than 250 h per year for more than 10% of the space area of each room. The mean value of ASE for the rooms at the south-east side, however, received more than 1000 lux for 243 ± 156.5 h in a year, which means that some of the rooms on this side are categorized as ‘rooms which receive too much direct sunlight during the year’ (USG) [
23].
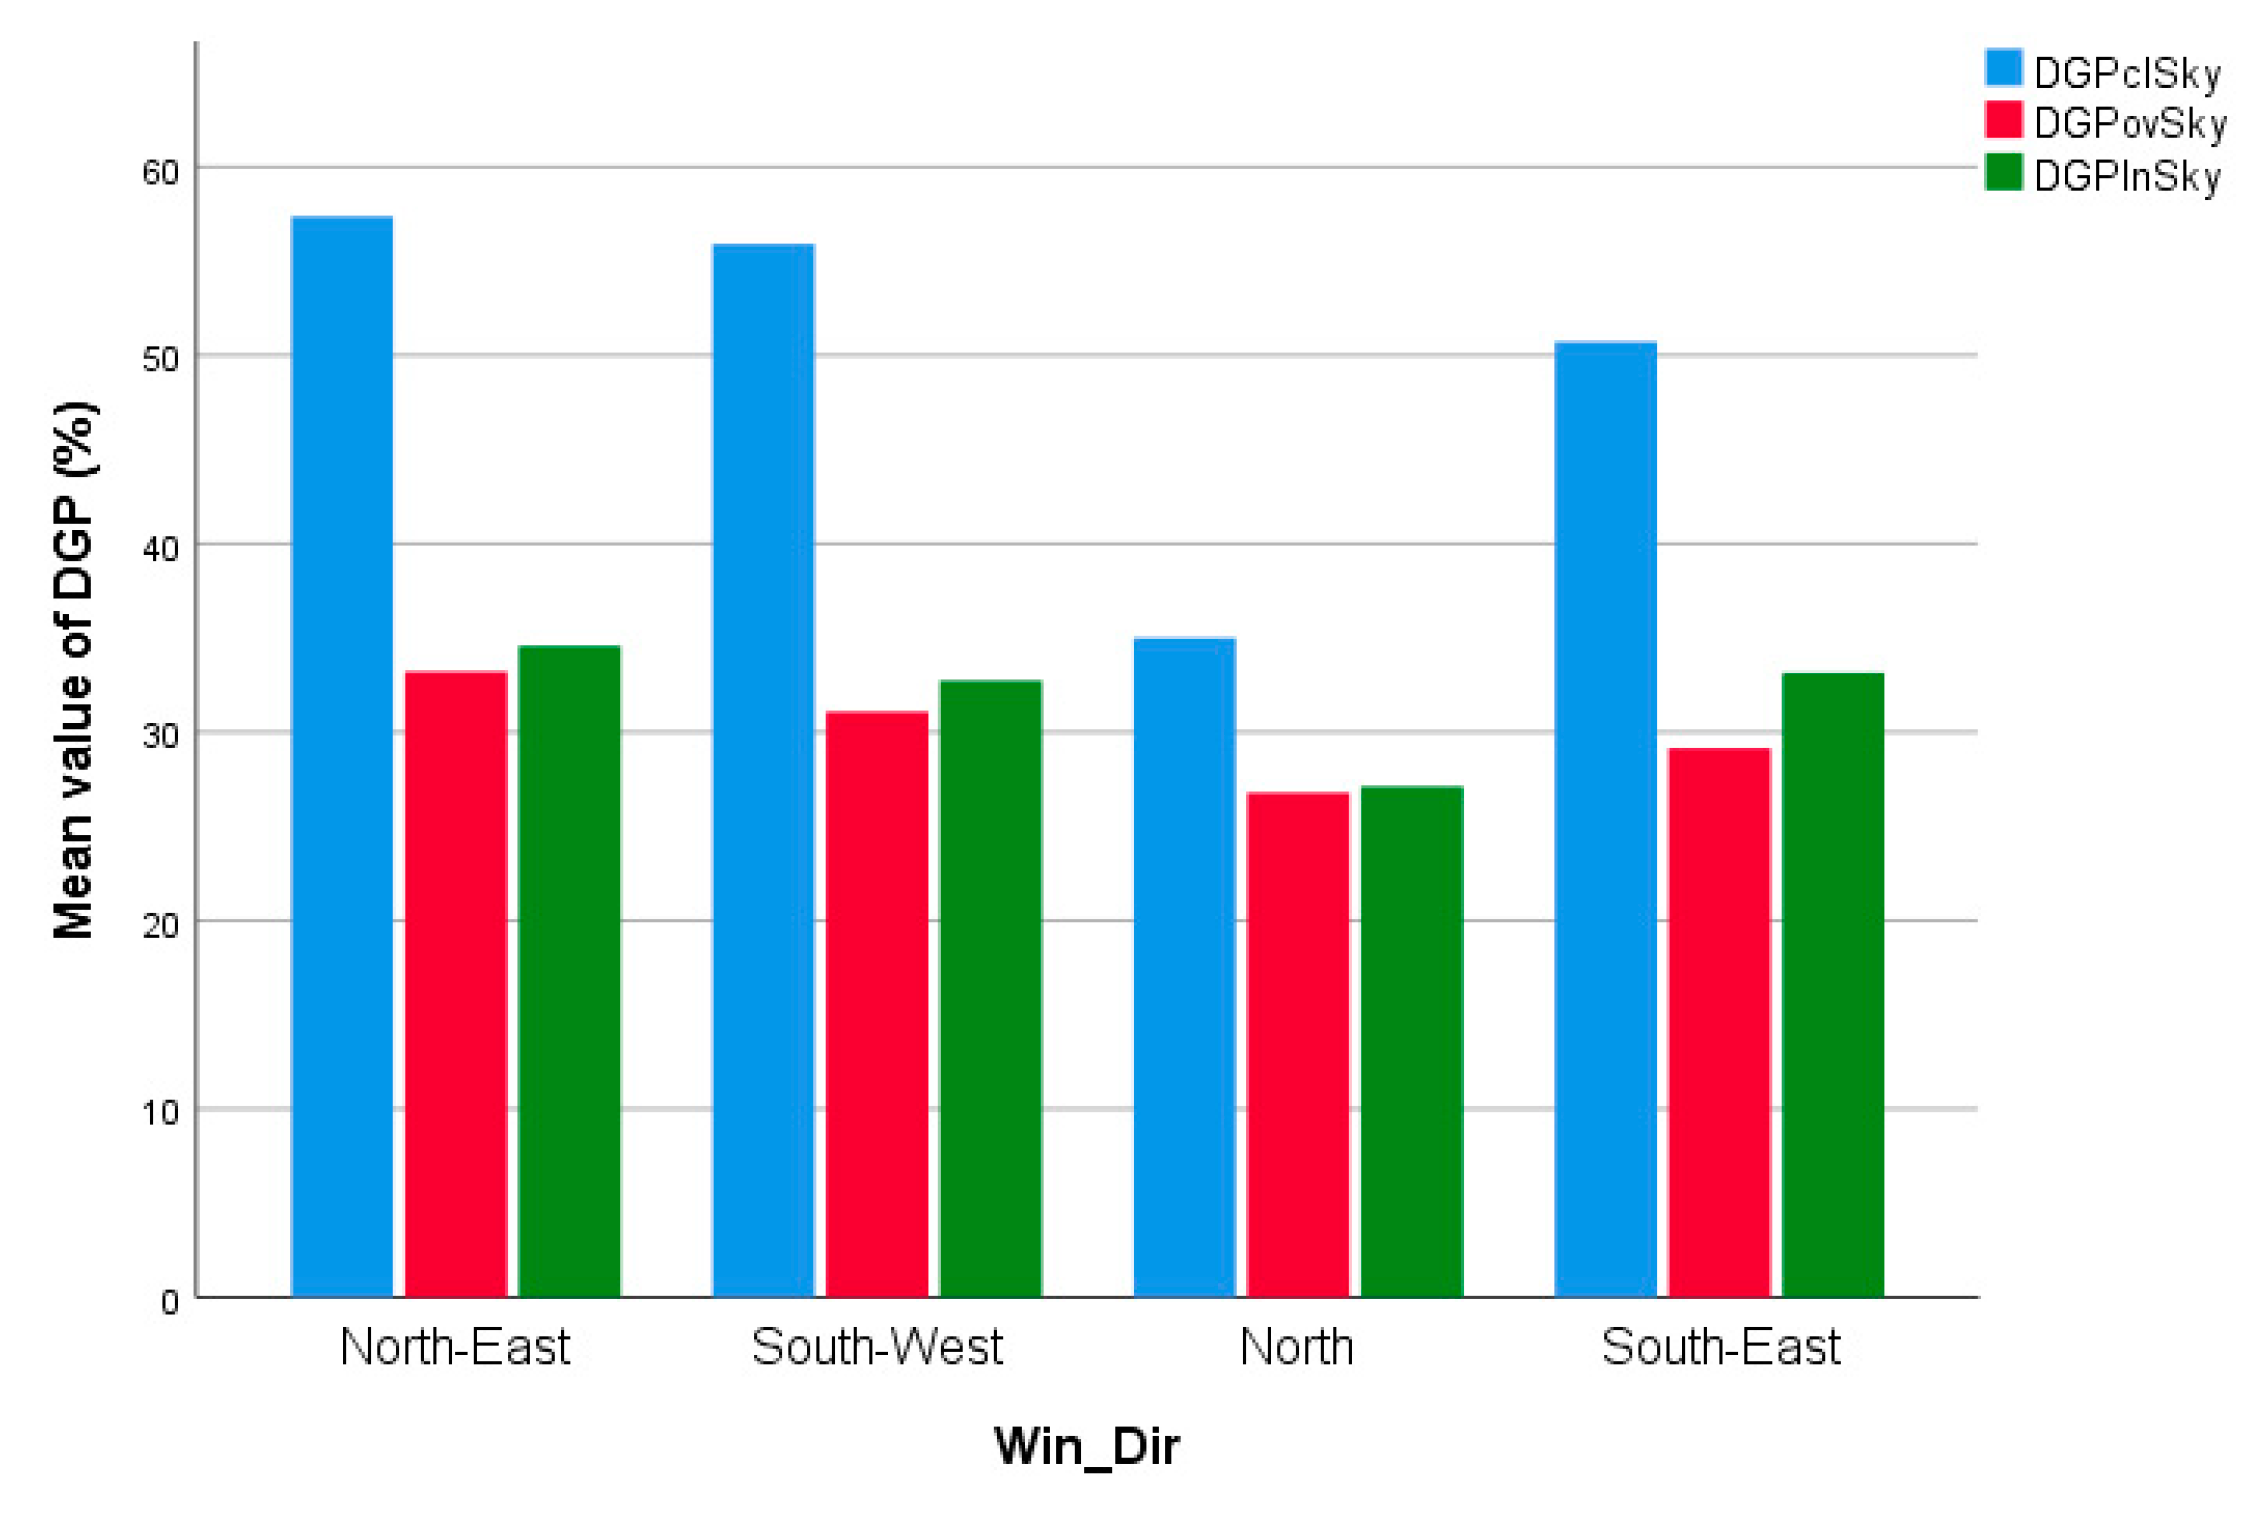
Daylight Glare Probability (DGP)—The center point of each room with a viewing direction toward the windows was selected for DGP analysis. The results of this analysis show that for all rooms under the ‘overcast’ and ‘intermediate’ sky conditions, the DGP value is below the ‘perceptible’ level (0.30 < DGP < 0.35). The DGP values under the clear sky condition for the rooms on the north-east, south-west, and south-east side are in the range of ‘intolerable glare’ (DGP > 0.45). For more details, see
Figure 9.
3.2.2. Subjective Evaluation Using Questionnaires
Descriptive statistics—The sample of all participants in June (
N = 46) shows a similar trend to the smaller sample. This means that the highest satisfaction in June belonged to satisfaction with ‘A-Job’ (
M = 2.4,
SD = 1.87). After that, daylight (both annually: ‘A-Natural’, and moment: ‘Natural’) with (
M = 2.9,
SD = 1.75 and
M = 2.8,
SD = 1.72) and ‘Glare artificial’ (
M = 2.8,
SD = 1.6) had the highest satisfaction rates. For more details, see
Table 8.
Correlation analysis—The correlation of all fifteen satisfaction variables was explored by calculation of Pearson correlation coefficients, and only significant correlations are reported here. The results of correlation analysis for the larger samples (
N = 46 and
N = 61) show that there were ‘very strong’ (0.8 <
p < 1) degrees of correlations for all the variables between annual and at the moment variables. Similarly, for the smaller samples (
N = 10 for both studies in June and October), the highest correlation was found for ‘Glare artificial light’. For daylight (A-Natural vs. Natural), a correlation was found only for June in both small and large samples. For more details, see
Table 9.
All the samples consistently showed the strongest correlation between ‘Light quality’ and ‘Light desk’ for both annual and moment situations. For the large sample in June (N = 46), all correlations of the variables for the moment situation were stronger than the same annual situation. For example, the correlation of ‘Light desk’ with ‘Light quality’ was (r = 0.87, p < 0.01), and the correlation of ‘A-Light desk’ with ‘A-Light quality’ was (r = 0.85, p < 0.01).
Both daylight and artificial light seem to contribute to the user assessments of the light quality in the room, with the correlation between ‘Artificial light’ and ‘Lighting quality’ (r = 0.81, p < 0.01) being slightly higher than the correlation between ‘Natural light’ and ‘Lighting quality’ (r = 0.77, p < 0.01). Both sources of glare also contributed to the assessments of the lighting quality in June with the same weight (r = 0.71, p < 0.01).
Unlike in October, when the assessments of the amount of light on the desk area (‘Light desk’) seem to only be linked to the amount and quality of artificial lighting, in June, both light sources seem to have contributed to the assessments of the ‘Amount of light on desk area’. For both light sources, the correlations were stronger for at the moment assessments compared to the annual assessments. ‘Amount of artificial light (moment)’ and ‘Amount of daylight (moment)’ showed strong correlations with the ‘Amount of light on desk area’ (r = 0.80, p < 0.01 and r = 0.71, p < 0.01, respectively). ‘Glare from artificial light’ and ‘Glare from sunlight’ showed a lower correlation with ‘Light desk’ (r = 0.76, p < 0.01 and r = 0.64, p < 0.01, respectively).
3.3. Objective–Subjective Correlation Analysis
The correlation between performance metrics and perceived visual comfort for the sample in June (N = 46) shows that, in total, eight subjective variables including satisfaction with ‘Glare sun’, daylight (both annual and at the moment: ‘A-Natural’ and ‘Natural’ variables, respectively), ‘A-View’, total light at the desk (‘A-Light desk’ and ‘Light desk’), and lighting quality (‘A-Light quality’ and ‘Light quality’) had a moderate (0.3 < r < 0.5, p < 0.001) relationship with at least one of the simulated performance metrics. All variables except glare had positive correlations with user satisfaction. Note that it is shown as negative numbers since user satisfaction was defined in inverse order, with 1 being the highest satisfaction level and 7 being the lowest satisfaction level.
The variable ‘Glare sun’ had the highest correlation with point-in-time horizontal illuminance (momentary) at task area (Eh-task) for mean values under the clear sky condition (r = 0.38, p < 0.01) and the intermediate sky condition (r = 0.33, p < 0.01).
Satisfaction with daylight for both the annual and momentary situations (‘A-Natural’ and ‘Natural’) showed a significant correlation with Eh-room, ASE, and DGP. The highest correlations for Eh-room with ‘A-Natural’ were for the mean value of illuminance under clear sky and intermediate sky conditions (r = −0.30, p < 0.01), both classified as moderate correlations. Additionally, ‘Natural’ and ‘A-Natural’ showed a moderate correlation with DGP (r = −0.41, p < 0.01).
Since the view to the outside is often inextricably linked to daylight, it was included in the analysis as well. The ‘A-View’ variable correlated with vertical illuminance (Ev-eye), horizontal illuminance at task area (Eh-task), and horizontal illuminance for the room area (Eh-room) as well as with DA, sDA, and ASE. The highest correlation was found for the mean value of Eh-room under ‘clear’ sky conditions (r = −0.46, p < 0.01).
‘A-Light desk’ and ‘Light desk’ showed correlations with the horizontal illuminance at task area (Eh-task) and room area (Eh-room) as well as with DA and sDA. Additionally, ‘Light desk’ correlated with vertical illuminance (Ev-eye) and ‘A-Light desk’ with ASE. The highest correlation for ‘A-Light desk’ was found for the minimum value of Eh-room under intermediate sky conditions (r = −0.47, p < 0.01). The highest correlation for ‘Light desk’ was found for the minimum value of Eh-room under ‘intermediate’ sky conditions (r = −0.47, p < 0.01).
Finally, ‘Light quality’ and ‘A-Light quality’ had significant correlations with Eh-room, sDA, and ASE. The highest correlation for ‘Light quality’ was found for the minimum value of Eh-room under ‘clear’ sky conditions (r = −0.36, p < 0.01).
4. Discussion
This follow-up study, conducted in June, is the second validation test of the EBD-SIM framework to provide new evidence to obtain better insights about the lit environment, specifically concerning visual comfort in office rooms. The effects of a larger sample size and having two POE studies in two different seasons (October, June) were investigated to find out if previous findings are confirmed (research questions 1 and 2), and to elucidate the usefulness of having two continuous POE studies for better analysis of visual comfort in office environments (research question 3). The results are categorized into two groups: within-subject study and between-subject study.
The main purpose of conducting a between-subject study in June with a larger sample (N = 46) was to verify previous findings in October (N = 15) and provide new or updated evidence for the EBD-SIM framework. Comparison between the two measurement moments showed similarities as well as differences.
The correlation analysis of subjective variables for both studies shows a ‘strong’ to ‘very strong’ degree of correlations for all annual and momentary variables except daylight (A-Natural vs. Natural), for which a correlation was not found in October. These strong to very strong correlations can be interpreted in that it is difficult for people to remember a lighting situation throughout the year, and the current situation dominates their feeling regarding the lit environment. Additionally, for daylight (A-Natural vs. Natural), it seems that occupants can better distinguish the difference between annual and momentary situations during dark seasons. From a subjective point of view, for all variables, it was consistently observed that the overall lighting quality perceived by the occupants had the highest correlation with the amount of light on the task area. While in October, the assessment of ‘light quality at the task area’ seemed to only be linked to the ‘amount and quality’ of artificial lighting, in June, in addition to artificial lighting, a strong correlation was found with ‘Natural light’ and ‘Glare sun’.
Regarding the first question related to the correlation between visual comfort metrics and perceived occupant visual comfort, similar to the results obtained in October, the results confirm the previous finding that point-in-time-horizontal illuminance had the highest correlation with perceived visual comfort by occupants. Moreover, in the larger study (June), annual performance metrics showed some degrees of correlation. This means that it is worth calculating sDA, DA, and ASE to provide a moderate forecast on occupant perception of lit environments, especially for ‘Light desk’, ‘Light quality’, and ‘Natural’. This analysis is in agreement with other studies, e.g., [
15,
24]. Since the results of vertical eye illuminance (E
v) and DGP are sensitive to the point of view of the occupants [
25], the calculation of data specifically for the occupants’ position and viewpoint improves the accuracy of the data.
Regarding the second question related to instantaneous and annual visual comfort perception and simulated comfort assessment metrics, it was found that for the large sample in June, all correlations of the subjective variables for the moment situation were stronger than the equivalent annual situation. Additionally, E
h, which measures the instantaneous situation, showed the highest number of correlations with perceived variables compared to the annual performance metrics. This could be interpreted in that human visual comfort perception for instantaneous situations and modeled comfort performance metrics have a higher agreement than human perception for annual estimations and modeled performance. In the future, POEs can be integrated into, e.g., (artificially) intelligent building control systems, providing direct feedback to the control agent so that each occupant is provided with their preferred lighting and, in a broader sense, with other desired IEQ conditions. Additional input from occupants such as user characteristics (e.g., age, gender, light sensitivity), user behavior, and user preferences can be collected to analyze the effects of the built environment on occupants in greater depth. Logging this feedback data and storing it in a database can provide a set of valuable evidence from the instantaneous feedback of occupants, which in turn can help with better prediction of human comfort and improvement of lighting design. For example, in an innovative study conducted by Newsham et al. [
26], along with lighting simulation tools, a humanoid robot was used to attract the attention of the occupant about their real environmental situation and provide them with personalized suggestions to improve their well-being. If a building is responsive to the requirements and behavior of occupants and organizations, either via a POE and/or via continuous monitoring, it can become a truly intelligent building. Conducting metadata analysis on all data collected from evidence and designing building interfaces or (self-)learning systems based on this evidence-based knowledge would make the interaction of occupants with buildings more convenient.
Regarding the third research question related to the usefulness of a POE with an increased frequency, the results show that in June, people were generally more satisfied with the lit environment compared to answers given in the original study performed in October. As daylight levels are higher in June, it seems that having more daylight has a positive impact on user satisfaction in general. The importance of daylight on user satisfaction was also shown by other researchers, e.g., [
27,
28,
29,
30]. For example, a study was conducted by Day, Futrell, Cox, and Ruiz [
28] that measured physical data and surveys to assess occupants’ subjective visual comfort. The results of their survey study (
N = 1068) showed that occupants who were more pleased with (their access to) daylight were also more likely to have a higher level of satisfaction. This finding also indicates that, depending on the time of year, a single POE study can overestimate or underestimate different lighting quality metrics. The paired sample
t-test analysis shows a significant difference for the daylight ‘Natural’ variable and a marginally significant difference for the daylight ‘A-Glare sun’ and ‘Light desk’ variables, which means at least for these variables, it is worth running a POE at least twice at different times of the year.
5. Conclusions
This study addressed implementing subjective–objective results in the evidence-based design process using lighting simulation tools in a POE step of the EBD-SIM framework. The POE focused on assessing occupant visual comfort in an individual office space to provide a systematic approach to repeatedly gather evidence in this field and build a knowledge database that can help improve how the results are analyzed, presented, and interpreted. As this study shows, running the EBD-SIM framework each time can provide new evidence. In the meantime, it helps to tailor the next run based on lessons learned in the previous run.
The results confirm the previous finding that the overall lighting quality perceived by the occupants had the highest correlation with the amount of light on the task area. In parallel, Eh (point-in-time horizontal illuminance) showed a consistently positive correlation with the highest number of subjective variables. Moderate correlations between annual performance metrics and some of the subjective variables were also observed during June, which were non-existent in the October study.
This study suggests that, at least for daylight-related variables (e.g., ‘Natural’, ‘A-Glare sun’, and ‘Light desk’), it is worth running the POE more than once at different times of the year to obtain a better insight into user perception of the lit environment.
As described in the EBD-SIM framework [
6], it is preferable to use the simulation output in the POE step so that the situation present at the time of conducting a POE study can be approximated using lighting metrics, and so that the result of the survey can be analyzed in greater depth.
The scope of this research was limited to the visual aspects of lighting quality, and the simulation results included only daylight aspects. In the future, the study can be extended to include both electric lighting and daylight as well as visual effects and light effects beyond vision through a long-term evaluation.


