Article

Intra- and Inter-Rater Reliability of a Well-Used and a Less-Used IsoMed 2000 Dynamometer for Knee Flexion and Extension Peak Torque Measurements in a Concentric Test in Athletes

1
Department of Health Services, Sports General Directorship, Center of Athlete Training and Health Research, The Ministry of Youth and Sports, Ankara 06820, Turkey
2
Department of Physiotherapy and Rehabilitation Ankara, Faculty of Health Sciences, Ankara Yıldırım Beyazıt University, Ankara 06830, Turkey
3
Department of Statistics, Hacettepe University, Ankara 06800, Turkey
4
Institute of Primary Care, University Hospital Zurich, 8091 Zurich, Switzerland
5
Medbase St. Gallen Am Vadianplatz, 9000 St. Gallen, Switzerland
*
Author to whom correspondence should be addressed.
Appl. Sci. 2021, 11(11), 4951; https://doi.org/10.3390/app11114951
Submission received: 30 March 2021 / Revised: 20 May 2021 / Accepted: 24 May 2021 / Published: 27 May 2021

Abstract

:
This study aimed to evaluate the intra- and inter-rater reliability of a well-used and a less-used IsoMed-2000 dynamometer for knee flexion and extension peak torque (PT) measurements in a concentric test in athletes. Two IsoMed-2000 isokinetic dynamometers were used, an old one that was well-used and a new one that was less-used. Thirty-seven weight-lifting athletes (12 female, 25 male) were included in this study. Both legs of each athlete were tested twice on each isokinetic dynamometer at 60°/s and 180°/s. The Intraclass Correlation Coefficients (ICC), Standard Error Measurement (SEM), Smallest Detectable Change (SDC), SDC% and 95% limits of agreement were calculated to evaluate the intra- and inter-rater reliability of a well-used and a less-used IsoMed 2000 dynamometer for knee flexion and extension peak torque in athletes. Intra-rater reliability was moderate to excellent (ICCs: 0.516–0.928) for knee muscle strength parameters, and the highest SDC and SEM values were 0.76 N/kg and 0.28 N/kg, respectively. Inter-rater reliability was moderate to excellent (ICCs: 0.519–915) for knee muscle strength parameters, and the highest SDC and SEM values were 0.81 N/kg and 0.29 N/kg, respectively. At least 89.2% of the obtained values of parameters fell within the 95% limits of agreement. Our findings demonstrate the intra and inter-rater reliability of a Well-Used and a Less-Used IsoMed 2000 Dynamometer for Knee Flexion and Extension Peak Torque in Athletes.

1. Introduction

Muscle strength in athletes is one of the important determinants of sports performance, where muscle strength loss has been related with an increased risk of injury [1,2]. Muscle strength evaluations are used to determine physical conditioning to define weakness connected with sports injuries and to enhance improvement in exercise/rehabilitation programs [3,4,5]. Knee joint muscle strength is associated with the strength of other muscles of the body and is important for both athletes, trainers and health professionals working in this field since it effects sports performance regardless of sector [5]. For this reason, the strength of the knee flexor and extensor muscles is frequently evaluated both for the preparation and regulation of training programs at the beginning of the season, in the middle of the season, and at the end of the season to determine the amount of training necessary to reach the desired goal [2,5].
Muscle strength can be evaluated by different methods, such as a manual muscle test, a hand dynamometer and an isokinetic dynamometer [6,7,8]. Isokinetic dynamometers are accepted as the gold standard for evaluating muscle strength [7,8]. Measurements of muscle strength with isokinetic dynamometers are often used to determine muscle strength balance, which is considered a risk factor in sports injuries [9]. According to the results of these measurements (such as symmetry index, conventional ratio, and functional ratio), exercise and training programs are planned [9]. Isokinetic dynamometers are also used to increase muscle strength in sports rehabilitation applications after sports injuries [10].
There are some points to be considered when using isokinetic dynamometers [10]. These include elements such as gravitational forces, the number of joints that muscles travel and the position of the upper or lower joint, as well as the involvement of antagonist muscles, the cognitive level of the participator, and visual and verbal encourage [10]. However, isokinetic dynamometers should be served and calibrated regularly [10]. Additionally, it is necessary to include appropriate adjustment and standardization methods and to report suitable technics or arrangements [10]. Studies investigating how the measurement results change with the usage time of these devices are insufficient. However, there are studies showing that the strength measurements of knee flexor and extensor muscles evaluated using different isokinetic dynamometers are reliable and valid [11,12]. These authors found that the between-session reliability of the strength and endurance testing of the knee flexor and extensor muscles was substantially varied (ICC: 0.42–0.89) [11,12].
In our clinic, we use two isokinetic dynamometers with different usage times, but the same brand and model, located in the same position in separate rooms. While one of the dynamometers has six months of usage (new dynamometer/less-used), the other has three years and nine months of usage (old dynamometer/well-used), and annual service maintenance is regularly made. If there is a conflict during the appointment hours of the athletes we train with isokinetic dynamometers, we train the athletes with the unused dynamometer at that time. As a result of our observations, we found that our athletes sometimes demonstrated higher knee flexion peak torque (PT) values on one dynamometer but higher knee extension PT values on the other. In the literature, we did not find any studies that reveal the relationship between the usage time of isokinetic dynamometers and their measurement output. Additionally, there are no studies examining the reliability of the measurement results of the same model and brand of isokinetic dynamometers with different usage times. If different isokinetic dynamometers with different usage times expressed dissimilar results for a participant doing the same evaluation or training, scientists could not compare athletes’ muscle strength from different treatments. Physiotherapists also could not confirm whether their patients’ muscle strength was getting stronger or weaker. Coaches could not control whether their athletes’ results were correct or whether they wanted to let the athletes return to the sport.
This study aimed to assess the intra- and inter-rater reliability of a well-used and a less-used IsoMed-2000 dynamometer for knee flexion and extension PT measurements in a concentric test in athletes. Our hypothesis was that even if it is the gold standard, the usage period will affect the measurement outputs of the dynamometers, such that an older and well-used dynamometer will not provide the same measurement output as a new dynamometer.

2. Materials and Methods

This study was approved by the Local Research Ethics Committee (05.02.2020/19) and was conducted in accordance with the Declaration of Helsinki. Participants and their legal guardians (if the athletes were under 18 years of age) were verbally contacted, and the purposes, benefits and risks of the testing procedures were given prior to obtaining written informed consent.

2.1. Participants

The study included 37 (12 female and 25 male) weightlifting athletes with a mean age of 16.7 ± 0.8 years (range 15–19), listed in Table 1. The athletes had been weightlifting for at least 3 years, followed by attendance at an athlete training and health research center and having had a routine athlete’s evaluation at least twice a year, including knee isokinetic evaluation.
The inclusion criteria were providing a participation approval either by himself/herself or his/her legal guardians and to have participated in an international competition within the last 3 years. The exclusion criteria were a history of knee-joint-specific isokinetic training, lower extremity musculoskeletal injury that could affect the maximal isokinetic test, other injuries/problems, or limiting factors that impeded maximal muscle contraction.

2.2. Study Design

The study occurred across two sessions of repeated measurements with 72 h between each evaluation [13]. Two IsoMed-2000 isokinetic dynamometers (D&R Ferstl GmbH, Hemau, Germany) were used in this study: an old one with a longer usage time (well-used/old dynamometer; total number of registered individuals: 2742; number of tests: nearly 4000 (nearly 2500 knee, 1500 other joints); number of strengthening programs: nearly 500 (nearly 200 knee, 300 other joints)), and a new one with less usage time (less-used/new dynamometer; total number of registered individuals: 782; number of tests: nearly 1000 (nearly 600 knee joint, 400 other joints); number of strengthening programs: nearly 10-knee joint). A less-used dynamometer had six months of usage and a well-used dynamometer had three years and nine months of usage. Both dynamometers had annual service maintenance. The torque sensor, signal conditioning hardware, and used software and analogue filters are equal in both dynamometers.
Tests on both the isokinetic dynamometers were performed separately on both legs according to prior block randomization. The intra- and inter-reliability of the dynamometers was evaluated through a concentric maximal test of the knee flexor and extensor muscles. Athletes came to the laboratory four times with an interval of three days to reduce both the possibility of a learning effect and the harmful effects of fatigue caused by previous tests [14]. Just before each test, the athletes were familiarized with the test by doing the same movement at the same angular speed as the test. Our aim with familiarization was to make the athletes understand the resistance of the angular velocity being tested. At least 8 h before each test, the athletes were informed that they should not take any stimulants or engage in strenuous activity. Apart from that, the athletes were told to continue their daily routines but not to do vigorous physical activity 48 h before each test. Evaluations were done by the same physiotherapist at same time of day (±2 h).
Athletes participating in the study were randomly divided into two groups. The measurements took a total of 4 days for each athlete. Table 2 shows that, in terms of groups, the athletes were evaluated according to which dynamometer was used on which day. Dynamometer adjustments in the evaluation carried out on the first day for each athlete were also provided for other measurements. Thus, the results of the concentric muscle strength measurement of the knee joint flexor and extensor muscles of each athlete were obtained four times in total, two with the old dynamometer and two with the new dynamometer.

2.3. Procedures

Prior to isokinetic tests, the athletes rotated a 10-min supervised bike at a rhythm of ~ 70 rpm on a stationary ergometer (SCIFIT Systems Inc., Tulsa, OK, USA) for warm-up purposes. In addition, three attempts were made to warm up at the same angular velocity as the angular velocity of the tests on each isokinetic dynamometer. Isokinetic tests are standardized according to angular velocities and the athlete’s position. The physiotherapist gave the same verbal commands during the test, after explaining the instructions to each athlete before the test. Athletes rested for a minute between each angular velocity and each leg.
Before each test, both isokinetic dynamometers were adjusted according to the information in the user manual. After the adjustments, the knee joint was placed in IsoMed-2000 dynamometers to evaluate concentric-concentric muscle strength according to the information in the user manual. Athletes were seated at 75° of flexion at the hip joint and attached from the thigh to the dynamometer with Velcro straps. The dynamometers’ trunk, leg, lever arm and each position of the athletes was fixed at a similar length and angle for both dynamometers. The tests were carried out in a sitting position. Athletes were stabilized over the shoulders with the shoulder apparatus of the dynamometer and over the waist and distal femur with stabilization bands. The pivot was set to be the lateral condyle of the femur [15]. Then, the athlete’s leg was left loose, the leg weight of the athlete was measured by the dynamometer, and gravity elimination was provided by the dynamometer during the measurement [15]. The strength of the dominant and non-dominant side knee flexor and extensor muscles was evaluated concentrically at speeds of 60°/s and 180°/s. Before each speed, three repetitions of warm-up and understanding were carried out. The strength of the knee flexor and extensor muscles were evaluated with five reps’ protocol at maximal voluntary contraction at an angle of 60°/s and 15 reps at an angle of 180°/s. For each maximal voluntary contraction, subjects contracted as “hard and fast” as possible to full extension and then to full flexion [15]. Raw data were collected with 200 Hz sampling frequency, and a 6th order 200 Hz low pass Butterworth filter was applied by the device. The company reported that the torque measurement accuracy of the device was 0.25% FS.
Only the highest peak torque for each isokinetic assessment was analyzed. Data were normalized for body mass [16]. Muscle strength measurements were performed by the same physiotherapist who has been an expert in the field and has been using an isokinetic dynamometer for at least 3 years.

2.4. Outcome Variables

The outcome variables extracted and used in statistical analyses were: the PT/Weight (W) of the dominant side flexor muscles for 60°/s angular velocity (FLDMPT60), PT/W of the dominant side extensor muscles for 60°/s angular velocity (EXDMPT60), PT/W of the non-dominant side flexor muscles for 60°/s angular velocity (FLNDMPT60), PT/W of the non-dominant side extensor muscles for 60°/s angular velocity (EXNDMPT60), PT/W of the dominant side flexor muscles for 180°/s angular velocity (FLDMPT180), PT/W of the dominant side extensor muscles for 180°/s angular velocity (EXDMPT180), PT/W of the non-dominant side flexor muscles for 180°/s angular velocity (FLNDMPT180), and PT/W of the non-dominant side extensor muscles for 180°/s angular velocity (EXNDMPT180).

2.5. Statistical Analysis

The power of the sample size was calculated by G*Power software (version 3.1). Since the aim was to compare the results of two trials of the same dynamometers and also the measurements of old-new dynamometers, we applied a two-tailed paired Student’s t-test (difference between two dependent means) type power analysis. Analysis was conducted with a 95% confidence interval, 80% power, and 0.50 effect size values, and the minimum number of athletes was found as n = 34 [17,18].
Statistical analyses were performed using the IBM SPSS Statistics version 23.0 (IBM Corp., Armonk, NY, USA) and “BlandAltmanLeh” package in R Studio [19]. A 5% type-I error level was used to infer statistical significance.
Forty-two athletes were involved at the beginning of the study. Four of their measures were incomplete. By considering the differences between the trials and dynamometers of each measure, the box-plot was used to detect the outliers, and one of the athletes was removed because the calculated differences were out of the Q1–1.5 × IQR or Q3 + 1.5 × IQR in most of the measures. Each measure for 37 athletes was evaluated for normality with the Shapiro-Wilks Test and demonstrated that all data had a normal distribution (p > 0.05).
An Intraclass Correlation Coefficient (ICC) with a 95% confidence interval was used as a measure of test-retest (intra-rater) and inter-rater reliability. For the intra-rater reliability, the reliability of trails, a single-measurement, absolute-agreement, two-way mixed-effect model ICC (ICC 3.1) was used [20]. ICCs were calculated for old and new dynamometers, separately. For the inter-rater reliability, the reliability of two dynamometers, a single-measurement, absolute-agreement, two-way random-effect model ICC (ICC 2.1) was used and calculated for two trials, separately. ICC 2.1 results can be generalized to other raters [21]. ICC values are interpreted according to Portney and Watkins (2008) intervals: 0.75 is considered good, 0.75 to 0.50 is moderate, and below 0.50 is poor [22].
For assessment of absolute reliability, standard error of measurement (SEM) and smallest detectable change (SDC) were used. SEM was calculated as S E M = S D d i f f / 2 , where S D d i f f was the standard deviation of the difference scores for the two trials or two dynamometers. SDC was calculated as SDC95 = SEM × 1.96√2, where 1.96 is the z score for a 95% CI [23]. SDC% was calculated as SDC95/mean×100%, presenting the relative amount of random measurement error [24].
Bland-Altman (1986) plots were also created, and 95% limits of agreement (LoA) were calculated to evaluate the intra-rater reliability [25]. A paired t-test was performed to detect the difference between test and re-test values. The paired t-test and 95% LoA were used to assess systematic bias between trials and dynamometers. The regression analysis between the difference of trials or dynamometers and their means were used to detect the proportional bias.

3. Results

3.1. Intra-Rater Reliability

The Intraclass Correlation Coefficient (ICCabsolute) of the old dynamometer ranged from 0.659 to 0.928 (see Table 3), and the new dynamometer ranged from 0.516 to 0.901 (see Table 4). According to Portney and Watkins (2008), all the ICCs can be considered to have good or moderate reliability [22]. SEM was 0.08–0.22 for the old dynamometer and 0.08–0.28 for the new dynamometer, while the SDC was 0.24–0.61 N/kg for the old dynamometer and 0.24–0.76 N/kg for the new dynamometer. The SDC% values ranged from 9.50% to 24.79% for the old dynamometer and 11.00% to 26.87% for the new dynamometer.

3.2. Trial Effect

There were no significant differences between the two repeated trials of the old dynamometer for all the measures (p > 0.05; see Table 3). There were no statistically significant differences between the two repeated trials of the new dynamometer for all the measures (p > 0.05; see Table 4).

3.3. Inter-Rater Reliability

The Intraclass Correlation Coefficients (ICCabsolute) ranged from 0.519 to 0.915 for trial 1 and 0.603 to 0.909 for trial 2 (see Table 5 and Table 6). All ICC values indicated good or moderate inter-rater reliabilities. SEM was 0.09–0.29 for both trial 1 and 2, while SDC was 0.22–0.80 N/kg for trial 1 and 0.25–0.81 N/kg for trial 2. The SDC% values ranged from 8.75% to 26.74% for trial 1 and 10.17% to 26.85% for trial 2.

3.4. Dynamometer Effect

For trial 1, there were no significant differences between the FLDMPT60, FLNDMPT60, FLDMPT180, EXDMPT180, FLNDMPT180, and EXNDMPT180 measurements of the old and new dynamometers (p > 0.05; see Table 5). The old dynamometer measured EXDMPT60 and EXNDMPT60 lower than the new one (p < 0.05; see Table 5).
For trial 2, there were no significant differences between the FLDMPT60, EXDMPT60, FLNDMPT60, FLDMPT180, EXDMPT180, and FLNDMPT180 measurements of the old and new dynamometers (p > 0.05; see Table 6). The old dynamometer measured EXNDMPT60 and EXNDMPT180 lower than the new one (p < 0.05; see Table 6).

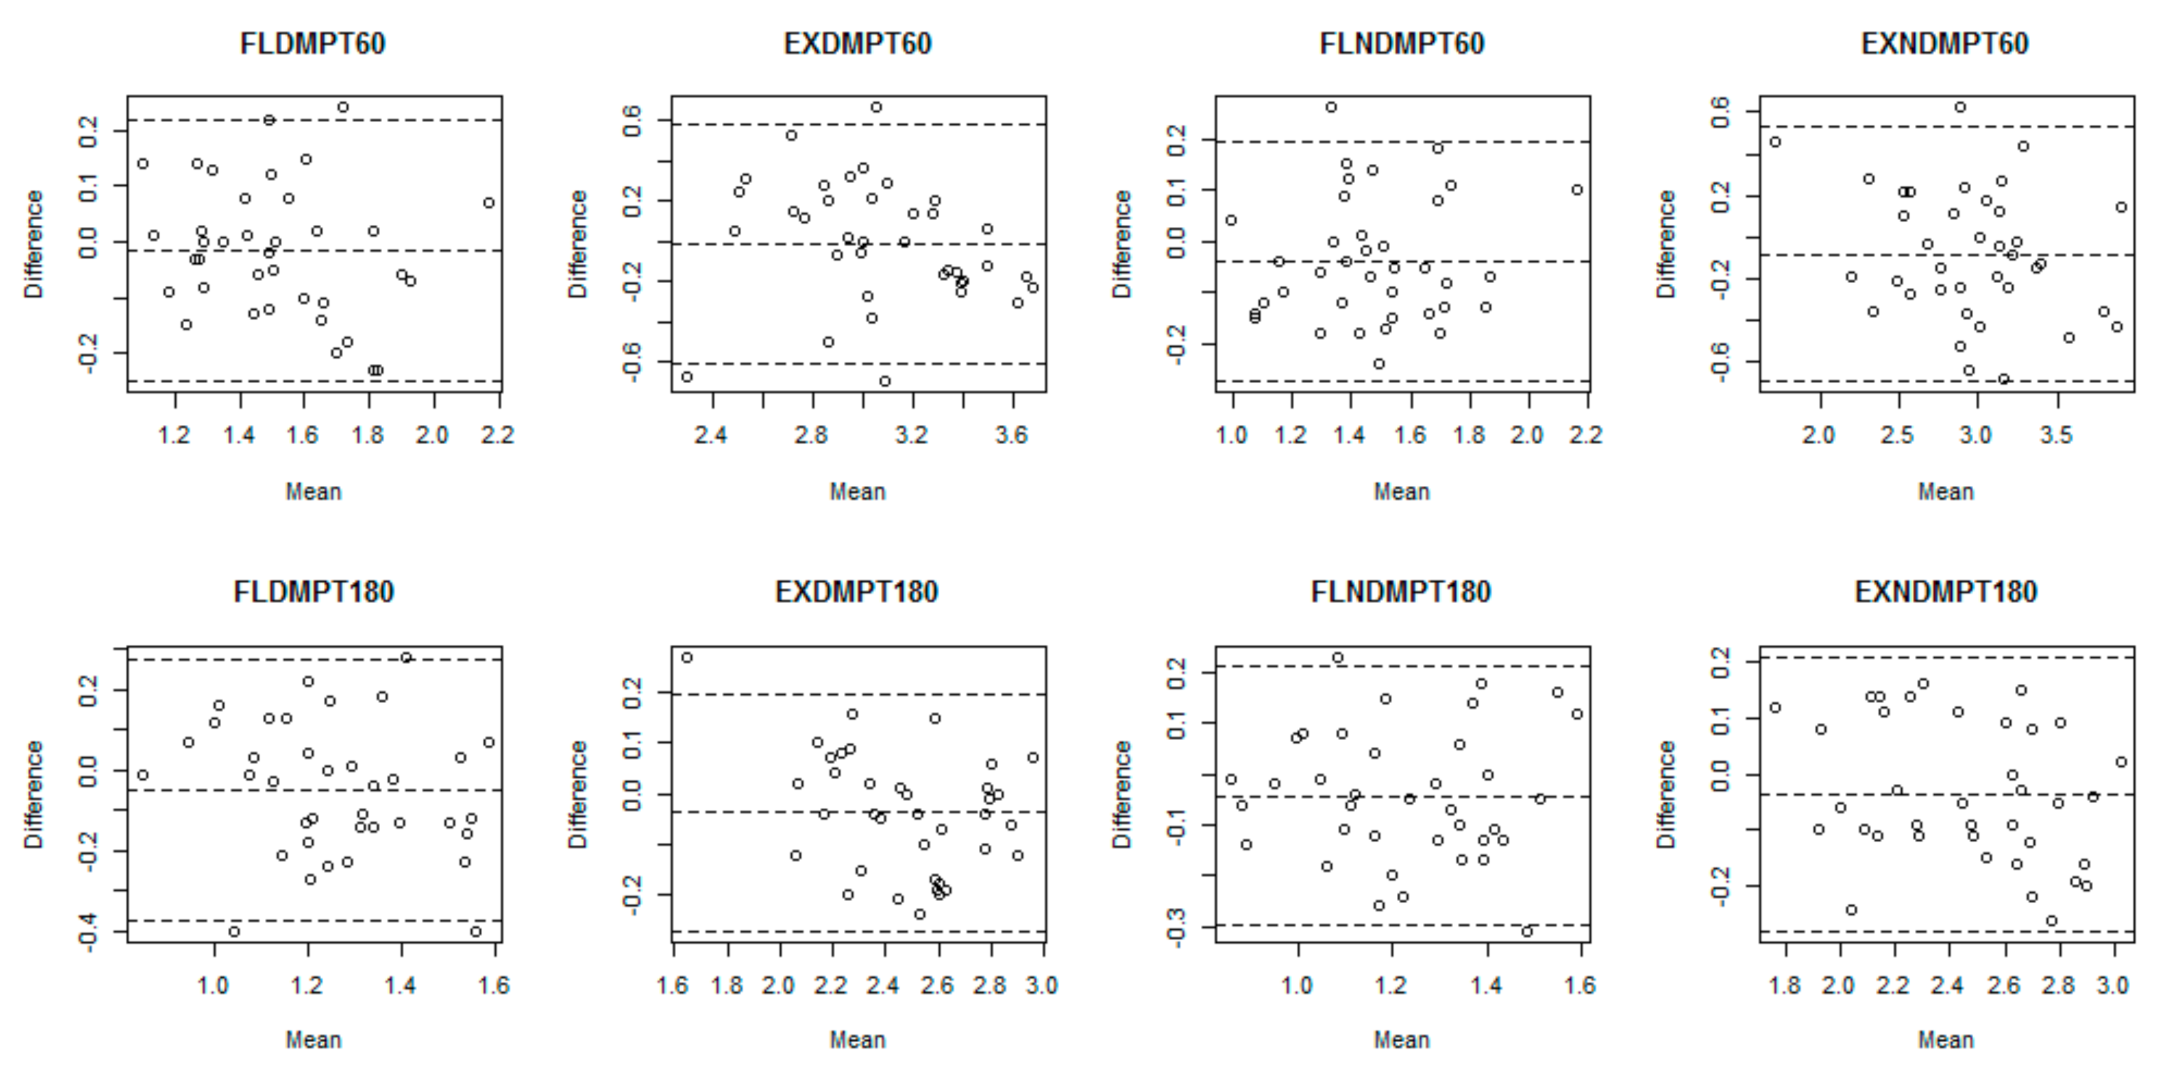
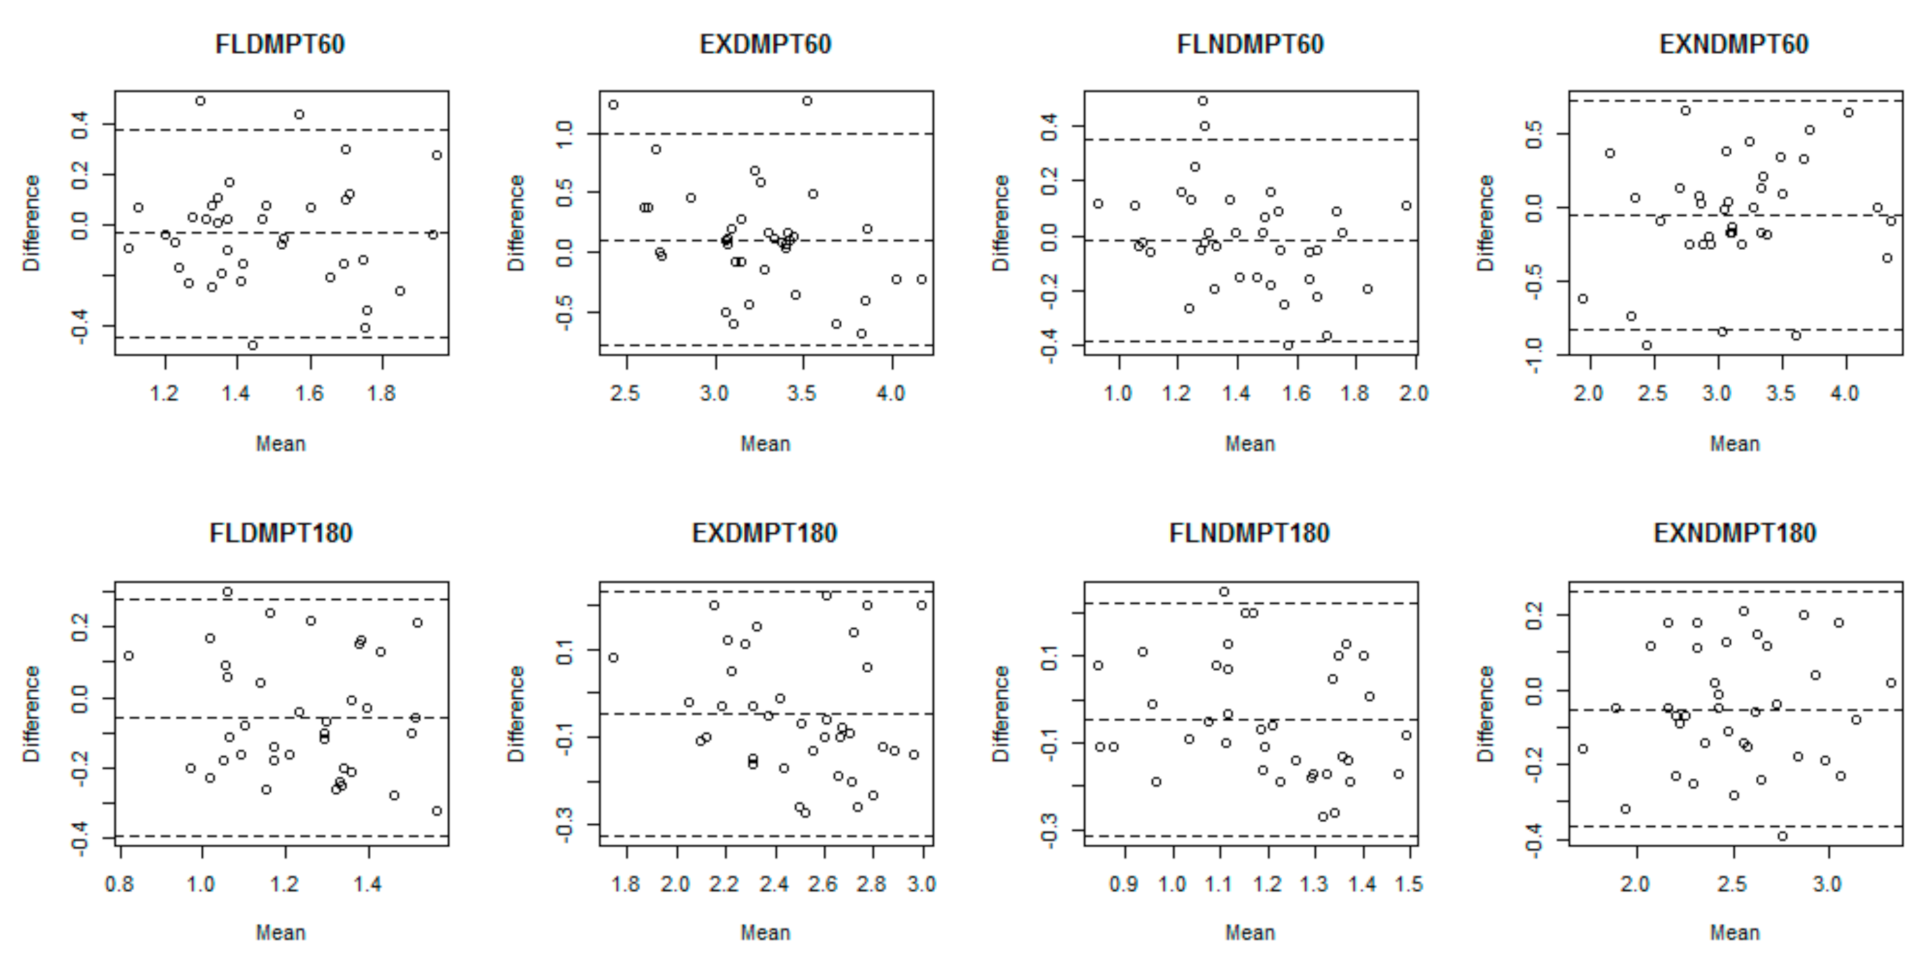
3.5. Bland-Altman Analysis

Bland-Altman analysis showed no systematic biases for old and new dynamometers (p < 0.05; see Table 3 and Table 4). The old dynamometer differs for 35 of 37 participants for EXDMPT60 and FLNDMPT180; 36 of 37 participants for FLDMPT60, FLNDMPT60, EXNDMPT60, EXDMPT180, and FLNDMPT180 were within 2 SDs of the mean (95% CI; see Figure 1). The new dynamometer showed differences for 34 of 37 participants for FLDMPT60, FLNDMPT60, and EXNDMPT60; 35 of 37 participants for EXDMPT60; 36 of 37 participants for FLDMPT180, FLNDMPT180, and EXNDMPT180 were within 2 SDs of the mean (95% CI; see Figure 2).
Bland-Altman analysis for Trial 1 showed systematic biases for EXDMPT60 and EXNDMPT60 (p < 0.05; see Table 5). There was a proportional bias for EXNDMPT60 measures in trial 1 (r = 0.501, p = 0.002). 34 of 37 participants for FLDMPT60 and EXDMPT180; 35 of 37 participants for EXDMPT60, FLNDMPT60, EXNDMPT60, and EXNDMPT180; and 36 of 37 participants for FLDMPT180 and LNDMPT180 were within 2 SDs of the mean in Trial 1 (95% CI; see Figure 3).
Bland-Altman analysis for Trial 2 showed systematic biases for EXNDMPT60 and EXNDMPT60 (p < 0.05; see Table 6). 33 of 37 participants for EXNDMPT60; 35 of 37 participants for FLDMPT60, FLNDMPT60, FLDMPT180, EXDMPT180, FLNDMPT180, and EXNDMPT180; and 36 of 37 participants for EXDMPT60 were within 2 SDs of the mean in Trial 2 (95% CI; see Figure 4).

4. Discussion

Isokinetic dynamometers are often used for muscle strength measurement in athletes. Muscle strength is one of the important parameters that affects sports performance [2]. The aim of this study was to assess the intra- and inter-rater reliability of a well-used and a less-used IsoMed-2000 dynamometer for knee flexion and extension PT measurements in a concentric test in athletes. The intra- and inter-rater reliability of knee muscle strength measurements is fundamentally vital to both clinical and research considerations because muscle strength measurement is frequently used both in the determination of sports performance and in the stage of returning to sports after sports injuries [4]. The findings of this demonstrate the intra and inter-rater reliability of a well-used and a less-used IsoMed-2000 dynamometer for knee flexion and extension peak torque measurements in a concentric test in athletes.
In this study, intra-rater reliability was moderate to excellent (ICCs: 0.516–0.928) for knee muscle strength parameters. Low standard errors of measurement (SEM) were observed in most of the measurements between trials (SEM:0.08–0.28 N/kg for old dynamometer and SEM: 0.08–0.29 N /kg for new dynamometer). The highest SEM and SDC95 were found in the EXDMPT60 and EXNDMPT60 measures for old and new dynamometers. SDC95 ranged between 0.24 to 0.76 for the old dynamometer and 0.25 to 0.80 for the new dynamometer. SDC% ranged between 9.50% to 24.79% for the old dynamometer and 11% to 26.87% for the new dynamometer. The highest SDC% were found in FLDMPT180, followed by the FLNDMPT180 and EXNDMPT60 measures for old dynamometer. The highest SDC% were found in FLDMPT180, followed by the FLNDMPT60 measure for the new dynamometer. At least 94.5% of the obtained values of parameters in the old dynameter and 91.8% in the new dynamometer fell within the 95% limits of agreement.
Inter-rater reliability was moderate to excellent (ICCs: 0.519–915) for knee muscle strength parameters. Low standard errors of measurement (SEM) were observed in most of the measurements between the old and new dynamometers (SEM: 0.08–0.29 N/kg for trial 1 and SEM: 0.09–0.29 N /kg for trial 2). The smallest detectable change (SDC95) ranged between 0.22 to 0.80 for Trial 1 and 0.25 to 0.81 for Trial 2. The highest SEM and SDC95 were found in the EXDMPT60 and EXNDMPT60 measures for old and new dynamometers. SDC% ranged between 8.75% to 26.74% for Trial 1 and 10.17% to 26.85% for Trial 2. The highest SDC% were found in EXNDMPT60 followed by the FLDMPT180 and FLNDMPT180 measures for Trial 1. The highest SDC% were found in FLNDMPT60 followed by the EXDMPT60 and FLDM60PT measures for Trial 2. At least 91.8% of the obtained values of the parameters in Trail 1 and 89.2 % in Trial 2 fell within the 95% limits of agreement.
When interpreting the results of our study, it is more accurate to interpret SDC% values instead of SEM and SDC95 because the measurement results are not standard. In a healthy athlete who has not suffered any injury, the strength of the knee flexors is always less than the strength of the knee extensor muscles [26]. In fact, it has been shown in the literature that the strength ratio of the knee flexor and extensor muscles is between 0.50–0.60 [26]. Considering the SDC95 value, it can be thought that knee extensor muscles with higher values are evaluated differently. Due to this situation, it would be more accurate to interpret the SDC% value instead of the SDC95 value. As evident when interpreting by taking the SDC% value into account, there are some differences between the two measurements and the two devices, and between the strength measurements of both the flexor and extensor muscles. Although there are some differences in the measured parameters, the values of the parameters obtained from at least 89.2% of them fall within the 95% agreement limits considering the parameters mentioned above; our findings demonstrate the intra and inter-rater reliability of a well-used and a less-used IsoMed-2000 dynamometer for knee flexion and extension peak torque measurements in a concentric test in athletes.
There is no information about the usage time of these dynamometers and how muscle strength measurement is affected. Our hypothesis was that even if isokinetic dynamometers are the gold standard, the usage time will affect the measurement outputs of the dynamometers. As a result of this study, the hypothesis that the muscle strength measurement of isokinetic dynamometers will change with the usage time has not been accepted. We were not able to find previous studies that compared torque values obtained through isokinetic tests performed in the same isokinetic dynamometers with different usage times. This is the first study using the same brand and model isokinetic dynamometer with different usage time for knee flexion and extension PT in athletes to investigate the usage time effect on effectiveness of dynamometers in measuring muscle strength.
Data on the reliability between the test and retest were reliable when knee flexion and extension were performed at 60°/s and 180°/s; for both old and new dynamometers, the intra-rater reliabilities of the eight measures were good (ICC = 0.516–0.928). These results are consistent with the literature, and we think that the fact that the individuals included in our study were athletes and that these athletes were tested twice a year with isokinetic dynamometers affects the coefficient of compliance because it is stated that getting used to the dynamometer and the test will affect the reliability of the tests [11]. It is indicated in the literature that isokinetic concentric knee extensor and flexor strength variables were reliable when measured by the same examiner in asymptomatic subjects [27,28]. We think that the good reliability of the study was due to the fact that both the evaluation of the muscle strength of asymptomatic athletes and the strength measurements were carried out by the same physiotherapist.
Data on the reliability between the two dynamometers were also reliable when performing knee flexion and extension, showing values indicating good reliability for both trials. For the two trials, the inter-rater reliabilities of the eight measures are good (ICC = 0.519–0.915). We were not able to find studies that compare the same dynamometers, but we were able to find four previous studies that compared the torque values obtained through isokinetic tests performed in the Biodex and Cybex dynamometers [3,29,30,31]. Additionally, we found a study investigating the intermachine reliability of the Cybex 6000 and the Cybex II [32]. Although the isokinetic dynamometers tested in these studies were different from ours, these were the only investigations enabling a close comparison with the present study. In these studies, the concentric PT of the knee extensor and knee flexor muscles were evaluated at angular velocities of 60°/s, 180°/s and 240°/s [3,29,30,31]. These previous studies found reliable values for knee extensor and knee flexor concentric tests between two different dynamometers, and the relative reliability was consistent with our results [3,29,30,31]. There are different findings in these studies comparing the maximal knee extensor and knee flexor test results of the Biodex and Cybex dynamometers. For example, while in one study the PT values obtained from Biodex and Cybex are similar [3], in another study, the PT values obtained in Biodex are higher than Cybex [31]. In addition, it is found that PT values between the two dynamometers for the knee flexor are similar [29], only the PT values of the knee extensor are higher in Biodex [32], and the PT values of the knee flexor on Cybex are higher than Biodex [32]. Similarly in our study, we found that the old dynamometer measured EXDMPT60 and EXNDMPT60 lower than the new one for Trial 1 and Trial 2.

Limitations

Our study had a few limitations. Firstly, this was an intra- and inter-rater reliability study that involved a group of healthy weightlifting athletes who attended a laboratory. Therefore, the results of this study should be interpreted with caution. Thus, further research is needed to assess the intra- and inter-rater reliability of the IsoMed 2000 Dynamometer in different joints and after sports injuries. Future research should also overcome the bias of the current results by analyzing males and females separately, because it is suggested that there are gender effects on muscle strength [33]. Additionally, it is stated in the literature that it is impossible to guarantee that the person performs the test with exactly the same force during testing and training [3]. Although we applied the same warm-up protocol before each training and test session in our clinic, as well as using the same verbal and visual stimuli during measurement or training, there was no guarantee that athletes provided the same performance during testing and training. In addition, it was not possible for the athlete to both fully adapt to the training and the investigator to always behave the same (although the same verbal and visual motivation is used in tests and training). Additionally, this study investigated torque output between two dynamometers from same brand, but there was no control for torque signals or software creation to detect onset. These situations can be considered as the reason for the different measurement results between the two devices in our study and can be described as the other limitations of our study.

5. Conclusions

In conclusion, this study established the intra- and inter-rater reliability of well-used and less-used IsoMed 2000 dynamometers for knee flexion and extension peak torque of athletes in a concentric test. We found that maximal knee flexor and knee extensor tests performed in concentric contraction at 60°/s and 180°/s in IsoMed-2000 dynamometers with different usage time present similar PT values, and as a result of this study, the hypothesis that the muscle strength measurement of isokinetic dynamometers will change with the usage time has not been accepted. The IsoMed-2000 isokinetic dynamometer is suitable for evaluating muscle strength and muscle strength changes in athletes, and even though there are measurements errors, it is appropriate to use two different IsoMed-2000 dynamometers with different usage times interchangeably. This study provides useful information about the use of isokinetic dynamometers in physiotherapy and rehabilitation clinics to evaluate and develop muscle strength. It is also beneficial for athletes in terms of injury risk analysis and development of muscle strength following this development.

Author Contributions

Conceptualization, T.K. and B.A.; methodology, T.K., B.A. and A.E.Y.; software, T.K., B.A. and A.E.Y.; validation, T.K., B.A. and A.E.Y.; formal analysis, T.K., B.A. and A.E.Y.; investigation, T.K., B.A. and A.E.Y.; resources, T.K. and B.A.; data curation, T.K., B.A. and A.E.Y.; writing—original draft preparation, T.K., B.A., A.E.Y. and B.K.; writing—review and editing, T.K., B.A., T.R. and B.K.; visualization, T.K., B.A. and A.E.Y.; supervision, T.K., B.A., A.E.Y. and B.K.; project administration, T.K. and B.A.; funding acquisition, T.K. and B.A. All authors have read and agreed to the published version of the manuscript.

Funding

There is no any funding and any support.

Institutional Review Board Statement

The study was conducted according to the guidelines of the Declaration of Helsinki, and approved by the Ankara Yildirim Beyazıt University Ethical Committee (protocol code 19 and date: 5 February 2020).

Informed Consent Statement

Informed consent was obtained from all subjects involved in the study.

Data Availability Statement

The data of this study can provide from Department of Health Services, Sports General Directorship, The Ministry of Youth and Sports, Center of Athlete Training and Health Research, Ankara, Turkey.

Acknowledgments

The authors express sincere gratitude to the athletes who participated in this trial; without them, this research would not have been possible.

Conflicts of Interest

There is not any conflict of interest.

References

  1. Achenbach, L.; Laver, L.; Walter, S.S.; Zeman, F.; Kuhr, M.; Krutsch, W. Decreased external rotation strength is a risk factor for overuse shoulder injury in youth elite handball athletes. Knee Surg. Sports Traumatol. Arthrosc. 2019, 28, 1–10. [Google Scholar]
  2. Faigenbaum, A.D.; Lloyd, R.S.; MacDonald, J.; Myer, G.D. Citius, Altius, Fortius: Beneficial effects of resistance training for young athletes: Narrative review. Br. J. Sports Med. 2016, 50, 3–7. [Google Scholar] [CrossRef] [Green Version]
  3. Alvares, J.B.A.R.; Rodrigues, R.; de Azevedo Franke, R.; da Silva, B.G.C.; Pinto, R.S.; Vaz, M.A.; Baroni, B.M. Inter-machine reliability of the Biodex and Cybex isokinetic dynamometers for knee flexor/extensor isometric, concentric and eccentric tests. Phys. Ther. Sports 2015, 16, 59–65. [Google Scholar] [CrossRef]
  4. Forthomme, B.; Croisier, J.-L.; Delvaux, F.; Kaux, J.-F.; Crielaard, J.-M.; Gleizes-Cervera, S. Preseason strength assessment of the rotator muscles and shoulder injury in handball players. J. Athl. Train. 2018, 53, 174–180. [Google Scholar] [CrossRef] [PubMed] [Green Version]
  5. Willigenburg, N.W.; McNally, M.P.; Hewett, T.E. Quadriceps and hamstrings strength in athletes. In Hamstring and Quadriceps Injuries in Athletes; Springer: New York, NY, USA, 2014; pp. 15–28. [Google Scholar]
  6. Kolber, M.J.; Cleland, J.A. Strength testing using hand-held dynamometry. Phys. Ther. Rev. 2005, 10, 99–112. [Google Scholar] [CrossRef]
  7. Jackson, S.M.; Cheng, M.S.; Smith, A.R., Jr.; Kolber, M.J. Intrarater reliability of hand held dynamometry in measuring lower extremity isometric strength using a portable stabilization device. Musculoskelet. Sci. Pract. 2017, 27, 137–141. [Google Scholar] [CrossRef]
  8. Sung, K.-S.; Yi, Y.G.; Shin, H.-I. Reliability and validity of knee extensor strength measurements using a portable dynamometer anchoring system in a supine position. BMC Musculoskelet. Disord. 2019, 20, 320. [Google Scholar] [CrossRef] [PubMed]
  9. Ferreira, R.; Araújo, J.P.; Barreira, P.; Loureiro, N.; Diesel, W. Preseason Evaluation. In Injuries and Health Problems in Football; Springer: Berlin/Heidelberg, Germany, 2017; pp. 493–514. [Google Scholar]
  10. Baltzopoulos, B.; King, M.; Gleeson, N.; De Ste Croix, M. The BASES expert statement on measurement of muscle strength with isokinetic dynamometry. Sport Exerc. Sci. 2012, 31, 12–13. [Google Scholar]
  11. Dirnberger, J.; Wiesinger, H.-P.; Stöggl, T.; Kösters, A.; Müller, E. Absolute und relative Kraftausdauer der Kniebeuge-und-streckmuskulatur: Eine Reliabilitätsstudie unter Verwendung des IsoMed 2000-Dynamometers. Sportverletz. Sportsc. 2012, 26, 142–147. [Google Scholar] [CrossRef] [PubMed]
  12. Maffiuletti, N.A.; Bizzini, M.; Desbrosses, K.; Babault, N.; Munzinger, U. Reliability of knee extension and flexion measurements using the Con-Trex isokinetic dynamometer. Clin. Physiol. Funct. Imaging 2007, 27, 346–353. [Google Scholar] [CrossRef] [PubMed]
  13. Dirnberger, J.; Kösters, A.; Müller, E. Concentric and eccentric isokinetic knee extension: A reproducibility study using the IsoMed 2000-dynamometer. Isokinet. Exerc. Sci. 2012, 20, 31–35. [Google Scholar] [CrossRef]
  14. Lund, H.; Søndergaard, K.; Zachariassen, T.; Christensen, R.; Bülow, P.; Henriksen, M.; Bartels, E.; Danneskiold-Samsøe, B.; Bliddal, H. Learning effect of isokinetic measurements in healthy subjects, and reliability and comparability of Biodex and Lido dynamometers. Clin. Physiol. Funct. Imaging 2005, 25, 75–82. [Google Scholar] [CrossRef]
  15. Jenkins, N.D.; Palmer, T.B.; Cramer, J.T. Comparisons of voluntary and evoked rate of torque development and rate of velocity development during isokinetic muscle actions. Isokinet. Exerc. Sci. 2013, 21, 253–261. [Google Scholar] [CrossRef]
  16. Guilhem, G.; Giroux, C.; Couturier, A.; Maffiuletti, N.A. Validity of trunk extensor and flexor torque measurements using isokinetic dynamometry. J. Electromyogr. Kinesiol. 2014, 24, 986–993. [Google Scholar] [CrossRef] [PubMed]
  17. Cohen, J. Statistical Power Analysis for the Behavioral Sciences; Routledge Academic: New York, NY, USA, 1988. [Google Scholar]
  18. Faul, F.; Erdfelder, E.; Buchner, A.; Lang, A.-G. Statistical power analyses using G* Power 3.1: Tests for correlation and regression analyses. Behav. Res. Methods 2009, 41, 1149–1160. [Google Scholar] [CrossRef] [Green Version]
  19. Lehnert, B. Package ‘BlandAltmanLeh’. Available online: https://cloud.r-project.org/web/packages/BlandAltmanLeh/BlandAltmanLeh.pdf (accessed on 23 December 2015).
  20. Shrout, P.E.; Fleiss, J.L. Intraclass correlations: Uses in assessing rater reliability. Psychol. Bull. 1979, 86, 420. [Google Scholar] [CrossRef]
  21. Koo, T.K.; Li, M.Y. A guideline of selecting and reporting intraclass correlation coefficients for reliability research. J. Chiropr. Med. 2016, 15, 155–163. [Google Scholar] [CrossRef] [PubMed] [Green Version]
  22. Portney, L.G.; Watkins, M.P. Foundations of Clinical Research: Applications to Practice; Pearson/Prentice Hall: Upper Saddle River, NJ, USA, 2009; Volume 892. [Google Scholar]
  23. Weir, J.P. Quantifying test-retest reliability using the intraclass correlation coefficient and the SEM. J. Strength Cond. Res. 2005, 19, 231–240. [Google Scholar] [PubMed]
  24. Lee, P.; Liu, C.-H.; Fan, C.-W.; Lu, C.-P.; Lu, W.-S.; Hsieh, C.-L. The test–retest reliability and the minimal detectable change of the Purdue Pegboard Test in schizophrenia. J. Formos. Med. Assoc. 2013, 112, 332–337. [Google Scholar] [CrossRef] [Green Version]
  25. Bland, J.M.; Altman, D. Statistical methods for assessing agreement between two methods of clinical measurement. Lancet 1986, 327, 307–310. [Google Scholar] [CrossRef]
  26. Vargas, V.Z.; Motta, C.; Peres, B.; Vancini, R.L.; Andre Barbosa De Lira, C.; Andrade, M.S. Knee isokinetic muscle strength and balance ratio in female soccer players of different age groups: A cross-sectional study. Phys. Sportsmed. 2020, 48, 105–109. [Google Scholar] [CrossRef]
  27. Muñoz-Bermejo, L.; Pérez-Gómez, J.; Manzano, F.; Collado-Mateo, D.; Villafaina, S.; Adsuar, J.C. Reliability of isokinetic knee strength measurements in children: A systematic review and meta-analysis. PLoS ONE 2019, 14, e0226274. [Google Scholar] [CrossRef] [PubMed]
  28. Sole, G.; Hamrén, J.; Milosavljevic, S.; Nicholson, H.; Sullivan, S.J. Test-retest reliability of isokinetic knee extension and flexion. Arch. Phys. Med. Rehabil. 2007, 88, 626–631. [Google Scholar] [CrossRef]
  29. Thompson, M.C.; Shingleton, L.G.; Kegerreis, S.T. Comparison of values generated during testing of the knee using the Cybex II Plus® and Biodex Model B-2000® isokinetic dynamometers. J. Orthop. Sports Phys. Ther. 1989, 11, 108–115. [Google Scholar] [CrossRef] [Green Version]
  30. Gross, M.T.; Huffman, G.M.; Phillips, C.N.; Wray, J.A. Intramachine and intermachine reliability of the Biodex and Cybex® II for knee flexion and extension peak torque and angular work. J. Orthop. Sports Phys. Ther. 1991, 13, 329–335. [Google Scholar] [CrossRef] [Green Version]
  31. Keilani, M.; Posch, M.; Zorn, C.; Knötig, M.; Pircher, M.; Quittan, M.; Fialka-Moser, V.; Jirasek, U.; Crevenna, R. Comparison of values generated during isokinetic-testing of the knee extensor and flexor muscles using the cybex 6000 and biodex 3 isokinetic dynamometer. Phys. Med. Rehab. Kuror. 2007, 17, 327–333. [Google Scholar] [CrossRef]
  32. Bandy, W.D.; McLaughlin, S. Intramachine and intermachine reliability for selected dynamic muscle performance tests. J. Orthop. Sports Phys. Ther. 1993, 18, 609–613. [Google Scholar] [CrossRef] [PubMed]
  33. Harbo, T.; Brincks, J.; Andersen, H. Maximal isokinetic and isometric muscle strength of major muscle groups related to age, body mass, height, and sex in 178 healthy subjects. Eur. J. Appl. Physiol. 2012, 112, 267–275. [Google Scholar] [CrossRef] [PubMed]
Figure 1. Bland–Altman plots for the intra-rater reliability of the old dynamometer based on the mean of two trials in eight measures. The first dashed line represents Mean–1.96 × SD, the second dashed line represents Mean, and the third dashed line represents Mean + 1.96 × SD. The grey circles indicate differences beyond the 95% confidence limits.
Applsci 11 04951 g001
Figure 2. Bland–Altman plots for the intra-rater reliability of the new dynamometer based on the mean of two trials in eight measures. The first dashed line represents Mean–1.96 × SD, the second dashed line represents Mean, and the third dashed lines represent Mean + 1.96 × SD. The grey circles indicate differences beyond the 95% confidence limits.
Applsci 11 04951 g002
Figure 3. Bland–Altman plots for the inter-rater reliability of Trial 1, based on the mean of two dynamometers in eight measures. The first dashed line represents Mean–1.96 × SD, the second dashed line represents Mean, and the third dashed line represents Mean + 1.96 × SD. The grey circles indicate differences beyond the 95% confidence limits.
Applsci 11 04951 g003
Figure 4. Bland–Altman plots for the inter-rater reliability of Trial 2 based on the mean of two dynamometers in eight measures. The first dashed line represents Mean–1.96 × SD, the second dashed line represents Mean, and the third dashed line represents Mean + 1.96 × SD. The grey circles indicate differences beyond the 95% confidence limits.
Applsci 11 04951 g004
Table 1. Descriptive statistics (n = 37).
VariableMeanSDMedianRange [Min-Max]
Age (years)16.70.817.04.0 [15.0–19.0]
Body Mass (kg)66.310.166.143.1 [48.4–91.5]
Height (m)1.650.071.670.26 [1.51–1.78]
Experience (year)4.81.45.05.0 [3.0–8.0]
SD: Standard deviation.
Table 2. The day-dynamometer matches of Isokinetic measurement of the athletes.
First EvaluationSecond EvaluationThird EvaluationForth Evaluation
First Group
(n = 18)
New DynamometerOld DynamometerOld DynamometerNew Dynamometer
Second Group
(n = 19)
Old DynamometerNew DynamometerNew DynamometerOld Dynamometer
Table 3. Intra-rater reliability of the old dynamometer.
Measures (N/W)Trial 1Trial 2Bland-Altman
MeanSDMeanSDMDaSD95% LoAICC95% CISEMSDC95SDC%
FLDMPT601.510.241.520.26–0.020.12–0.26 + 0.220.8880.794;0.9400.080.2415.52
EXDMPT603.060.343.070.40–0.010.28–0.55 + 0.540.6810.459;0.8220.200.5917.91
FLNDMPT601.450.261.490.25–0.040.12–0.28 + 0.200.8830.779;0.9390.080.2416.00
EXNDMPT602.910.453.000.53–0.080.31–0.69 + 0.530.7880.627;0.8850.220.6120.56
FLDMPT1801.240.191.290.22–0.050.16–0.36 + 0.260.6590.431;0.8080.110.3124.79
EXDMPT1802.460.272.490.31–0.040.12–0.28 + 0.200.9110.831;0.9540.080.249.50
FLNDMPT1801.210.201.250.21–0.040.13–0.29 + 0.210.7850.616;0.8840.090.2520.72
EXNDMPT1802.440.322.470.35–0.040.12–0.28 + 0.200.9280.864;0.9630.080.249.58
N: newton, W: Weight, FL: Flexion, EX: Extension, DM: Dominant, NDM: Non-Dominant, PT: Peak Torque, 60: 60°/s, 180: 180°/s, MD: Mean Difference; ICC: Absolute Intraclass Correlation Coefficient; SEM: Standard Error of Measurement; SDC95: Smallest Detectable Change at the 95% Confidence Interval. a: difference scores were calculated by subtracting Trial 1 from Trail 2.
Table 4. Intra-rater reliability of new dynamometer.
Measures (N/W)Trial 1Trial 2Bland-Altman
MeanSDMeanSDMDaSD95% LoAICC95% CISEMSDC95SDC%
FLDMPT601.460.251.500.25–0.020.12–0.26 + 0.220.6400.404;0.7960.080.2415.89
EXDMPT603.300.373.200.540.010.30–0.58 + 0.600.5160.241;0.7160.210.5918.09
FLNDMPT601.420.231.430.28–0.010.19–0.38 + 0.360.7340.438;0.8130.130.3726.13
EXNDMPT603.100.643.160.55–0.060.39–0.82 + 0.700.7860.624;0.8830.280.7624.42
FLDMPT1801.210.181.270.21–0.060.17–0.39 + 0.270.6010.349;0.7720.120.3326.87
EXDMPT1802.470.282.520.31–0.050.14–0.32 + 0.220.8760.767;0.9350.100.2711.00
FLNDMPT1801.170.171.220.20–0.050.14–0.32 + 0.220.7210.517;0.8460.100.2722.96
EXNDMPT1802.480.382.530.37–0.050.16–0.36 + 0.260.9010.813;0.9490.110.3112.52
N: newton, W: Weight, FL: Flexion, EX: Extension, DM: Dominant, NDM: Non-Dominant, PT: Peak Torque, 60: 60°/s, 180: 180°/s, MD: Mean Difference; ICC: Absolute Intraclass Correlation Coefficient; SEM: Standard Error of Measurement; SDC95: Smallest Detectable Change at the 95% Confidence Interval. a: difference scores were calculated by subtracting Trial 1 from Trail 2.
Table 5. Inter-rater reliability of trial 1.
Measures (N/W)OldNewBland-Altman
MeanSDMeanSDMDaSD95% LoAICC95% CISEMSDC95SDC%
FLDMPT601.510.241.460.250.040.14–0.24 + 0.320.8180.672;0.9030.100.2818.82
EXDMPT603.060.343.300.37–0.24 **0.31–0.84 + 0.370.5190.102;0.7540.220.6019.00
FLNDMPT601.450.261.420.230.040.13–0.21 + 0.290.8490.726;0.9190.080.2517.76
EXNDMPT602.910.453.100.64–0.19 **0.41–0.99 + 0.610.6880.438.8330.220.8026.74
FLDMPT1801.240.191.210.180.030.15–0.26 + 0.320.6680.445.8130.110.2924.00
EXDMPT1802.460.272.470.28–0.010.11–0.23 + 0.210.9150.842;0.9550.080.228.75
FLNDMPT1801.210.201.170.170.030.14–0.24 + 0.300.7270.532;0.8490.090.2723.06
EXNDMPT1802.440.322.480.38–0.040.18–0.39 + 0.310.8680.759;0.9290.080.3514.34
N: newton, W: Weight, FL: Flexion, EX: Extension, DM: Dominant, NDM: Non-Dominant, PT: Peak Torque, 60: 60°/s, 180: 180°/s, MD: Mean Difference; ICC: Absolute Intraclass Correlation Coefficient; SEM: Standard Error of Measurement; SDC95: Smallest Detectable Change at the 95% Confidence Interval. a: difference scores were calculated by subtracting Trial 1 from Trail 2. ** items were statistically significant at p < 0.01.
Table 6. Inter-rater reliability of trial 2.
Measures (N/W)OldNewBland-Altman
MeanSDMeanSDMDaSD95% LoAICC95% CISEMSDC95SDC%
FLDMPT601.520.261.500.250.030.20–0.36 + 0.410.7120.509;0.8400.140.3825.37
EXDMPT603.080.403.200.54–0.120.42–0.94 + 0.690.6030.354;0.7730.290.8125.92
FLNDMPT601.490.251.430.280.060.20–0.33 + 0.450.7150.511;0.8430.140.3926.85
EXNDMPT603.000.533.160.55–0.17 **0.36–0.88 + 0.540.7400.514;0.8640.250.7122.91
FLDMPT1801.290.221.270.210.020.16–0.29 + 0.330.7230.536;0.8470.110.3124.50
EXDMPT1802.490.312.520.31–0.020.13–0.27 + 0.230.9090.831;0.9520.090.2510.17
FLNDMPT1801.250.211.220.200.030.14–0.24 + 0.300.7740.606;0.8770.100.2722.22
EXNDMPT1802.470.352.530.37–0.06 *0.16–0.37 + 0.250.8910.790;0.9430.110.3112.54
N: newton, W: Weight, FL: Flexion, EX: Extension, DM: Dominant, NDM: Non-Dominant, PT: Peak Torque, 60: 60°/s, 180: 180°/s, MD: Mean Difference; ICC: Absolute Intraclass Correlation Coefficient; SEM: Standard Error of Measurement; SDC95: Smallest Detectable Change at the 95% Confidence Interval. a: difference scores were calculated by subtracting old from new dynamometer. * items were statistically significant at p < 0.05. ** items were statistically significant at p < 0.01.
Publisher’s Note: MDPI stays neutral with regard to jurisdictional claims in published maps and institutional affiliations.

