Article

ATP Bioluminescence for Rapid and Selective Detection of Bacteria and Yeasts in Wine

1
Department of Food and Drug, University of Parma, Parco Area delle Scienze 49/A, 43124 Parma, Italy
2
Promicol BV, De Asselen Kuil 12, 6161 RD Geleen, The Netherlands
*
Author to whom correspondence should be addressed.
Appl. Sci. 2021, 11(11), 4953; https://doi.org/10.3390/app11114953
Submission received: 4 May 2021 / Revised: 25 May 2021 / Accepted: 26 May 2021 / Published: 27 May 2021

Abstract

:
Microbial contamination may represent a loss of money for wine producers as several defects can arise due to a microorganism’s growth during storage. The aim of this study was to implement a bioluminescence assay protocol to rapidly and simultaneously detect bacteria and yeasts in wines. Different wines samples were deliberately contaminated with bacteria and yeasts at different concentrations and filtered through two serial filters with decreasing mesh to separate bacteria and yeasts. These were resuscitated over 24 h on selective liquid media and analyzed by bioluminescence assay. ATP measurements discriminated the presence of yeasts and bacteria in artificially contaminated wine samples down to 50 CFU/L of yeasts and 1000 CFU/L of bacteria. The developed protocol allowed to detect, rapidly (24 h) and simultaneously, bacteria and yeasts in different types of wines. This would be of great interest for industries, for which an early detection and discrimination of microbial contaminants would help in the decision-making process.

1. Introduction

Microbial contamination may represent a consistent loss of money for wine producers, due to both yeasts and bacteria contaminating wines after primary fermentation. These would in fact lead to several defects, such as off-flavors or bottle explosions, causing the discard of products. Usually, wineries use culture-dependent methods to assess the microbial loads during the wine-making process. Although accurate, these are time-consuming, and the results are often obtained too late to be useful. Furthermore, certain strains of spoilage microorganisms exist in a viable but non-cultivable state giving the possibility of microbial contamination to arise quickly and without any warning [1]. Recognizing contaminations in time is fundamental to avoid economical losses but can be very tricky since a specific problem in wine can be provoked by different microorganisms such as lactic acid bacteria (LAB) or yeasts [2]. For these reasons it is important to develop a system that is faster than plating but also able to discriminate between different sources of microbial contamination. Several molecular-based testing methods have been developed to detect spoilage microorganisms in wine, such as bio- and nanosensors, fluorescence cells sorting, and real-time polymerase chain reaction (RT-PCR). These methods have their advantages, but they can be complex and require trained personnel. Commercial kits for microbial evaluation are also available for wineries, although they cannot simultaneously detect multiple spoilage microorganisms at one time [1]. In recent years an alternative was proposed to analyze food in a shorter time and with a higher level of accuracy with respect to culture-based methods: bioluminescence [3]. Since the beginning of life on Earth, cells have faced the problem of storing the energy produced by metabolism to sustain life processes, growth, and colonization of the environment. Energy in almost all the organisms is stored in the bonds of adenosine triphosphate (ATP). The structure of ATP is a nucleoside triphosphate, consisting of a nitrogenous base (adenine), a ribose sugar, and three serially bonded phosphate groups. To release the energy stored in the bonds between each phosphorus, cells dephosphorylate the ATP, forming adenosine diphosphate (ADP) and adenosine monophosphate (AMP). ATP can be regenerated by reducing the chemical components of nutrients to synthesize new molecules of ATP. Cellular ATP can be measured thanks to bioluminometer systems based on the discovery of McElroy and Green [4]; they showed the involvement of fireflies’ (Photinus pyralis) bioluminescence reaction in the production of a light signal that can be detected, measured, and expressed as relative light units (RLUs) and correlated with the number of cells in the analyzed media [5]. The reaction involves ATP, luciferin, luciferase, magnesium, and oxygen. Chemically, ATP transfers its energy to the luciferin and forms luciferyl adenylate. The luciferyl adenylate is then oxidized by the luciferase in the presence of magnesium ions to form oxyluciferin, carbon dioxide, adenosine monophosphate, and pyrophosphates, emitting light as a reaction result [6]. Luciferin reacts with ATP from microbial cells thanks also to specific reagents, added during the analysis, permitting in this way the formation of light from ATP produced by freshly lysed cells [7]. The produced luminous signal can be amplified and read by a bioluminometer. As ATP is rapidly degraded when the cells die, the measurement of bioluminescence is considered a reliable tool to detect microbial contamination. The improvement in the reagent quality and instrument sensitivity has led to the availability of several applications in many branches of the food industry, and many kits are now commercially available [7]. Carbonated beverages, beer, fruit juices, and wines have been analyzed by ATP assay [6,7,8]. However, the bioluminescence assay is a non-specific method, so it is not able to discriminate between different microbial sources of contamination. For this reason, a bioluminometer is not frequently employed in the oenological field, where producers have the necessity to discriminate between bacterial or fungal contamination [9]. Yeast contamination, when arising after the primary fermentation, can cause a severe loss of money due to problems like fogginess, haziness, and bottle explosions [10]. On the other hand, a bacterial contamination is more unlikely to happen, but it can be still a big issue for wineries. Bacteria proliferation can lead to a series of defects that are not possible to detect from visual inspection of the bottles, mainly due to bacterial metabolism, such as lactic prickle, bitterness, production of volatile phenols, mousiness, production of biogenic ammines, and production of ethyl carbamate, a highly harmful molecule [11,12]. Thus, the choice of a method able to detect and distinguish the contamination from yeasts and bacteria would be of primary importance [13].
In this optic, this study aimed at investigating the possibility of using the bioluminescence assay to simultaneously detect LAB and yeasts in wine samples.

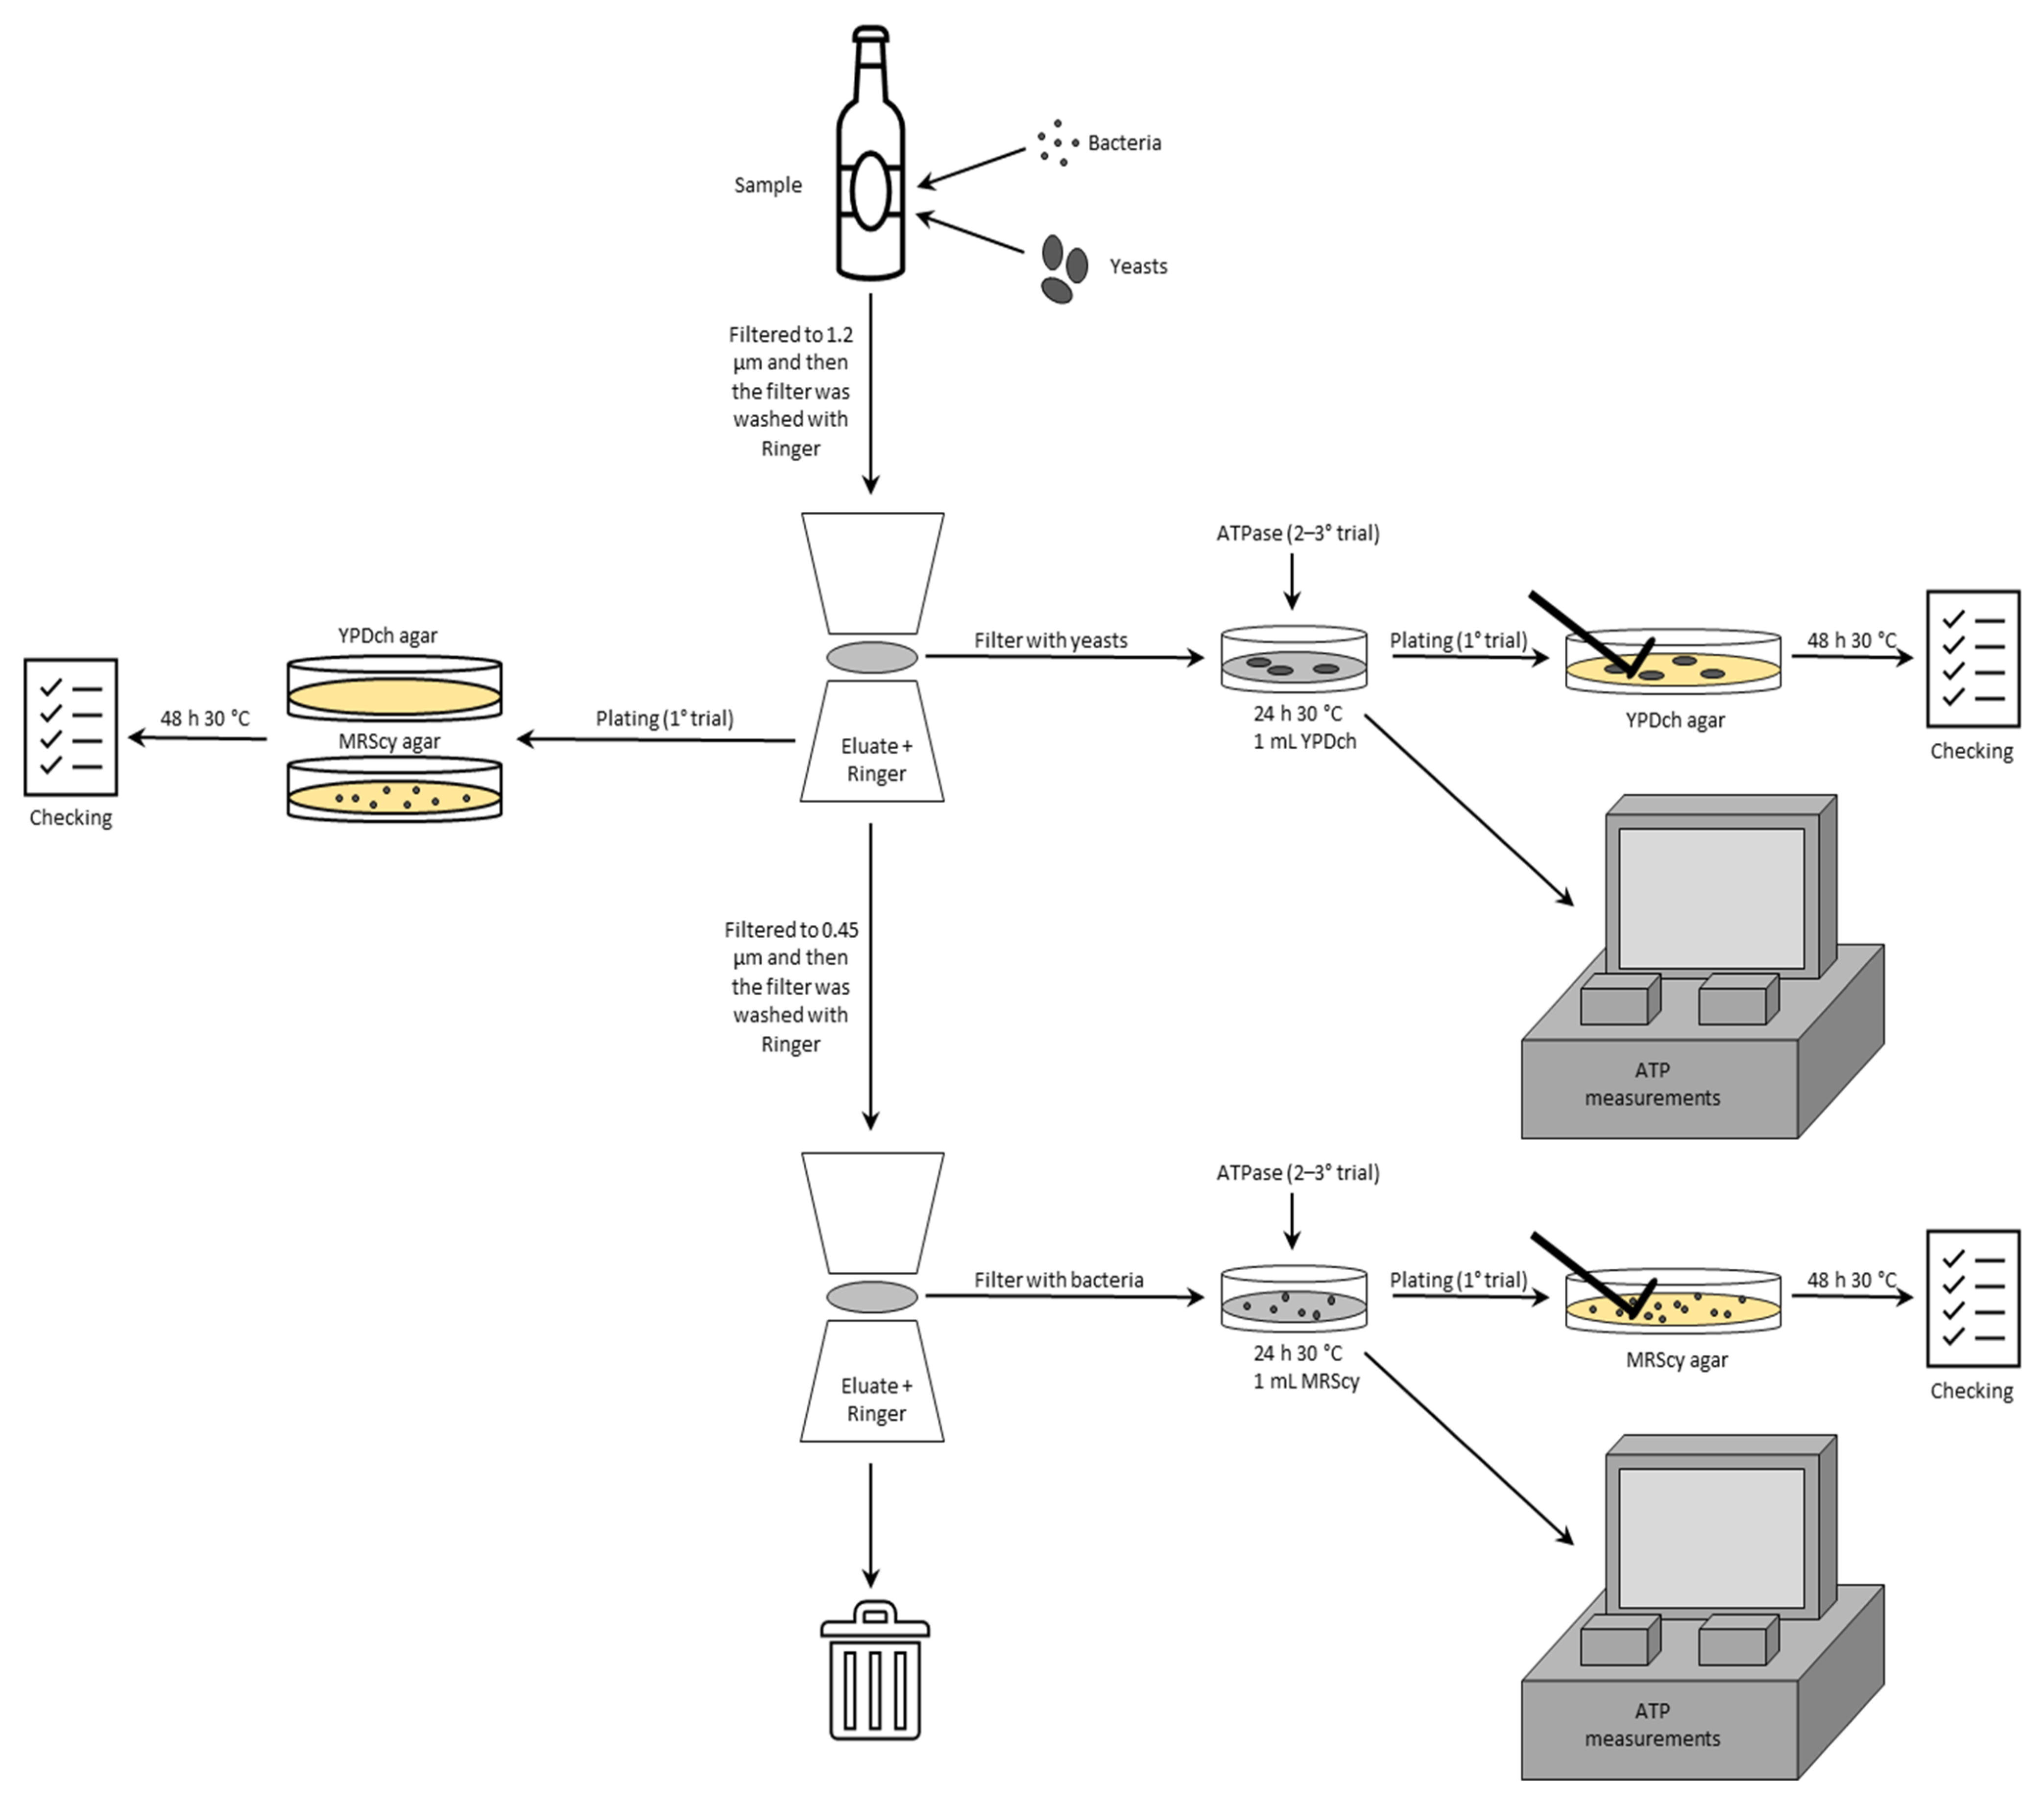
2. Materials and Methods

2.1. Wine Samples

In the present study, 15 wines and 2 vermouths were collected by 3 different Italian wineries (Table 1). Four types of wines were considered: red, white, sparkling, and still. Alcohol and sugar content of the tested wines as indicated by the producers are reported in Table 1.
For each wine, two bottles were analyzed. Wines were filtered with 0.45 µm cellulose filters to achieve sterilization, which was verified both with the bioluminescence assay by means of the bioluminometer Promilite M1® (Promicol, Geleen, The Netherlands) and plate counting on MRS (De Man Rogosa Sharpe, Oxoid, Milan, Italy) agar, by incubating plates for 72 h at 30 °C.
After filtration, the wines were deliberately inoculated with a known concentration of bacteria and yeasts to simulate contamination.

2.2. Bacterial Strains and Deliberate Wine Contamination

For the contamination of samples, two strains of Saccharomyces cerevisiae were used, one (SC1) belonging to the microbial collection of the Department of Food and Drug of the University of Parma and one (Premium Prosecco, Vason®, Verona, Italy) belonging to the microbial collection of G.I.V. (Gruppo Italiano Vini, Calmasino di Bardolino, Verona, Italy). These two strains were used together in a 1:1 mix of the respective overnight cultures to simulate yeast contamination in wine samples. On the other hand, to simulate contamination by LAB, of relevance for malolactic fermentation, one Pediococcus pentosaceus (Pp 2089) strain, belonging to the microbial collection of the Department of Food and Drug of the University of Parma, was used.
Bacteria and yeast were stored at −80 °C, in MRS (De Man Rogosa Sharpe, Oxoid, Milan) with 12.5% of glycerol for bacteria, and YPD (AMRESCO LLC, Ohio) with 12.5% of glycerol for yeasts. Cultures were then revitalized inoculating 200 μL of thawed cultures in 6 mL of sterile MRS (De Man Rogosa Sharpe, Oxoid, Milan, Italy) for LAB, and YPD for yeasts. Both media were incubated for 24 h at 30 °C in aerobic conditions. Overnight cultures were microscopically counted on glass counters to verify the microbial cell load (data not shown). Overnight growth showed an average concentration of 107 CFU/mL for yeasts and 109 CFU/mL for Pp 2089.
Decimal dilutions from the overnight cultures were prepared in Ringer’s solution (Oxoid, Milan) for each strain, to achieve the concentration to be used for the inoculum.
In a first trial, twelve wines (R1–6; W1–6) were inoculated with 2 different cell concentrations: (i) 104 CFU/mL yeasts and 107 CFU/mL LAB and (ii) 104 CFU/mL yeasts and 103 CFU/mL LAB. These inocula were chosen to mimic microbial populations possibly present in wines [10,14,15].
In a second trial, 3 wines (W7–8, R7) and 2 vermouths (V1–2) were inoculated with 1000 CFU/L LAB and 50 CFU/L yeasts, indicated by the producers as the maximum microbial concentration tolerated to consider the wines stable during shelf life. The wines for the second trial were chosen as representative cases among the product indicated by the producers as the potentially most susceptible to microbial spoilage.
The same samples, 3 wines (W7–8, R7) and 2 vermouths (V1–2), were inoculated with the same microbial concentration of the second trial and analyzed in a third trial, with modified cells in resuscitation conditions.

2.3. Bioluminescence Assay

Bioluminescence assays were carried out with the Promilite M1® instrument (Promicol, Geleen, The Netherlands). The manufacturer’s protocol was modified as follows: 50 mL of inoculated wine samples was filtered using a vacuum filtration unit (Millipore, Darmstadt, Germany) through a cellulose filter (Whatman, Buckinghamshire, UK) with a mesh of 1.2 µm to retain yeasts (Figure 1, top part). The filters were then washed with 100 mL of Ringer’s solution (Oxoid, Milan, Italy) to remove any residual alcohol and pigments from wine. These eluates (50 mL + 100 mL) from the first filtration were collected and filtered a second time on a 0.45 µm cellulose filter (Membrane Solutions; Auburn, Alabama) to retain bacteria, and the filters were subsequently washed with 100 mL of Ringer’s solution (Oxoid, Milan, Italy) (Figure 1, bottom part).
Each filter was then transferred with sterile tweezers in a sterile Petri plate, added with the appropriate medium, and incubated at the proper conditions to resuscitate microorganisms. For the first trial (R1–6; W1–6), 1.2 µm filters were incubated for 24 h at 30 °C in aerobic conditions with 1 mL of YPD added with 0.5 g/L chloramphenicol (YPDch) (Sigma-Aldrich, St. Louis, MO, USA) to resuscitate yeasts, while hampering LAB growth [16]; 0.45 µm filters were incubated 24 h at 30 °C in aerobic conditions with 1 mL of MRS (De Man Rogosa Sharpe broth, Oxoid, Milan, Italy) added with 0.5 g/L of cycloheximide (MRScy) (Sigma-Aldrich, St. Louis, MO, USA) to resuscitate LAB, while hampering the growth of yeasts [17].
For the second trial (W7, W8, R7, V1, V2) filters were incubated as above, with the addition of 100 µL ATPase (Promicol, Geleen, The Netherlands). ATPase hydrolyzes free ATP, allowing to evaluate only ATP from the microorganisms grown in the medium, while lowering the background noise deriving from free ATP.
For the third trial (W7, W8, R7; V1, V2) filters were incubated as above, substituting MRScy and YPDch with 1 mL of resuscitation medium (Promicol, Geleen, The Netherlands) added, respectively, with 0.5 g/L cycloheximide (REScy) or 0.5 g/L chloramphenicol (RESch).
After incubation, 50 µL of the growth media was analyzed with the bioluminometer Promilite M1® (Promicol, Geleen, The Netherlands) according to the manufacturer instructions. For MRScy samples from the 1 trial set, 100 µL of neutralizing reagent (Promicol, Geleen, The Netherlands) was added in the analysis vial, as the high concentration of LAB in the inoculum lowers the pH to values interfering with the correct RLU reading (Promilite M1® instrument and software manual, Promicol, The Netherlands, 2019). All samples were analyzed in duplicate, and the bioluminescence assay was repeated 3 times for each sample. Results were expressed in RLU.
For correct interpretation of the results, blank values were also determined by analyzing the resuscitation media, incubated without the inoculum, at the same conditions of wine samples. Presence of microorganisms was confirmed by an RLU value of 3 times the RLU value of the blank sample. Otherwise, if the RLU value was between 2 and 3 times the blank, the result of the analysis was defined uncertain, and the analysis was performed again after further incubation for a minimum of 6 h. The medium is considered sterile if the RLU value is lower than 2 times the RLU of the blank (Table 2) (Promilite M1® instrument and software manual, Promicol, The Netherlands, 2019).

2.4. Plating

Spread plating was also performed to confirm the selectivity of filtration and media used for cell resuscitation. To verify the retention of yeasts after the first filtration step, 1.2 μm filters were transferred with sterile tweezers in sterile plates, added with 1 mL YPDch, and incubated for 24 h at 30 °C. A total 100 μL of the culture broth was then spread-plated on YPDch agar, incubated at 30 °C for 48 h, and then counted (Figure 1, top right). Meanwhile, 100 μL of the eluates after the first filtration step was spread on both MRScy agar (Oxoid, Milan) and YPDch agar, to verify the presence of LAB (passed through the filter) and the absence of yeasts (retained on the filter) (Figure 1, top left). Plates were incubated for 48 h at 30 °C and then checked. Eluates left after the first filtration step were then filtered with 0.45 μm filters to retain LAB. These filters were then transferred with sterile tweezers in sterile plates, added with MRScy, and incubated for 24 h at 30 °C. A total 100 μL of the culture broth was then spread on MRScy agar (Oxoid, Milan) for 48 h at 30 °C and then checked (bottom right). Results were expressed as presence/absence.

3. Results

The ability of the bioluminescence assay to detect and discriminate microbial contamination at high and low concentrations in wine samples was investigated in this study. RLU values for the analyzed wines samples are reported in Table 3. For all the tested wines, the filtration steps and resuscitation of cells with the appropriate medium allowed for the detection of both bacteria and yeasts at high concentration (107 CFU/mL) in 24 h (Table 3).
The presence of yeasts (1.2 µm filters) or bacteria (0.45 µm filters) revealed by the bioluminescence assay (>3 times blank value) was confirmed by plating the resuscitation media (after growth) on the respective selective medium (Table 4). The effectiveness of filtration steps was confirmed by plating the eluates resulting from the first filtration step (1.2 µm) both on YPDch agar and MRScy agar (Figure 1, top left). As expected, all eluates plated on YPDch agar resulted in the absence of colonies, proving that no yeasts passed through the filter. At the same time, all eluates plated on MRScy agar formed colonies on the agar medium, confirming the crossing of bacteria through the filter.
These results were confirmed also for eluates from the first filtration (1.2 µm) of samples with the lowest bacterial concentration (103 CFU/mL LAB + 104 CFU/mL yeasts). Yeast colonies were absent in all YPDch agar plates, while LAB colonies were present in 3 out 12 MRScy agar plates. These could be explained by the high dilution factor of the bacteria concentration in the eluates. After the first filtration step (1.2 µm), the filter was washed with 100 mL of Ringers’ solution to reduce the residual alcohol and pigments of wine, diluting the bacteria concentration in the eluate (50 mL + 100 mL). This concentration was further reduced when spread-plating 100 µL of the eluate on the agar; thus, the number of expected colonies was lower than 10.
In analyzing wines with lower bacterial concentration, the bioluminescence assay was able to detect yeasts in all the tested samples and bacteria in R2, R5, R6, W1, W3, W4, W5, and W6 samples. These results were in agreement with plating for all the samples but one (R2).
After confirmation that the developed protocol was able to detect the microbial contamination in wines, discriminating between bacteria and yeasts, a second trial was set up, by inoculating five wine samples with the maximum tolerable microbial concentration to consider the tested wines shelf-stable, according to producers’ indications. The wines and vermouth samples were thus inoculated with 50 CFU/L of yeast and 1000 CFU/L of bacteria and analyzed according to the developed protocol. The results (Table 5) showed that the bioluminescence assay was able to detect (RLUs 3 times higher than blank values) both yeasts and bacteria in the wine samples, while only yeasts could be detected in the vermouth samples, when selective media were used for resuscitation of cells.
Finally, a last trial was set up, analyzing the same wine and vermouth samples according to the same protocol as above, but using the resuscitation medium (RES added with chloramphenicol or cycloheximide) provided by the bioluminescence manufacturer (Promicol, The Netherlands) instead of MRScy and YPDch. In this case (Table 5), both bacteria and yeasts were detected in all wine samples and in one vermouth sample.

4. Discussion

Differently from traditional methods used to detect microorganisms in wines, modern detection methods have focused on providing highly specific and rapid results capable of detecting microorganisms at very low populations [9]. Despite some successful applications of the ATP bioluminescence assay to wine samples [6,18,19], the method is not currently used in wineries mainly due to the lack of specificity.
In the present study we developed a protocol, which coupled a two-filtration step with the bioluminescence assay, allowing for the simultaneous detection of yeasts and bacteria in wines. Filtration of liquid samples prior to the bioluminescence assay, formerly proposed by other authors [18,19], to increase the concentration of microbial cells during analysis, eliminates compounds that quench light emission and stop bioluminescence inhibitors. However, one filtration step through a 0.45 µm pore size filter would retain all microbial cells [18], hampering the possibility to discriminate between ATP from yeasts or bacteria. In the present study, double filtration (1.2 µm first and 0.45 µm afterward) was applied to artificially contaminated wine samples with different amounts of a mixture of yeast and bacteria. The effectiveness of filtration steps was confirmed by spread-plating the eluates crossing the 1.2 µm filter on both YPDch and MRScy agar media selective for yeasts and bacteria, respectively. The absence of colonies on the YPDch agar plates confirmed that yeasts were retained on the 1.2 µm filter, while the presence of colonies on the MRScy agar plates confirmed that bacteria crossed that filter. Spread-plating on selective media was used also to confirm the presence/absence of yeasts on 1.2 µm filters and bacteria on 0.45 µm filters as revealed by the ATP measurements. Samples that tested positive by the bioluminometer (>3 times blank values) gave colonies on the respective plates. Other authors [19] found good correlation between plate growth of cells and light output from the ATP bioluminescence assay. Two different microbial concentrations, varying the amount of LAB, were used to contaminate wines. In both cases (LAB 107 and 104), ATP measurements were able to detect yeasts in all the tested wines, while bacterial contamination was detected in 8 samples out of 12. Several possible reasons may explain this result. After the first filtration step, 107 cells/mL of yeasts are retained on the 1.2 µm filter. This could limit the number of bacterial cells able to cross the filter, due to internal pore fouling [20]. On the other hand, other authors have previously reported the effectiveness of serial filtration for separating yeast cells from bacteria in beer, observing that all bacteria filtered avoided entrapment on a 1.2 µm filter and were successfully retained and cultivated on a 0.22 µm filter [21]. More recently, it has been observed that some bacteria and yeast present in a viable but non-cultivable state could pass through a 0.45 μm filter [11]. It is thus feasible that part of the bacteria inoculated in the wines could have entered in that state due to factors such as alcohol or filtration under vacuum [19], ending in the final eluate. On the other hand, stressful conditions could have led to cell death, hampering their detection both with ATP measurements and plating. RLU results were confirmed by plating the cultured resuscitation media on selective agar media for the samples, except one (R2), for which plating on MRScy did not reveal bacterial colonies at the lowest concentration. The limit of detection of the bioluminescence assay has been reported to be one cell per sample, similar to traditional plating [6]. However, it is known that culture-based assays may fail to detect viable but non-cultivable cells that still harbor measurable ATP [12].
The sensibility of the test was confirmed on a second trial, when wine samples were contaminated with the maximum tolerable microbial concentration to consider those wines shelf-stable (50 CFU/L of yeasts and 1000 CFU/L of bacteria), according to producers’ indications. Through the developed method, both bacteria and yeasts were detected in all the tested wine samples despite the very low concentration. The filtration steps involved in the protocol are in fact able to collect all the cells present in the total filtered volume of sample. Due to the very low number of yeasts on the first filter, pore fouling is unlikely, resulting in the passage of all the bacteria through the filter [21], which were detected after resuscitation. On the other hand, the analysis of artificially inoculated vermouth samples detected only yeasts. This could be due to the bacteria’s lower tolerance to alcohol [13], which is highly concentrated in vermouth, or to the presence of antimicrobials. In fact, vermouth is described as a fortified sweetened wine with added herbs and spices that are known to have anti-microbial characteristics, ascribed to essential oils [22]. These conditions could have caused bacteria death or damage, resulting in the absence of ATP produced by those cells. On the contrary, yeasts can survive for more than 30 h at 20% (v/v) ethanol concentration [23], and in the presence of high sugar and essential oil concentrations [24]. Thus, ATP from yeast cells could still be measured in vermouth. Finally, some inhibitory substances may be present in the vermouth samples, influencing the luciferase activity [18]. However, filters were rinsed to flush the compounds that would affect the luminescence and interfere with microbial resuscitation [19].
Better results were obtained in the third trial, when both bacteria and yeasts were detected in one vermouth sample. This could be ascribed to the use of a different resuscitation medium (REScy instead of MRScy) with an increased recovering capacity, which could have been able to favor the repair of cell damage, resulting in the production of measurable ATP. This is in agreement with other authors who reported that the culture medium for bacterial resuscitation could affect the luciferase reaction in terms of signal level and signal stability [19].
All the conducted trials allowed the detection of microbial contamination in wine samples in 24 h (including incubation for cell resuscitation). This was in accordance with Chollet and colleagues [6], who detected the slowest growing strains in wine after 24 h incubation on a selective medium, instead of 6 days with the standard filtration method applied in wine quality control. Compared with other techniques, ATP has been indicated as the best choice in food and beverage analyses when decisions must be taken in the shortest time, as it is simple, easy to use by food microbiology laboratory staff, and has little requirement for laboratory facilities, allowing the rapid estimation of very low levels of cells [25]. Furthermore, with the presently proposed protocol, one of the major drawbacks of the bioluminescence assay, i.e., the lack of specificity, was overcome [7].
In conclusion, ATP bioluminescence, coupled with serial filtration and the use of selective media for cell resuscitation, can be an efficient system for the rapid and simultaneous detection of bacteria and yeasts, in different types of wines. This would be of great interest for industries, for which an early detection of both yeasts and bacteria would help in the decision-making process.

Author Contributions

Conceptualization, J.R. and B.B.; Data curation, S.M., E.B., V.C., S.W. and A.J.; Formal analysis, S.M. and A.J.; Funding acquisition, J.R.; Investigation, S.M. and A.J.; Methodology, S.M., A.J. and B.B.; Project administration, J.R. and B.B.; Resources, J.R. and S.W.; Supervision, J.R. and B.B.; Validation, S.W. and A.J.; Visualization, S.M., E.B. and B.B.; Writing—original draft, S.M., E.B., V.C. and B.B.; Writing—review and editing, S.M., E.B., V.C., J.R., S.W., A.J. and B.B. All authors have read and agreed to the published version of the manuscript.

Funding

This research was partially funded by Promicol BV, De Asselen Kuil, 12 6161 RD, Geleen, The Netherlands.

Acknowledgments

The authors thank G.I.V, Martini & Rossi and Star Ecotronics for donation in kind and technical support.

Conflicts of Interest

B.B. received a research grant from Promicol. S.M., E.B., and V.C. declare no conflict of interest. J.R., S.W., and A.J. are employed at Promicol.

References

  1. Janagama, H.K.; Mai, T.; Han, S.; Nadala, L.; Nadala, C.; Samadpour, M. Simultaneous Detection of Multiple Wine-Spoilage Organisms Using a PCR-Based DNA Dipstick Assay. J. AOAC Int. 2019, 102, 490–496. [Google Scholar] [CrossRef]
  2. Fugelsang, K.C.; Edwards, C.G. Wine Microbiology, 2nd ed.; Springer: New York, NY, USA, 2017; ISBN 978-0-387-33341-0. [Google Scholar]
  3. Okanojo, M.; Miyashita, N.; Tazaki, A.; Tada, H.; Hamazoto, F.; Hisamatsu, M.; Noda, H. Attomol-Level ATP Bioluminometer for Detecting Single Bacterium: ATP Calibration Curve Is Linear from 0 to 5 Amol. Luminescence 2017, 32, 751–756. [Google Scholar] [CrossRef] [PubMed]
  4. McElroy, W.D.; Green, A. Function of Adenosine Triphosphate in the Activation of Luciferin. Arch. Biochem. Biophys. 1956, 64, 257–271. [Google Scholar] [CrossRef]
  5. Lonvaud-Funel, A.; Joyeux, A. Application de La Bioluminescence Au Dénombrement Des Microorganismes Vivants Dans Les Vins. OENO One 1982, 16, 241. [Google Scholar] [CrossRef]
  6. Chollet, R.; Kukuczka, M.; Halter, N.; Romieux, M.; Marc, F.; Meder, H.; Beguin, V.; Ribault, S. Rapid Detection and Enumeration of Contaminants by Atp Bioluminescence Using the Milliflex® Rapid Microbiology Detection and Enumeration System. J. Rapid Methods Autom. Microbiol. 2008, 16, 256–272. [Google Scholar] [CrossRef]
  7. Bottari, B.; Santarelli, M.; Neviani, E. Determination of Microbial Load for Different Beverages and Foodstuff by Assessment of Intracellular ATP. Trends Food Sci. Technol. 2015, 44, 36–48. [Google Scholar] [CrossRef]
  8. Littel, K.J.; Rocco, K.A.L. ATP Screening Method for Presumptive Detection of Microbiologically Contaminated Carbonated Beverages. J. Food Sci. 1986, 51, 474–476. [Google Scholar] [CrossRef]
  9. Osborne, J.P. Advances in microbiological quality control. In Managing Wine Quality; Elsevier: Amsterdam, The Netherlands, 2010; pp. 162–188. ISBN 978-1-84569-484-5. [Google Scholar]
  10. Daeschel, M.A.; Jung, D.-S.; Watson, B.T. Controlling Wine Malolactic Fermentation with Nisin and Nisin-Resistant Strains of Leuconostoc Oenos. Appl. Environ. Microbiol. 1991, 57, 601–603. [Google Scholar] [CrossRef] [Green Version]
  11. Nobile, J. Use of Membrane Filter Technique in the Microbiological Control for the Brewing Industry. Appl. Microbiol. 1966, 15, 736–737. [Google Scholar] [CrossRef]
  12. Millet, V.; Lonvaud-Funel, A. The Viable but Non-Culturable State of Wine Micro-Organisms during Storage. Lett. Appl. Microbiol. 2000, 30, 136–141. [Google Scholar] [CrossRef]
  13. Venkateswaran, K.; Hattori, N.; La Duc, M.T.; Kern, R. ATP as a Biomarker of Viable Microorganisms in Clean-Room Facilities. J. Microbiol. Methods 2003, 52, 367–377. [Google Scholar] [CrossRef]
  14. Lucas, P.M.; Claisse, O.; Lonvaud-Funel, A. High Frequency of Histamine-Producing Bacteria in the Enological Environment and Instability of the Histidine Decarboxylase Production Phenotype. AEM 2008, 74, 811–817. [Google Scholar] [CrossRef] [PubMed] [Green Version]
  15. Loureiro, V.; Malfeito-Ferreira, M. Spoilage Yeasts in the Wine Industry. Int. J. Food Microbiol. 2003, 86, 23–50. [Google Scholar] [CrossRef]
  16. Ammor, M.S.; Belén Flórez, A.; Mayo, B. Antibiotic Resistance in Non-Enterococcal Lactic Acid Bacteria and Bifidobacteria. Food Microbiol. 2007, 24, 559–570. [Google Scholar] [CrossRef]
  17. Pérez, F.; Regodón, J.A.; Valdés, M.E.; De Miguel, C.; Ramı́rez, M. Cycloheximide Resistance as Marker for Monitoring Yeasts in Wine Fermentations. Food Microbiol. 2000, 17, 119–128. [Google Scholar] [CrossRef]
  18. Thompson, A. Application in Beverages Microbiology. In ATP Bioluminescence; Academic Press, Scottish Courage Brewing Ltd.: Edinburgh, UK, 1999; pp. 101–109. [Google Scholar]
  19. Takahashi, T.; Nakakita, Y.; Watari, J.; Shinotsuka, K. A New Rapid Technique for Detection of Microorganisms Using Bioluminescence and Fluorescence Microscope Method. J. Biosci. Bioeng. 2000, 89, 509–513. [Google Scholar] [CrossRef]
  20. Yan, S.-L.; Miao, S.-N.; Deng, S.-Y.; Zou, M.-J.; Zhong, F.-S.; Huang, W.-B.; Pan, S.-Y.; Wang, Q.-Z. ATP Bioluminescence Rapid Detection of Total Viable Count in Soy Sauce: Bioluminescence for Rapid Detection of Microbes in Soy Sauce. Luminescence 2012, 27, 34–38. [Google Scholar] [CrossRef]
  21. El Rayess, Y.; Albasi, C.; Bacchin, P.; Taillandier, P.; Raynal, J.; Mietton-Peuchot, M.; Devatine, A. Cross-Flow Microfiltration Applied to Oenology: A Review. J. Membr. Sci. 2011, 382, 1–19. [Google Scholar] [CrossRef] [Green Version]
  22. Horinouchi, T.; Maeda, T.; Furusawa, C. Understanding and Engineering Alcohol-Tolerant Bacteria Using OMICS Technology. World J. Microbiol. Biotechnol. 2018, 34, 157. [Google Scholar] [CrossRef] [Green Version]
  23. Panesar, P.S.; Kumar, N.; Marwaha, S.S.; Joshi, V.K. Vermouth Production Technology–An Overview; CSIR: Delhi, India, 2009; Volume 8, p. 11. [Google Scholar]
  24. Ding, J.; Huang, X.; Zhang, L.; Zhao, N.; Yang, D.; Zhang, K. Tolerance and Stress Response to Ethanol in the Yeast Saccharomyces Cerevisiae. Appl. Microbiol. Biotechnol. 2009, 85, 253–263. [Google Scholar] [CrossRef]
  25. Ebani, V.V.; Nardoni, S.; Bertelloni, F.; Giovanelli, S.; Rocchigiani, G.; Pistelli, L.; Mancianti, F. Antibacterial and Antifungal Activity of Essential Oils against Some Pathogenic Bacteria and Yeasts Shed from Poultry: Antimicrobial Activity of Essential Oils against Pathogens of Poultry. Flavour Fragr. J. 2016, 31, 302–309. [Google Scholar] [CrossRef]
Figure 1. Flow sheet of the analytical method using ATP bioluminescence.
Applsci 11 04953 g001
Table 1. Characteristics of analyzed wines; “W” is for white wines, “R” for the red wines and “V” for vermouth.
Wine SamplesSparklingAlcohol (%)Sugar (g/L)
R1No13.003.7
R2No13.001
R3No13.003.1
R4No6.00125
R5Yes6.00110
R6Yes12.0015
W1No12.003.5
W2No13.0023.9
W3Yes5.00125
W4Yes11.0013
W5Yes6.00110
W6Yes12.005
W7Yes8.0080
W8Yes12.0010
R7Yes12.0010
V1No15.00152
V2No15.00168
Table 2. Pass/fail limits for the RLU value.
Pass/Fail LimitsRLU Value
Sterile≤2 times blank
Re-test2 times blank < RLU value < 3 times blank
Non-sterile≥3 times blank
Table 3. Bioluminescence assay (RLU). Sample RLU values 3 times higher than the blank RLU value indicate contamination (by yeasts when YPDch is used as resuscitation medium for 1.2 µm filters, bacteria when MRScy is used to resuscitate cells on 0.45 µm filters) and are indicated in bold. If the RLU value is between 2 and 3 times the blank, the result of the analysis is defined as uncertain. The medium is considered sterile if the RLU value is lower than 2 times the RLU of the blank (selective YDPch for yeasts, MRScy for bacteria). “W” stands for white wine, “R” for the red wine. All analyses were performed in triplicate, and the results are the mean of the 3 replicates ± standard deviation (SD).
Inoculum (CFU/mL)Yeast (104) + Bacteria (107)Yeast (104) + Bacteria (103)
Filter1.2 µm0.45 µm1.2 µm0.45 µm
AnalysisRLU YPDchSDRLU MRScySDRLU YPDchSDRLU MRScySD
R17.04 × 1062.24 × 1041.61 × 1066.03 × 1049.23 × 1058.84 × 1041.01 × 1032.91 × 10
R23.86 × 1063.32 × 1041.14 × 1062.24 × 1047.66 × 1062.14 × 1041.01 × 1054.28 × 103
R34.28 × 1062.96 × 1041.43 × 1066.24 × 1049.40 × 1064.05 × 1041.11 × 1032.36 × 102
R43.02 × 1062.13 × 1049.23 × 1051.90 × 1047.38 × 1064.11 × 1041.14 × 1038.55 × 10
R51.29 × 1061.89 × 1034.11 × 1054.83 × 1033.75 × 1061.87 × 1041.37 × 1069.89 × 103
R61.45 × 1064.88 × 1049.58 × 1055.23 × 1044.84 × 1063.76 × 1045.70 × 1051.57 × 104
W15.25 × 1065.91 × 1041.32 × 1067.58 × 1046.80 × 1061.97 × 1041.57 × 1041.45 × 102
W23.96 × 1061.20 × 1044.91 × 1057.99 × 1037.35 × 1065.69 × 1041.02 × 1038.59 × 10
W34.34 × 1064.05 × 1041.47 × 1064.48 × 1048.07 × 1066.91 × 1041.24 × 1041.41 × 102
W49.69 × 1063.19 × 1041.33 × 1066.91 × 1043.85 × 1063.01 × 1041.31 × 1062.82 × 104
W53.91 × 1061.63 × 1042.19 × 1045.05 × 1037.75 × 1069.16 × 1041.80 × 1052.48 × 103
W61.74 × 1061.44 × 1044.93 × 1051.04 × 1048.04 × 1065.14 × 1045.39 × 1052.28 × 103
Blank4.24 × 1036.55 × 1023.65 × 1033.16 × 1024.04 × 1031.10 × 1032.03 × 1037.12 × 102
Table 4. Bioluminescence assay (presence/absence) and plating results (presence/absence +/−). TtD is the time to detection. Eluates from the first filtration step were plated both on YPDch and MRScy to confirm the filter’s (1.2 µm) effectiveness in retaining yeasts while being crossed with bacteria.
Inoculum (CFU/mL)FilterAnalysisR1R2R3R4R5R6W1W2W3W4W5W6TtD
Yeast (104)
+
Bacteria (107)
1.2 µmRLU YPDch 1++++++++++++24 h
plating RLU-YPDch on YPDch agar 2++++++++++++48 h
Eluate on YPDch agar
Eluate on MRScy agar++++++++++++
0.45 µmRLU MRScy 1++++++++++++24 h
Plating RLU-MRScy on MRScy agar 2++++++++++++48 h
Yeast (104)
+
Bacteria (103)
1.2 µmRLU YPDch++++++++++++24 h
plating RLU-YPDch on YPDch agar++++++++++++48 h
Eluate on YPDch agar
Eluate on MRScy agar+++
0.45 µmRLU MRScy++++++++24 h
Plating RLU-MRScy on MRScy agar+++++++48 h
1 RLU YPDch: bioluminometer analysis of the YPDch or MRScy medium in which the filter was incubated. 2 Plating RLU-YPDch or RLU-MRScy on YPDch agar or MRScy agar: plating of the YPDch or MRScy medium in which the filter was incubated.
Table 5. Bioluminometer results on wines contaminated with the lowest microbial contamination indicated as acceptable by the producers for the tested wines. Sample RLU values 3 times higher than the blank RLU value indicate contamination (by yeasts when YPDch or RESch are used as resuscitation medium for 1.2 µm filters, bacteria when MRScy or REScy are used to resuscitate cells on 0.45 µm filters) and are indicated in bold. If the RLU value is between 2 and 3 times the blank, the result of the analysis is defined as uncertain. The medium is considered sterile if the RLU value is lower than 2 times the RLU of the blank (selective YDPch/RESch for yeasts, MRScy/REScy for bacteria). “W” stands for white wine, R for red wine, “V” for vermouth. All analyses were performed in triplicate, and the results are the mean of the 3 replicates ± standard deviation (SD).
Inoculum (CFU/L)Yeast (50) + LAB (1000)
Filter1.2 µm0.45 µm
Res.MediumYPDchSDRESchSDMRScySDREScySD
W71.93 × 1062.08 × 1024.35 × 1052.74 × 1042.89 × 1034.08 × 1021.22 × 1044.83 × 103
W81.93 × 1041.37 × 1035.02 × 1065.19 × 1048.72 × 1041.88 × 1035.35 × 1041.04 × 103
R71.92 × 1053.29 × 1046.81 × 1064.09 × 1031.73 × 1061.75 × 1047.20 × 1042.13 × 103
V11.77 × 1069.21 × 1056.81 × 1061.24 × 1062.15 × 1021.02 × 1057.28 × 1026.02 × 102
V23.47 × 1022.86 × 1025.59 × 1062.75 × 1057.07 × 1027.62 × 1025.78 × 1036.84 × 102
Blank2.37 × 1023.46 × 101.35 × 1022.43 × 101.73 × 1022.26 × 101.35 × 1021.20 × 10
Publisher’s Note: MDPI stays neutral with regard to jurisdictional claims in published maps and institutional affiliations.

