Article

Influence of θ′ Phase Cutting on Precipitate Hardening of Al–Cu Alloy during Prolonged Plastic Deformation: Molecular Dynamics and Continuum Modeling

by
Vasiliy S. Krasnikov
1,*,
Alexander E. Mayer
1,
Victor V. Pogorelko
1 and
Marat R. Gazizov
2
1
Physical Department, Chelyabinsk State University, 454001 Chelyabinsk, Russia
2
Laboratory of Mechanical Properties of Nanoscale Materials and Superalloys, Belgorod State University, 308015 Belgorod, Russia
*
Author to whom correspondence should be addressed.
Appl. Sci. 2021, 11(11), 4906; https://doi.org/10.3390/app11114906
Submission received: 30 March 2021 / Revised: 24 May 2021 / Accepted: 24 May 2021 / Published: 26 May 2021
(This article belongs to the Topic Metallurgical and Materials Engineering)

Abstract

:

Featured Application

The proposed method for prediction of the strength of aluminum alloys can be used to determine the required size distribution of hardening particles to achieve the durability or maximum strength.

Abstract

We investigate the prolonged plastic deformation of aluminum containing θ′ phase with a multistage approach combining molecular dynamics (MD), continuum modeling (CM) and discrete dislocation dynamics (DDD). The time of performed MD calculations is sufficient for about a hundred dislocation–precipitate interactions. With this number of interactions, the inclusion of θ′ is not only cut, but also scattered into individual copper atoms in an aluminum matrix. Damage to the crystal structure of inclusion and activation of the cross-slip of dislocation segments cause a decrease in acting stresses in the MD system. The rate of this effect depends on θ′ diameter and occurs faster for small inclusions. The effect of decreasing the resistance of precipitate is further introduced into the dislocation–precipitate interaction CM by reducing the precipitate effective diameter with an increase in the number of interactions. A model of dislocation–precipitate interaction accounting for the softening of inclusions is further implemented into DDD. Dependences of flow stress in aluminum with θ′ phases on volume fraction and typical diameter of precipitates are obtained. Manifestation of inclusion softening is possible in such an alloy, which leads to the flow stress decrease during deformation. The range of volume fractions and typical diameters of θ′ phases corresponding to the possible decrease in flow stress is distinguished.

1. Introduction

Aluminum alloys are widely used as construction materials. They are especially widespread in those fields where a low weight together with sufficiently high strength is required, such as aviation and space engineering.
During deformation of aluminum alloys, the development of bands of plastic flow localization is possible, the deformation in which can exceed many times the deformation in the surrounding material, reaching 90% of the total deformation [1,2,3,4]. There are two classical points of view on the development of plastic localization: (1) plastic localization occurs as the result of thermal softening [1], and (2) the cause of plastic localization is the heterogeneity of the properties of the material subjected to deformation [5,6,7,8,9]. A more detailed analysis assumes taking into account the contributions of both thermal and microstructural factors to the initiation of plastic flow localization [10,11,12,13,14].
The development of localization bands is a multi-stage hierarchical process that occurs at several levels. Interaction of dislocations with precipitates and evolution of the later ones is relevant at a micro scale. Multiple cutting of the strengthening particles is the cause of catastrophic strain localization [15], since it activates the flow of dislocations in the slip plane passing through the cut precipitates. The presence of easily cut precipitates in alloy usually manifests itself in a decrease in the strain hardening rate [16]. One of the possible reasons for this may be a decrease in the efficiency of accumulation of the Orowan loops around the inclusion after the cutting [15]. The authors of work [17] observed the softening of AA2139 alloy samples under cycle loading; this softening was explained as a consequence of the repeated cutting of Ω phases. Besides precipitate cutting, accumulation of microvoids is observed in the shear bands that can further initiate the fracture of the deformed sample [18]. Aging of alloys, which leads to the precipitation of cut-resistant particles of hardening phases, can make deformation more uniform and increase the fatigue resistance of the samples [15,19].
In an Al–Cu system, the hardening phases precipitate during aging in the following sequence: supersaturated solution, Guinier–Preston (GP) zones, θ″, θ′ and θ phases [20,21,22,23,24]. θ′ phase inclusions were traditionally considered as non-cuttable particles; therefore, they are considered as the most preferable for strengthening in an aging process of Al–Cu alloys. However, in the last decade there has been more and more evidence in favor of the fact that cutting and even dissolution of θ′ phase can occur with the accumulation of plastic deformation [18,25,26,27,28,29,30,31,32]. The transmission electron microscopy and X-ray tomography images showing cut θ′ phase was presented in [31,32]. Cutting of θ′ phase was also observed in molecular dynamics (MD) studies using realistic models of interatomic interaction [33,34,35]. Depending on the aging conditions, the size of released θ′ precipitates can vary significantly, starting from a few nanometers in diameter and reaching hundreds of nanometers [23,32,36,37]. In the experimental work [32], it was shown that the cutting of θ′ phase has a threshold character: cutting of particles only with a size less than 60 nm was observed. It is known that fine particles of θ′ phase contribute to an increase in the shear strength of copper-containing alloys [36,37,38] more efficiently in comparison with larger ones. On the other hand, the stability of large θ′ phase during prolonged plastic deformation can increase the fatigue resistance of alloy [32]. Thus, in order to obtain an alloy with a given maximum shear strength or fatigue resistance, one has to predict theoretically the required particle size distribution of θ′ phase and then to create it in aging of alloys.
To describe the plastic deformation of aluminum alloys, the approach is now widely used in which the current flow stress of alloy is described as the sum of several components accounting for the contribution of various hardening mechanisms [39,40,41,42,43,44,45,46,47,48,49,50]. The following mechanisms of strength are distinguished most often: (1) the inherent strength of matrix, usually this term includes the Peierls barrier of a pure single crystal of aluminum, which is quite low; (2) the strain hardening by forest dislocations in the form of the Taylor relation—this term can include both the kinematic hardening and accumulation of dislocations in the form of the Orowan loops on precipitates; (3) the strengthening by grain boundaries in the form of Hall–Petch relations; (4) the contribution of the solid solution of impurity atoms; and (5) the hardening by precipitates of second phases, where the contribution of both the cuttable and non-cuttable ones is usually considered. Further, these terms are combined according to different mixing rules to give the current state of the flow stress depending on deformation, strain rate and temperature. Some of the above cited works describe the kinetics of precipitation of strengthening phases with a size distribution of inclusions that makes it possible to directly describe the stage of artificial aging [40,41,42,43,44,48,49]. At the same time, the properties of obstacles during plastic deformation are considered to be unchanged, while the experimental works sufficiently convincingly indicate that these changes occur and affect both the strain hardening rate and the strength of the alloy itself.
During a mechanical loading of alloys, deformation tends to localize in thin shear bands, in which the properties of material can change faster than the average ones for the bulk of the sample. Therefore, a more accurate approach to describe the properties of alloy implies the use of such a scheme, which explicitly describes the accumulation of deformation in shear bands. A convenient tool for such studies is the introduction of constitutive equations for alloy strength into continuum mechanics equations with numerical realization based on the finite-difference or finite-element schemes [9,11,12,51,52,53]. In these works, the models of strength of alloys include various factors, but the properties of hardening inclusions remain constant. However, the cutting of inclusions obviously leads to a change in their properties. Another widely used meso-scale approach is the discrete dislocation dynamics, which allows one to investigate for a representative dislocation ensemble the details of dislocation–dislocation interaction, strain hardening [54] and dislocation–precipitate interaction [55,56,57], but precipitates are still treated as unchanged and impenetrable by dislocations.
The interaction of dislocations with nano-sized inclusions in the Al–Cu system was studied by a number of authors using MD modeling [33,34,35,57,58,59,60,61,62,63]. It was demonstrated that even for the same type of inclusion, different mechanisms of overcoming are realized, for example, for single-layer GP zones, an increase in precipitate diameter leads to the realization of Orowan looping instead of cutting mechanisms [58]; also, it was demonstrated in [61] that a change in the mechanism can occur even for one size of precipitate, but at different temperatures and strain rates. The change of overcoming mechanisms was registered with MD simulations for such stiff inclusions, as θ″, θ′ phases. The first interactions occur without cutting the inclusions according to the mechanism of the Orowan loop formation, and the following dislocation–inclusion interactions provoke the cutting due to the accumulation of critical shear stress on the inclusion [34,58]. In works [34,57,58], multiple interactions of dislocation with the inclusion of GP, θ″, θ′ or θ phases were studied. This formulation of MD studies corresponds to the conditions for the development of localization bands at the micro level. Regardless of the type of inclusions, variation of the stresses acting during the interaction was recorded; however, the insufficient tracking time did not allow making an unambiguous conclusion about the patterns of these changes.
In this work, we perform an MD study of the interaction of dislocation with θ′ phase of two sizes over several hundred interactions to take this change into account. A decrease in the average stresses in the MD system with an increase in the number of dislocation–precipitate interactions is registered. The decrease in stresses in the system is further described using an interaction model proposed and verified in [34,57,58] by introducing an effective inclusion diameter that decreases with the increase in the number of interactions. The dependence of the effective diameter of precipitate on the initial one and the number of interactions is constructed on the basis of obtained MD data for two sizes of inclusion and experimental data from [32] about the threshold size, for the larger of which the cutting of θ′ phase is not observed. This dependence is further used in a 2D discrete dislocation model [57] for taking into account the evolution of precipitate strength during prolonged plastic deformation, leading to multiple dislocation–precipitate interactions. The discrete dislocation modeling results are generalized in the form of diagrams reflecting dependences of the maximal shear stress and the tendency to softening due to precipitate cutting on the initial average size and volume fraction of θ′ phase. In MD simulations we also analyze the accumulation of vacancies in the process of dislocation–precipitate interaction, which is important for fracture analysis.

2. Materials and Methods

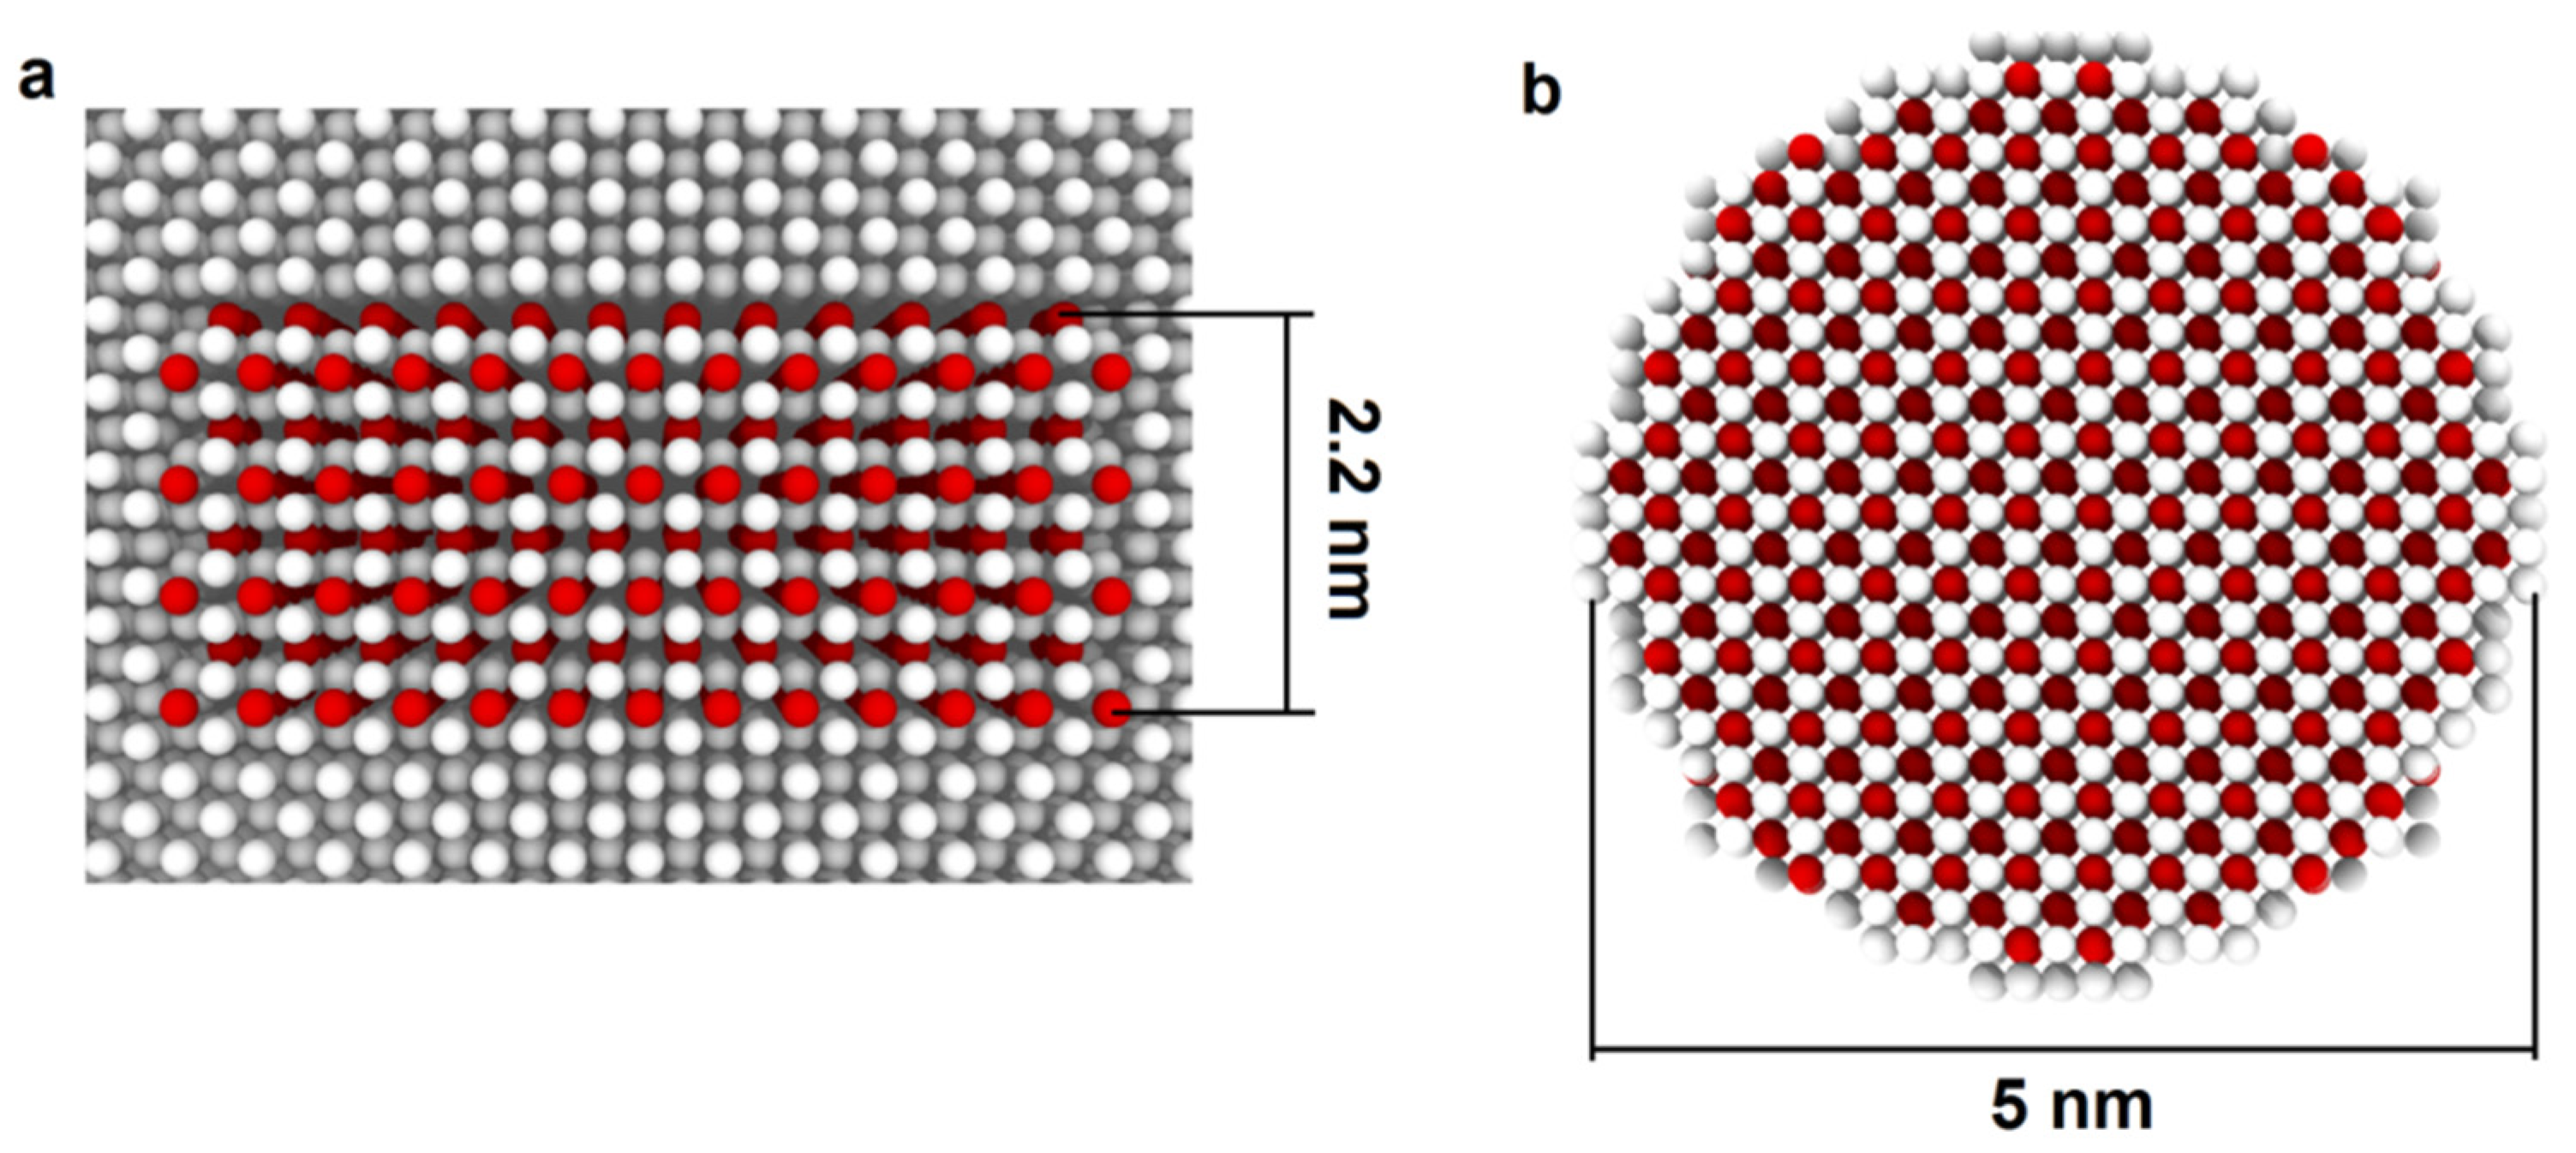
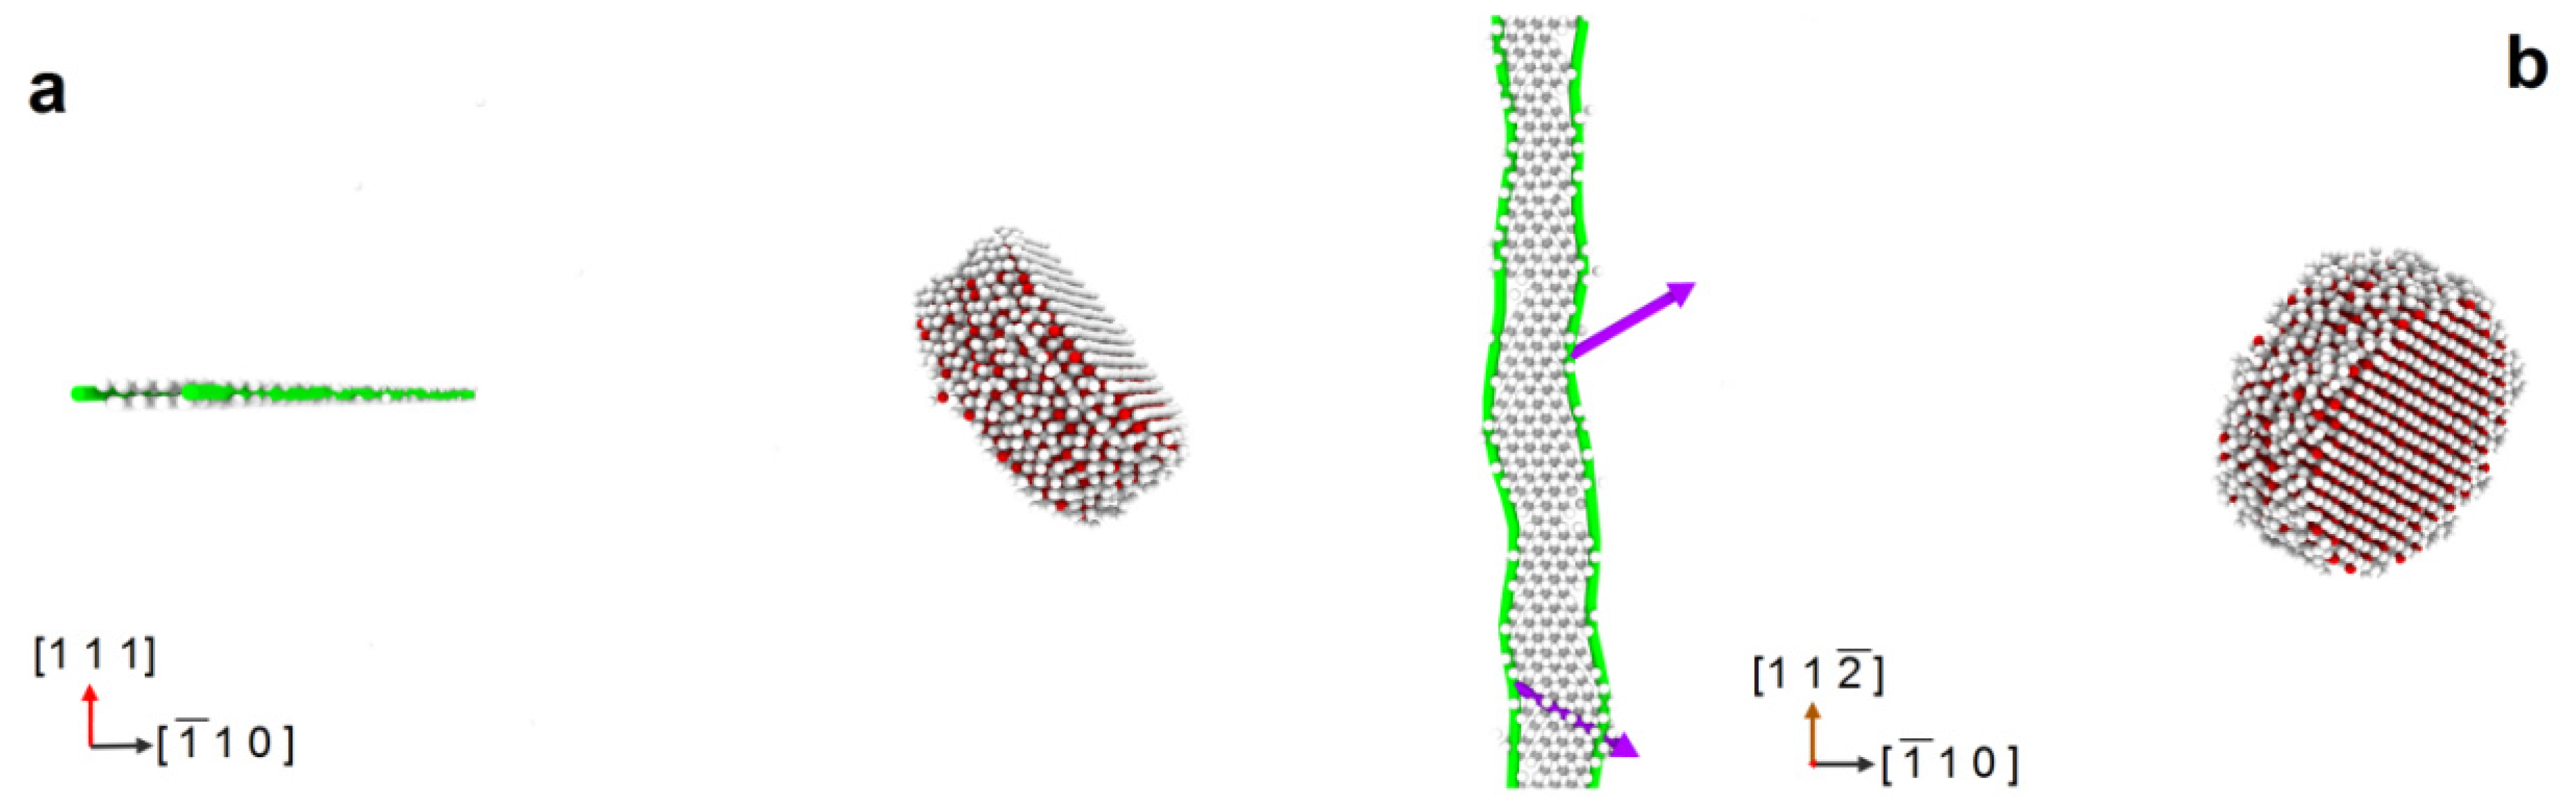
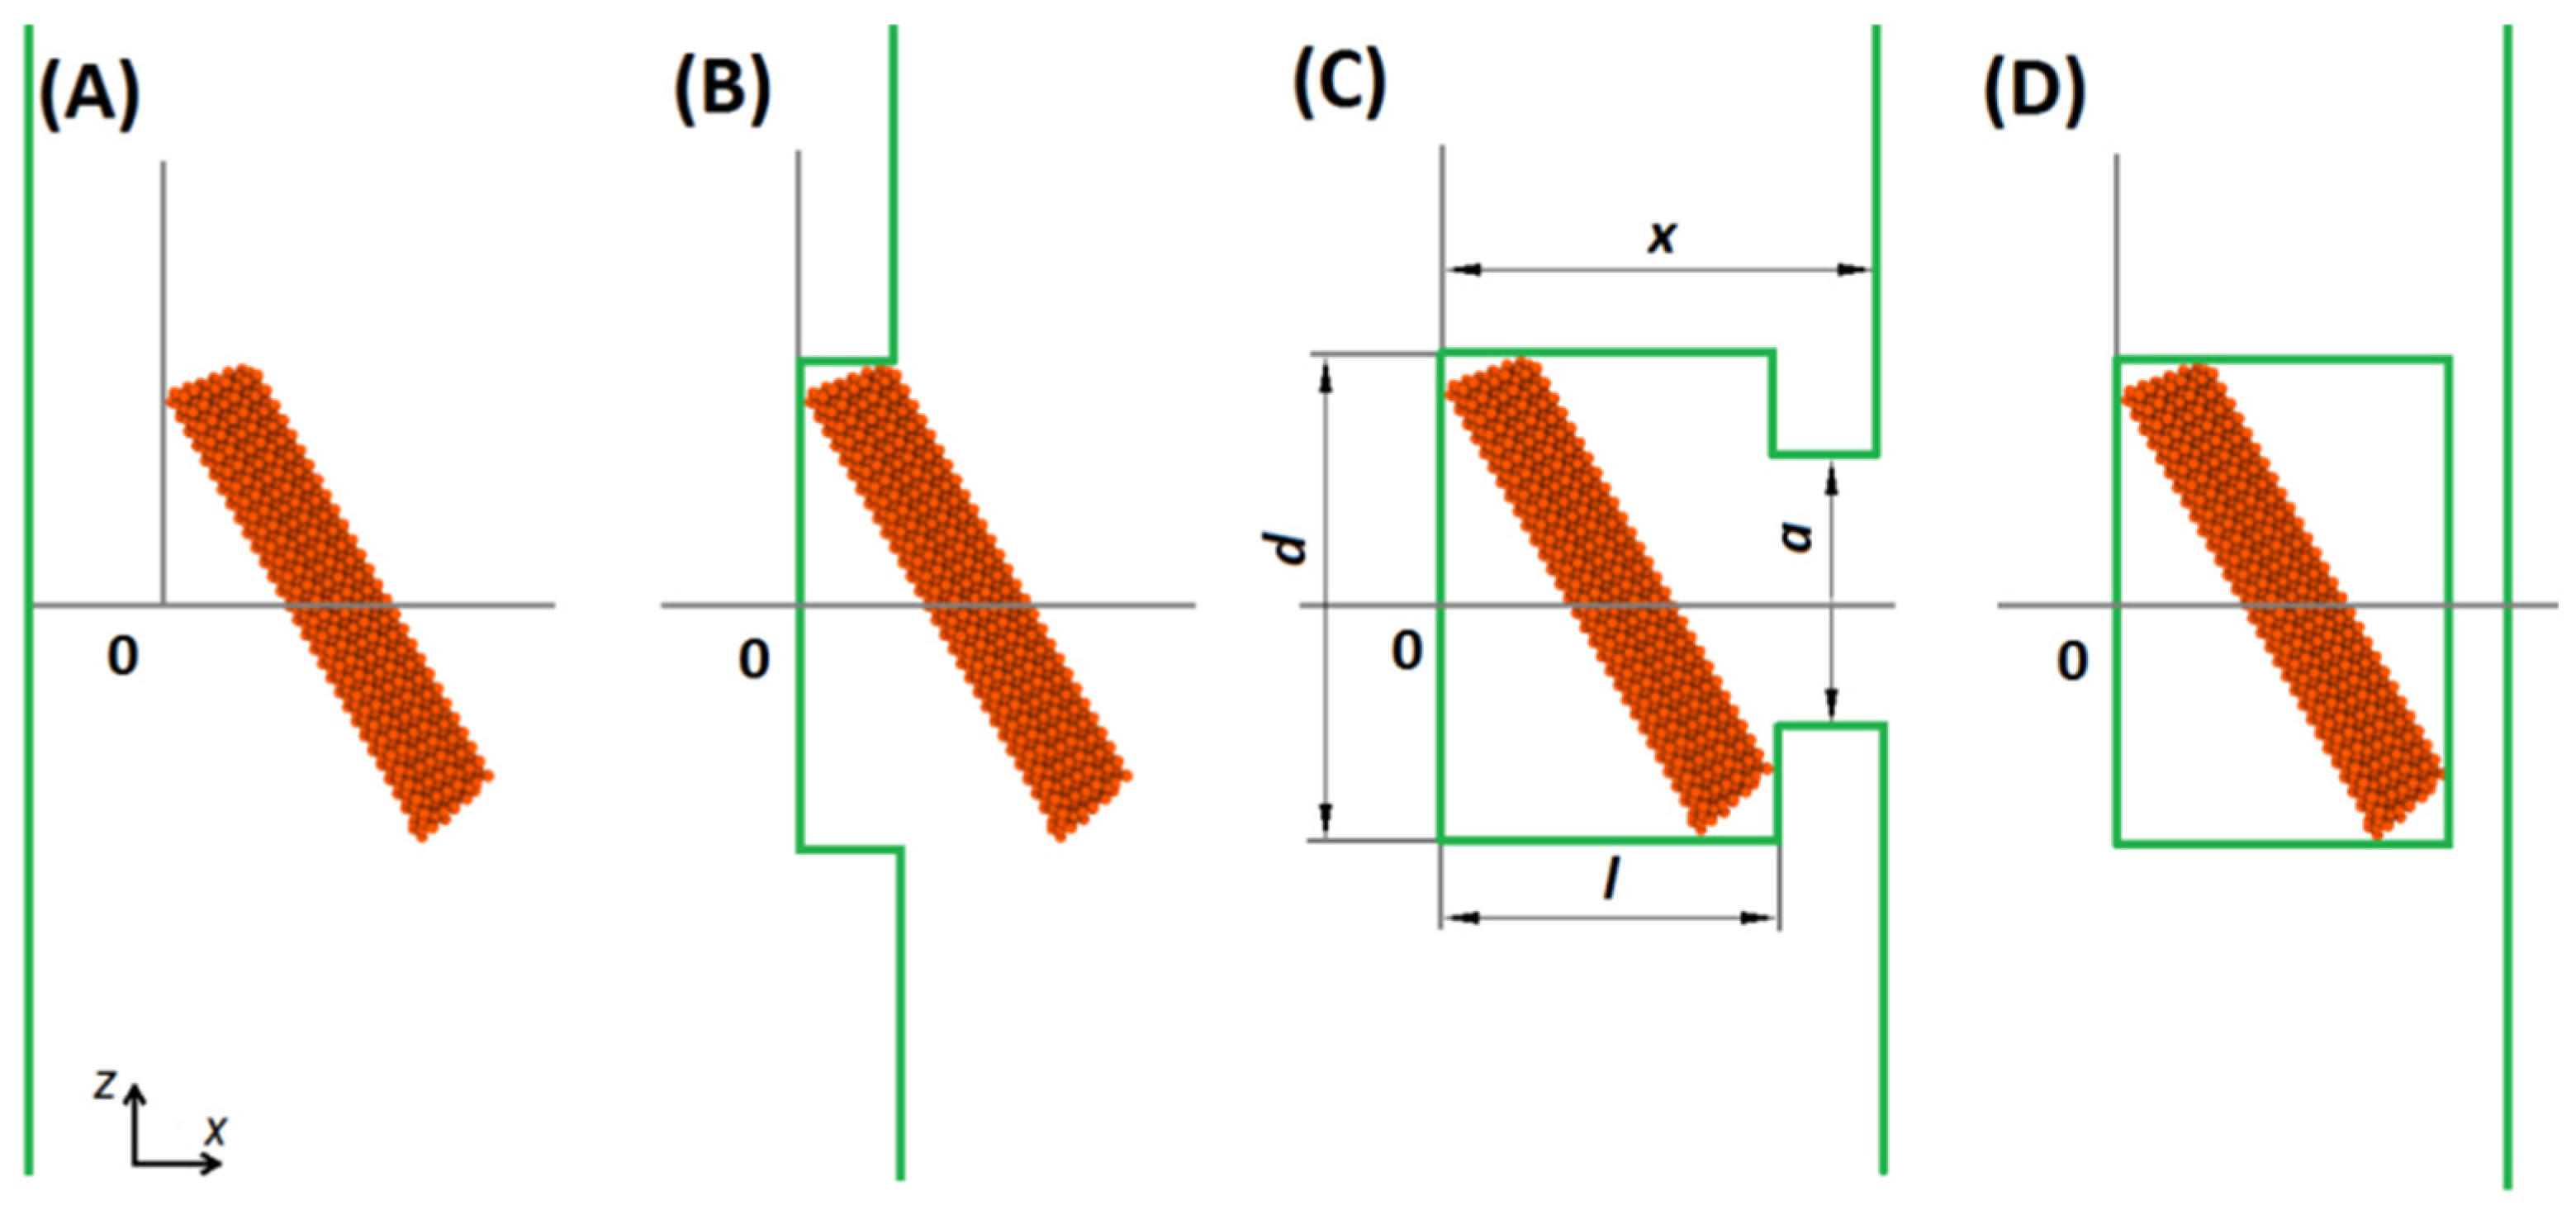
2.1. Statement of MD Task

A study of the long-term behavior of the representative system containing dislocation and θ′ phase is performed with the molecular dynamics (MD) calculations. The statement of the problem is similar to that used in [34], while a much longer evolution of MD system is traced in the present work. The x-, y- and z-axes of coordinates are oriented along [ 1 ¯ 10 ] , [ 111 ] and [ 11 2 ¯ ] crystallographic directions, respectively. Such an orientation of MD system is consistent with the directions of the edge dislocation in fcc crystal. The system is periodic along the x- and z-axes. The dimensions of the system were chosen equal to 51 × 60 × 9.87–22 nm3, in the first case the system contains of about 2,000,000 atoms, and in the last one—about 5,000,000.
In the first step, θ′ phase is placed into an ideal aluminum lattice. Precipitates of θ′ have a tetragonal lattice [64] with constants equal to 0.404 and 0.508 nm. In the aluminum matrix, θ′ occurs as plate-like inclusions. The flat surface of θ′ is coherent with the aluminum lattice and the inclusion rim is semicoherent [23,28]. The mutual arrangement of copper and aluminum atoms is shown in Figure 1, where panel (a) is the cross section of matrix-surrounded precipitate and (b) is the view of the flat surface of the cylindrical inclusion without the aluminum matrix. The inclusion is created in the form of a cylinder of 2.2 nm thickness; and two diameters of inclusions are considered, 5 and 18 nm. The flat surface of the cylinder is parallel to the ( 100 ) plane of aluminum.
In the second step, edge dislocation is introduced into the aluminum matrix by addition of one atomic half-plane to the upper half of the crystal and superimposing the displacements of atoms of the system according to the dislocation stress field; the ATOMSK software package is used [65].
The dynamics of the created system containing θ′ phase and dislocation (Figure 2) is simulated using the LAMMPS package [66]. Interactions between atoms are described with ADP potential [67], developed for the Al–Cu system based on the EAM formalism supplemented by accounting the quadrupole moments. This potential reproduces well the elastic constants of both metals, the energies of various defects in them, as well as the structure of intermetallic phases. Using this potential previously allowed the description of the dynamic properties of dislocations in pure aluminum [68,69], as well as the processes of interaction of dislocation with strengthening phases in Al–Cu alloys [34,57,58,60,68]. Currently, machine learning potentials are being actively developed; despite the emergence of these new potentials, ADP potential by Apostol and Mishin for an Al–Cu system is considered as one of the best classical physically based potentials [70].
Investigation of the dislocation dynamics is preceded by the relaxation, which lasts for 20 ps. The pressure and temperature of the MD system is controlled to be constant during calculations. The barostat controls only the diagonal components of the stress tensor. Other stress components arising during relaxation do not exceed 10–20 MPa, which is insignificant in comparison with those acting during the dislocation–precipitate interaction. Two Shockley partial dislocations are formed from the initially perfect dislocation (see Figure 2); such behavior is typical for aluminum. Change in the structure of inclusion during relaxation is not observed. The temperatures of 100, 300, 500 and 700 K are considered.
During the further evolution, the movement of dislocation in the MD system is caused by displacement of the top layer consisting of 5 atomic planes with the constant velocity. The bottom layers of the system are immobilized. Shear velocity applied to the bottom layer of the system is equal to 3 m/s, that corresponds to the strain rate of 2.5 × 10⁷ s−1. The considered strain rate falls within the range of experimentally available strain rates realized during the propagation of shock waves; today, in shock experiments on thin films, the strain rates reach 109–1010 s−1 [71,72,73]. NVE fix is used for the determination of other atom positions except for layers moving at a given speed. The constant level of the temperature in the system is provided by the Berendsen thermostat [74]. Thus, the NVT ensemble is simulated in fact, which means the conservation of the number of particles, volume of system and temperature. Such an approach was previously implemented to study the dynamics of solitary dislocation and the dislocation–precipitate interactions in an Al–Cu system [34,57,58,69]. During MD calculations, about a hundred dislocation–precipitate interactions occur.
The analysis and visualization of obtained MD results are performed with the OVITO package [75]. The centrosymmetry parameter [76] is used for detecting the defect structure. The dislocations are detected using the DXA algorithm [77], embedded in OVITO.

2.2. Model of Dislocation–Precipitate Interaction

We use the model of dislocation motion in pure aluminum and dislocation–precipitate interaction offered in [34,57,58]. This model assumes that the dislocation overcomes precipitate forming the Orowan loop with energy losses for formation of additional dislocation segments. Description of free motion of dislocation between the interactions with precipitates and motion of segments during the Orowan loop formation takes into account the phonon friction. This model does not consider the cross-slip or climb of segments into an adjacent plane, since these processes do not significantly affect the stress to overcome the precipitate at single interaction.
Figure 3 shows the main stages of dislocation motion and interaction with θ′ precipitate. For simplicity, we consider a rectangle inclusion with the length l along the direction of the perfect Burgers vector and width d along the vector tangent to the dislocation. The distance between θ′ inclusions in the direction of the z-axis is denoted as D, and the distance in the direction of the x-axis is L. Following an MD statement, the periodic boundary conditions are applied along the z-axis; in this case, the dislocation interacts with the precipitate chain. The dislocation segments are considered as straight ones. Edge and screw segments are directed along the z- and x-axis, correspondingly, as given in Figure 3. We use two generalized coordinates x and a to describe the positions of the moving edge and screw segments; other segments are immobilized at θ′ inclusion. We suppose that the energy of the segments adjacent to the inclusion consists only of the core energy ε p , since their elastic field is screened by the inclusion. This value, ε p , is the model parameter that depends on the temperature and type of precipitate. Our previous work [57] shows that this parameter has the same value for edge and screw segments. In this work, we fit it to MD results for θ′ precipitate. For segments not in contact with the inclusion, the total energy is the sum of the core energy ε 1 = 0.2   eV / b and the energy of the elastic field. In the case of screw segments, it is ε s = ε 1 + ε 2 s ln ( R / R 0 ) , and ε e = ε 1 + ε 2 e ln ( R / R 0 ) in the case of edge segments. R 0 = 4 b is the radius of the dislocation core; R represents the distance to the nearest obstacle or half the distance to the opposite dislocation segment; ε 2 s = G b 2 / [ 4 π ] and ε 2 e = G b 2 / [ 4 π ( 1 ν ) ] are obtained from the elastic theory of dislocations; G and ν are the shear modulus and Poisson’s ratio of aluminum, respectively; and b is the magnitude of the Burgers vector.
We consider four stages of dislocation–precipitate interaction (Figure 3): (A) movement towards the inclusion; (B) wrapping around the inclusion; (c) the Orowan loop closing; and (D) movement from the inclusion. Motion of dislocation segments is caused by the forces, which can be obtained by differentiation of the total energy of the dislocation line along the generalized coordinates x and a [34,57,58]. At stages (B) and (C), the increase in the length of the dislocation line during the Orowan loop formation is controlled by these forces. This increase in length provides the dislocation deceleration. The resolved shear stress σ in the system determines the forces F x and F a acting on the moving edge and screw segments in accordance with [57,58] as:
F x = { b σ ε 2 e d D [ η ( x , L l + x ) + η ( L l + x , x ) ] ,     stage   ( A ) ; b σ 2 ε p D d ,     stage   ( B ) ; b σ d 2 a D 2 a ε 2 e [ η ( x l , L x ) η ( L x , x l ) ] 2 D 2 a [ ε 1 + ε 2 s γ ( a , D 2 a 2 ) ] ,     stage   ( C ) ; b σ ε 2 e d D [ η ( x l , L x ) η ( L x , x l ) ] ,     stage   ( D ) .
F a = { b σ + 1 x l [ ε p + ε 1 + ε 2 e γ ( x l , L x ) ] ε 2 s [ η ( a , D / 2 a ) η ( D / 2 a , a ) ] ,     stage   ( C ) ; undefined   at   stages   ( A ) ,   ( B )   and   ( D ) .
For briefness we introduce the following functions [57]:
γ ( x , y ) = log ( min ( | x | , | y | ) R 0 ) , η ( x , y ) = 1 x Θ ( | y | | x | )
where Θ ( x ) is the Heaviside step function. The equations of motion for dislocation in aluminum matrix are used for calculations of the positions and velocities of moving dislocations [69]:
m 0 x ¨ = F x ( 1 x ˙ 2 / c t 2 ) 3 / 2 B 0 x ˙ , m 0 a ¨ = F a ( 1 a ˙ 2 / c t 2 ) 3 / 2 B 0 a ˙ ,
where B 0 is the coefficient of phonon friction at low dislocation velocity; c t = G / ρ is the transverse sound velocity where ρ is the mass density; and m 0 is the rest dislocation mass. To determine the velocity of both edge and screw segments we use the same parameters of equation of motion found for the case of edge dislocation [69], because it was shown that the coefficient of phonon friction differs by about 15% for edge and screw segments [34]. The condition for the closure of the loop around the precipitate and the dislocation separation from the inclusion is chosen in the form a R 0 .

2.3. Method of Discrete Dislocation Dynamics

We use the approach of 2D dislocation dynamics to study the stress–strain response of a representative volume of alloy with dislocations, also containing size and spatially distributed precipitates. The approach was proposed and verified in our previous paper [57]. Only edge dislocations with the tangential vector oriented along the z-axis and the Burgers vector along y- or x-axes are introduced into 2D dislocation dynamics. Both positive and negative signs of the Burgers vector are considered that provide motion of dislocations in opposite directions. Dislocations of both slip systems are randomly placed in the calculation domain at the initial moment of time, and their further dynamics under applied shear deformation with the constant strain rate of 106 s−1 are calculated. This strain rate is chosen so as to be close to the rate considered in the MD one, as described in Section 2.1. In spite of its high value, the considered strain rate of 106 s−1 corresponds to the transition to the quasi-stationary plastic response of alloy as shown in [57].
Despite the loss of straightness by dislocations during interaction with inclusions, we describe the position of dislocation on the xy plane in accordance with its main edge segment. Each dislocation–precipitate interaction is described with the model outlined above. The emission of screw segments when overcoming the inclusion is included in the used model of the dislocation–precipitate interaction, and this is not considered explicitly at the level of 2D dislocation dynamics.
Similar to the previous work [57], we consider a squared region with the size of 15 μm in the 2D calculations of dislocation dynamics for Al–Cu alloy with size-distributed θ′ precipitates. The chosen size of computational region allows us to achieve convergence of stress–strain curves and to obtain insignificant fluctuations on them, as a parametric study demonstrated. A total of 22,500 dislocations are introduced into the region that corresponds to the dislocation density of ρ D = 10 14   m 2 typical for shock-loaded metals. The computational grid contains 300 × 300 cells, so the cell size is equal to 50 nm.

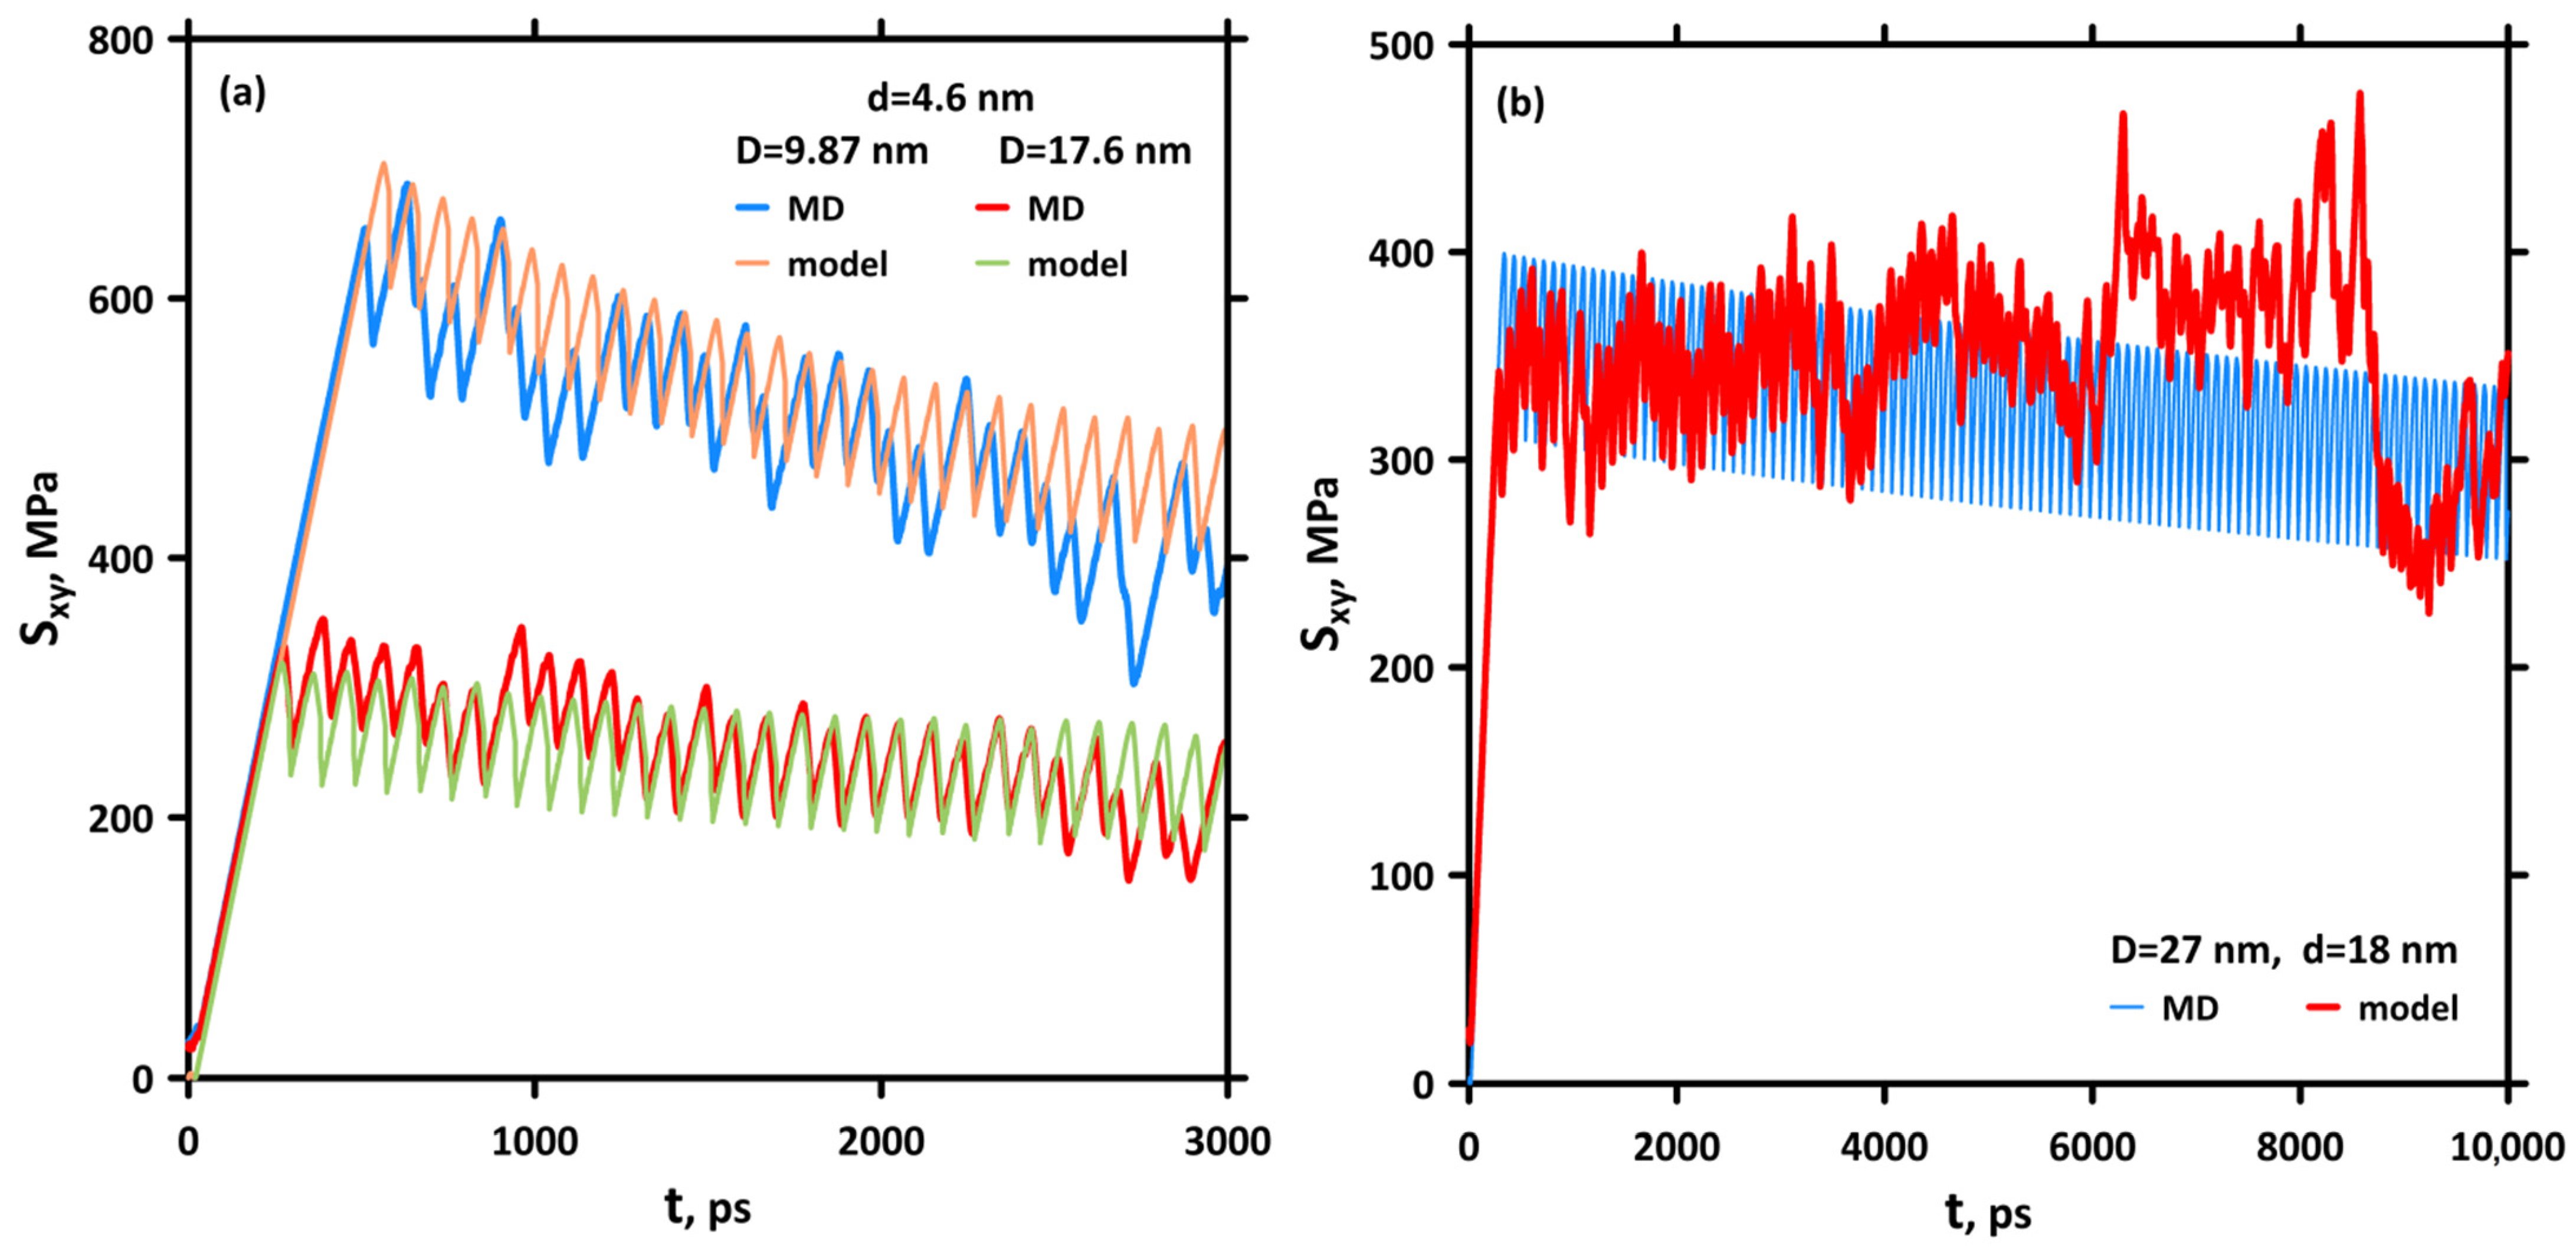
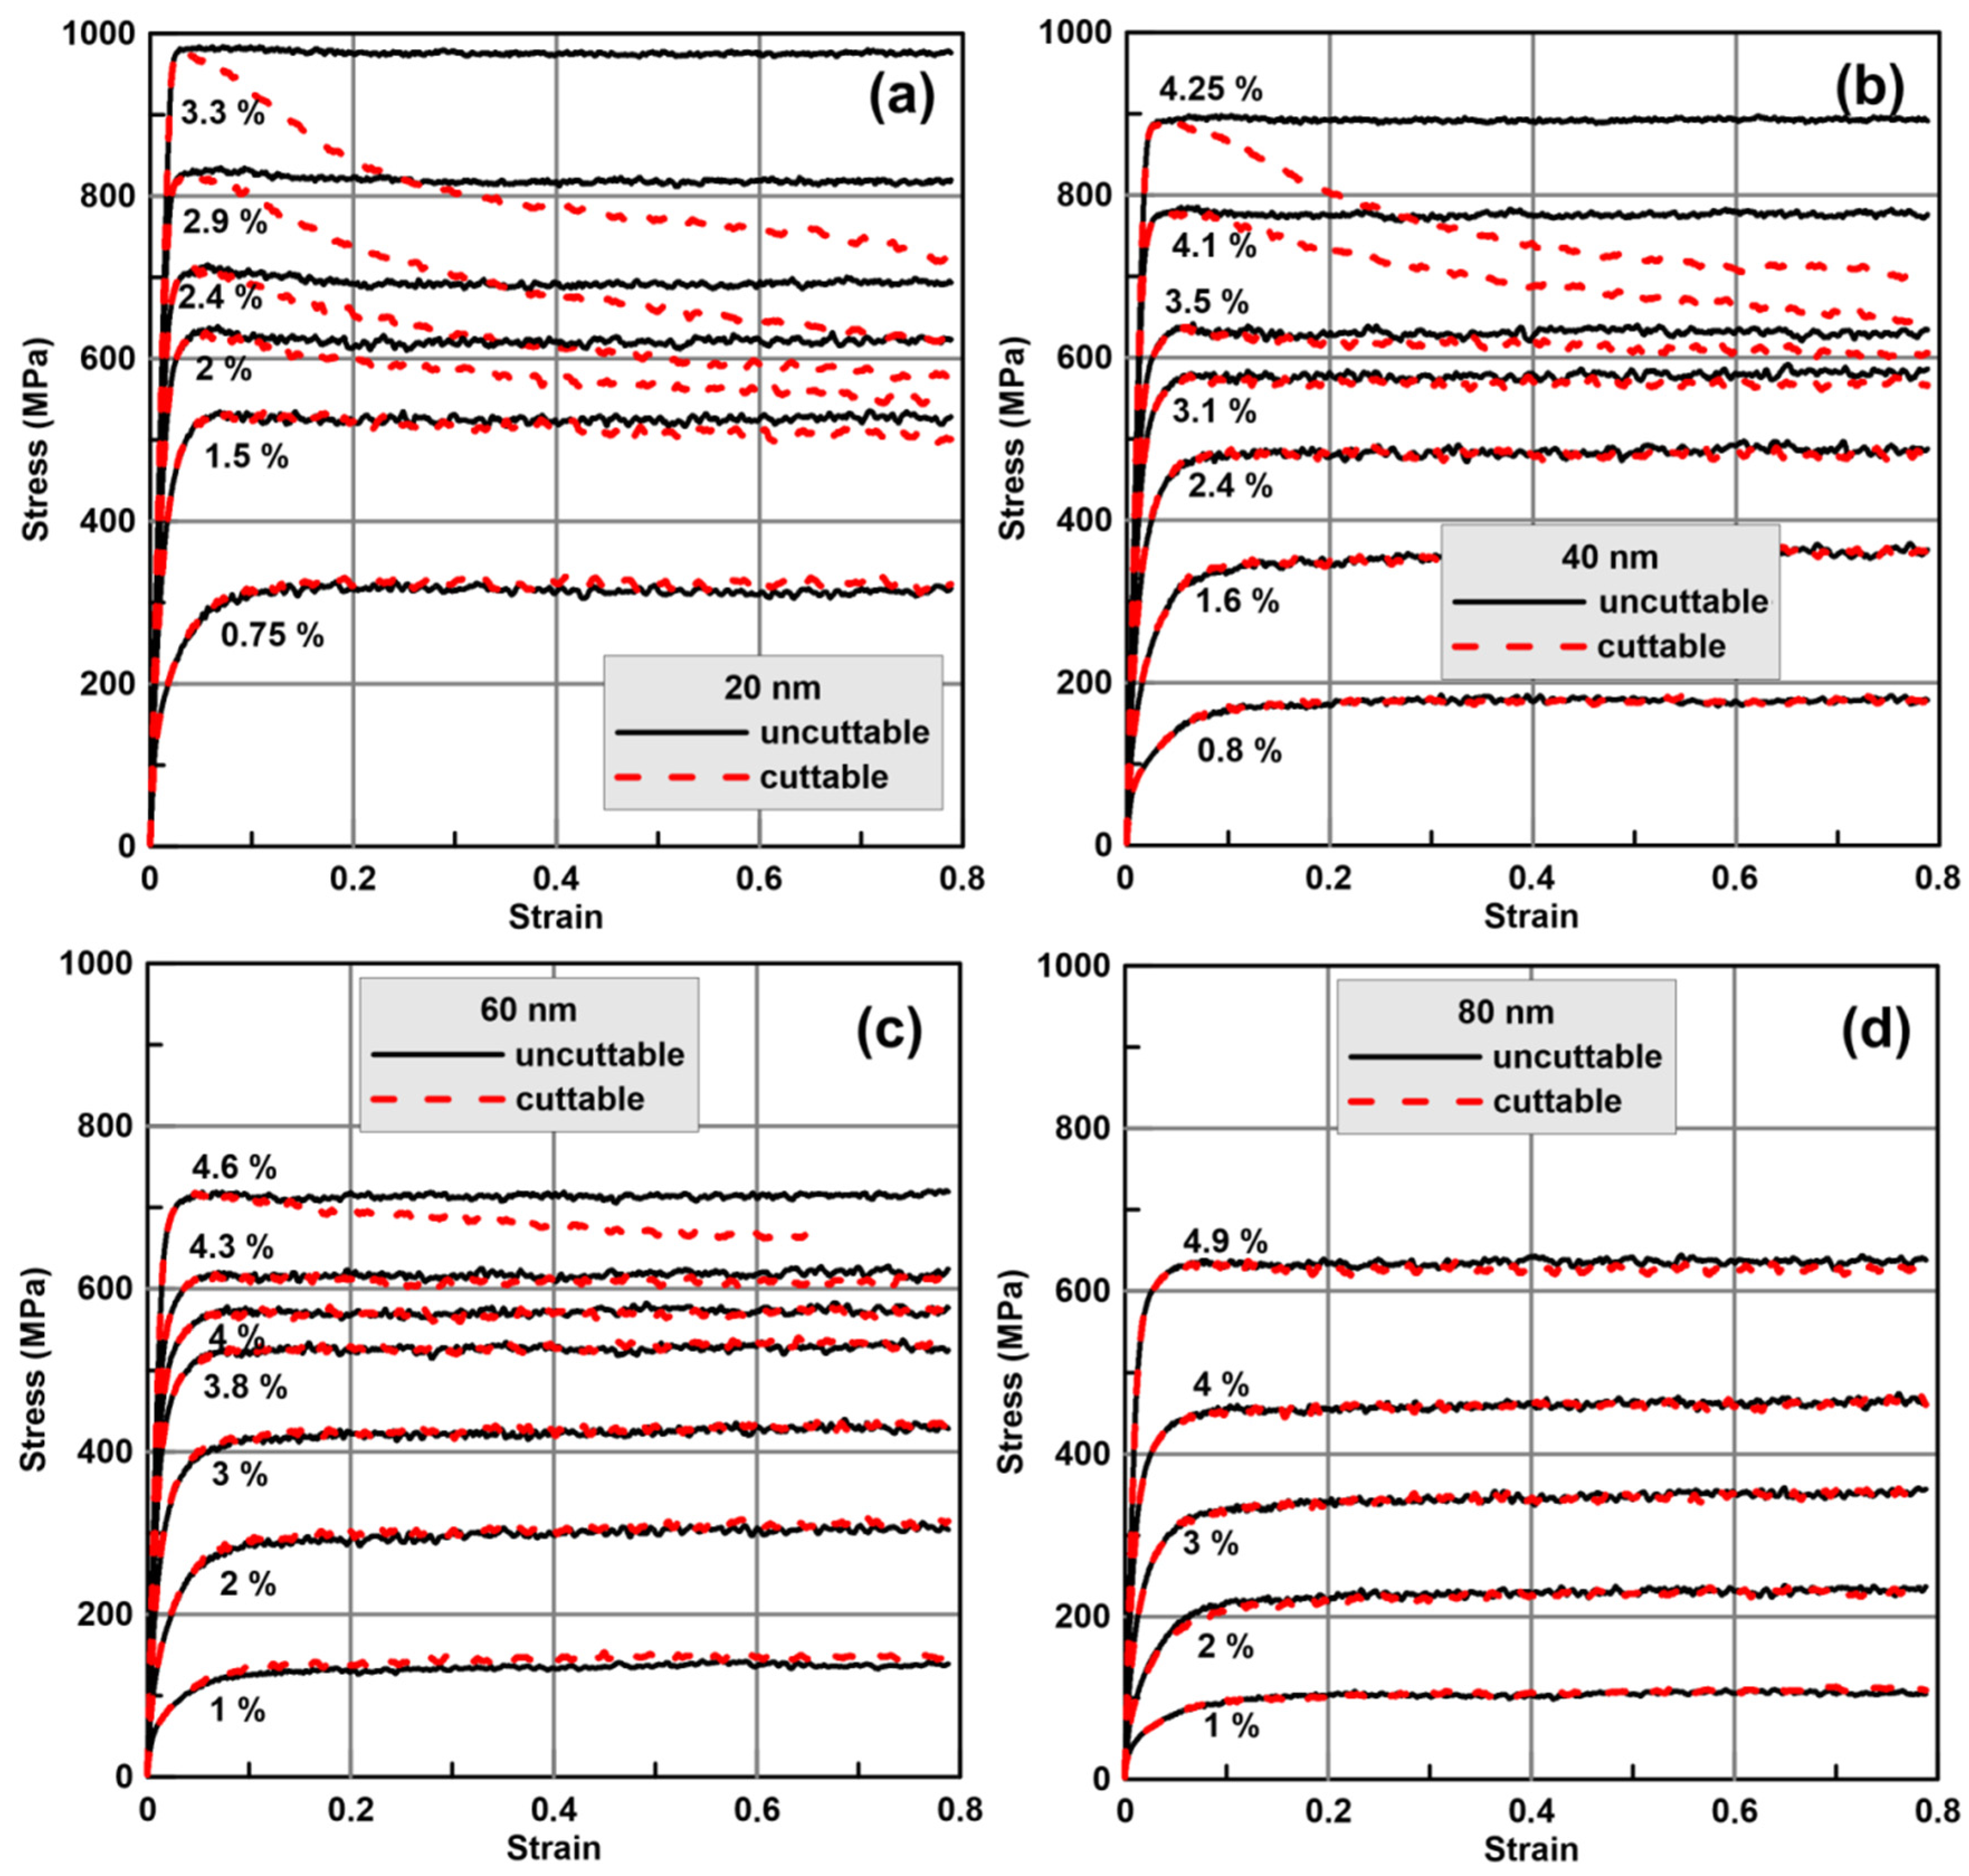
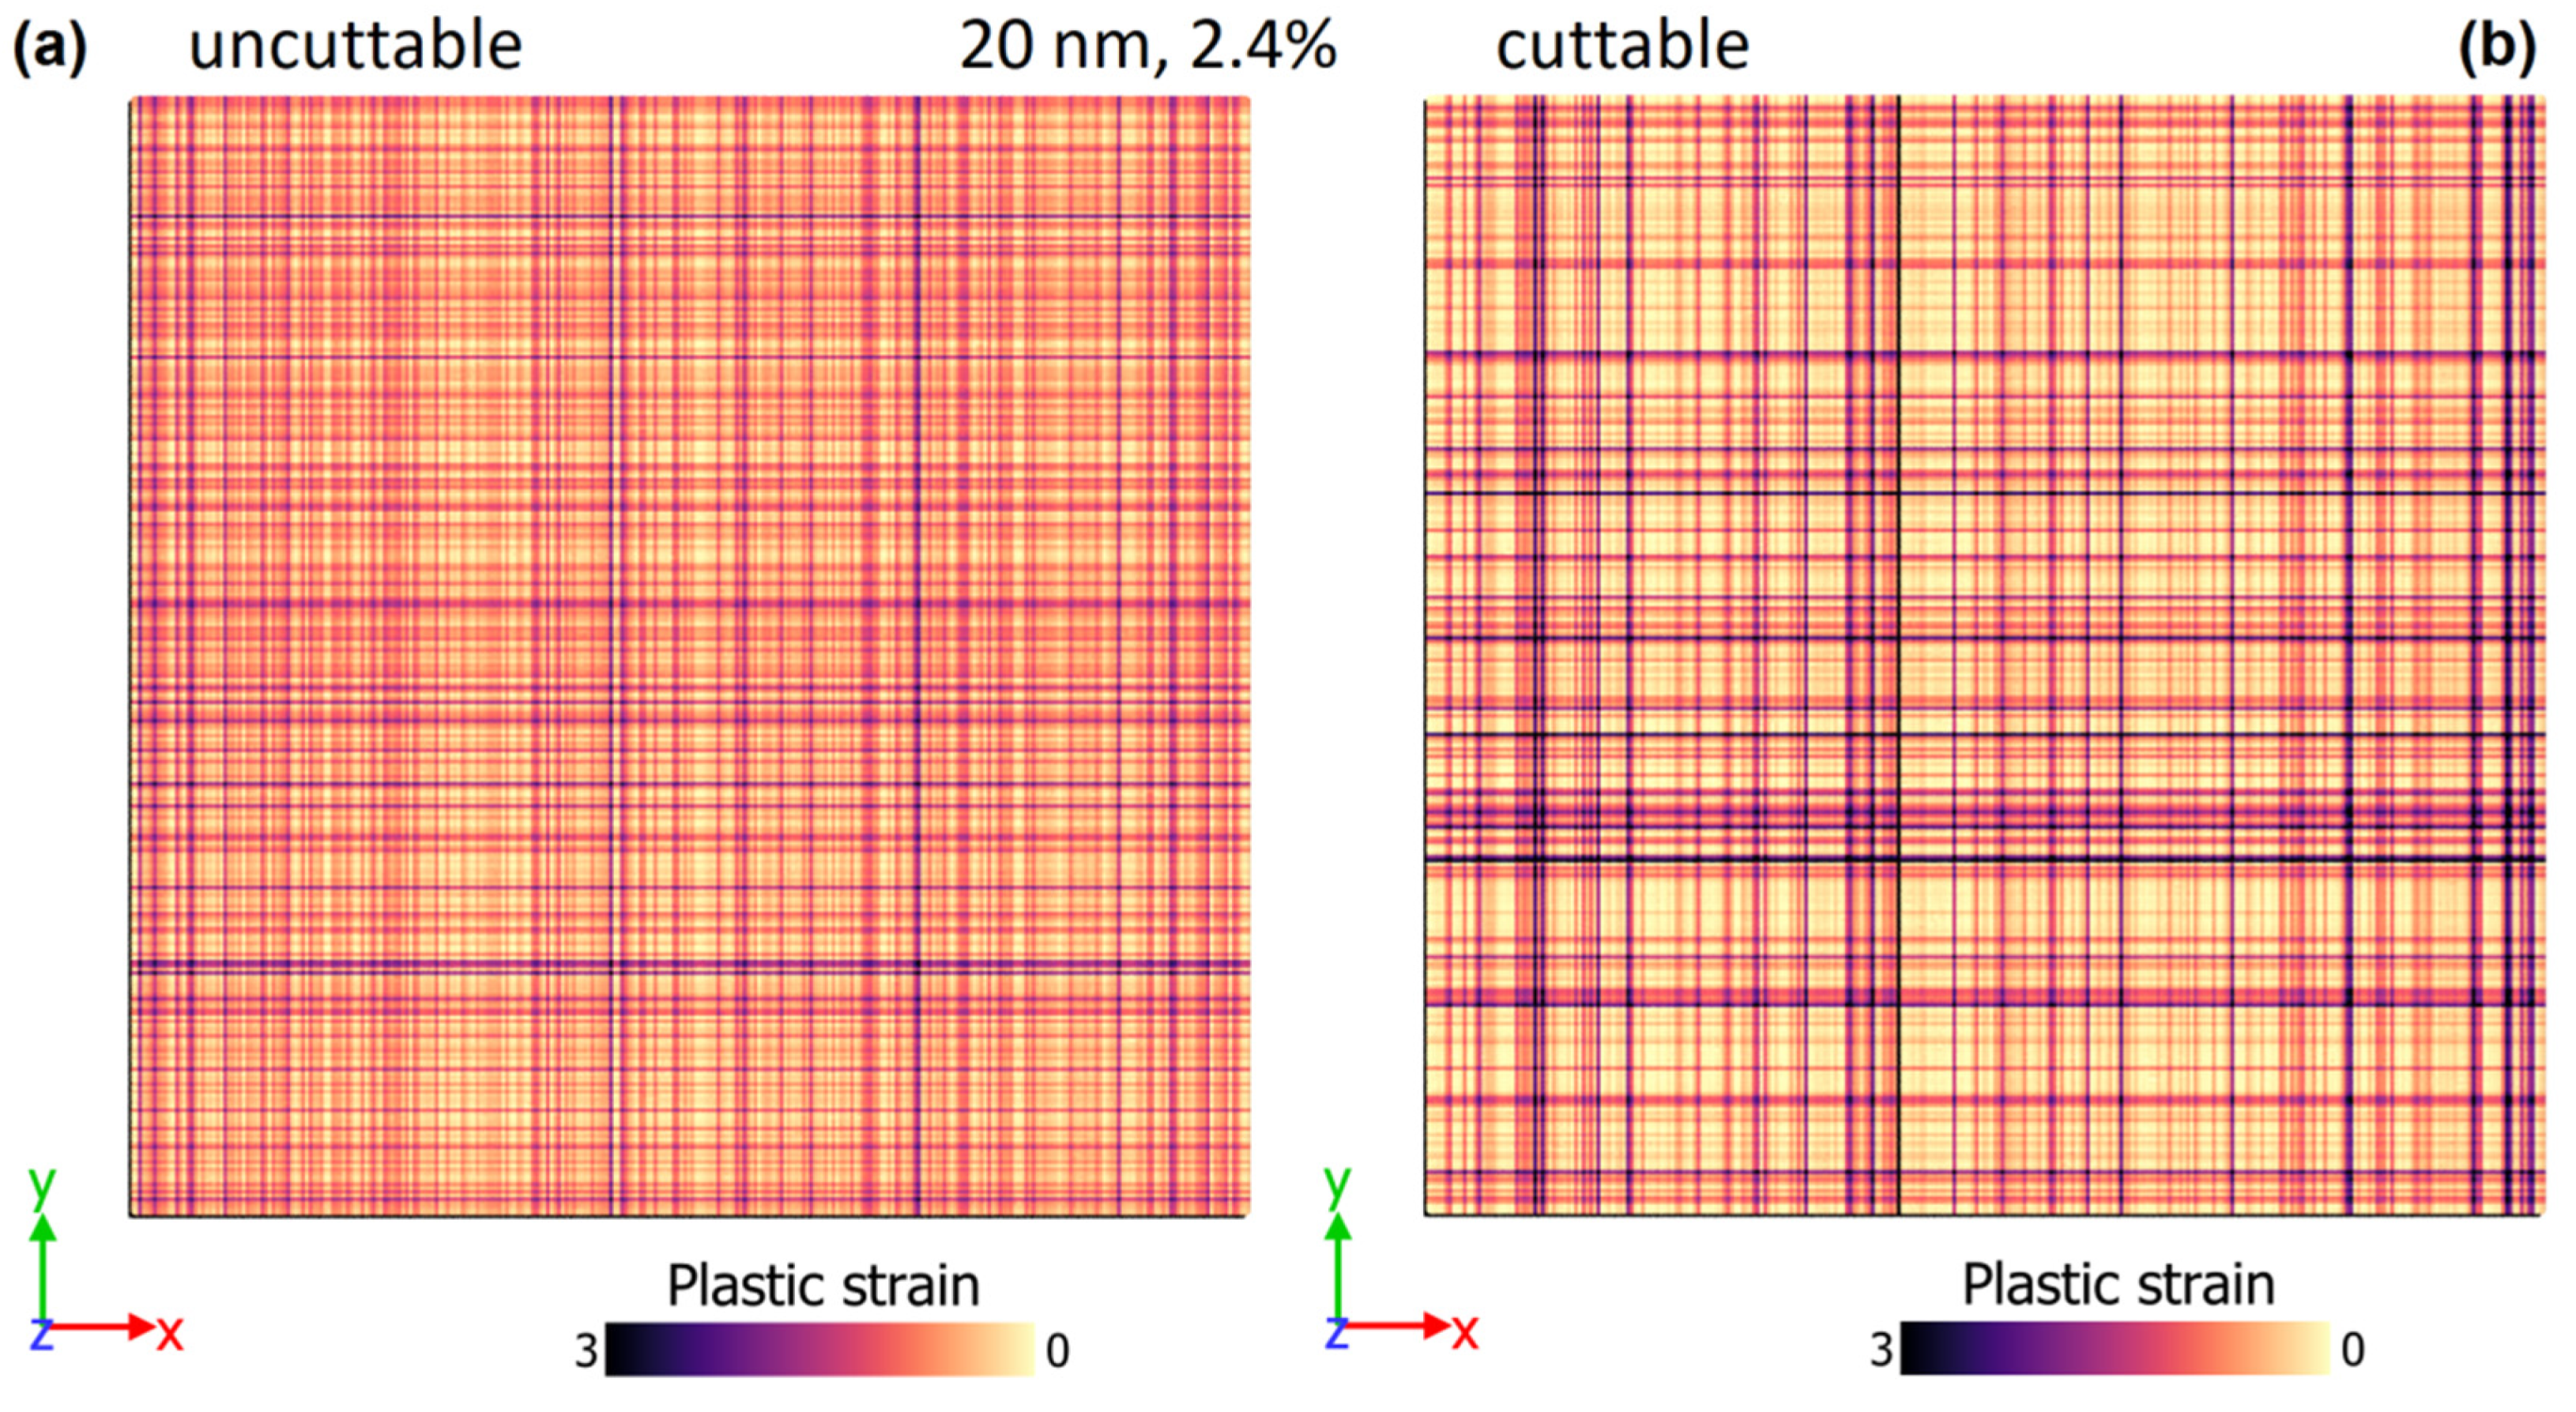
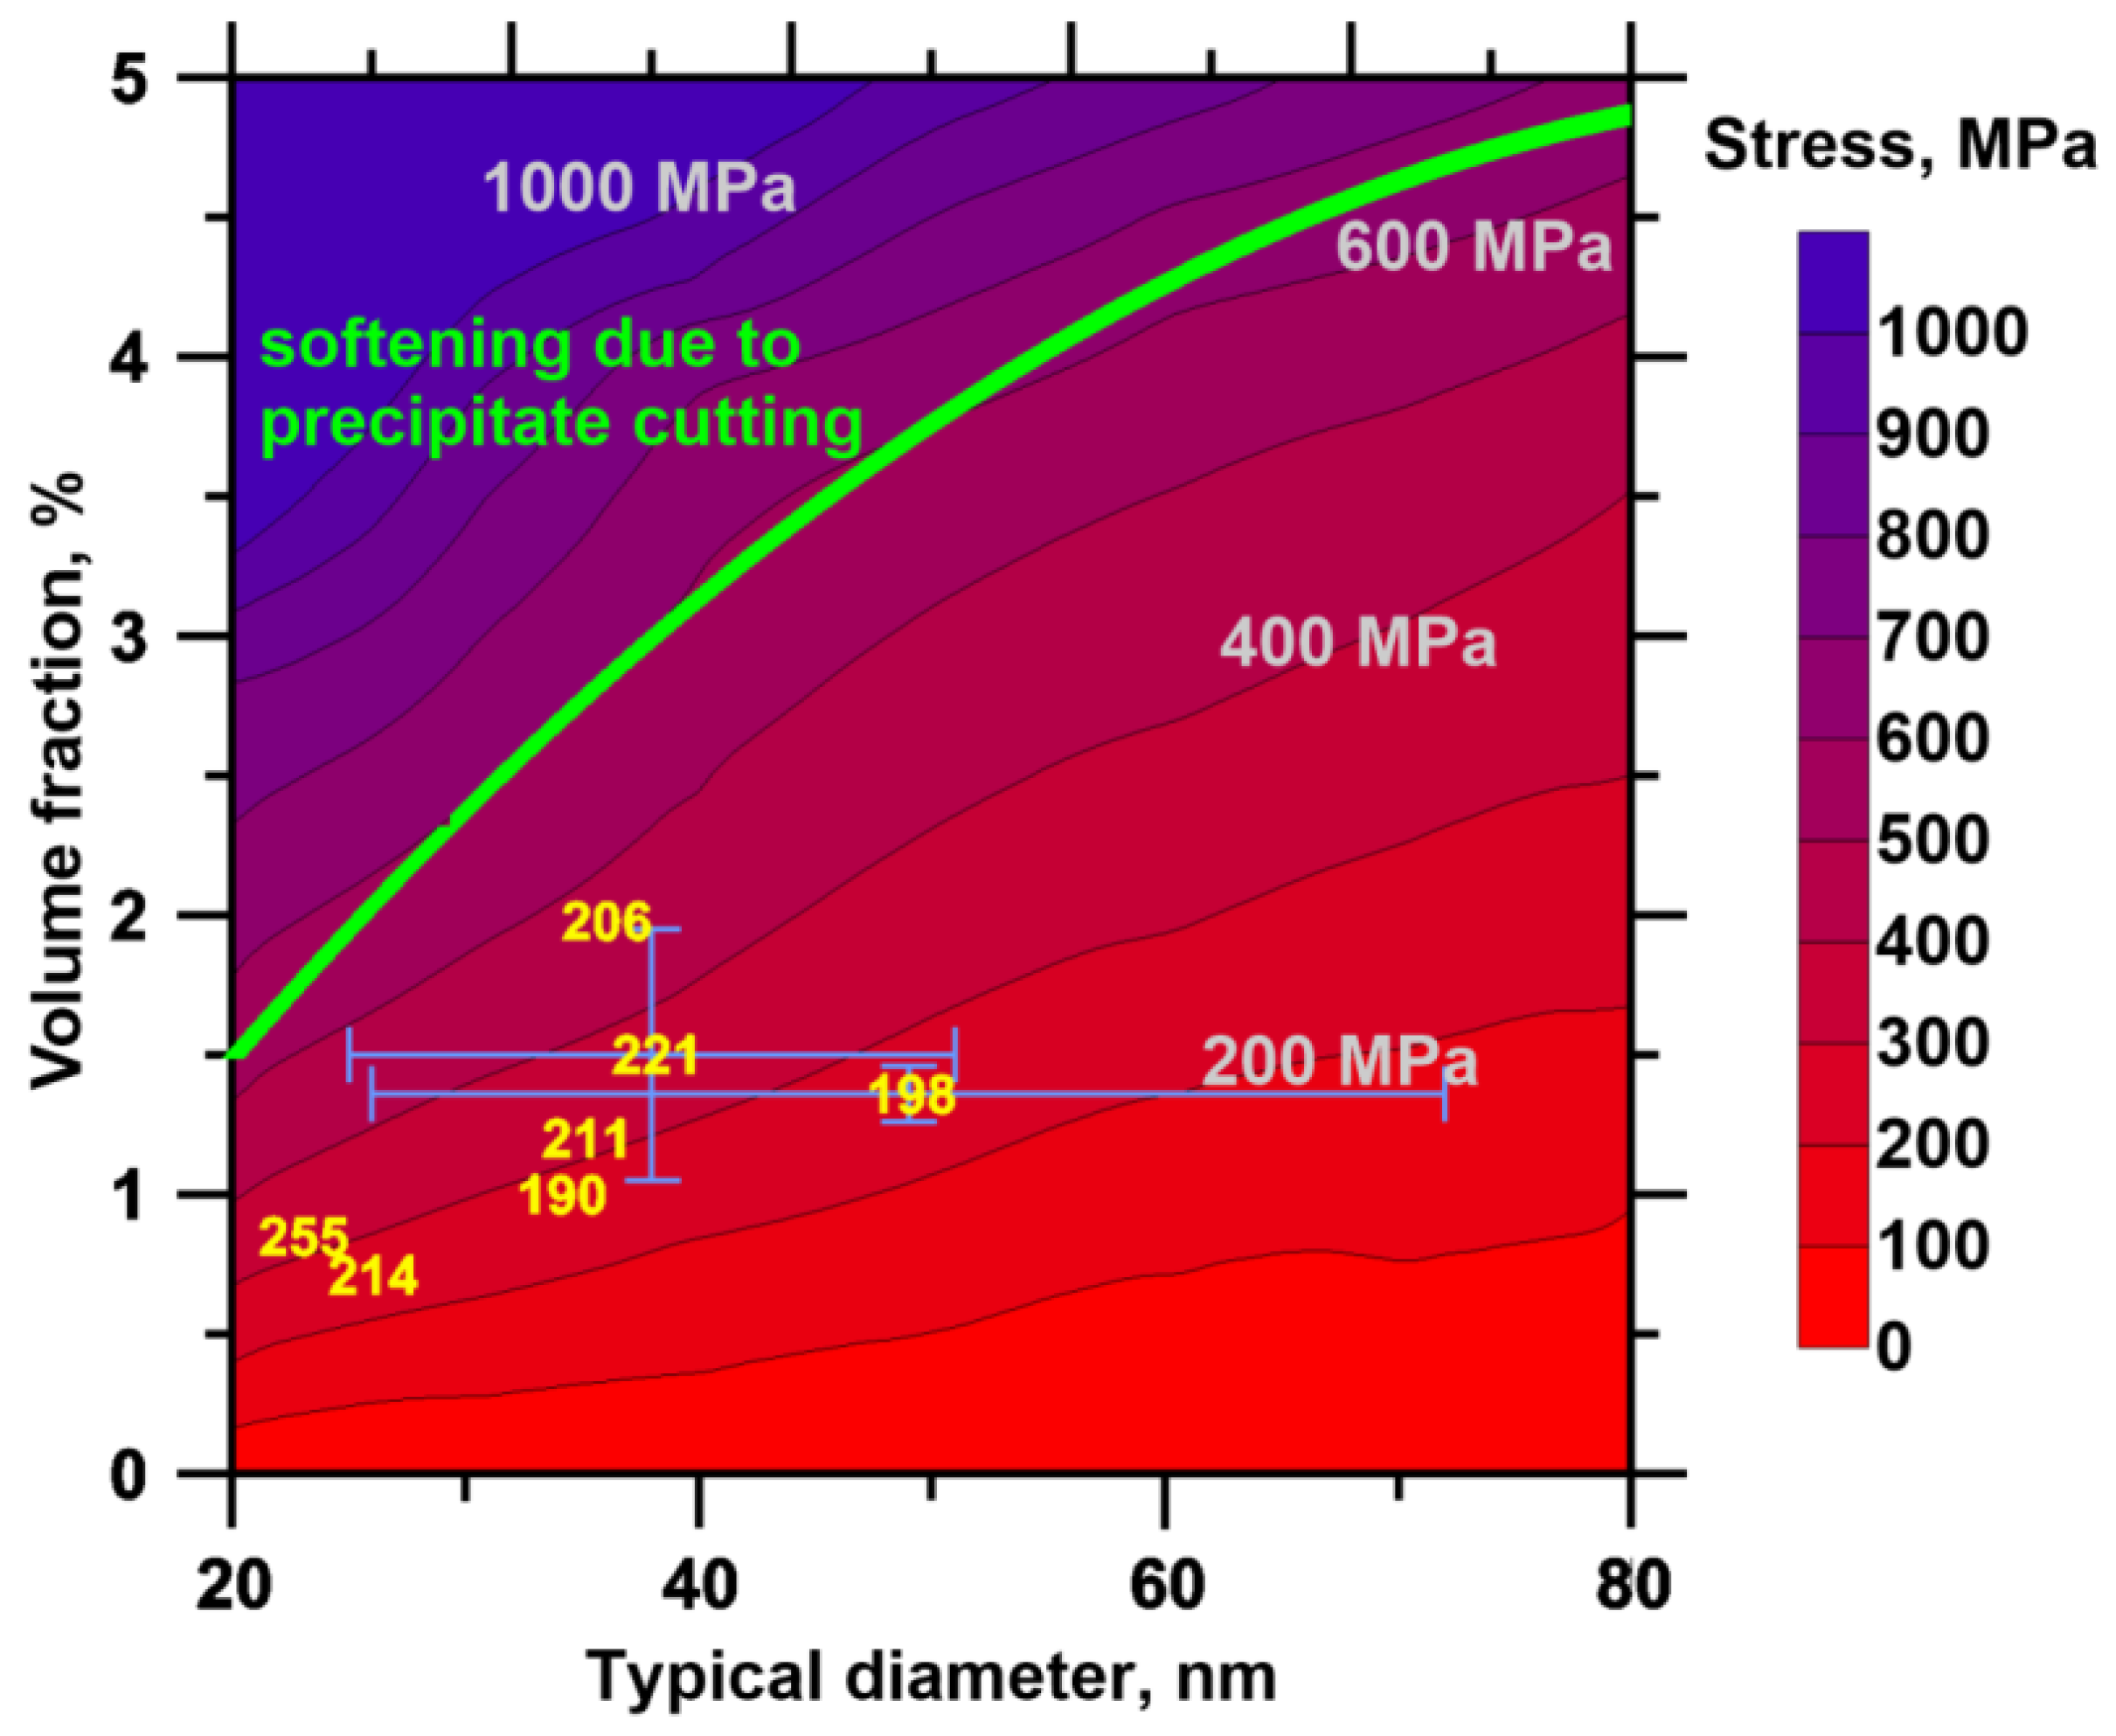
3. Results and Discussion

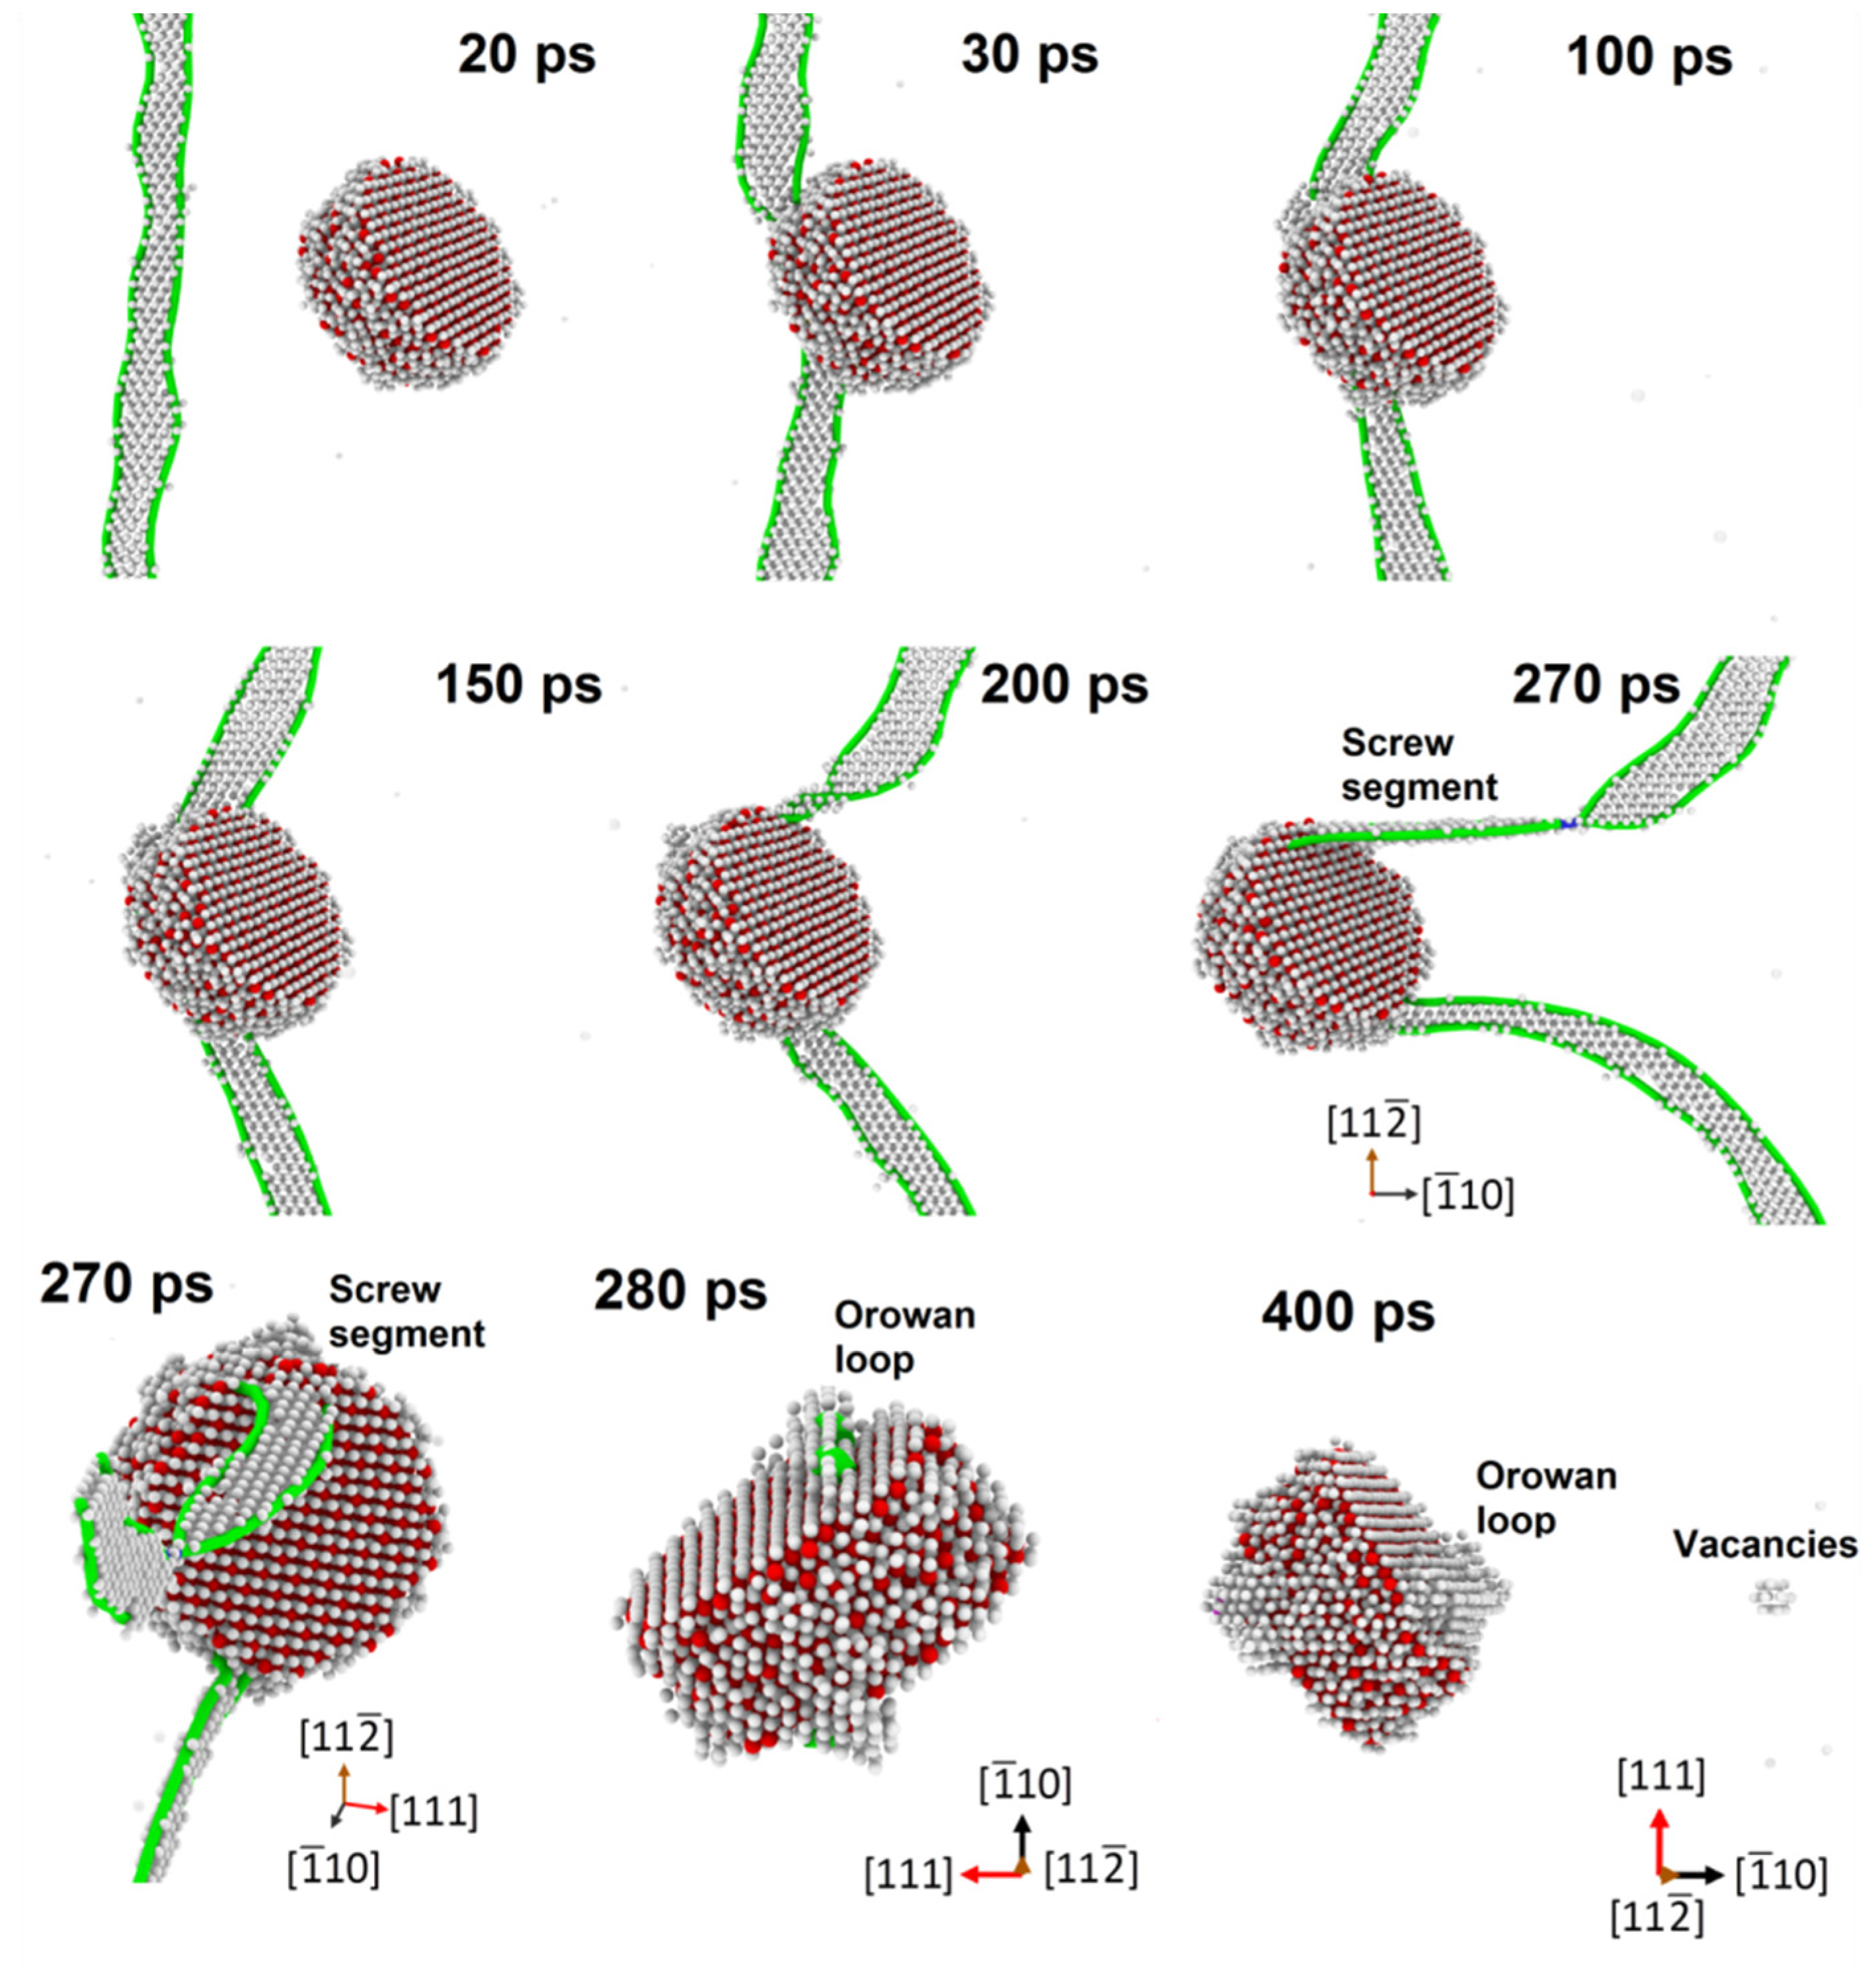
3.1. Mechanism of Interaction of Dislocation with Inclusion in MD

Displacement of the upper boundary of the system along the x-axis leads to the appearance of shear stresses (Figure 4) at the level of several tens of MPa (this fact was described in detail in the previous work [34]). The occurrence of shear stresses in the system brings the dislocation into motion. After a sufficiently short free slip, the interaction between dislocation and θ′ precipitate begins, and dislocation stops on the precipitate. A sharp decrease in the rate of plastic deformation provokes the essential increment in shear stresses in the system up to the level of 300–800 MPa, depending on the temperature and inter-precipitate distance. The details of the process of the first dislocation–precipitate interaction are shown in Figure 5. After approaching the inclusion by dislocation (Figure 5, 20 ps), the dislocation is pulled into the elastic field of inclusion that can be seen as the bending of dislocation toward the inclusion at the moment of 30 ps (Figure 5). With an increment in shear stresses in the region, the dislocation moves along the inclusion rim, significantly bending at the same time (Figure 5, 100–200 ps). At the moment of 200 ps (Figure 5, 200 ps), the formation of the screw segment on the more elongated parts of the dislocation is visible. After formation, this segment experiences a cross-slip, shifts from the initial slip plane and forms a stacking fault in the slip plane rotated relative to the initial one. After the dislocation segments adjacent to the edges of precipitate are so elongated that they are directed along the x-axis (Figure 5, 270 ps), they are closed; and the dislocation separates from the inclusion. The separated dislocation increases its speed, that provokes an increase in the rate of plastic relaxation; and shear stresses in the region temporally decrease (Figure 4). Further, the dislocation crosses the periodic boundary; and a new dislocation–precipitate interaction begins that leads to formation of the second maximum on the dependence of stresses on time (Figure 4). Multiple repeating of this process leads to many peaks on the time dependence of stress corresponding to successive interactions of the dislocation with inclusion. In relation to the plastic deformation of real alloy, this multiple interaction of dislocation with θ′ phase inclusion and the resulting evolution of the inclusion structure and properties can be interpreted as the successive action of different dislocations lying in the same or neighboring slip planes on the same precipitate.

3.2. Influence of Multiple Interactions on the Structure of Inclusion and Stress State of the MD System

When the dislocation separates from the precipitate for the first time, the Orowan loop is closed around the precipitate. The Orowan loop is a region of disordered lattice, on the plane of which the atoms above and below differ in displacement along the x-axis by one perfect Burgers vector. Successive interactions of the dislocation with inclusion lead to the accumulation of lattice mismatch above and below the slip plane of the dislocation that causes the rise of shear stress acting on the inclusion. The first few interactions lead to elastic distortion of the layers of copper atoms in θ′ phase structure (Figure 6, 1–4 interaction). However, an increase in shear stresses causes cutting of θ′ phase after 5–6 interactions with the dislocation. Due to the difference between the slip systems of aluminum matrix and inclusion lattice, the inclusion structure is disordered (Figure 6, 6th interaction). The resulting form of θ′ phase in our simulations is very similar to the experimental image of the sheared θ′ phase shown in [31].
Figure 4 shows the time dependences of the shear stress averaged over the sample for two MD systems at various temperatures. In the dependences (Figure 4), each local maximum of stresses corresponds to the next interaction of the dislocation with the inclusion. For the system of 17.6 nm thickness, about 100 interactions are tracked, and for 9.87 nm—about 60. The system with thickness of 9.87 nm exhibits a significantly higher level of shear stresses due to the smaller distance between inclusions, which provides strong resistance for dislocation motion. At 300 K, the stresses at the first interactions reach 670 MPa in the case of such a small inter-precipitate distance. For a thicker system, the stresses are about 350 MPa. A diminution in the initial stresses acting in the region with increasing temperature is observed for both systems; this behavior was previously recorded in [34,57,58] for all hardening phases of copper in aluminum and is interpreted as a result of a diminution in the energy of interaction of dislocation with the inclusion surface upon heating.
All curves in Figure 4 are characterized by a gradual diminution in the stresses acting in the system with time. However, local increases in stresses are possible that violate the general trend, such as, for example, an interval of 1–3 ns in Figure 4 (17.6 nm) for the temperature of 100 K. Note also the following feature of the plots observed for the system with thickness of 17.6 nm at 500 K after 8 ns and for the system with thickness of 9.87 nm at 100 K after 3 ns: After the indicated time, stabilization of stresses occurs at a certain level without further decrease in the maximum stresses. After reaching such a stationary regime, the amplitude of stress fluctuations in the system also significantly decreases.
Let us consider the processes occurring in the system at the atomic level to explain the obtained dependences of stresses on time. Figure 7 shows the stress and dislocation position graphs for the system with thickness of 17.6 nm at the temperature of 300 K together with the distribution of atoms in the system. It was shown in [34] that upon contact of dislocation with θ′ precipitate on the flat surface of inclusion, the dislocation may exit from a slip plane into an adjacent one due to the climb process. On the rim of inclusion, the dislocation segments are pulled out and get a screw character; after that, the cross-slip of these segments can take place (Figure 7, 470 ps). The consequence of these two processes is the situation when the dislocation separating from inclusion has a central segment located in the overlying slip plane, while other segments are located in the initial plane. Such a dislocation exit from the initial slip plane is accompanied by the formation of the extensive defect structure near inclusion besides the Orowan loop (Figure 7, 470 ps). The movement of dislocation with a segment in the adjacent slip plane is impeded in comparison with sliding in one plane due to the additional energy of the segments connecting the segments in the basic slip plane with the segments located in the adjacent plane. This state is metastable and after a while it spontaneously collapses. The return of the segment from overlying plane to base plane is accompanied by the generation of vacancies in the aluminum matrix (Figure 7, 490 ps) [78]. The volume fraction of vacancies in the system as a time function is shown in Figure 7b; the methodology for their calculation is given below in Section 3.3.
Since the absorption and emission of vacancies by dislocation is attended by the exit of segments from the initial slip plane of dislocation, and the quantity accumulated in system vacancies is large, the exit of whole dislocation from the slip plane occurs with time. Moreover, both the displacement into the underlying slip plane with the vacancy emission and the displacement into the overlying plane are possible. In the latter case, the displacement is stimulated by the dislocation interaction with the obstacle and the transverse slip of the screw dislocation segments on it, and leads to the subsequent absorption of vacancies accumulated in the bulk of aluminum. Figure 7 shows the time dependence of the average position of all dislocation segments in the system along the y-axis. Dislocation segments are determined using the DXA. Note that with increasing deformation in the system, stable vertex dislocation segments are formed, as shown in Figure 7 (2780 ps) as lilac segments. The presence of such segments makes the position of the mobile dislocation found by averaging all the segment coordinates, which is less accurate, but this information is sufficient for a qualitative analysis.
Joint consideration of the dependences of the average stresses in the region, the vertical position of the dislocation and the number of vacancies allows us to draw the following conclusions. Sequential passage of a dislocation through the inclusion in one slip plane leads to a violation of inclusion structure, which provokes the diminution in the resistance to dislocation movement. On the graph of stress versus time, a tendency to diminution in stress in the region is observed. The dependence of the position of dislocation along the y-axis shows the areas of active displacement of segments from one slip plane to another (Figure 7); these periods are in good agreement with the periods of accumulation of vacancies in the region (Figure 7b). The vacancy generation in the region leads to the vertical displacement of dislocation segments to adjacent slip planes, where θ′ phase material is not damaged. This is followed by a sequence of interactions that reduce the strength of inclusion, and then the process of transition to a new plane is repeated. Since the transition from the initial slip plane to the adjacent ones is accompanied by a decrease in the effective diameter of the obstacle swept by the Orowan loop, each subsequent peak on the graph is, on average, below the first maximums related to the interaction of the dislocation with the widest part of copper disks. Successive violation of the disk structure and dominant displacement of dislocation to the underlying slip planes leads to a decrease in the strength of the MD system. Figure 7 demonstrates that at the later stages of deformation, the inclusion almost completely breaks up into individual atoms, significantly spaced apart due to repeated passage of the dislocation.
Figure 8 demonstrates the time dependence of the averaged shear stress in a region 27 nm in thickness containing θ′ precipitate of 18 nm in diameter. Dislocation passes 97 times through the system. The results obtained differ significantly from the case of smaller inclusions. During the first 8 ns, a slight increase in the region-averaged shear stresses is observed, after which there is a sharp decrease in stresses. This behavior of the stresses is due to the fact that the dislocation practically did not move vertically for a long time, interacting both with copper atoms of inclusion and point defects in the slip plane. In this case, θ′ phase split into two halves, which retain their structure (Figure 8b) with formation of a clearly distinguishable bridge of copper atoms between the two halves. The recent experimental methods allow registering both θ′ phase cutting and their significant bending in various regions of deformed micropillar [32]. The patterns obtained experimentally in the bands of localized deformation completely repeat the shape of θ′ phase shown in Figure 8b. Active displacement in the vertical direction is activated after 8 ns, which will lead to a gradual violation of the inclusion structure in other slip planes. By analogy with smaller inclusions, a further decrease in the acting stresses in the system can be expected.

3.3. Accumulation of Vacancies in the MD System during Prolonged Deformation

The generated vacancies increase the defectiveness of material and can promote fracture under additional tensile stresses. The accumulation of microvoids in shear bands was previously assumed to be the initiator of the fracture of material [30]. On the other hand, the accumulation of vacancies can be important for a multi-stage alloy manufacturing process as described in [79]. A large number of vacancies in aluminum alloys after preliminary cyclic deformation allowed the authors to obtain precipitation of very fine particles and to register an increase in strength and elongation properties of alloy relative to traditional aging.
Therefore, we estimate the fraction of free volume in the system associated with the generation of vacancies during plastic deformation. For this purpose, we use the “Construct surface mesh” algorithm implemented in the OVITO package [75]. The probe sphere radius is the parameter of the algorithm; a decrease in this parameter makes the algorithm more sensitive to cavities in the system, but, at the same time, starting from a certain radius of the probe sphere, the algorithm begins to determine the space between the aluminum and copper atoms in the Al2Cu intermetallic compound as voids. We chose two radii, 0.24 and 0.25 nm; the larger of them is not sensitive to the space inside θ′ phase, but underestimates the volume of vacancies in the system; the smaller one more accurately takes into account free volume inside the vacancies, but sometimes detects the volume in inclusion as free one. Figure 9a demonstrates the curves of the free volume fraction by dependence on time corresponding to two radii of 0.24 and 0.25 nm. Note that the difference between these two estimates at the end of MD calculations is 18%. The average curve for two obtained estimates of free volume is additionally given in Figure 9a; this average curve is presented in Figure 7b together with the vertical position of dislocation.
Since the accumulation of the free volume of vacancies in the shear bands can act as the cause of fracture of deformed samples, it is necessary to estimate the rate of vacancy accumulation in the system during the plastic deformation for further construction of the models of material fracture. Figure 9b demonstrates the dependences of the fraction of free volume on time for the systems with inclusion of 5 nm in diameter. The obtained dependences show similar tendencies to the multi-step growth of free volume in the systems. We cannot distinguish explicit dependences of these curves on temperature and system size. Moreover, the curves show a significant scatter in the final value of the free volume fraction. Therefore, we use the same linear approximation for all of these data in order to fix the main tendency towards the accumulation of vacancies. For further use in continuum fracture models, it is necessary to give the dependence of the free volume fraction on the plastic deformation. During the prolonged deformation, the plastic deformation can be considered approximately equal to the total deformation of the system, because the remaining elastic part is much smaller. Finally, the relationship between the fraction of free volume α in MD system and the plastic deformation w can be written as α = 2.4 · 10 3   w .

3.4. Accounting for Precipitate Softening in the Equation of Dislocation Motion

The single parameter of the model in Equations (1) and (2) that describes dislocation–precipitate interaction is the energy of dislocation core ε p for the segments contacting the precipitate. The criterion of its choosing is the best coincidence between the model and MD in the level of oscillations during the first three interactions. Other parameters follow our previous works with other types of precipitates [57,58]. The used parameters are the following: ε 1 = 0.2   eV / b , R 0 = 6 b , ε p = 0.8   eV / b .
Multiple interactions of dislocation with an obstacle lead to a decrease in the average shear stresses in the MD system, as it is shown in Section 3, devoted to MD study. Copper atoms, which initially form the lattice of θ′ phase, are spread out in space, and the dislocation shifts to an edge of the precipitate. Corresponding softening of the precipitate can be described by the decrease in the effective diameter of inclusion, which enters Equation (1). Based on the obtained MD data for two diameters of precipitates, we propose the following dependence to describe the change in the properties of the systems containing small and large inclusions during prolonged plastic deformation:
d = d 0 exp [ k ( d 0 ) N ] ,
where d 0 is the initial diameter of precipitate before the interactions with dislocation, N is the number of interactions and k ( d 0 ) is the exponent dependent on the initial diameter of inclusion. We find the following values for the considered initial diameters: k ( 4.6   nm ) = 0.03 and k ( 18   nm ) = 0.0015 .
The change in diameter of inclusion is introduced into the model, and then calculations are carried out, repeating the MD statement of the loading. The modeled time dependences of the shear stresses averaged over the system for two diameters and two distances between precipitates are shown in Figure 10 together with MD data. The usage of Equation (5) for decrease in the effective diameter of inclusions allows us to obtain dependences, which well reproduce the general trends towards the decrease in stresses in the MD system with the accumulation of plastic deformation. However, this approach cannot describe the features of the multiple dislocation–precipitate interactions in all details. Since here we do not take into account the interaction of dislocation with vacancies emitted after previous interactions, the modeled dependences do not reflect the temporal increase in the stress curves in the MD system. As noted in Section 3.2, for the larger inclusion, the initial stage up to 8 ns is similar to the initial stage of evolution up to 1 ns for smaller inclusions, after which the disordering of the inclusion structure is activated, and a decrease in the average stress becomes more pronounced.
In the experimental work [32], it was shown that upon deformation of the Al–Cu sample containing strengthening particles of θ′ and θ phases, the mechanism of damage of the θ′ precipitates was size-dependent. Cutting was observed for sufficiently small particles with a diameter not exceeding 60 nm, while larger particles acquired only bending. This result is consistent with our data obtained in MD calculations, where it is shown that for the large inclusion of 18 nm in diameter, the decrease in the acting stresses occurs much slower than that for 5 nm ones. Since MD simulation of large systems for a time sufficient for several hundreds of dislocation–obstacle interactions requires large resources, here we are forced to use the available experimental data in addition to our MD and assume that softening does not occur for inclusions larger than 60 nm. Using the additional value k ( 60   nm ) = 0 from this experimental observation, we approximate three values, two from the MD and one from the experimental observation [32], by the following exponential law:
k ( d 0 ) = 0.084 · exp [ d 0 · 0.224   nm 1 ] .

3.5. Strength of Alloys with Size-Distributed and Spatially Distributed Precipitates

Real alloys contain inclusions of different sizes distributed in the material bulk. The authors of [24] experimentally established the log-normal size distribution of precipitate diameter and thickness for various types of inclusions in aluminum alloys after different aging times.
In contrast to previous work, here we consider the case of θ′ phase by means of using the corresponding parameters determined in Section 3.4. We take into account possible strain softening of the material due to a decrease in the precipitate size during prolonged plastic deformation as discussed in Section 3.4. In order to reveal the influence of change in precipitate structure during the multiple interactions with dislocations, for each precipitate distribution, we perform calculation for two cases: the first one, “uncuttable”, is a virtual case of the constant size of each inclusion, even small ones; the second one is “cuttable”, accounting for the effective reduction in precipitate diameter in the course of plastic deformation according to Equations (5) and (6).
The chains of precipitates are randomly placed in the computation domain. The diameters of precipitates are randomly chosen in accordance with the log-normal distributions established in experiments [24], but with different typical size, which is the value close to the maximum of the size distribution of precipitates—see [57] for details. Because cutting influences on small inclusions, here we restrict ourselves by the typical size no more than 80 nm, while the distributions with the typical sizes up to 130 nm are observed experimentally [24] and analyzed in our previous simulations [57].
The calculated stress–strain curves for different typical sizes and volume fractions of inclusions, which are almost equal to the mass fractions of copper atoms, are presented in Figure 11 for both problem statements with and without accounting for the evolution of precipitate size at multiple interactions. In the approximation of uncuttable inclusions, the shear stress reaches some plateau and holds at this level till the end of the system tracing. The initial growth of shear stress corresponds to the transient stage, during which most dislocations reach strong obstacles in the form of precipitates of large diameter and become fixed. Only a portion of dislocations continues to move along the weakest bands of material, in which there are no strong obstacles. It leads to strong localization of the plastic deformation in the system [57]. The reached level of shear stress increases with the increase in the volume fraction of precipitates, but decreases with the increase in their size at constant volume fraction. This is because the increase in precipitate size leads to a decrease in the precipitate concentration, which increases the probability of the formation of weak bands in the material.
One can conclude from Figure 11 that the evolution of precipitate size leads to strain softening, which means diminution in shear stress acting in the system at large strains. Only alloys with a high enough volume fraction of precipitates suffer from the softening. It is explained by the fact that, at small volume fractions, there is already enough weak bands in the material, and further weakening of precipitates in these bands does not influence the mechanical response. On the other hand, a large concentration of precipitates eliminates the weak bands. Dislocations are forced to move along higher strength paths, and a higher level of stress holds in the system. In this case, gradual cutting of precipitates weakens the most frequently walked bands and provides the material softening. The increase in localization of plastic flow due to precipitate cutting is illustrated in Figure 12 with the spatial distributions of plastic strain; cutting forms several weaker paths, which concentrate the most part of the plastic strain.
The threshold volume fraction of the beginning of softening increases with the increase in typical precipitate size: a weak softening is observed for the volume fraction of 1.5% in the case of 20 nm precipitates (Figure 11a), while it starts only at 4.9% in the case of 80 nm precipitates (Figure 11d). There are two reasons for such behavior: (1) decrease in concentration and increase in the number of weak paths for large precipitates and (2) the small pliability of cutting of large precipitates because the cutting touches only precipitates smaller than 60 nm in diameter in accordance with Equation (6).
The results of our dislocation dynamics calculations are summarized in the diagram in Figure 13 and supported by experimental data on the yield stress in Al–Cu alloy dependent on typical diameter and volume fraction of θ′ phase precipitates [37]. The maximal shear stress before the beginning of softening is presented as dependent on typical precipitate diameter of the log-normal distribution and the volume fraction of precipitates. Our results are in satisfactory agreement with the experimental data, taking into account rather large errors in determining both the typical diameter of inclusions and their volume fraction. The range of parameters of alloys prone to strain softening due to the destruction of precipitates is indicated. It follows from our calculation that precipitates with a small typical diameter provide higher maximal strength, but suffer from the strain softening and plastic flow localization. This conclusion is supported by the existing experimental results. According to our calculations, the boundary of the domain suffering from softening almost coincides with the maximal stress level of 600 MPa, which means that the alloys with higher strength are subjected to softening. It should be also mentioned that high plastic deformation inside the localization bands leads to formation of a lot of vacancies—see Section 3.3—which can facilitate the tensile fracture.

4. Conclusions

Our molecular dynamics study reveals the complex character of the interaction of dislocations with θ′ phase precipitates. It is shown that the first several interactions occur in accordance with the Orowan looping mechanism, while the subsequent interactions provoke a gradual degradation of the precipitate structure up to its scattering into individual copper atoms in the aluminum matrix. θ′ phase shape at various stages of this process obtained in our calculations repeats the experimentally observed one for cut inclusions of θ′ phase [31,32]. Structural changes in θ′ phase lead to a gradual decrease in the strength of the obstacle to dislocation that is expressed in a decrease in shear stresses acting in the MD system. This softening of θ′ phase occurs with different rates, depending on the diameter of precipitate: studied inclusions of 15 nm in diameter demonstrate a significantly slower decrease in strength in comparison with 5 nm ones.
During interactions with inclusion of θ′ phase, the dislocation can leave the initial slip plane due to the cross-slip of segments elongated around the inclusion, which acquire a screw character. After separation from the precipitate, the dislocation moves for some time with a segment ejected into the adjacent slip plane; however, this state is unstable and the dislocation tends to move into one slip plane. Transition of dislocation segments between slip planes is accompanied by emission of vacancies. Volume fraction of accumulated vacancies α increases significantly during the prolonged plastic deformation of the MD system and can be estimated by the following approximating relation with the plastic strain w as α = 2.4 · 10 3   w . Estimations of the volume fraction of free space are important because microvoids can facilitate fracture of material in the plastic localization bands under additional action of tensile stresses [30].
The obtained results of MD calculations are used for fitting the dislocation–precipitate interaction model proposed earlier in [34,57,58]. The softening of θ′ phase is introduced into the model through reducing the effective diameter of precipitate. We additionally introduce a dependence of the softening coefficient on the diameter of precipitates into the model. This dependence is based on the different rates of softening of θ′ inclusions depending on its diameter registered in our MD calculations, and the experimental data on the existence of a threshold diameter of θ′, after which no cutting is observed [32].
The model of dislocation–precipitate interaction, which is modified to account for the precipitate softening, is coupled with a 2D discrete dislocation dynamics model [57], which makes it possible to predict the flow stress of alloy depending on the size distribution of precipitates. We compare the predictions of shear strength of Al–Cu alloy obtained with 2D DDD and the experimental data on the dependence of flow stress on the size distribution for the case of θ′ phase precipitates [37]. Taking into account the rather significant error in determining the typical diameter of precipitates and their volume fraction in the experiment, we can conclude that our results are in satisfactory agreement with the experimental data and reproduce the main experimental trend of decrease in flow stress, together with the increase in the mean diameter of precipitates at a constant volume fraction of them.
The performed 2D DDD simulation made it possible to identify the region of typical particle sizes and concentrations of θ′ precipitates, in which the softening of alloy during prolonged plastic deformation can be expected. This boundary with a good accuracy is above the 600 MPa shear strength for all considered model alloys. The present model does not include kinematic hardening by forest dislocations and other terms contributing to the overall strength of alloy, but it elucidates the contribution of precipitate hardening and its decrease with strain due to the evolution of precipitates. The softening of θ′ particles may result in a decrease in the rate of strain hardening of alloy upon deformation, which is known for weaker phase particles in aluminum alloys [16]. Even if the softening of precipitates is compensated for, for example, by the hardening due to forest dislocations, taking into account the softening of precipitates still remains important. Dislocations tend to pass through the weakest places of precipitate distribution. Multiple dislocation–precipitate interactions in these paths leads to the softening of weak obstacles in the paths and further redistributes the plastic deformation in the sample volume towards these paths, as it is shown in our calculations. The sharpening of plastic deformation distribution in the localization bands should lead to additional generation of vacancies and an increase in the volume fraction of microvoids and degradation of alloy durability.

Author Contributions

Conceptualization, V.S.K. and A.E.M.; methodology, V.S.K. and A.E.M.; software, A.E.M. and V.V.P.; validation, V.S.K., A.E.M. and M.R.G.; formal analysis, V.S.K. and A.E.M.; investigation, V.S.K., A.E.M. and V.V.P.; writing—original draft preparation, V.S.K. and A.E.M.; writing—review and editing, V.S.K., A.E.M. and V.V.P.; visualization, V.S.K.; project administration, V.S.K.; funding acquisition, V.S.K. All authors have read and agreed to the published version of the manuscript.

Funding

This work is supported by the Russian Science Foundation in the frames of Project No. 18-71-10038.

Institutional Review Board Statement

Not applicable.

Informed Consent Statement

Not applicable.

Conflicts of Interest

The authors declare no conflict of interest.

References

  1. Zener, C.; Hollomon, J.H. Effect of Strain Rate upon Plastic Flow of Steel. J. Appl. Phys. 1944, 15, 22–32. [Google Scholar] [CrossRef]
  2. Bai, Y.; Dodd, B. Shear Localization: Occurrence Theories and Applications; Pergamon Press: Oxford, UK, 1992. [Google Scholar]
  3. Wright, T. The Physics and Mathematics of Adiabatic Shear Bands; Cambridge University Press: Cambridge, UK, 2002. [Google Scholar]
  4. Walley, S.M. Shear Localization: A Historical Overview. Metall. Mater. Trans. A 2007, 38, 2629–2654. [Google Scholar] [CrossRef]
  5. Price, R.J.; Kelly, A. Deformation of age-hardened aluminium alloy crystals—I plastic flow. Acta Metall. 1964, 12, 159–169. [Google Scholar] [CrossRef]
  6. Asaro, R.J.; Rice, J.R. Strain localization in ductile single crystals. J. Mech. Phys. Solids 1977, 25, 309–338. [Google Scholar] [CrossRef] [Green Version]
  7. Medyanik, S.; Liu, W.; Li, S. On criteria for adiabatic shear band propagation. J. Mech. Phys. Solids 2007, 55, 1439. [Google Scholar] [CrossRef]
  8. Rittel, D.; Landau, P.; Venkert, A. Dynamic recrystallization as a potential cause for adiabatic shear failure. Phys. Rev. Lett. 2008, 101, 165501. [Google Scholar] [CrossRef] [Green Version]
  9. Clayton, J.D. Modeling effects of crystalline microstructure, energy storage mechanisms, and residual volume changes on penetration resistance of precipitate-hardened aluminum alloys. Compos. Part B 2009, 40, 443–450. [Google Scholar] [CrossRef]
  10. Mayer, A.E.; Borodin, E.N.; Mayer, P.N. Localization of plastic flow at high-rate simple shear. Int. J. Plast. 2013, 51, 188–199. [Google Scholar] [CrossRef]
  11. Osovski, S.; Rittel, D.; Venkert, A. The respective influence of microstructural and thermal softening on adiabatic shear localization. Mech. Mater. 2013, 56, 11–22. [Google Scholar] [CrossRef]
  12. Krasnikov, V.S.; Mayer, A.E. Modeling of plastic localization in aluminum and Al–Cu alloys under shock loading. Mater. Sci. Eng. A 2014, 619, 354–363. [Google Scholar] [CrossRef]
  13. Rodríguez-Martínez, J.A.; Vadillo, G.; Zaera, R.; Fernández-Sáez, J.; Rittel, D. An analysis of microstructural and thermal softening effects in dynamic necking. Mech. Mater. 2015, 80, 298–310. [Google Scholar] [CrossRef] [Green Version]
  14. Gurrutxaga-Lerma, B. Adiabatic shear banding and the micromechanics of plastic flow in metals. Int. J. Solids Struct. 2018, 132–133, 153–170. [Google Scholar] [CrossRef]
  15. Dorin, T.; De Geuser, F.; Lefebvre, W.; Sigli, C.; Deschamps, A. Strengthening mechanisms of T1 precipitates and their influence on the plasticity of an Al–Cu–Li alloy. Mater. Sci. Eng. A 2014, 605, 119–126. [Google Scholar] [CrossRef]
  16. Deschamps, A.; De Geuser, F.; Dorin, T.; Weyland, M. The influence of precipitation on plastic deformation of Al-Cu-Li alloys. Acta Mater. 2013, 61, 4010–4021. [Google Scholar] [CrossRef]
  17. Gazizov, M.; Kaibyshev, R. Low-cyclic fatigue behavior of an Al–Cu–Mg–Ag alloy under T6 and T840 conditions. Mater. Sci. Technol. 2017, 33, 688–698. [Google Scholar] [CrossRef]
  18. Azimi, A.; Owolabi, G.M.; Fallahdoost, H.; Kumar, N.; Warner, G. Dynamic Failure Investigation in Ultrafne Grained AA2219: Mechanical and Microstructural Analysis. Met. Mater. Int. 2019, 25, 900–911. [Google Scholar] [CrossRef]
  19. Kim, N.; Lee, E. Effect of T1 precipitate on the anisotropy of Al-Li alloy 2090. Acta Metall. Mater. 1993, 41, 941–948. [Google Scholar] [CrossRef]
  20. Gerold, V. On the structures of Guinier-Preston zones in Al-Cu alloys introductory paper. Scr. Metall. 1988, 22, 927–932. [Google Scholar] [CrossRef]
  21. Doherty, R.D. Physical Metallurgy; Cahn, R.W., Hassen, P., Eds.; Elsevier Science: New York, NY, USA, 1996. [Google Scholar]
  22. Starink, M.J.; Zahra, A.-M. Mechanisms of combined GP zone and θ′ precipitation in an Al-Cu alloy. J. Mater. Sci. Lett. 1997, 16, 1613–1615. [Google Scholar] [CrossRef]
  23. Ma, Z.; Zhan, L.; Liu, C.; Xu, L.; Xu, Y.; Ma, P.; Li, J. Stress-level-dependency and bimodal precipitation behaviors during creep ageing of Al-Cu alloy: Experiments and modeling. Int. J. Plast. 2018, 110, 183–201. [Google Scholar] [CrossRef]
  24. Zuiko, I.; Kaibyshev, R. Effect of plastic deformation on the ageing behaviour of an Al–Cu–Mg alloy with a high Cu/Mg ratio. Mater. Sci. Eng. A 2018, 737, 401–412. [Google Scholar] [CrossRef]
  25. Da Costa Teixeira, J.; Bourgeoisa, L.; Sinclaird, C.W.; Hutchinson, C.R. The effect of shear-resistant, plate-shaped precipitateson the work hardening of Al alloys: Towards a predictionof the strength–elongation correlation. Acta Mater. 2009, 57, 6075–6089. [Google Scholar] [CrossRef]
  26. Murayama, M.; Horita, Z.; Hono, K. Microstructure of two-phase Al–1.7 at% Cu alloy deformed by equal-channel angular pressing. Acta Mater. 2001, 49, 21–29. [Google Scholar] [CrossRef]
  27. Liu, Z.; Bai, S.; Zhou, X.; Gu, Y. On strain-induced dissolution of θ′ and θ particles in Al–Cu binary alloy during equal channel angular pressing. Mater. Sci. Eng. A 2011, 528, 2217–2222. [Google Scholar] [CrossRef]
  28. Dobromyslov, A.V.; Taluts, N.I.; Uksusnikov, A.N.; Kozlov, E.A. Effect of spherically converging shock waves on the phase and structural states of the artificially aged Al–4 wt % Cu alloy. Phys. Met. Metallogr. 2012, 113, 418–425. [Google Scholar] [CrossRef]
  29. Da-xiang, S.; Xin-ming, Z.; Ling-ying, Y.; Gang, G.; Hai-chun, J.; Xing-hui, G. Evolution of θ′ precipitate in aluminum alloy 2519A impacted by split Hopkinson bar. Mater. Sci. Eng. A 2015, 620, 241–245. [Google Scholar] [CrossRef]
  30. Olasumboye, A.T.; Owolabi, G.M.; Odeshi, A.G.; Yilmaz, N.; Zeytinci, A. Dynamic Response and Microstructure Evolution of AA2219-T4 and AA2219-T6 Aluminum Alloys. J. Dyn. Behav. Mater. 2018, 4, 151. [Google Scholar] [CrossRef]
  31. Chung, T.F.; Yang, Y.L.; Hsiao, C.N.; Li, W.C.; Huang, B.M.; Tsao, C.S.; Shi, Z.; Lin, J.; Fischione, P.E.; Ohmura, T.; et al. Morphological evolution of GP zones and nanometer-sized precipitates in the AA2050 aluminium alloy. Int. J. Lightweight Mater. Manuf. 2018, 1, 142–156. [Google Scholar] [CrossRef]
  32. Kaira, C.S.; Stannard, T.J.; De Andrade, V.; De Carlo, F.; Chawla, N. Exploring novel deformation mechanisms in aluminum-copper alloys using in situ 4D nanomechanical testing. Acta Mater. 2019, 176, 242–249. [Google Scholar] [CrossRef]
  33. Adlakha, I.; Garg, P.; Solanki, K.N. Revealing the atomistic nature of dislocation-precipitate interactions in Al-Cu alloys. J. Alloys Compd. 2019, 797, 325–333. [Google Scholar] [CrossRef]
  34. Krasnikov, V.S.; Mayer, A.E. Dislocation dynamics in aluminum containing θ′ phase: Atomistic simulation and continuum modeling. Int. J. Plast. 2019, 119, 21–42. [Google Scholar] [CrossRef]
  35. Zhang, P.; Bian, J.J.; Yang, C.; Zhang, J.Y.; Liu, G.; Weiss, J.; Sun, J. Plate-like precipitate effects on plasticity of Al-Cu micro-pillar: {100}-interfacial slip. Materialia 2019, 7, 100416. [Google Scholar] [CrossRef] [Green Version]
  36. Ma, P.P.; Liu, C.H.; Wu, C.L.; Liu, L.M.; Chen, J.H. Mechanical properties enhanced by deformation-modified precipitation of θ′-phase approximants in an Al-Cu alloy. Mater. Sci. Eng. A 2016, 676, 138–145. [Google Scholar] [CrossRef]
  37. Zuiko, I.; Kaibyshev, R. Ageing response of cold-rolled Al–Cu–Mg alloy. Mater. Sci. Eng. A 2020, 781, 139148. [Google Scholar] [CrossRef]
  38. Lumley, R.N.; Polmear, I.J.; Morton, A.J. Interrupted aging and secondary precipitation in aluminium alloys. Mater. Sci. Technol. 2003, 19, 1483–1490. [Google Scholar] [CrossRef]
  39. Fribourg, G.; Brechet, Y.; Deschamps, A.; Simar, A. Microstructure-based modelling of isotropic and kinematic strain hardening in a precipitation-hardened aluminium alloy. Acta Mater. 2011, 59, 3621–3635. [Google Scholar] [CrossRef]
  40. Anjabin, N.; Taheri, A.K.; Kim, H.S. Constitutive modeling of hot deformation behavior of the aa6063 alloy with different precipitates. Metall. Mater. Trans. A 2013, 44, 5853–5860. [Google Scholar] [CrossRef] [Green Version]
  41. De Vaucorbeil, A.; Poole, W.J.; Sinclair, C.W. The superposition of strengthening contributions in engineering alloys. Mater. Sci. Eng. A 2013, 582, 147–154. [Google Scholar] [CrossRef]
  42. Bardel, D.; Perez, M.; Nelias, D.; Dancette, S.; Chaudeta, P.; Massardier, V. Cyclic behaviour of a 6061 aluminium alloy: Coupling precipitation and elastoplastic modelling. Acta Mater. 2015, 83, 256–268. [Google Scholar] [CrossRef]
  43. Anjabin, N. Modeling the Anisotropic Flow Behavior of Precipitate-Hardened Al–Cu Alloys During Plane Strain Compression. Met. Mater. Int. 2019, 25, 159–167. [Google Scholar] [CrossRef]
  44. Li, Y.; Shi, Z.; Lin, J. Experimental investigation and modelling of yield strength and work hardening behaviour of artificially aged Al-Cu-Li alloy. Mater. Des. 2019, 183, 108121. [Google Scholar] [CrossRef]
  45. Bellon, B.; Haoualaa, S.; Lorca, J. An analysis of the influence of the precipitate type on the mechanical behavior of Al–Cu alloys by means of micropillar compression tests. Acta Mater. 2020, 194, 207–223. [Google Scholar] [CrossRef]
  46. Li, Y.L.; Kohar, C.P.; Mishra, R.K.; Inal, K. A new crystal plasticity constitutive model for simulating precipitation-hardenable aluminum alloys. Int. J. Plast. 2020, 132, 102759. [Google Scholar] [CrossRef]
  47. Chen, X.; Zhan, L.; Ma, Z.; Xu, Y.; Zheng, Q.; Cai, Y. Study on tensile/compressive asymmetry in creep ageing behavior of Al-Cu alloy under different stress levels. J. Alloys Compd. 2020, 843, 156157. [Google Scholar] [CrossRef]
  48. Ji, K.; Li, G.; Sun, Y.; Xu, J.; Chen, H.; Chen, K.; Zhu, Y.; Li, Y. A Constitutive Model for Yield Strength and Work Hardening Behaviour of Aluminium Alloys during Artificial Ageing. Metals 2020, 10, 1094. [Google Scholar] [CrossRef]
  49. Zhou, P.; Song, Y.; Hua, L.; Lin, J.; Lu, J. Using novel strain aging kinetics models to determine the effect of solution temperature on critical strain of Al-Zn-Mg-Cu alloy. J. Alloys Compd. 2020, 838, 155647. [Google Scholar] [CrossRef]
  50. Bahl, S.; Xiong, L.; Allard, L.F.; Michi, R.A.; Poplawsky, J.D.; Chuang, A.C.; Singh, D.; Watkins, T.R.; Shin, D.; Haynes, J.A.; et al. Aging behavior and strengthening mechanisms of coarsening resistant metastable θ′ precipitates in an Al–Cu alloy. Mater. Des. 2021, 198, 109378. [Google Scholar] [CrossRef]
  51. Zhang, Z.; Eakins, D.E.; Dunne, F.P.E. On the formation of adiabatic shear bands in textured HCP polycrystals. Int. J. Plast. 2016, 79, 196–216. [Google Scholar] [CrossRef] [Green Version]
  52. Lia, J.; Lia, Y.; Suo, T.; Wei, Q. Numerical simulations of adiabatic shear localization in textured FCC metal based on crystal plasticity finite element method. Mater. Sci. Eng. A 2018, 737, 348–363. [Google Scholar] [CrossRef]
  53. Zhou, Y.; Fan, Q.; Liu, X.; Wang, D.; Zhu, X.; Chen, K. Multi-scale crystal plasticity finite element simulations of the microstructural evolution and formation mechanism of adiabatic shear bands in dual-phase Ti20C alloy under complex dynamic loading. J. Mater. Sci. Technol. 2020, 59, 138–148. [Google Scholar] [CrossRef]
  54. Devincre, B.; Kubin, L.; Hoc, T. Physical analyses of crystal plasticity by DD simulations. Scr. Mater. 2006, 54, 741–746. [Google Scholar] [CrossRef]
  55. Santos-Güemes, R.; Bellón, B.; Esteban-Manzanares, G.; Segurado, J.; Capolungo, L.; LLorca, J. Multiscale modelling of precipitation hardening in Al–Cu alloys: Dislocation dynamics simulations and experimental validation. Acta Mater. 2020, 188, 475–485. [Google Scholar] [CrossRef] [Green Version]
  56. Santos-Güemes, R.; Esteban-Manzanares, G.; Papadimitriou, I.; Segurado, J.; Capolungo, L.; LLorca, J. Discrete dislocation dynamics simulations of dislocation-θ′ precipitate interaction in Al-Cu alloys. J. Mech. Phys. Solids 2018, 118, 228–244. [Google Scholar] [CrossRef] [Green Version]
  57. Krasnikov, V.S.; Mayer, A.E.; Pogorelko, V.V. Prediction of the shear strength of aluminum with θ phase inclusions based on precipitate statistics, dislocation and molecular dynamics. Int. J. Plast. 2020, 128, 102672. [Google Scholar] [CrossRef]
  58. Krasnikov, V.S.; Mayer, A.E.; Pogorelko, V.V.; Latypov, F.T.; Ebel, A.A. Interaction of dislocation with GP zones or θ″ phase precipitates in aluminum: Atomistic simulations and dislocation dynamics. Int. J. Plast. 2020, 125, 169–190. [Google Scholar] [CrossRef]
  59. Singh, C.V.; Warner, D.H. Mechanisms of Guinier–Preston zone hardening in the athermal limit. Acta Mater. 2010, 58, 5797–5805. [Google Scholar] [CrossRef]
  60. Yanilkin, A.V.; Krasnikov, V.S.; Kuksin, A.Y.; Mayer, A.E. Dynamics and kinetics of dislocations in Al and Al–Cu alloy under dynamic loading. Int. J. Plast. 2014, 55, 94–107. [Google Scholar] [CrossRef]
  61. Wu, B.; Bai, Z.; Misra, A.; Fan, Y. Atomistic mechanism and probability determination of the cutting of Guinier-Preston zones by edge dislocations in dilute Al-Cu alloys. Phys. Rev. Mater. 2020, 4, 020601. [Google Scholar] [CrossRef]
  62. Verestek, W.; Prskalo, A.P.; Hummel, M.; Binkele, P.; Schmauder, S. Molecular dynamics investigations of the strengthening of Al–Cu alloys during thermal ageing. Phys. Mesomech. 2017, 20, 291–304. [Google Scholar] [CrossRef]
  63. Esteban-Manzanares, G.; Martínez, E.; Segurado, J.; Capolungo, L.; LLorca, J. An atomistic investigation of the interaction of dislocations with Guinier-Preston zones in Al-Cu alloys. Acta Mater. 2019, 162, 189–201. [Google Scholar] [CrossRef] [Green Version]
  64. Hu, S.; Baskes, I.; Stan, M.; Chen, L.Q. Atomistic calculations of interfacial energies, nucleus shape and size of θ′ precipitates in Al–Cu alloys. Acta Mater. 2006, 54, 4699. [Google Scholar] [CrossRef]
  65. Hirel, P. Atomsk: A tool for manipulating and converting atomic data files. Comput. Phys. Commun. 2015, 197, 212–219. [Google Scholar] [CrossRef]
  66. Plimpton, S. Fast Parallel Algorithms for Short-Range Molecular Dynamics. J. Comp. Phys. 1995, 117, 1–19. [Google Scholar] [CrossRef] [Green Version]
  67. Apostol, F.; Mishin, Y. Interatomic potential for the Al-Cu system. Phys. Rev. B 2011, 83, 054116. [Google Scholar] [CrossRef] [Green Version]
  68. Kuksin, A.Y.; Yanilkin, A.V. Dislocation nucleation and motion in metals and alloys at high-rate deformation: Molecular dynamic simulation. Mech. Solids 2015, 50, 44–51. [Google Scholar] [CrossRef]
  69. Krasnikov, V.S.; Mayer, A.E. Influence of local stresses on motion of edge dislocation in aluminum. Int. J. Plast. 2018, 101, 170–187. [Google Scholar] [CrossRef]
  70. Marchand, D.; Jain, A.; Glensk, A.; Curtin, W.A. Machine learning for metallurgy I. A neural-network potential for Al-Cu. Phys. Rev. Mater. 2020, 4, 103601. [Google Scholar] [CrossRef]
  71. Kanel, G.I.; Zaretsky, E.B.; Razorenov, S.V.; Ashitkov, S.I.; Fortov, V.E. Unusual plasticity and strength of metals at ultra-short load durations. Phys. Uspekhi 2017, 60, 490–508. [Google Scholar] [CrossRef] [Green Version]
  72. Zuanetti, B.; McGrane, S.D.; Bolme, C.A.; Prakash, V. Measurement of elastic precursor decay in pre-heated aluminum films under ultra-fast laser generated shocks. J. Appl. Phys. 2018, 123, 195104. [Google Scholar] [CrossRef] [Green Version]
  73. Komarov, P.S.; Struleva, E.V.; Ashitkov, S.I. Generation of giant elastic ultrashort shock waves in chromium films by femtosecond laser pulses. J. Phys. Conf. Ser. 2019, 1147, 012023. [Google Scholar] [CrossRef]
  74. Berendsen, H.J.C.; Postma, J.P.M.; van Gunsteren, W.F.; DiNola, A.; Haak, J.R. Molecular dynamics with coupling to an external bath. J. Chem. Phys. 1984, 81, 3684–3690. [Google Scholar] [CrossRef] [Green Version]
  75. Stukowski, A. Visualization and analysis of atomistic simulation data with OVITO—The Open Visualization Tool. Model. Simul. Mater. Sci. Eng. 2010, 18, 015012. [Google Scholar] [CrossRef]
  76. Kelchner, C.L.; Plimpton, S.J.; Hamilton, J.C. Dislocation nucleation and defect structure during surface indentation. Phys. Rev. B 1998, 58, 11085. [Google Scholar] [CrossRef]
  77. Stukowski, A.; Bulatov, V.V.; Arsenlis, A. Automated identification and indexing of dislocations in crystal interfaces. Model. Simul. Mater. Sci. Eng. 2012, 20, 085007. [Google Scholar] [CrossRef]
  78. Fomin, E.V.; Krasnikov, V.S. Interaction of edge dislocation with copper atoms in an aluminum crystal. J. Phys. Conf. Ser. 2020, 1556, 012050. [Google Scholar] [CrossRef]
  79. Sun, W.; Zhu, Y.; Marceau, R.; Wang, L.; Zhang, Q.; Gao, X.; Hutchinson, C. Precipitation strengthening of aluminum alloys by room-temperature cyclic plasticity. Science 2019, 363, 972–975. [Google Scholar] [CrossRef] [PubMed]
Figure 1. Structure and form of θ′ precipitate. Panel (a) is cross section of matrix-surrounded precipitate and (b) is view of inclusion flat surface without aluminum matrix Aluminum atoms are colored in gray, copper atoms are red.
Applsci 11 04906 g001
Figure 2. Dislocation and θ′ precipitate of 5 nm diameter in MD system after energy minimization. (a)—view along [ 11 2 ¯ ] direction, (b)—view along [ 111 ] . Atoms with a centrosymmetry parameter more than 5 square angstroms are depicted. Aluminum atoms are colored in gray, copper atoms are red. Shockley partial dislocations are colored in green.
Applsci 11 04906 g002
Figure 3. Stages of dislocation–precipitate interaction: (A) dislocation free slip in front of θ′; (B) dislocation looping around θ′; (C) closing the Orowan loop; (D) dislocation slip behind θ′.
Applsci 11 04906 g003
Figure 4. Time dependences of the average stress in systems containing θ′ precipitate for various temperatures. Diameter of θ′ precipitate is 5 nm, thicknesses of systems, equal to the inter-precipitate distance, are 9.87 and 17.6 nm, shear velocity is 3 m/s.
Applsci 11 04906 g004
Figure 5. The first dislocation–precipitate interaction. Atoms with a centrosymmetry parameter more than 5 square angstroms are depicted. Aluminum atoms are colored in gray, copper atoms are red. Shockley partial dislocations are colored in green.
Applsci 11 04906 g005
Figure 6. View of θ′ precipitate after several interactions with dislocation; interaction number is indicated above each view together with the corresponding time. Diameter of θ′ phase is 5 nm; shear velocity is 5 m/s; and temperature is 300 K. Only copper atoms are shown.
Applsci 11 04906 g006
Figure 7. Time dependences of averaged shear stresses (a), volume fraction of vacancies (b) and position along the y-axis of dislocation for the system of 17.6 nm thickness at a temperature of 300 K. Atomic distributions corresponding to the times indicated on the graph are shown. Copper atoms are shown in red; aluminum atoms are in gray (only atoms with the centrosymmetry parameter exceeding 5 square angstroms are shown); green lines are Shockley partial dislocation segments; blue lines are perfect dislocation segments; lilac lines are vertex dislocation segments.
Applsci 11 04906 g007
Figure 8. Time dependence of averaged shear stress in a system containing θ′ phase of 18 nm in diameter. (a) View of inclusion after multiple interactions with dislocation (b) Thickness of system is 27 nm, displacement velocity is 3 m/s and temperature is 300 K.
Applsci 11 04906 g008
Figure 9. Volume fraction α of voids by dependence on time: (a) for a single system with two different radii of probe sphere of “Construct surface mesh” algorithm; and (b) for different systems with additional linear approximation.
Applsci 11 04906 g009
Figure 10. Time dependences of shear stresses averaged over system for precipitates with diameters d of 4.6 nm (a) and 18 nm (b) and different distances D between inclusions: 9.87 and 17.6 nm (a) and 27 nm (b). Comparison of results for multiple dislocation–precipitate interactions obtained by the model and the MD.
Applsci 11 04906 g010
Figure 11. Results of 2D dislocation dynamics calculation for aluminum with θ′ precipitates for different typical sizes ((a)—20 nm, (b)—40 nm, (c)—60 nm, (d)—80 nm) and volume fractions: stress-strain curves calculated in approximation of constant size of precipitates (“uncuttable”) and accounting for their size evolution (“cuttable”).
Applsci 11 04906 g011
Figure 12. Localization of plastic deformation in system in cases of (a) “uncuttable” and (b) “cuttable” precipitates.
Applsci 11 04906 g012
Figure 13. Dependence of maximal shear strength on volume fraction and typical diameter of θ′ precipitates in Al–Cu alloy and region of strain softening due to precipitate cutting: Results of 2D dislocation dynamics accounting for precipitate evolution. Diagram is supplemented with experimental data on yield stress in Al–Cu alloy [37], given points corresponding to the experimental data on typical diameter and volume fraction of θ′ precipitates; additionally, maximal absolute errors in experimental data are indicated.
Applsci 11 04906 g013
Publisher’s Note: MDPI stays neutral with regard to jurisdictional claims in published maps and institutional affiliations.

