Article

Stereo Digital Image Correlation in MATLAB

by
Devan Atkinson
and
Thorsten Hermann Becker
*
Department of Mechanical and Mechatronic Engineering, Stellenbosch University, Corner of Banghoek and Joubert Street, Stellenbosch 7599, Western Cape, South Africa
*
Author to whom correspondence should be addressed.
Appl. Sci. 2021, 11(11), 4904; https://doi.org/10.3390/app11114904
Submission received: 6 May 2021 / Revised: 14 May 2021 / Accepted: 17 May 2021 / Published: 26 May 2021

Abstract

:
Digital Image Correlation (DIC) has found widespread use in measuring full-field displacements and deformations experienced by a body from images captured of it. Stereo-DIC has received significantly more attention than two-dimensional (2D) DIC since it can account for out-of-plane displacements. Although many aspects of Stereo-DIC that are shared in common with 2D DIC are well documented, there is a lack of resources that cover the theory of Stereo-DIC. Furthermore, publications which do detail aspects of the theory do not detail its implementation in practice. This literature gap makes it difficult for newcomers to the field of DIC to gain a deep understanding of the Stereo-DIC process, although this knowledge is necessary to contribute to the development of the field by either furthering its capabilities or adapting it for novel applications. This gap in literature acts as a barrier thereby limiting the development rate of Stereo-DIC. This paper attempts to address this by presenting the theory of a subset-based Stereo-DIC framework that is predominantly consistent with the current state-of-the-art. The framework is implemented in practice as a 202 line MATLAB code. Validation of the framework shows that it performs on par with well-established Stereo-DIC algorithms, indicating it is sufficiently reliable for practical use. Although the framework is designed to serve as an educational resource, its modularity and validation make it attractive as a means to further the capabilities of DIC.

1. Introduction

Digital Image Correlation (DIC) is an optical metrology technique capable of determining full-field displacements and deformations experienced by a body from images captured of the body’s surface. The accuracy of DIC results is greatly influenced by the quality of the speckle pattern [1], the internals of the DIC algorithm [2,3], the appropriateness of the chosen processing parameters [4] and the quality of the calibration process [5,6,7], among others. However, despite this, DIC, a non-interferometric technique, is more robust in withstanding vibrations and ambient light variations than interferometric techniques, such as Electronic Speckle Pattern Interferometry and Moiré interferometry, allowing it to be used outside the confines of a laboratory. Additionally, its non-contact, full-field nature; its ability to function at a range of scales (from scanning electron microscopy images [8,9] to satellite images [10]); and the rapid improvement of cameras has resulted in it becoming one of the most favored techniques in experimental solid mechanics.
Although DIC has received the most attention and thus development within experimental solid mechanics, it has found widespread use across many fields. Some applications of DIC include: (i) investigating mechanical properties of biological tissues [11,12,13,14,15]; (ii) deflection measurement and structural health monitoring of bridges [16,17,18,19,20,21,22]; (iii) investigating cracks in masonry structures [23,24,25]; (iv) landslide monitoring [26,27,28,29]; (v) determining material properties of woven fabrics (such as cotton) [30,31]; vibrational analysis of components [32,33,34]; and (vii) in situ damage detection of components and structures [35,36,37] to name a few.
Following the introduction of two-dimensional (2D) DIC in 1982 by Peters and Ranson [38] it was extended to three dimensions (Stereo-DIC) by Luo et al. [39] in 1993 and to digital volume correlation (DVC) by Bay et al. [40] in 1999. The correlation aspect of DIC has undergone significant refinement over the years. Current state-of-the-art DIC algorithms as identified by Pan [41] make use of: (i) bi-quintic b-spline interpolation which was shown by Schreier et al. [3] to produce the most accurate sub-pixel displacements; (ii) the first and second-order shape functions (SFs) proposed by Peters et al. [42] and Lu and Carry [43] respectively; (iii) the zero-mean normalized sum of squared difference (ZNSSD) correlation criterion suggested by Tong [44]; (iv) Gaussian pre-filtering of images to reduce bias in the displacements caused by high frequency noise in the images as proposed by Pan [45]; and (v) the inverse compositional Gauss–Newton (IC-GN) optimization method introduced by Baker and Matthews [46]. Although the IC-GN optimization method is theoretically equivalent to the Newton–Raphson method [46], in practice it has greater efficiency, accuracy and robustness to withstand noise [47] making it preferable.
Although DIC is a complex process, the papers proposed by Pan et al. [48], Gao et al. [49], Solav et al. [50], and Blaber et al. [51] provide an in-depth explanation of the theory of the DIC process, which coupled with the Good Practices Guide for DIC [52], enables newcomers to the field of DIC to gain the necessary knowledge to effectively apply it in established use cases. However, in order for a newcomer to contribute to the field of DIC by developing new algorithms which improve its capabilities or adapting it for new applications, he or she must gain a deep understanding of DIC. Gaining such a deep understanding is cumbersome due to the lack of resources which directly bridge the gap between the theory of DIC and its coded implementation. More specifically, although some publications release code that is consistent with the theory presented [50,51], these codes focus on robustness and ease of use which, despite making them more suitable for real world applications, results in a complex code which is ineffective as a learning resource. This lack of resources acts as a barrier to newcomers intending to further the capabilities of DIC, thereby limiting the development rate of the field.
It is for this reason that the authors published a paper bridging the gap between the theory of a 2D DIC framework (ADIC2D) and its practical implementation as a modular 117 line MATLAB code [53]. However, 2D DIC, being limited to determining in-plane displacements, is susceptible to errors in the presence of out-of-plane motion, which is generally unavoidable especially outside the confines of a laboratory [54]. As such, Stereo-DIC has become favored since it accounts for out-of-plane motion, allowing for more reliable use across a broader range of applications and fields. This is supported by the significantly larger number of publications of Stereo-DIC relative to 2D DIC.
This paper builds upon the work of the preceding paper by extending ADIC2D to Stereo-DIC with the aim of bridging the gap between the theory and implementation of Stereo-DIC. This is done by first presenting the theory of a subset-based, Stereo-DIC framework that is predominantly consistent with current state-of-the-art techniques. How this theory is implemented as a modular 202 line MATLAB code is then discussed. These theory and implementation sections focus on aspects of Stereo-DIC which differ from that of ADIC2D. Thereafter the framework is validated using image sets provided by the Stereo-DIC Challenge [55]. More specifically, ADIC3D’s results are compared to those of LaVision’s StrainMaster software and DICe [56] in order to make observations about its capabilities. Finally, the proposed framework’s modularity, limitations, and overall performance are discussed.
The framework, referred to as ADIC3D, was developed in MATLAB since its simple syntax lets the reader focus on the core mathematics of the code. Furthermore, MATLAB’s efficient built-in functions are leveraged to simplify the code and reduce its computation time. The code is designed to be modular, so that the link between the theory and code is clear and enables readers to systematically develop an understanding of the code. Additionally, this modularity allows the code to be easily altered, urging readers to further the capabilities of DIC.

2. Framework Theory

Stereo-DIC is fundamentally an extension of 2D DIC, which relies upon two or more cameras simultaneously capturing images of the specimen (where specimen refers to the body being tracked) from different perspectives in order to determine its in-plane and out-of-plane displacements. As such, there are aspects of Stereo-DIC which are identical to those of 2D DIC; namely calibration and correlation. Stereo-DIC relies upon epipolar geometry to determine in-plane and out-of-plane displacements in the real world from in-plane displacements determined within images. Section 2.5 discusses how calibration and correlation are employed by Stereo-DIC based on epipolar geometry and how triangulation methods are used to perform displacement transformations.
Although Stereo-DIC can employ more than two cameras [50], ADIC3D is limited to the conventional two-camera implementation. Variables that need to be defined on a per camera basis have the subscript j to indicate that they are associated with the j th camera (i.e., camera 1 and 2). Within this work, an image series is defined as the collection of images captured by a single camera and an image set refers to the two corresponding image series. Thus, an image pair refers to the two images, one from each image series, which were captured simultaneously.

2.1. Homogeneous Coordinates

Calibration and triangulation use homogeneous coordinates [57], to represent coordinates in projective space, such that affine and projective transformations can be implemented through matrix multiplication. Appending a scaling variable of unity to a n dimensional vector in Euclidean space converts it to an n + 1 dimensional vector in projective space. Converting back to Euclidean space, represented as function Φ , entails dividing the vector’s elements by the scaling variable before eliminating it to reduce the vector to n dimensions. Underlined variables denote homogenous coordinate vectors.

2.2. Calibration

Calibration, explained in terms of a single camera since each camera is calibrated separately, determines the parameters of the camera model, which involves the four coordinate systems (CSs) depicted in Figure 1: (i) the three-dimensional (3D) world CS having arbitrary orientation and position; (ii) the 3D camera CS with its origin at the aperture of the camera and its z-axis aligned with the optical axis; (iii) the 2D ideal sensor CS which is coincident with the plane of the charge coupled device (CCD) representing the image in the absence of distortion; and (iv) the 2D distorted sensor CS which is coincident with the ideal sensor CS but represents the actual image by accounting for radial distortion. No symbols have been assigned to the camera CS since it is not directly involved in DIC.
The camera model uses the pinhole camera model to project a 3D coordinate of a point on the specimen in the world CS to its corresponding 2D location in the ideal sensor CS before the radial distortion model determines its location in the distorted sensor CS. Although this camera model, and subsequent calibration process, is rather simple, it performs sufficiently well as shown in Section 4. However, the accuracy the displacements determined could be improved by using a more sophisticated camera calibration method which provides a more complete description of the camera optics such as the generic camera calibration method [58,59].

2.2.1. Pinhole Camera Model

The projection matrix Q j , consisting of intrinsic ( K j ) and extrinsic ( V j ) parameter matrices, relates a coordinate in the world CS, x ^ ¯ w = x ^ w y ^ w z ^ w 1 T , to a coordinate in the ideal sensor CS, x ^ ¯ s j = x ^ s j y ^ s j 1 T , as
α j x ^ ¯ s j = Q j x ^ ¯ w = K j V j x ^ ¯ w = ξ x j c s j c x j 0 ξ y j c y j 0 0 1 R j 11 R j 12 R j 13 T j 1 R j 21 R j 22 R j 23 T j 2 R j 31 R j 32 R j 33 T j 3 x ^ ¯ w .
Here α j is the arbitrary scaling variable of the homogenous coordinates. First, the rotation matrix, R j , and translation vector, T j , transform x ^ ¯ w to the camera CS. Thereafter this 3D coordinate is projected to the ideal sensor CS using K j which performs four operations: (i) projects the 3D coordinate to a 2D coordinate on the plane of the CCD; (ii) scales the coordinate from metric units to units of pixels using ratios ξ x j and ξ y j in the x- and y-directions respectively; (iii) applies a translation, c x j and c y j in the x- and y-directions respectively, placing the origin of the ideal sensor CS at the top left of the image; and (iv) converts from the orthogonal camera CS to a skew ideal sensor CS using c s j . In this work c s j = 0 since an orthogonal ideal sensor CS is assumed.
K j is only dependent on the camera system and does not change if the camera position changes. In contrast, V j depends on the relative position and orientation between the camera and the world CS.

2.2.2. Radial Distortion Model

The radial distortion model is sufficient to account for distortion in the images caused by imperfections of the lens system [60]. First the normalized, ideal image coordinates x ^ n j = x ^ n j y ^ n j T are computed as
x ^ n j = x ^ n j y ^ n j = Φ K j 1 x ^ ¯ s j .
Thereafter, the unit-less radial distortion parameters, κ j 1 and κ j 2 , are used to compute the normalized, distorted image coordinates, x n j = x n j y n j T , as [61]
x n j = 1 + κ j 1 x ^ n j T x ^ n j + κ j 2 x ^ n j T x ^ n j 2 x ^ n j .
Finally, the distorted coordinates in the distorted sensor CS, x s j = x s j y s j T , are obtained as
x s j = x s j y s j = Φ K j x n j y n j 1 .

2.2.3. Determining Calibration Parameters

Prior to performing calibration, a calibration image series must be captured of the calibration plate. The calibration plate is a planar object containing distinct, point-like features, called calibration targets (CTs), at known 3D locations which define the position and orientation of the world CS. A corresponding set of 2D coordinates in the distorted sensor CS are obtained by locating the CTs in the calibration images. These sets of 3D and 2D coordinates are used to solve for the parameters of the camera model, which describe the relationship between the two. Using at least 50 calibration images is recommended since this inverse problem is sensitive to noise in the 3D and 2D coordinates [41,62].
Calibration is performed using two steps. First, initial estimates for K j and V j are obtained using the method proposed by Zhang [61] while κ j 1 and κ j 2 are set to zero. Secondly, non-linear, least-squares optimization is used to optimize all the parameters by minimizing the total projection error, E p r o j , given as
E p r o j = l = 1 L x l c a l c x l t r u e 2 + y l c a l c y l t r u e 2 .
Here x l t r u e = x l t r u e y l t r u e T and x l c a l c = x l c a l c y l c a l c T are the locations of the l th CT in the distorted sensor CS determined from the calibration image series and predicted by the camera model respectively. There is a total of L many CTs visible within the calibration image series.

2.3. Correlation

ADIC3D uses correlation to track a subset, a cluster of pixels, between images. The specimen’s surface requires an isotropic, random pattern with high information content such that subsets are tracked reliably. Correlation operates on two images: a reference image, F , representing the specimen in its relaxed state and a deformed image, G , representing the specimen after experiencing displacement and/or deformation. Correlation determines how a subset of the reference image, called a reference subset ( f ), must displace and deform such that it matches a corresponding subset in the deformed image, called an investigated subset ( g ). This is referred to as the correspondence problem, which is mathematically defined as the objective function. For a more detailed discussion on the correspondence problem, the reader is referred to the authors’ previous paper [53].
Note that correlation operates solely within the distorted sensor CS and is unconcerned with which camera the distorted sensor CS belongs to. Thus, in Section 2.3 and Section 3.2, the subscript s j is dropped from x s j (i.e., x ) to simplify the mathematics.
To understand how the objective function is comprised of the SF, the interpolation method and correlation criterion first consider that the i th pixel position of f , x i = x i y i T , is represented by the reference subset center position, x o = x o y o T , and the distance from x o to x i , Δ x i = Δ x i Δ y i T , as
x i = Δ x i + x o .
The SF, W , determines how the pixel positions of f displace as a result of the displacement and deformation of f , which is quantified by the shape function parameters (SFPs), P . The SF does this by modifying Δ x i as
Δ x i = Δ x i Δ y i = W Δ x i , P .
The pixel positions of f after displacement and deformation, x i = x i y i T , (referred to as query points) are determined as
x i = Δ x i + x o .
Thus Δ x i represents the distance from the center of f to x i . The light intensity values of G are interpolated at x i to obtain g . Thus, g represents a portion of G at a location described by the displacement SFPs with the deformation defined by the SFPs having been removed. The correlation criterion quantifies the degree of similarity between f and g .

2.3.1. Shape Function

The main SFs are the zero ( W S F 0 ), first ( W S F 1 ), and second-order SFs ( W S F 2 ) given as [43]
W S F 0 Δ x i , P S F 0 = 1 0 u 0 1 v Δ x i Δ y i 1 , W S F 1 Δ x i , P S F 1 = 1 + u x u y u v x 1 + v y v Δ x i Δ y i 1 and   W S F 2 Δ x i , P S F 2 = 1 2 u x x u x y 1 2 u y y 1 + u x u y u 1 2 v x x v x y 1 2 v y y v x 1 + v y v Δ x i 2 Δ x i Δ y i Δ y i 2 Δ x i Δ y i 1 .
Their sets of SFPs are given as
P S F 0 = u v T , P S F 1 = u u x u y v v x v y T and   P S F 2 = u u x u y u x x u x y u y y v v x v y v x x v x y v y y T .
Here u and v represent the displacement of f in the x- and y-directions respectively. Furthermore, u x , u x x , v y , and v y y define stretching of f , whereas u y , v x , u y y , v x x , u x y , and v x y define shearing. Although higher-order SFs more reliably determine displacements in complex displacement fields by accounting for more complex deformation, the DIC process is only concerned with the displacements determined by correlation.

2.3.2. Interpolation

ADIC3D employs the bi-cubic b-spline interpolation method detailed in the work of Hou et al. [63]. Letting F and G represent interpolation functions, the light intensity values of pixel i of the reference, f i , and investigated subsets, g i , are interpolated as
f i = F x o + Δ x i   and   g i = G x o + W Δ x i , P .
Images are filtered using a Gaussian low-pass filter, detailed by Pan [45], since otherwise the sensitivity of bi-cubic b-spline interpolation to high frequency noise would lead to bias in the displacements. The Gaussian filtering parameters, being the window size ( β ) and the standard deviation of the Gaussian function ( σ g ), should be chosen to reduce bias without increasing variance.

2.3.3. Correlation Criterion

The objective function employs the more computationally efficient ZNSSD correlation criterion ( C Z N S S D ), having a range of C Z N S S D | 0 C Z N S S D 4 where smaller values indicate higher similarity, given as
C Z N S S D = i = 1 I f i f ¯ f ˜ g i g ¯ g ˜ 2 ,
where
f ¯ = i I f i I ,   g ¯ = i I g i I ,
f ˜ = i = 1 I f i f ¯ 2   and   g ˜ = i = 1 I g i g ¯ 2 .
Here there are I many pixels per subset. The correlation coefficient is reported as the zero-mean normalized cross correlation criterion (ZNCC), C Z N C C , since its range, C Z N C C | 1 C Z N C C 1 where larger values indicate higher similarity, is more intuitive. These correlation criteria are related as [64]
C Z N C C = 1 C Z N S S D 2 .

2.3.4. Objective Function

The objective function, based on Equation (12), is given as
C O b j F u n = i = 1 I f i f ¯ f ˜ G x o + W Δ x i , P g ¯ g ˜ 2 .
Therefore, correlation seeks the SFPs that define g to contain a light intensity pattern similar to f thereby optimizing C Z N S S D . However, the IC-GN optimization method requires modifying the objective function in order to derive an iterative optimization equation from it. More specifically, the current estimate of the SFPs, P , is applied to the investigated subset while the iterative improvement of the SFPs, Δ P , is applied to the reference subset as
C O b j F u n = i = 1 I F x o + W Δ x i , Δ P f ¯ f ˜ G x o + W Δ x i , P g ¯ g ˜ 2 .

2.3.5. Optimization Equation

The optimization equation derived from Equation (17), derivation detailed in [53], is given as
Δ P = H 1 i = 1 I f i W i P T f i f ¯ f ˜ g ˜ G x o + W Δ x i , P g ¯ .
Here H is the Hessian, defined in Equation (19), and the remaining terms (within the summation) form the Jacobian, J . H , being independent of P , is precomputed prior to beginning iterations.
H = i = 1 I f i W i P T f i W i P .
f i = f i x f i y is the light intensity gradient of f at pixel i . W i P is the Jacobian of the SF for pixel i and based on the SF order is given as
W i S F 0 P S F 0 = 1 0 0 1 , W i S F 1 P S F 1 = 1 Δ x i Δ y i 0 0 0 0 0 0 1 Δ x i Δ y i and   W i S F 2 P S F 2 = 1 Δ x i Δ y i Δ x i 2 2 Δ x i Δ y i Δ y i 2 2 0 0 0 0 0 0 0 0 0 0 0 0 1 Δ x i Δ y i Δ x i 2 2 Δ x i Δ y i Δ y i 2 2 .
Although, each iteration of Equation (18) attempts to determine how f should displace and deform (according to Δ P ) such that it matches g , f is not displaced or deformed in practice. Instead Δ P is used to determine the updated SFPs, P u p d a t e , which serves as the current estimate in the next iteration. The stopping criterion deems when further iterations are redundant.

2.3.6. Updating the SFPs

P u p d a t e is obtained by composing the inverse of Δ P with P as
P u p d a t e = ω P   ω Δ P 1 .
Here ω , being dependent on the SF order, uses the SFPs to populate a square matrix as [43]
ω S F 0 P S F 0 = 1 0 u 0 1 v 0 0 1 , ω S F 1 P S F 1 = 1 + u x u y u v x 1 + v y v 0 0 1 and   ω S F 2 P S F 2 = 1 + A 1 A 2 A 3 A 4 A 5 A 6 A 7 1 + A 8 A 9 A 10 A 11 A 12 A 13 A 14 1 + A 15 A 16 A 17 A 18 1 2 u x x u x y 1 2 u y y 1 + u x u y u 1 2 v x x v x y 1 2 v y y v x 1 + v y v 0 0 0 0 0 1 ,
where
A 1 = 2 u x + u x 2 + u u x x ,
A 2 = 2 u u x y + 2 1 + u x u y ,
A 3 = u y 2 + u u y y ,
A 4 = 2 u 1 + u x ,
A 5 = 2 u u y ,
A 6 = u 2 ,
A 7 = 1 2 v u x x + 2 1 + u x v x + u v x x ,
A 8 = u y v x + u x v y + v u x y + u v x y + v y + u x ,
A 9 = 1 2 v u y y + 2 1 + v y u y + u v y y ,
A 10 = v + v u x + u v x ,
A 11 = u + v u y + u v y ,
A 12 = u v ,
A 13 = v x 2 + v v x x ,
A 14 = 2 v v x y + 2 v x 1 + v y ,
A 15 = 2 v y + v y 2 + v v y y ,
A 16 = 2 v v x ,
A 17 = 2 v 1 + v y
and   A 18 = v 2 .

2.3.7. Stopping Criterion

The stopping criterion, Δ P , determines the magnitude of the change in the SFPs between iterations, based on Δ P , as [49]
Δ P S F 0 = Δ u 2 + Δ v 2 0.5 , Δ P S F 1 = Δ u 2 + Δ u x ζ 2 + Δ u y ζ 2 + Δ v 2 + Δ v x ζ 2 + Δ v y ζ 2 0.5 and   Δ P S F 2 = Δ u 2 + Δ u x ζ 2 + Δ u y ζ 2 + 1 2 Δ u x x ζ 2 2 + Δ u x y ζ 2 2 + 1 2 Δ u y y ζ 2 2 + Δ v 2 + Δ v x ζ 2 + Δ v y ζ 2 + 1 2 Δ v x x ζ 2 2 + Δ v x y ζ 2 2 + 1 2 Δ v y y ζ 2 2 0.5 .
Here ζ is the largest value of Δ x i or Δ y i for the subset. Iterations cease once Δ P falls below a predefined value called the stopping criterion value.

2.4. Epipolar Geometry

Epipolar geometry is the projective geometry between the ideal sensor CSs, i.e., between camera 1 and 2. Consider the following definitions aided by Figure 2: (i) the baseline is formed between the two origins of the camera CSs; (ii); the epipolar plane is formed between the 3D coordinate and the baseline; (iii) the epipolar lines, λ _ j , are the intersection of the epipolar plane and the x-y plane of the ideal sensor CSs; and (iv) the epipoles, given as e _ s j = e s j 1 e s j 2 e s j 3 T in homogeneous coordinates, are located at the intersection of the baseline and the x–y plane of the ideal sensor CSs.
For 2D coordinates in the ideal sensor CSs of the first, x _ ^ s 1 , and second cameras, x _ ^ s 2 , to correspond to the same x ^ w requires that these coordinates satisfy the epipolar constraint defined as
x ^ ¯ s 2 T B x _ ^ s 1 = 0 .
More specifically, since the fundamental matrix, B , maps a point in one ideal sensor CS to its corresponding epipolar line in the other ideal sensor CS, the 2D coordinates must lie on the epipolar lines of their respective ideal sensor CSs. B encapsulates the intrinsic and extrinsic relation between the ideal sensor CSs.
Computing B requires applying a homography, Ω , to the projection matrices of the cameras to transform them to canonical form ( Q c j ), where the world CS coincides with the camera CS of the first camera, as [65]
Q c 1 = Q 1 Ω = I | 0   and   Q c 2 = Q 2 Ω = M | m
where
Ω = Q 1 11 Q 1 12 Q 1 13 Q 1 14 Q 1 21 Q 1 22 Q 1 23 Q 1 24 Q 1 31 Q 1 32 Q 1 33 Q 1 34 0 0 0 1 1 .
Here I is a 3 × 3 identity matrix. Q c 2 , which consists of a 3 × 3 matrix M and a 3 × 1 vector m , transforms a coordinate from the camera CS of the first camera to its location in the ideal sensor CS of the second camera. B is given as
B = m × M ,
where m × is the skew-symmetric matrix of m = m 1 m 2 m 3 T defined as
m × = 0 m 3 m 2 m 3 0 m 1 m 2 m 1 0 .

2.5. Stereo-DIC Overview

The core operations of Stereo-DIC are subset matching, calibration, and displacement transformation. For a point on the specimen, subset matching determines the two sets of in-plane, pixel displacements it experiences in each distorted sensor CS which, along with the calibration parameters determined by the calibration process, are used by displacement transformation to determine the in-plane and out-of-plane (thus 3D) metric displacements it experiences in the world CS. Note that with regards to subset matching and displacement transformation, the term in-plane refers to the x–y plane of the distorted sensor CSs and world CS respectively.
Subset matching is composed of stereo and temporal matching which utilize correlation differently. First, subset matching breaks up the first image of the first image series (FIS1) into subsets. Second, stereo matching determines the location of the corresponding subsets in the first image of the second image series (FIS2). Such subsets, one from each image of an image pair which correspond to the same point on the specimen, are termed a subset pair. Lastly, temporal matching, processing each image series separately, determines the displacements experienced by these subsets through their respective image series. This is achieved by sequentially stepping through an image series, starting at the second image, and at each step performing correlation by treating the current image as the deformed image while the reference image is dictated by the reference image strategy as discussed in Section 2.6.1. Thus, stereo matching is unique to Stereo-DIC while temporal matching is identical to that of 2D DIC.
The calibration method is identical to that of 2D DIC. However, in order to determine the epipolar geometry from the calibration parameters requires that the two calibration image series, used to calibrate the cameras separately, form part of the same calibration image set.
Displacement transformation, illustrated in Figure 3, steps through image pairs of the image set similarly to temporal matching. More specifically, considering a single reference subset pair with known locations, x s j o , it uses the in-plane displacements determined by temporal matching ( u j and v j in the x- and y-directions) between the reference images (of the reference image pair) and the deformed images (of the deformed image pair) to determine the locations of the investigated subset pair, x s j d .
In contrast to 2D DIC, distortion correction alone is insufficient to determine the ideal coordinate of a subset in the ideal sensor CS. More specifically, discretization of light to form an image introduces noise in the images [66] and displacements measured by correlation, which are used to determine the locations of subsets, inherently contain some noise. Thus, correcting x s j o and x s j d for radial distortion results in the measured coordinates of the reference, x ˇ s j o , and investigated subset pair, x ˇ s j d , in the ideal sensor CS respectively. Generally, these measured coordinates of a subset pair, represented as x ˇ s j , do not satisfy the epipolar constraint of Equation (24) since their back-projection rays do not intersect. Thus, triangulation, which determines the 3D coordinate in the world CS, x ^ w , from x ˇ s j , is performed in two steps. First the polynomial triangulation method, detailed in Section 2.7, determines the ideal coordinates of a subset pair, x ^ s j , which lie as close to x ˇ s j as possible while satisfying the epipolar constraint. Thereafter the linear triangulation method, detailed in Section 2.8, determines x ^ w to which x ^ s j correspond as the intersection of their back-projected rays. Performing triangulation on x ˇ s j o and x ˇ s j d results in x ^ w o and x ^ w d respectively.
Finally, x ^ w o is subtracted from x ^ w d to determine the displacement experienced by the point on the specimen, in the x-, y-, and z-directions represented as u ^ w , v ^ w , and w ^ w respectively, between the time stamps at which the reference and deformed image pairs were captured. Note that subscript w indicates coordinates or displacements in the world CS, whereas variable w indicates displacement in the z-direction. This is done for all subset pairs across all image pair combinations, analyzed by temporal matching, to determine the full-field metric displacements experienced by the specimen throughout the image set.

2.6. Subset Matching

The optical flow determined by temporal and stereo matching is a result of the displacement and/or deformation experienced by the specimen (over time) and the perspective change between the cameras respectively. They differ predominantly in the method used to obtain SFP initial estimates.

2.6.1. Temporal Matching

There are two reference image strategies for temporal matching: absolute and incremental. The absolute and incremental strategies define the reference image as either the first image of the image series or the previous image, relative to the current deformed image, respectively. The incremental strategy more reliably tracks more severe deformations between images but incurs accumulative errors when determining the displacement relative to the first image.
Temporal matching uses the Phase Correlation Method (PCM) to determine initial estimates for the displacements between two subsets. PCM efficiently computes the correlation coefficients in the frequency domain for a range of integer displacements of up to half the subset size in each direction between the two subsets. The integer displacements with the best correlation coefficient are identified and used as initial estimates for the displacement SFPs while the deformation SFPs are set to zero. Consult the work of Foroosh et al. [67] for a discussion on PCM. For the absolute strategy, PCM is only used for the first correlation run. Thereafter the SFPs of the previous correlation run, of the same image series, are used as an initial estimate for the SFPs of the current correlation run. The incremental strategy uses PCM for each correlation run.

2.6.2. Stereo Matching

Determining reliable out-of-plane displacements in the world CS requires an angle between the optical axes of the cameras of between 15° and 35° [5,68]. As such, stereo matching uses the second-order SF since subsets experience complex deformation between the FIS1 and FIS2 due to this perspective change [41].
Traditionally, template matching, which utilizes image rectification, was used to determine SFP initial estimates for stereo matching [69]. However, image rectification is susceptible to errors in the calibration parameters, can cause aliasing in the rectified images and interpolation during image rectification can lead to errors in the determined SFPs [70].
As such, feature matching methods are becoming favored [41]. ADIC3D’s feature matching method is based on that proposed by Zhou et al. [71]. It uses the scale-invariant feature transform (SIFT) feature matching algorithm [72] to identify corresponding keypoints between the images (where a keypoint is a unique feature in an image) and the affine transformation mapping model to mathematically relate the coordinates of these keypoint pairs between the images.
The SIFT algorithm is used because it is robust in translation, rotation, image scaling, variation in illumination, affine transformation and moderate perspective change. SIFT identifies keypoints that are scale invariant and computes a descriptor, in the form of a 128-dimensional vector, for each keypoint based on the light intensity gradient information in the vicinity of the keypoint.
For each keypoint of the FIS1, the Euclidean distance between its descriptor and that of every keypoint of the FIS2 is determined. The two keypoints of the FIS2 with the smallest descriptor distances are identified. If the ratio of the smallest to second smallest descriptor distance is less than 0.8, the keypoint of the FIS2 with the smallest descriptor distance is designated as the matching keypoint of the keypoint of the FIS1 [72]. Otherwise, this keypoint of the FIS1 is discarded.
The affine transformation relates a keypoint pair as
x s 2 k y s 2 k = 1 + a 1 a 2 a 3 a 4 1 + a 5 a 6 x s 1 k y s 1 k 1 .
Here x s 1 k = x s 1 k y s 1 k T and x s 2 k = x s 2 k y s 2 k T are the locations of the k th keypoint in the FIS1 and FIS2 respectively while a 1 through a 6 are the affine transformation parameters. Given three or more keypoint pairs, the affine transformation parameters can be solved either as a system of linear equations or through linear least-squares respectively.
The K many x s 1 k that are nearest to the subset’s center position are used to determine the affine transformation parameters of the subset. However, since SIFT often returns false keypoint pairs, the m-estimator sample consensus (MSAC) method [73] is used to remove these false keypoint pairs when determining the affine transformation parameters. False keypoint pairs are identified as those which have a squared error distance greater than a predefined threshold, τ . The squared error distance of the k th keypoint pair, E k d i s t , is calculated as
E k d i s t = x s 2 k 1 + a 1 x s 1 k a 2 y s 1 k a 3 2 + y s 2 k a 4 x s 1 k 1 + a 5 y s 1 k a 6 2 .
ADIC3D uses K = 20 , τ = 1 pixel2 and a confidence, specifying the probability that MSAC finds the maximum number of inliers, of 99.5%. Second-order SFP initial estimates are determined from the affine transformation parameters and the subset position in the FIS1, x s 1 = x s 1 y s 1 T , as
u = a 1 x s 1 + a 2 y s 1 + a 3 , v = a 4 x s 1 + a 5 y s 1 + a 6 , u x = a 1 , v x = a 4 , u y = a 2 , v y = a 5 , u x x = 0 , v x x = 0 , u x y = 0 , v x y = 0 , u y y = 0 and   v y y = 0 .
Once correlation has optimized these SFPs, the corresponding subset position in the FIS2, x s 2 = x s 2 y s 2 T , is determined as
x s 2 y s 2 = x s 1 y s 1 + u v .

2.7. Polynomial Triangulation Method

The polynomial triangulation method, proposed by Hartley and Sturm [66], determines x ^ s j by minimizing the geometric error cost function, D , given as
D = δ x ˇ s 1 , x ^ s 1 2 + δ x ˇ s 2 , x ^ s 2 2   subject   to   x ^ ¯ s 2 T B x _ ^ s 1 = 0 .
Here function δ determines the Euclidean distance between two points. Determining x ^ s j by minimizing the distance between the coordinates x ^ s j and x ˇ s j within the ideal sensor CSs ensures that the polynomial triangulation method is projective-invariant. Projective-invariance implies that the projective frame within which x ^ w is defined does not affect the values of x ^ s j [65]. The polynomial method assumes that the calibration parameters are known with greater accuracy than the measured coordinates [66]. Furthermore, it is assumed that neither x ^ s j nor x ˇ s j coincides with an epipole since this would lead to an unfavorable solution for the 3D coordinate.
It is known that a pair of ideal coordinates which satisfy the epipolar constraint lie on a pair of corresponding epipolar lines. Additionally, the epipolar plane can only rotate about the baseline since the camera CSs, and thus epipoles, are fixed. Thus, there is a family of epipolar lines upon which the idea coordinates can lie. Furthermore, the projective-invariance of the polynomial triangulation method allows applying a separate rigid transformation to each ideal sensor CS in order to parameterize the family of epipolar lines in terms of a single variable t . As such, homogeneous coordinates are utilized and Equation (32) becomes
D = δ x _ ˇ s 1 , λ _ 1 t 2 + δ x _ ˇ s 2 , λ _ 2 t 2 ,
where λ _ j t is a vector representing an epipolar line in the ideal sensor CS as a function of t while δ x _ ˇ s j , λ _ j t represents the distance from x _ ˇ s j to its orthogonal projection on λ _ j t . The rigid transformations first apply a translation matrix, T j p m , to each ideal sensor CS translating x _ ˇ s j to the origin of its CS.
T 1 p m = 1 0 x ˇ s 1 0 1 y ˇ s 1 0 0 1   and   T 2 p m = 1 0 x ˇ s 2 0 1 y ˇ s 2 0 0 1 .
The original fundamental matrix, B , determined using Equation (27) needs to be updated as
B 1 = T 2 p m T B T 1 p m 1 .
The epipoles e _ s 1 and e _ s 2 of the first and second cameras are computed, using singular value decomposition, as the right and left null-space of B 1 respectively. Thereafter they are normalized such that e s 1 1 2 + e s 1 2 2 = 1 and e s 2 1 2 + e s 2 2 2 = 1 .
The second step of the rigid transformation applies rotations R 1 p m and R 2 p m to the ideal sensor CSs of the first and second cameras respectively in order to place their epipoles on the x-axes of their respective CSs as R 1 p m e _ s 1 = 1 0 e s 1 3 T and R 2 p m e _ s 2 = 1 0 e s 2 3 T .
R 1 p m = e s 1 1 e s 1 2 0 e s 1 2 e s 1 1 0 0 0 1 and   R 2 p m = e s 2 1 e s 2 2 0 e s 2 2 e s 2 1 0 0 0 1 .
The fundamental matrix is updated as
B 2 = R 2 p m B 1 R 1 p m T .
Since B 2 1 0 e s 1 3 T = 1 0 e s 2 3 B 2 = 0 0 0 T the elements of the fundamental matrix are represented as
B 2 = e s 1 3 e s 2 3 φ 4 e s 2 3 φ 3 e s 2 3 φ 4 e s 1 3 φ 2 φ 1 φ 2 e s 1 3 φ 4 φ 3 φ 4 .
An epipolar line of the first camera, λ _ 1 t , passing through point 0 t 1 T on the y-axis of the ideal sensor CS is represented as
λ _ 1 t = 0 t 1 T × 1 0 e s 1 3 T = t e s 1 3 1 t T .
The corresponding epipolar line of the second camera, λ _ 2 t , is computed as
λ _ 2 t = B 2 0 t 1 T = e s 2 3 φ 3 t + φ 4 φ 1 t + φ 2 φ 3 t + φ 4 T .
Thus, δ x _ ˇ s 1 , λ _ 1 t 2 = t 2 1 + t e s 1 3 2 and δ x _ ˇ s 2 , λ _ 2 t 2 = φ 3 t + φ 4 2 φ 1 t + φ 2 2 + e s 2 3 2 φ 3 t + φ 4 2 and so Equation (34) has the form
D t = t 2 1 + t e s 1 3 2 φ 3 t + φ 4 2 φ 1 t + φ 2 2 + e s 2 3 2 φ 3 t + φ 4 2 .
Finding the optimal value of t involves taking the derivative Equation (42) in terms of t , collecting terms over a common denominator and equating the resulting numerator to 0 as
t φ 1 t + φ 2 2 + e s 2 3 2 φ 3 t + φ 4 2 2 φ 1 φ 4 φ 2 φ 3 1 + t e s 1 3 2 2 φ 1 t + φ 2 φ 3 t + φ 4 = 0 .
The 6 roots of Equation (43) are solved for and Equation (42) is evaluated at the real parts of these roots to determine the value of t which corresponds to a minimum. The asymptotic value of Equation (42) should also be evaluated as t which corresponds to an epipolar line in the first image of e s 1 3 x ˇ s 1 = 1 [65].
The optimal t is used to determine x ^ s 1 and x ^ s 2 as
x ^ s 1 = Φ T 1 p m 1 R 1 p m T t 2 e s 1 3 t t e s 1 3 2 + 1
and   x ^ s 2 = Φ T 2 p m 1 R 2 p m T e s 2 3 φ 3 t + φ 4 2 φ 1 t + φ 2 φ 3 t + φ 4 φ 1 t + φ 2 2 + e s 2 3 2 φ 3 t + φ 4 2 .
Note that the inverse of the rigid transformations are applied during Equations (44) and (45) such that x ^ s 1 and x ^ s 2 are in the original ideal sensor CSs.

2.8. Linear Triangulation Method

Denoting the n th row of Q c j as q c j n the projection of x ^ w to x ^ s 1 is described by the following three equations
α 1 x ^ s 1 = q c 1 1 T x ^ w , α 1 y ^ s 1 = q c 1 2 T x ^ w and   α 1 = q c 1 3 T x ^ w .
Similarly, for x ^ s 2 this is given as
α 2 x ^ s 2 = q c 2 1 T x ^ w ,   α 2 y ^ s 2 = q c 2 2 T x ^ w   and   α 2 = q c 2 3 T x ^ w .
Using the third relation of Equations (46) and (47) to remove the scaling variables, α 1 and α 2 , the following relation is obtained.
x ^ s 1 q c 1 3 T q c 1 1 T y ^ s 1 q c 1 3 T q c 1 2 T x ^ s 2 q c 2 3 T q c 2 1 T y ^ s 2 q c 2 3 T q c 2 2 T x ^ w = S x ^ w = 0
x ^ w is computed, using singular value decomposition, as the unit eigenvector of S T S associated with the smallest eigenvalue [65].

2.9. Displacement Transformation

Consider a single subset pair and its two sets of in-plane displacements determined by temporal matching between the reference and deformed image pairs under consideration. First x s j d = x s j d y s j d T is calculated based on x s j o = x s j o y s j o T as
x s j d y s j d = x s j o y s j o + u j v j .
Thereafter x s j o and x s j d are undistorted to obtain x ˇ s j o = x ˇ s j o y ˇ s j o T and x ˇ s j d = x ˇ s j d y ˇ s j d T respectively. This is performed using non-linear, least-squares optimization since an exact solution for the inverse of Equation (3) does not exist because it requires determining the roots of a polynomial of degree greater than four [74]. Triangulation, represented by function Ψ , determines the 3D coordinates in the world CS to which the reference subset pair, x ^ w o = x ^ w o y ^ w o z ^ w o T , and investigated subset pair, x ^ w d = x ^ w d y ^ w d z ^ w d T , correspond as
x ^ w o = Ψ x ˇ s 1 o , x ˇ s 2 o   and   x ^ w d = Ψ x ˇ s 1 d , x ˇ s 2 d .
Finally, the displacements u ^ w , v ^ w , and w ^ w are determined as
u ^ w v ^ w w ^ w = x ^ w d y ^ w d z ^ w d x ^ w o y ^ w o z ^ w o .

3. Implementation

ADIC3D’s framework, presented in Appendix A, is invoked from MATLAB’s command prompt as “ProcData = ADIC3D(FileNames1, FileNames2, Mask, GaussFilt, StepSize, SubSize, SubShape, SFOrder, RefStrat, StopCritVal, WorldCTs, ImgCTs);” with the input variables defined in Table 1.
ADIC3D returns a structured array ResultData containing four main fields: structured variable Stereo holding stereo-matching data as detailed in Table 2; structured arrays ProcData1 and ProcData2, detailed in Table 3, holding the processing data for temporal matching of subsets of the first and second image series respectively; and structured array DispTrans containing displacement transformation data detailed in Table 4.
Refer to Appendix B for brief discussion of utilizing parallel processing to reduce computation time of ADIC3D.

3.1. ADIC3D Function

The main function ADIC3D, outlined in Table 5, sets up the DIC problem and calls the appropriate subroutines. The output variables are preassigned in lines 9–12 to save input data and efficiently store computed data. ADIC3D allows subsets to be analyzed in a flexible manner by assigning Xos, SubSize, SubShape, and SFOrder on a per subset and per image basis. However, despite being capable of this, ADIC3D assigns the same SubSize, SubShape, and SFOrder to each subset as is conventional for DIC. Subsets containing invalid pixels, identified by Mask, are eliminated.
The subroutine StereoMatch is called to perform stereo matching. StereoMatch has input variables n (the total number of images in each image series), ResultData, FileNames1, FileNames2, and StopCritVal. It returns the subset positions in the FIS2 stored as ProcData2(d).Xos and stereo matching correlation results P, C, Iter, and StopVal stored in Stereo.
Temporal matching is performed on each image series separately in lines 15 and 17 using the ImgCorr subroutine. ImgCorr’s inputs are n, ProcData1 or ProcData2, FileNames1 or FileNames2, RefStrat and StopCritVal. It returns P, C, Iter, and StopVal for each subset throughout the image series stored in ProcData1 or ProcData2 for the first and second image series respectively.
Finally, subroutine CSTrans determines coordinates and displacements in the world CS based on inputs n, ResultData, WorldCTs, ImgCTs, and RefStrat. CSTrans returns Xow, Uw, and CamParams stored in DispTrans. Note that within the subroutines ResultData is shortened to RD and ProcData is shortened to PD where appropriate.

3.2. Correlation Implementation

Both stereo and temporal matching make use of correlation, detailed in Section 2.3, which is implemented using the three subroutines: SubShapeExtract, SFExpressions, and SubCorr. These subroutines are discussed briefly since they are identical to those used in ADIC2D [53].
SubShapeExtract, detailed in Table 6, determines f i , f i and Δ x i of a subset based on inputs SubSize, SubShape, Xos, F , F , and SubExtract. Note that variables with subscript i refer to the full set of this variable for the subset (i.e., f i refers to f i i I ) throughout Section 3.2. F is the light intensity gradient of the reference image whereas SubExtract is an anonymous function which extracts a square subset from a matrix based on the size and position of the subset. For SubShape defined as ‘Circle’, SubSize specifies the diameter.
SFExpressions returns anonymous functions for expressions that are dependent on the SF order, as outlined in Table 7. These anonymous functions are as follows: W defines Equation (9); dFdWdP defines f i W i P ; SFPVec2Mat defines Equation (22); Mat2SFPVec extracts the SFPs from SFPVec2Mat; and StopCrit defines Equation (23). ADIC3D allows for the zero, first, or second-order SFs to be used by setting SFOrder to 0, 1, or 2 respectively.
SubCorr performs the core operations of correlation for a subset as outlined in Table 8. Its inputs are the interpolation coefficients of the deformed image, f i , f i , SubSize, SFOrder, Xos, Δ x i , initial estimates for P and StopCritVal. SubCorr returns P, C, Iter, and StopVal. The size of vector P is consistent with that of the second-order SF. Thus, the elements of P S F 2 , not relevant to the specified SF order, remain zero.
SubShapeExtract is called prior to calling SubCorr in order to determine data used by SubCorr while SFExpressions is called within SubCorr to define the appropriate anonymous functions on a subset basis. Thus, the effect of the subset shape and SF order as well as the core mathematical operations of correlation can be considered separately.

3.3. Stereo Matching Implementation

Excluding the subroutines used to perform correlation, stereo matching is implemented using two additional subroutines: FeatureMatch and StereoMatch. FeatureMatch returns SFP initial estimates, determined according to the feature matching method outlined in Section 2.6.2, based on inputs ProcData1, d (the image to be analyzed), F, G, and SubExtract. StereoMatch refines these SFPs through correlation and uses them to determine the subset positions in the FIS2.

3.3.1. StereoMatch Function

StereoMatch, detailed in Table 9, loads the FIS1 and FIS2 as F and G, respectively, and performs Gaussian filtering on these using MATLAB’s imgaussfilt function. Lines 4 and 6 can be changed to use alternative filtering methods. Bi-cubic b-spline interpolation coefficients are determined for the deformed image using MATLAB’s griddedInterpolant function. In line 7 ‘spline’ can be replaced with ‘linear’ or ‘cubic’ for bi-linear or bi-cubic polynomial interpolation respectively. Moreover, line 7 can be replaced with an alternative interpolation method such as MATLAB’s spapi function. Line 9 of SubCorr may need to be updated if alternative interpolation methods are employed.
Lines 11 to 16 cycle through each subset of the FIS1, for which FeatureMatch in line 9 determined SFP initial estimates, performing correlation using subroutines SubShapeExtract and SubCorr. These displacement SFPs are used to determine the reference subset positions in the second image series.
Subset pairs which achieve a ZNCC coefficient below 0.6, or which fall outside the bounds of the FIS2, are assumed to have failed stereo matching. These subsets are determined in lines 21–22 and their subset positions in both image series are set to NaN (not a number) in lines 23–26 such that they are not analyzed during temporal matching or displacement transformation.
StereoMatch returns ResultData with the subset positions in the FIS2 assigned to ProcData2(d).Xos; the correlation results for stereo matching (P, C, Iter, StopVal) are assigned to Stereo.

3.3.2. FeatureMatch Function

FeatureMatch, outlined in Table 10, implements SIFT feature matching using codes available from the VLFeat open-source library of computer vision algorithms. More specifically, VLFeat’s vl_sift function is used to determine the keypoint locations and descriptors of F and G in lines 3–4. The keypoints of F which fall within the perimeter of at least one subset (square subsets equivalent in size to that specified for the subset under consideration are used) are identified in line 5. Only these keypoints of F are retained, in line 6, in order to reduce the computation time of VLFeat’s vl_ubcmatch function in determining matching keypoint pairs between F and G in lines 7–8.
For each subset, the 20 closest keypoints to its center position are identified in line 9. The for loop of line 13 cycles through the subsets using MSAC to determine reliable affine transformation parameters, which are used by Equation (31) to compute the corresponding second-order SFPs.
MSAC is implemented using MATLAB’s ransac function. Two anonymous functions are used in the call to ransac. RansacModel, defined in line 10, determines the affine transformation parameters from the keypoint locations by solving Equation (29). RansacError, defined in line 11, evaluates Equation (30) to determine each keypoint’s squared error distance (for keypoints identified to be relevant to the subset). The fifth argument of ransac sets τ = 1 pixel2 and the final argument specifies the confidence that the maximum number of inliers are determined. The fifth and sixth arguments of ransac, as well as the number of nearest keypoints used for each subset (line 9), can be altered to suit the reader’s needs. The try statement of line 14 catches instances where ransac fails to identify three keypoint inliers. As such, the SFP initial estimates of these subsets, stored in P, remain NaN as initialized on line 12.

3.4. Temporal Matching Implementation

Excluding the subroutines used to perform correlation, temporal matching is implemented using PCM and ImgCorr. ADIC3D’s implementation of temporal matching is discussed briefly since it is almost identical to that of ADIC2D [53] with the exception that PCM and ImgCorr are modified to avoid analyzing subsets which fail stereo matching.

3.4.1. PCM Function

PCM determines an initial estimate of the displacement SFPs of a subset based on inputs F, G, SubSize, the subsets position, and SubExtract as outlined in Table 11. Subset positions are passed as separate x and y positions as required by MATLAB’s arrayfun function which is used to call PCM. The if statement of line 2 avoids analyzing subsets which contain NaN positions and returns NaN displacements in this case.

3.4.2. ImgCorr Function

ImgCorr, outlined in Table 12, makes use of a nested for loop to perform temporal matching. The outer loop cycles through the images of an image series, starting at the second image, preparing data for correlation. This includes loading the appropriate reference and deformed images; filtering the images; determining the interpolation coefficients of G ; determining the reference image gradient; shifting the reference subset positions by the displacement SFPs determined in the previous correlation run (these displacement SFPs are rounded down such that the reference subset need not be interpolated [75]); and using PCM to determine initial estimates of the SFPs for the current correlation run. In the case of the absolute reference image strategy, the reference subset positions are not shifted and PCM is only used to obtain an initial estimate of the displacement SFPs for the first correlation run. For subsequent iterations, the SFPs of the previous correlation run are used as initial estimates.
The inner for loop cycles through the subsets calling SubShapeExtract and SubCorr to perform correlation of the subsets. The if statement of line 19 ensures that only subsets which pass stereo matching are analyzed within the for loop.

3.5. Displacement Transformation Implementation

Displacement transformation is implemented using subroutines CSTrans and Triangulation.

3.5.1. CSTrans Function

CSTrans, outlined in Table 13, uses MATLAB’s estimateCameraParameters function to determine the calibration parameters according to Section 2.2 and the fundamental matrix according to Section 2.4. The canonical form of the projection matrices are used such that the world CS is aligned with the camera CS of the first camera.
Lines 6–18 cycle through image pairs of the image set performing displacement transformation according to Section 2.9. Line 9 identifies subsets which do not contain NaN values in either their position or SFPs (subsets which pass stereo matching) which are to be analyzed during displacement transformation. MATLAB’s undistortPoints function is used to remove distortion from the subset positions while the subroutine Triangulation uses polynomial and linear triangulation to determine the 3D coordinate in the world CS corresponding to a subset pair. The if statement of line 10 avoids recomputing the reference subset positions for the absolute reference image strategy.
CSTrans is susceptible to particular issues which can cause a fatal error. Refer to Appendix C for a discussion of a function which improves the robustness of CSTrans.

3.5.2. Triangulation Function

Triangulation, outlined in Table 14, cycles through the subset pairs determining their ideal coordinates in the ideal sensor CSs using the polynomial triangulation method according to Section 2.7, in lines 3–20 (based on the code of Lourakis [76]), before performing linear triangulation according to Section 2.8, in lines 21–22, to determine their 3D coordinate in the world CS.

4. Validation

The temporal matching aspect of ADIC3D has been shown to be sufficiently robust to contrast changes and noise while offering a compromise between noise suppression and spatial resolution consistent with that of established DIC algorithms [53]. Thus, Samples 1 and 2 of the Stereo-DIC Challenge [55], exhibiting rigid body translations which avoid introducing errors during temporal matching due to complex displacement fields, are used to assess the remaining aspects of ADIC3D in a quantitative manner. Sample 5, exhibiting complex displacement fields, assesses ADIC3D in a qualitative manner.
ADIC3D was used by setting StopCritVal = 10−4 (limited to 100 iterations per subset), FiltSize = 0, RefStrat = 0, SubShape = ‘Square’, SFOrder = 1, SubSize = 61, and StepSize = 5. A larger subset size was used to reduce errors during temporal matching. Increasing the subset size beyond 61 pixels produced only marginal improvements.
Additionally, DICe (Version 2.0-beta.16) [56] and LaVision’s StrainMaster (version 1.3) were used to analyze the samples. DICe is well-established [77,78] and its modularity enables it to use the same subset positions in the FIS1 as ADIC3D prior to stereo matching. DICe was run using the same parameters as ADIC3D. StrainMaster, a streamlined version of LaVision’s DaVis software, was used to analyze Samples 1 and 2. Its streamlined nature prevents modifying some correlation parameters such that it employed circular subsets, a stopping criterion of 0.01, and a maximum of 200 iterations. Although this prohibits its results from being directly comparable to ADIC3D, it is included to reflect the capabilities of a commercial code. All codes used identical masks for each sample.
For ADIC3D, subsets achieving a ZNCC criterion below 0.8 for stereo matching were eliminated while DICe and StrainMaster have their own methods of eliminating subsets which fail stereo matching. The final sets of valid subset pairs for ADIC3D and DICe were determined in two steps such that the results of the two codes are directly comparable.
First, a preliminary set of valid subset pairs was determined for each code as the subsets which achieved a ZNCC criterion above 0.8 for temporal matching. Additionally, for Samples 1 and 2 of DICe, Grubbs’s test [79] was used to remove outliers, in terms of displacement error, to reduce outliers occurring in its preliminary set. Secondly, the final set of valid subset pairs for both codes was determined as the intersection of these preliminary sets based on the subset positions in the FIS1.
Successive images of all samples exhibited a jump in displacement such that PCM failed to determine SFP initial estimates. As such, subroutine FeatureMatch was used to obtain SFP initial estimates during temporal matching by inserting “[PD(d).P]=FeatureMatch(PD,d,F,G, SubExtract);” after line 16 in subroutine ImgCorr. DICe also used feature matching to determine SFP initial estimates.
The provided calibration image sets, of dot-grid-style calibration plates, were used by each code to perform calibration. ADIC3D used the STEP1_CalcDLTparameters function of MultiDIC, an open-source Stereo-DIC software proposed by Solav et al. [50], to locate the CTs in the distorted sensor CSs. All experimental image sets were captured using the FLIR Grasshopper 2 model Gras-50S5M cameras with (Edmund Optics) lenses having a focal length of 35 mm.

4.1. Samples 1 and 2
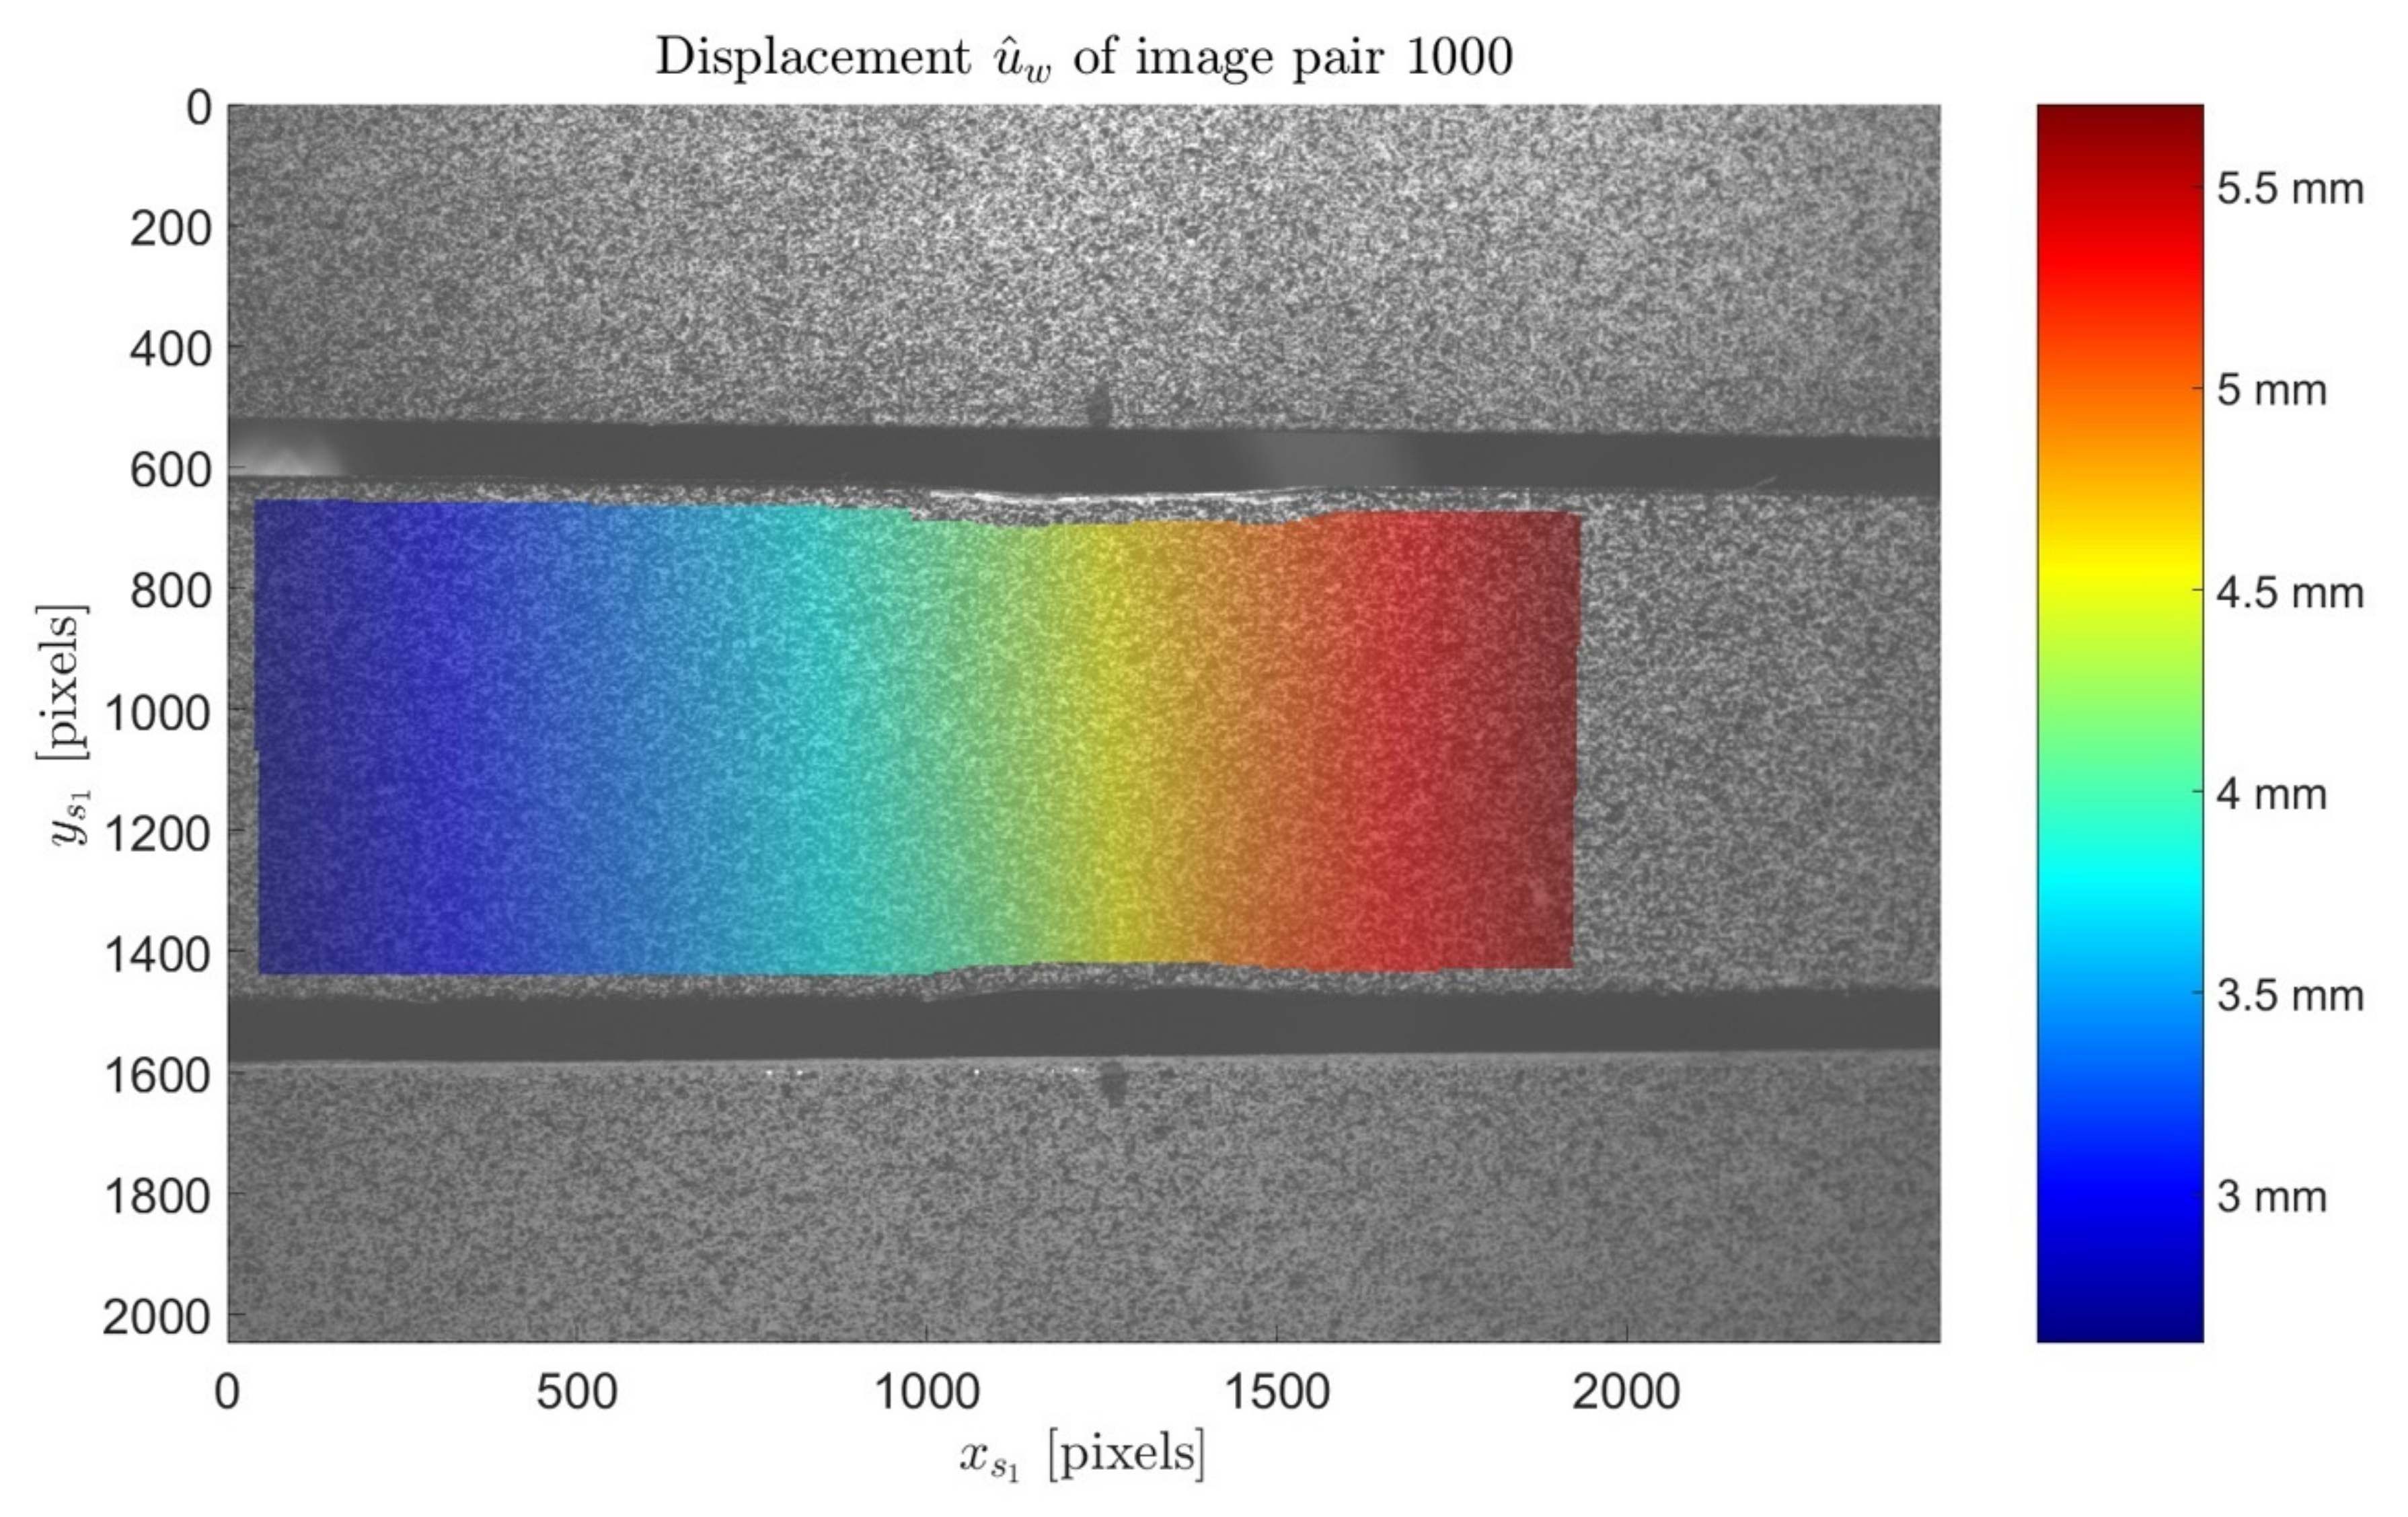
Sample 1 captures images of a complex specimen geometry, consisting of a flat base plate with protruding 3D features, as it is displaced in increments of 10 mm in the x- and z-directions according to Table A2 in Appendix D. The specimen is displaced by an Aerotech nano-positioning stage (model ANT130-160-XY) with a high-precision linear encoder and position feedback control such that the true displacements are known with high certainty. Sample 2 simulates the experiment of Sample 1 using the synthetic image generator documented by Balcaen et al. [62] to minimize error sources in the image set.
The world CS of each DIC code differs from that within which the displacements were imposed. Thus, for each code Pythagoras’s theorem is used to compute the true, μ ^ w q t r u e , and calculated, μ ^ w q c a l c , displacement magnitudes of each subset q . The resulting errors in displacement magnitude are quantified as bias, computed as the mean of the absolute error ( M A E ), and variance, computed as the standard deviation of the absolute error ( σ ).
M A E = q = 1 Q μ ^ w q c a l c μ ^ w q t r u e Q σ = q = 1 Q μ ^ w q c a l c μ ^ w q t r u e M A E 2 Q 1
Here Q is the number of valid subset pairs in the image pair analyzed. For Samples 1 and 2, ADIC3D and DICe had 71,715 and 66,850 valid subsets, respectively, while StrainMaster had 112,021 and 108,085 valid subsets respectively. Table 15 and Table 16 report errors metrics for Samples 1 and 2, respectively, for steps 3, 7, and 15 which correspond to displacement extremes.
The improved error metrics of Sample 2 relative to Sample 1 for each code, with the exception of StrainMaster’s variance for step 15, reflects the impact of the reduced error sources of the synthetic image set. For Sample 1, ADIC3D performs on par with DICe (up to 27% higher bias) and StrainMaster (at least 12% lower bias). In contrast, for Sample 2 ADIC3D shows improved error metrics relative to DICe and StrainMaster (at least 69% and 54% lower bias respectively). StrainMaster’s higher bias and variance are a result of it analyzing more subsets in the vicinity of protruding features, which are challenging to track, which are removed for ADIC3D and DICe.

4.2. Sample 5

Sample 5 captures images of an ASTM tensile specimen made of Aluminium 2024-T6 as it is loaded in tension. The displacements computed by ADIC3D and DICe are directly comparable since both align their world CS with the camera CS of the first camera.
Figure 4 shows the u ^ w displacement field of image pair 1000 superimposed on the FIS1. The mean and maximum of the percentage difference of the u ^ w , v ^ w , and w ^ w displacements, between ADIC3D and DICe, are reported in Table 17 for selected image pairs.
The cameras being positioned apart horizontally in the x-direction is reasoned to cause the larger percentage difference of v ^ w and w ^ w relative to u ^ w which is consistent with the findings of Balcaen et al. [5]. The low percentage difference (remaining below 2% mean and 4% maximum) indicates that ADIC3D performs consistently with DICe.

5. Discussion

ADIC3D’s modularity is threefold. Firstly, the main tasks are performed by separate subroutines, closely linked to the mathematical theory presented, allowing readers to progressively build up their understanding of ADIC3D. For instance, correlation is separated into three subroutines enabling the reader to consider: (i) how data is prepared based on the subset shape (SubShapeExtract); (ii) the SF order’s influence on expressions for variables used during correlation (SFExpressions); and (iii) the core operations of correlation (SubCorr) separately. Furthermore, subroutines ImgCorr and StereoMatch show how correlation is utilized differently by temporal and stereo matching.
Secondly, the subset shape, SF order, interpolation method, and Gaussian filtering parameters can be readily changed. Although the influence of these on displacement results is well documented in experimental solid mechanics applications [3,4,45], this allows investigating their influence in novel applications to fine-tune ADIC3D’s setup.
Thirdly, the SF order, subset size, and subset shape can be changed on a per subset and per image basis enabling straightforward integration with adaptive strategies. Adaptive strategies, which are gaining interest in the field of DIC, attempt to assign optimal parameters to each subset such that the resulting displacements are, theoretically, as reliable as possible and independent of the user.
In order for the code to retain its simplicity, four aspects, identified by Pan [41] as state-of-the-art requirements, were omitted. First, calibration does not use bundle adjustment, proposed by Furukawa and Ponce [80], to refine the calibration parameters. Additionally, Vo’s method [81] of combing the frontal image plane and DIC to more accurately locate the CTs is not implemented. It should be noted that although the camera model presented in Section 2.2 only accounts for radial distortion, accounting for tangential distortion in ADIC3D is straightforward, as outlined in Appendix E.
Secondly, although the incremental reference image strategy is included, ADIC3D does not automatically employ it if the ZNCC coefficient falls below a certain threshold as recommended [82]. Thirdly, ADIC3D uses bi-cubic b-spline interpolation whereas bi-quintic b-spline interpolation is recommended [3] since increasing the degree of the interpolation method reduces the errors in the “ultimate error regime” [83] especially for smaller subsets.
Lastly, ADIC3D does not employ Pan’s [84] reliability guided displacement tracking strategy (RGDT). ADIC3D’s temporal matching uses the SFPs of each subset of the previous correlation run as initial estimates in the current correlation run. In contrast, RGDT only does this for the subset achieving the best ZNCC in the previous correlation run. This subset’s optimized SFPs are used as an initial estimate to correlate its neighboring subsets. Of the correlated subsets, having uncorrelated neighbors, the one with the best ZNCC has its SFPs used as an initial estimate to correlate its neighbors. This is repeated to correlate all subsets in the current correlation run. As noted with ADIC2D [53], this exclusion makes ADIC3D susceptible to propagating spurious SFPs of a subset throughout the image series.
Furthermore, RGDT is excluded such that ADIC3D is path-independent (where each subset is correlated independently of its neighbors). Thus, this avoids the need to specify seed points and the issue path-dependent methods have, with complex specimen geometries, of transferring SFPs across subsets which experience different deformation modes. This also allows ADIC3D to leverage MATLAB’s parfor loop to utilize parallel processing to reduce computation time (as discussed in Appendix B).
Additionally, although not a state-of-the-art requirement, ADIC3D’s feature matching method can be improved. Sample 1 and 2 highlight its limitation as it determines invalid SFP initial estimates for subsets in the vicinity of protruding features that experience a large perspective change. Iniyan et al. [85] recommend using the DeepFlow [86] feature matching algorithm combined with the homography transform and MSAC.
Despite these omissions, ADIC3D’s performance is on par with established codes. More specifically, Samples 1 and 2 show that ADIC3D determines displacement magnitudes in the world CS with bias and variance consistent with that of DICe and StrainMaster, while Sample 5 shows that ADIC3D determines displacement vectors within a 4% maximum difference of those determined by DICe. Although Samples 1 and 2 reveal limitations of ADIC3D’s stereo matching, it performs sufficiently well in the presence of a complex specimen geometry.
This, coupled with ADIC2D’s validation of temporal matching and thus the correlation method of ADIC3D indicates that ADIC3D performs sufficiently well for practical use in the field of experimental solid mechanics. Moreover, due to its modularity ADIC3D can be readily adapted to a wide range of applications across many fields. Furthermore, validation of this modular framework makes it both attractive as an education resource and as a basis to further the capabilities of DIC.

6. Conclusions

The theory of a subset-based, Stereo-DIC framework, that is predominantly consistent with current state-of-the-art techniques, and its implementation as a modular 202 line MATLAB code, was presented. This framework is an extension of the previously presented ADIC2D framework and as such is also comprised of square or circular subset shape selection, assigning of Gaussian filtering parameters, altering of the interpolation method, the zero, first and second-order SFs, reference image strategy selection, the Phase Correlation Method to determine SFP initial estimates for temporal matching and calibration through using MATLAB’s image calibration toolbox. ADIC3D, being capable of performing Stereo-DIC to determine both in-plane and out-of-plane displacements in the world CS, is additionally comprised of stereo matching, SIFT feature matching to determine SFP initial estimates for stereo matching and displacement transformation using the polynomial and linear triangulation methods. Furthermore, ADIC3D allows for assignment of SF order, subset shape, and subset size on a per image and per subset basis enabling straightforward integration with adaptive strategies. The framework is modular, enabling the reader to gain a deeper understanding of DIC as well as encouraging readers to adapt ADIC3D for new applications. Validation of the full framework coupled with its modularity makes it appealing not only as an educational resource, but also as a starting point to develop the capabilities of DIC.

Author Contributions

Conceptualization, T.H.B. and D.A.; Methodology, D.A. and T.H.B.; Software, D.A.; Validation, D.A.; Investigation, D.A.; Resources, T.H.B.; Writing—original draft preparation, D.A.; Writing—review and editing, T.H.B.; Visualization, D.A.; Supervision, T.H.B.; Funding acquisition, T.H.B. Both authors have read and agreed to the published version of the manuscript.

Funding

This research was funded by the Mechanical and Mechatronic Engineering department of the University of Stellenbosch.

Institutional Review Board Statement

Not applicable.

Informed Consent Statement

Not applicable.

Data Availability Statement

Data available in a publicly accessible repository that does not issue DOIs. Publicly available datasets were analyzed in this study. This data can be found here: [https://sem.org/3ddic] (accessed on 10 May 2021).

Acknowledgments

The authors would like to thank P.L. Reu for information and advice received about using the Stereo-DIC Challenge.

Conflicts of Interest

The authors declare no conflict of interest. The funders had no role in the design of the study; in the collection, analyses, or interpretation of data; in the writing of the manuscript, or in the decision to publish the results.

Glossary of Symbols

a 1 through a 6 Affine transformation parameters
α j Homogeneous scaling variable of the j th camera
B Fundamental matrix
B 1 Fundamental matrix after translation of polynomial triangulation method
B 2 Fundamental matrix after rotation of polynomial triangulation method
β Gaussian filtering window size
c x j and c y j Translation applied to sensor coordinate system of the j th camera
c s j Skew of ideal sensor coordinate system of the j th camera
C Z N S S D Zero-mean normalized sum of squared difference correlation criterion
C Z N C C Zero-mean normalized cross correlation criterion
C O b j F u n Objective function of correspondence problem
D Geometric error cost function
δ Function to determine the Euclidean distance between two points
e _ s j = e s j 1 e s j 2 e s j 3 T Epipole of the j th camera
E p r o j Total projection error
E k d i s t Squared error distance of k th keypoint
F Reference image
f Reference subset
f i Light intensity value of pixel i of reference subset
f ¯ Mean light intensity value of reference subset
f ˜ Normalization function of reference subset
f i = f i x f i y Light intensity gradient of reference subset for pixel i
G Deformed image
g Investigated subset
g i Light intensity value of pixel i of investigated subset
g ¯ Mean light intensity value of investigated subset
g ˜ Normalization function of investigated subset
H Hessian of optimization equation
I Number of pixels within a subset
I 3 × 3 identity matrix
i Subscript indicating that a variable is associated with the i th pixel of a subset
J Jacobian of optimization equation
j Subscript indicating that a variable is associated with the j th camera
K j Intrinsic parameter matrix of the j th camera
K Number of keypoints under consideration
κ j 1 and κ j 2 Radial distortion parameters of the j th camera
L Number of calibration targets within a calibration image series
λ _ j Epipolar line of the j th camera
M 3 × 3 matrix
m 3 × 1 vector
m × Skew symmetric matrix of m
M A E Mean of the absolute error
μ ^ w q t r u e True displacement magnitude
μ ^ w q c a l c Calculated displacement magnitude
Ω Homography applied to projection matrices
ω Function to populate a square matrix with the shape function parameters
P Shape function parameters
Δ P Iterative improvement of shape function parameters
P u p d a t e Updated shape function parameters
Δ P Stopping criterion
Φ Function representing conversion of coordinate from projective space to Euclidean space
Ψ Function representing the triangulation methods
φ 1 φ 4 Elements of the fundamental matrix for the polynomial triangulation method
Q j Projection matrix of the j th camera
Q c j Projection matrix of the j th camera in canonical form
q c j n The n th row of the canonical projection matrix of the j th camera
QNumber of subset pairs per image pair
R j Rotation matrix for pinhole camera model of the j th camera
R j p m Rotation matrix of the j th camera for the polynomial triangulation method
S Matrix for the linear triangulation method
σ g Standard deviation of Gaussian function
σ Standard deviation of the absolute error
T j Translation vector for pinhole camera model of the j th camera
T j p m Translation matrix of the j th camera for polynomial triangulation method
t Variable for parameterization of epipolar lines
τ Squared error distance threshold
u Displacement in x-direction in the distorted sensor coordinate system
u x , u x x ,   u y ,   u y y and u x y Derivatives of the x-direction displacement
u ^ w Displacement in x-direction in the world coordinate system
V j Extrinsic parameter matrix of the j th camera
v Displacement in y-direction in the distorted sensor coordinate system
v x , v x x , v y , v y y and v x y Derivatives of the y-direction displacement
v ^ w Displacement in y-direction in the world coordinate system
W Shape function
W i P Jacobian of the shape function, in terms of the shape function parameters, for pixel i
w ^ w Displacement in z-direction in the world coordinate system
x ^ w = x ^ w y ^ w z ^ w T Ideal coordinate in the world coordinate system
x ^ s j = x ^ s j y ^ s j T Ideal coordinate in the ideal sensor coordinate system of the j th camera
x ^ n j = x ^ n j y ^ n j T Normalized ideal image coordinates of the j th camera
x n j = x n j y n j T Normalized distorted image coordinates of the j th camera
x s j = x s j y s j T Coordinate in the distorted sensor coordinate system of the j th camera
x l t r u e = x l t r u e y l t r u e T True location of l th calibration target in distorted sensor coordinate system
x l c a l c = x l c a l c y l c a l c T Location of l th calibration target in distorted sensor coordinate system predicted by the camera model
x i = x i y i T Pixel position of the i th pixel of the reference subset in distorted sensor coordinate system
x o = x o y o T Center of reference subset in distorted sensor coordinate system
Δ x i = Δ x i Δ y i T Distance from the reference subset center to i th pixel position of reference subset
Δ x i = Δ x i Δ y i T Distance from the reference subset center to i th pixel position of investigated subset
x i = x i y i T i th pixel position of the investigated subset in the distorted sensor coordinate system
x s j o = x s j o y s j o T Reference subset position in distorted sensor coordinate system of the j th camera
x s j d = x s j d y s j d T Investigated subset position in the distorted sensor coordinate system of the j th camera
x ˇ s j o = x ˇ s j o y ˇ s j o T Measured position of the reference subset in the ideal sensor coordinate system of the jth camera
x ˇ s j d = x ˇ s j d y ˇ s j d T Measured position of the investigated subset in the ideal sensor coordinate system of the j th camera
x ˇ s j = x ˇ s j y ˇ s j T Measured coordinate in the ideal sensor coordinate system of the j th camera
x ^ w o = x ^ w o y ^ w o z ^ w o T Position of reference subset pair in the world coordinate system
x ^ w d = x ^ w d y ^ w d z ^ w d T Position of investigated subset pair in the world coordinate system
x s j k = x s j k y s j k T k th keypoint location in the first image of the image series of the j th camera
ξ x j and ξ y j Scaling of metric units to pixels for the j th camera
ζ Maximum distance, along a single axis, from the center of the reference subset to a pixel in the reference subset

Appendix A. ADIC3D Framework Code

The code of the ADIC3D framework, presented below, can be accessed on GitHub at https://github.com/SUMatEng/ADIC3D (accessed on 1 May 2021).
1. 
function ResultData=ADIC3D(FileNames1,FileNames2,Mask, GaussFilt,StepSize,SubSize,SubShape,SFOrder,RefStrat, StopCritVal,WorldCTs, ImgCTs)
2. 
[~,ImNames1]=cellfun(@fileparts,FileNames1,’Uni’,0);
3. 
[~,ImNames2]=cellfun(@fileparts,FileNames2,’Uni’,0);
4. 
n=numel(FileNames1);
5. 
[r,c]=size(im2double(imread(FileNames1{1})));
6. 
[XosX,XosY]=meshgrid(((SubSize+1)/2+StepSize):StepSize:(c-(SubSize+1)/2-1-StepSize),((SubSize+1)/2+StepSize): StepSize:(r-(SubSize+1)/2-1-StepSize));
7. 
Xos=[XosX(:)‘; XosY(:)’]; clear XosX, XosY;
8. 
Xos=Xos(:,arrayfun(@(X,Y) min(min(Mask(Y-(SubSize-1)/2:Y+(SubSize-1)/2, X-(SubSize-1)/2:X+(SubSize-1)/2))),Xos(1,:),Xos(2,:))==1);
9. 
ResultData.ProcData1=struct(‘ImgName’, ImNames1,‘ImgSize’, repmat({[r,c]},1,n),‘ImgFilt’,repmat({GaussFilt},1,n), ‘SubSize’,repmat({SubSize*ones([1,size(Xos,2)])},1,n), ‘SubShape’,repmat({repmat(SubShape,size(Xos,2),1)},1,n), ‘SFOrder’, repmat({repmat(SFOrder,1,size(Xos,2))},1,n), ‘Xos’,repmat({Xos},1,n),‘P’,repmat({zeros([12,size(Xos,2)])}, 1,n),‘C’,repmat({NaN([1,size(Xos,2)])},1,n),‘StopVal’, repmat({ones([1,size(Xos,2)])*StopCritVal},1,n), ‘Iter’,repmat({zeros([1,size(Xos,2)])},1,n));
10. 
ResultData.ProcData2=struct(‘ImgName’, ImNames2, ‘ImgSize’, repmat({[r,c]},1,n), ‘ImgFilt’,repmat({GaussFilt},1,n), ‘SubSize’, repmat({SubSize*ones([1,size(Xos,2)])},1,n), ‘SubShape’,repmat({repmat(SubShape,size(Xos,2),1)},1,n), ‘SFOrder’,repmat({repmat(SFOrder,1,size(Xos,2))},1,n), ‘Xos’,repmat({Xos},1,n),‘P’,repmat({zeros([12,size(Xos,2)])}, 1,n),‘C’,repmat({NaN([1,size(Xos,2)])},1,n),‘StopVal’,repmat ({ones([1,size(Xos,2)])*StopCritVal},1,n),‘Iter’,repmat ({zeros([1,size(Xos,2)])},1,n));
11. 
ResultData.Stereo=struct(‘P’,zeros([12,size(Xos,2)]), ‘C’, NaN([1,size(Xos,2)]),‘StopVal’,ones([1,size(Xos,2)])* StopCritVal, ‘Iter’,zeros([1,size(Xos,2)]));
12. 
ResultData.DispTrans=struct(‘Xow’,repmat({NaN(3,size(Xos,2))},1,n),‘Uw’,repmat({NaN(3,size(Xos,2))},1,n),‘CamParams’, repmat({stereoParameters(cameraParameters,cameraParameters ,zeros(3,3), zeros(1,3))},1,n))
13. 
ResultData=StereoMatch(n,ResultData,FileNames1,FileNames2, StopCritVal); % Section 2.6.2
14. 
fprintf(‘\nFirst image set...\n’);
15. 
ResultData.ProcData1=ImgCorr(n,ResultData.ProcData1, FileNames1, RefStrat,StopCritVal); % Section 2.6.1
16. 
fprintf(‘\nSecond image set...\n’);
17. 
ResultData.ProcData2=ImgCorr(n,ResultData.ProcData2, FileNames2, RefStrat,StopCritVal); % Section 2.6.1
18. 
ResultData=CSTrans(n,ResultData,WorldCTs,ImgCTs,RefStrat); % Section 2.9
1. 
function [f,dfdx,dfdy,dX,dY]=SubShapeExtract(SubSize, SubShape,Xos,F, dFdx,dFdy,SubExtract)
2. 
switch SubShape
3. 
case ‘Square’
4. 
  f(:)=reshape(SubExtract(F,Xos,SubSize),[SubSize*SubSize ,1]);
5. 
  dfdx(:)=reshape(SubExtract(dFdx,Xos,SubSize),[SubSize* SubSize,1]);
6. 
  dfdy(:)=reshape(SubExtract(dFdy,Xos,SubSize),[SubSize* SubSize,1]);
7. 
  [dX,dY]=meshgrid(-(SubSize-1)/2:(SubSize-1)/2,-(SubSize-1)/2: (SubSize-1)/2); dX=dX(:); dY=dY(:);
8. 
case ‘Circle’
9. 
  f=SubExtract(F,Xos,SubSize);
10. 
  dfdx=SubExtract(dFdx,Xos,SubSize);
11. 
  dfdy=SubExtract(dFdy,Xos,SubSize);
12. 
  [dX,dY]=meshgrid(-(SubSize-1)/2:(SubSize-1)/2,-(SubSize-1)/2: (SubSize-1)/2);
13. 
  mask_keep=sqrt(abs(dX).^2+abs(dY).^2)<=(SubSize/2-0.5);
14. 
  f=f(mask_keep);
15. 
  dfdx=dfdx(mask_keep); dfdy=dfdy(mask_keep);
16. 
  dX=dX(mask_keep); dY=dY(mask_keep);
17. 
end
1. 
function [W,dFdWdP,SFPVec2Mat,Mat2SFPVec,StopCrit]= SFExpressions(SFOrder)
2. 
switch SFOrder
3. 
case 0 % Zero order SF
4. 
  W=@(dX,dY,P) [P(1)+dX,P(7)+dY]; % Equation (9)
5. 
  dFdWdP=@(dX,dY,dfdx,dfdy) [dfdx,dfdy];
6. 
  SFPVec2Mat=@(P) reshape([1,0,0,0,1,0,P(1),P(7),1],[3,3]); % Equation (22)
7. 
  Mat2SFPVec=@(W) [W(7),0,0,0,0,0,W(8),0,0,0,0,0];
8. 
  StopCrit=@(dP,Zeta) sqrt(sum((dP’.*[1,0,0,0,0,0,1,0,0,0,0 ,0]).^2)); % Equation (23)
9. 
case 1 % First order SF
10. 
  W=@(dX,dY,P) [P(1)+P(3).*dY+dX.*(P(2)+1), P(7)+P(8).*dX+dY .*(P(9)+1)]; % Equation (9)
11. 
  dFdWdP=@(dX,dY,dfdx,dfdy) [dfdx,dfdx.*dX,dfdx.*dY,dfdy,dfdy .*dX,dfdy.*dY];
12. 
  SFPVec2Mat=@(P) reshape([P(2)+1,P(8),0,P(3),P(9)+1,0,P(1) ,P(7),1], [3,3]); % Equation (22)
13. 
  Mat2SFPVec=@(W) [W(7),W(1)-1.0,W(4),0,0,0,W(8),W(2),W(5)- 1.0,0,0,0];
14. 
  StopCrit=@(dP,Zeta) sqrt(sum((dP’.*[1,Zeta,Zeta,0,0, 0,1,Zeta, Zeta,0,0,0]).^2)); % Equation (23)
15. 
case 2 % Second order SF
16. 
  W=@(dX,dY,P) [P(1)+P(3).*dY+P(4).*dX.^2.*(1/2)+P(6).* dY.^2.*(1/2)+dX.*(P(2)+1)+P(5).*dX.*dY,P(7)+P(8).*dX+ P(10).*dX.^2.*(1/2)+P(12).*dY.^2.*(1/2)+dY.*(P(9)+1)+ P(11).*dX.*dY]; % Equation (9)
17. 
  dFdWdP=@(dX,dY,dfdx,dfdy) [dfdx,dfdx.*dX,dfdx.*dY, (dfdx.*dX.^2)/2,dfdx.*dX.*dY,(dfdx.*dY.^2)/2,dfdy,dfdy.*dX ,dfdy.*dY,(dfdy.*dX.^2)/2,dfdy.*dX.*dY,(dfdy.*dY.^2)/2];
18. 
  SFPVec2Mat=@(P) reshape([P(2)*2+P(1)*P(4)+P(2)^2+1,P(1) *P(10)*1/2+P(4)*P(7)*(1/2)+P(8)*(P(2)*2+2)*1/2,P(7)*P(10) +P(8)^2,P(4)*1/2,P(10)*1/2,0,P(1)*P(5)*2+P(3)*(P(2)*2+2), P(2)+P(9)+P(2)*P(9)+P(3)*P(8)+P(1)*P(11)+P(5)*P(7)+1,P(7) *P(11)*2.0+P(8)*(P(9)+1)*2,P(5),P(11),0,P(1)*P(6)+P(3)^2, P(1)*P(12)*1/2+P(6)*P(7)*1/2+P(3)*(P(9)+1),P(9)*2+P(7)* P(12)+P(9)^2+1,P(6)*1/2,P(12)*1/2,0,P(1)*(P(2)+1)*2,P(7) +P(1)*P(8)+P(2)*P(7),P(7)*P(8)*2,P(2)+1,P(8),0,P(1)*P(3)*2, P(1)+P(1)*P(9)+P(3)*P(7),P(7)*(P(9)+1)*2,P(3),P(9)+1,0,P(1) ^2,P(1)*P(7),P(7)^2,P(1),P(7),1],[6,6]); % Equation (22)
19. 
  Mat2SFPVec=@(W) [W(34),W(22)-1,W(28),W(4).*2,W(10),W(16) .*2,W(35), W(23),W(29)-1,W(5).*2,W(11),W(17).*2];
20. 
  StopCrit=@(dP,Zeta) sqrt(sum((dP’.*[1,Zeta,Zeta,0.5* Zeta.^2,Zeta.^2,0.5*Zeta.^2,1,Zeta,Zeta,0.5*Zeta.^2,Zeta.^2 ,0.5*Zeta.^2]).^2)); % Equation (23)
21. 
end
1. 
function [P,C,Iter,StopVal]=SubCorr(InterpCoef,f,dfdx,dfdy,SubSize, SFOrder,Xos,dX,dY,P,StopCritVal)
2. 
[W,dFdWdP,SFPVec2Mat,Mat2SFPVec,StopCrit]=SFExpressions( SFOrder); % Section 3.2
3. 
dfdWdP=dFdWdP(dX(:),dY(:),dfdx(:),dfdy(:));
4. 
Hinv=inv(dfdWdP’*dfdWdP); % inverse of Equation (19)
5. 
f_bar=mean(f(:)); f_tilde=sqrt(sum((f(:)-f_bar).^2)); % Equations (13) and (14)
6. 
flag=0; Iter=1; dP=ones(size(P));
7. 
while flag==0
8. 
  [dXY]=W(dX(:),dY(:),P); % Equation (7)
9. 
  g=InterpCoef(Xos(2).*ones(size(dXY,1),1)+dXY(:,2), Xos(1).*ones(size(dXY,1),1)+dXY(:,1));
10. 
  g_bar=mean(g(:)); g_tilde=sqrt(sum((g(:)-g_bar).^2)); % Equations (13) and (14)
11. 
  StopVal=StopCrit(dP,(SubSize-1)/2); % Equation (23)
12. 
  if any([StopVal<StopCritVal,Iter>=100])
13. 
    flag=1;
14. 
    C=1-sum(((f(:)-f_bar)/f_tilde-(g(:)-g_bar)/g_tilde).^2) /2; % Equation (12) substituted into Equation (15)
15. 
  else
16. 
    J=dfdWdP’*(f(:)-f_bar-f_tilde/g_tilde*(g(:)-g_bar)); % Summation of Equation (18)
17. 
    dP([1:SFOrder*3+0^SFOrder 7:6+SFOrder*3+0^SFOrder])=-Hinv*J; % Equation (18)
18. 
    P=Mat2SFPVec(SFPVec2Mat(P)/SFPVec2Mat(dP)); % Equation (21)
19. 
  end
20. 
  Iter=Iter+1;
21. 
end
1. 
function RD=StereoMatch(n,RD,ImNames1,ImNames2,StopCritVal)
2. 
SubExtract=@(Mat,Xos,SubSize) Mat(Xos(2)-(SubSize-1)/2: Xos(2)+(SubSize-1)/2,Xos(1)-(SubSize-1)/2:Xos(1)+(SubSize-1)/2); tic;
3. 
F=im2double(imread(ImNames1{1}));
4. 
if all(RD.ProcData1(1).ImgFilt), F=imgaussfilt(F, RD.ProcData1(1).ImgFilt(1),‘FilterSize’, RD.ProcData1(1).ImgFilt(2)); end
5. 
G=im2double(imread(ImNames2{1}));
6. 
if all(RD.ProcData1(1).ImgFilt), G=imgaussfilt(G, RD.ProcData1(1).ImgFilt(1),‘FilterSize’, RD.ProcData1(1).ImgFilt(2)); end
7. 
InterpCoef=griddedInterpolant({1:1:size(G,1),1:1:size(G,2)}, G, ‘spline’);
8. 
[dFdx,dFdy]=imgradientxy(F, ‘prewitt’);
9. 
P=FeatureMatch(RD.ProcData1,1,F,G,SubExtract); % Section 3.3.2
10. 
C=NaN(1,size(P,2)); Iter=NaN(1,size(P,2)); StopVal=NaN(1,size(P,2));
11. 
for q=1:size(P,2) % can be changed to parfor for parallel processing
12. 
  if (sum(isnan(P(:,q)))==0)&&(sum(isnan(RD.ProcData1(1).Xos (:,q)))==0)
13. 
    [f,dfdx,dfdy,dX,dY]=SubShapeExtract( RD.ProcData1(1).SubSize(q),RD.ProcData1(1).SubShape(q,:) ,RD.ProcData1(1).Xos(:,q),F,dFdx,dFdy,SubExtract); % Section 3.2
14. 
    [Pout(:,q),C(q),Iter(q),StopVal(q)]=SubCorr(InterpCoef,f ,dfdx,dfdy,RD.ProcData1(1).SubSize(q), RD.ProcData1(1).SFOrder(q),RD.ProcData1(1).Xos(:,q),dX, dY,P(:,q), StopCritVal); % Section 3.2
15. 
  end
16. 
end
17. 
RD.Stereo.P=Pout; RD.Stereo.C=C; RD.Stereo.Iter=Iter; RD.Stereo.StopVal=StopVal;
18. 
for d=1:n % determine subset positions in the FIS2 using Equation (32)
19. 
  RD.ProcData2(d).Xos(1,:)=RD.ProcData2(d).Xos(1,:)+ round(RD.Stereo.P(1,:)); RD.ProcData2(d).Xos(2,:)= RD.ProcData2(d).Xos(2,:)+round(RD.Stereo.P(7,:));
20. 
end
21. 
FailedSubsetsCondition=(RD.Stereo.C>=0.6)==0|(RD.ProcData2(1) .Xos(1,:)+(RD.ProcData2(1).SubSize(:)’-1)/2>size(G,2))|( RD.ProcData2(1).Xos(1,:)-(RD.ProcData2(1).SubSize(:)’-1)/2<1) |(RD.ProcData2(1).Xos(2,:)+(RD.ProcData2(1).SubSize(:)’- 1)/2>size(G,1))|(RD.ProcData2(1).Xos(2,:)-(RD.ProcData2(1).SubSize(:)’-1)/2<1);
22. 
FailedSubsets=find(FailedSubsetsCondition); PassedSubsets=find(FailedSubsetsCondition==0);
23. 
for d=1:n
24. 
  RD.ProcData1(d).Xos(:,FailedSubsets)=NaN(2,size( FailedSubsets,2));
25. 
  RD.ProcData2(d).Xos(:,FailedSubsets)=NaN(2,size( FailedSubsets,2));
26. 
end
27. 
fprintf('Stereo results\t| Time (s)| CC (min) | CC (mean) | Iter (max)\n\t\t\t\t| %7.3f | % .5f | % .6f | %4.0f \nSubsets that failed stereo matching %d/%d\n',toc,min(RD.Stereo.C(PassedSubsets)), nanmean(RD.Stereo.C(PassedSubsets)),max(RD.Stereo.Iter( PassedSubsets)),size(FailedSubsets,2),size(P,2));
1. 
function [P]=FeatureMatch(PD,d,F,G,SubExtract)
2. 
if exist(‘vl_sift’)~=3, fprintf(‘\nError occurred, please setup the VLFeat library required for SIFT feature matching (algorithm can be found at: https://www.vlfeat.org\n’); end; time_before_sift=toc;
3. 
[xk1,d1] = vl_sift(im2single(uint8(255 * F)));
4. 
[xk2,d2] = vl_sift(im2single(uint8(255 * G)));
5. 
KptsInVacinity=((abs(PD(d).Xos(2,:)-xk1(2,:)’)<=PD(d).SubSize /2) +(abs(PD(d).Xos(1,:)-xk1(1,:)’)<=PD(d).SubSize/2))==2;
6. 
xk1=xk1(:,sum(KptsInVacinity,2)>=1); d1=d1(:,sum(KptsInVacinity,2)>=1);
7. 
[matches, scores] = vl_ubcmatch(d1, d2,1.25);
8. 
xk1=xk1(1:2,matches(1,:))’; xk2=xk2(1:2,matches(2,:))’;
9. 
relevantKpts=knnsearch(xk1,PD(d).Xos’,’K’,20);
10. 
RansacModel=@(kpts) [[kpts(:,1) kpts(:,2) ones(size(kpts(:,1) ,1),1)]\kpts(:,3)-[1; 0; 0];[kpts(:,1) kpts(:,2) ones(size (kpts(:,1),1),1)]\kpts(:,4)-[0; 1; 0]]; % solves for affine transformation parameters of Equation (29)
11. 
RansacError=@(a, kpts) sum((kpts(:,3:4)’-[1+a(1), a(2), a(3); a(4), 1+a(5), a(6)]*[kpts(:,1)’; kpts(:,2)’;ones(1, size(kpts(:,1)’,2))]).^2,1); % Equation(30)
12. 
P=NaN(12,size(PD(d).Xos,2));
13. 
for q=1:size(PD(d).Xos,2) % can be changed to parfor for parallel processing
14. 
  try
15. 
  [a,~] = ransac([xk1(relevantKpts(q,:),:),xk2( relevantKpts(q,:),:)], @(data) RansacModel(data), @(model,data) RansacError(model,data), 3,1,’Confidence’, 99.5);
16. 
  P(:,q)=[a(1)*PD(d).Xos(1,q)+a(2)*PD(d).Xos(2,q)+a(3); a(1); a(2); 0; 0; 0;a(4)*PD(d).Xos(1,q)+a(5)*PD(d).Xos(2,q)+a(6); a(4); a(5); 0; 0; 0]; % Equation (31)
17. 
  end
18. 
end
19. 
fprintf(‘SIFT found %d matching keypoints in %5.2f seconds\n’,size(matches,2),toc-time_before_sift);
1. 
function [u,v]=PCM(F,G,SubSize,XosX,XosY,SubExtract)
2. 
if (isnan(XosX)==0)&&(isnan(XosY)==0)
3. 
  NCPS=(fft2(SubExtract(F,[XosX,XosY],SubSize)).*conj (fft2(SubExtract(G,[XosX,XosY],SubSize))))./abs(fft2( SubExtract(F,[XosX,XosY],SubSize)).*conj(fft2(SubExtract (G,[XosX,XosY],SubSize))));
4. 
  CC=(ifft2(NCPS));
5. 
  [vid,uid]=find(CC==max(CC(:)));
6. 
  IndShift=-ifftshift(-fix(SubSize/2):ceil(SubSize/2)-1);
7. 
  u=IndShift(uid);
8. 
  v=IndShift(vid);
9. 
else
10. 
  u=NaN; v=NaN;
11. 
end
1. 
function PD=ImgCorr(n,PD,FileNames,RefStrat,StopCritVal)
2. 
SubExtract=@(Mat,Xos,SubSize) Mat(Xos(2)-(SubSize-1)/2: Xos(2)+(SubSize-1)/2,Xos(1)-(SubSize-1)/2:Xos(1)+(SubSize- 1)/2);
3. 
for d=2:n, tic; % outer loop
4. 
  G=im2double(imread(FileNames{d}));
5. 
  if all(PD(d).ImgFilt), G=imgaussfilt(G,PD(d).ImgFilt(1), ‘FilterSize’,PD(d).ImgFilt(2)); end
6. 
  InterpCoef=griddedInterpolant({1:1:size(G,1),1:1:size(G,2)} ,G, ‘spline’); % Section 2.3.2
7. 
  if any([RefStrat==1,d==2])
8. 
    F=im2double(imread(FileNames{d-1}));
9. 
    if all(PD(d).ImgFilt), F=imgaussfilt(F,PD(d).ImgFilt(1) ,’FilterSize’,PD(d).ImgFilt(2)); end
10. 
    [dFdx,dFdy]=imgradientxy(F,’prewitt’);
11. 
    PD(d).Xos(1,:)=PD(d-1).Xos(1,:)+fix(PD(d-1).P(1,:));
12. 
    PD(d).Xos(2,:)=PD(d-1).Xos(2,:)+fix(PD(d-1).P(7,:));
13. 
    [PD(d).P(1,:),PD(d).P(7,:)]=arrayfun(@(XosX,XosY,SubSize )PCM(F,G,SubSize,XosX,XosY,SubExtract),PD(d).Xos(1,:), PD(d).Xos(2,:),PD(d).SubSize); % Section 3.4.1
14. 
  else
15. 
    PD(d).P=PD(d-1).P;
16. 
  end
17. 
  P=NaN(size(PD(d).P)); C=NaN(size(PD(d).C)); Iter=NaN(size(PD(d).C)); StopVal=NaN(size(PD(d).C));
18. 
  for q=1:size(PD(d).Xos,2) % inner loop (can be changed to parfor for parallel processing)
19. 
    if (sum(isnan(PD(d).P(:,q)))==0)&&(sum(isnan( PD(d).Xos(:,q)))==0)
20. 
      [f,dfdx,dfdy,dX,dY]=SubShapeExtract(PD(d).SubSize(q), PD(d).SubShape(q,:),PD(d).Xos(:,q),F,dFdx,dFdy, SubExtract); % Section 3.2
21. 
      [P(:,q),C(q),Iter(q),StopVal(q)]=SubCorr(InterpCoef,f ,dfdx,dfdy,PD(d).SubSize(q),PD(d).SFOrder(q), PD(d).Xos(:,q),dX,dY,PD(d).P(:,q),StopCritVal); % Section 3.2
22. 
      end
23. 
    end
24. 
  PD(d).P=P; PD(d).C=C; PD(d).Iter=Iter; PD(d).StopVal=StopVal;
25. 
  if rem(d-2,10)==0, fprintf('Image/Total| Time (s) | CC (min) | CC (mean) | Iter (max) \n'); end
26. 
  fprintf(' %4.d/%4.d | %8.3f | %.6f | %.7f | %4.0f \n',d,n,toc,min(PD(d).C),nanmean(PD(d).C),max(PD(d).Iter));
27. 
end
1. 
function RD=CSTrans(n,RD,WorldCTs,ImgCTs,RefStrat)
2. 
CamParams=estimateCameraParameters(ImgCTs,WorldCTs, ‘NumRadialDistortionCoefficients’,2); % Section 2.2
3. 
Q1=[CamParams.CameraParameters1.IntrinsicMatrix’,[0; 0; 0]]*[[eye(3), [0;0;0]]; 0, 0, 0, 1];
4. 
Q2=[CamParams.CameraParameters2.IntrinsicMatrix’,[0; 0; 0]]*[[CamParams.RotationOfCamera2’, CamParams.TranslationOfCamera2’]; 0, 0, 0, 1];
5. 
B=CamParams.FundamentalMatrix;
6. 
for d=1:n, tic
7. 
  Xds1=RD.ProcData1(d).Xos+[RD.ProcData1(d).P(1,:); RD.ProcData1(d).P(7,:)]; % Equation (49)
8. 
  Xds2=RD.ProcData2(d).Xos+[RD.ProcData2(d).P(1,:); RD.ProcData2(d).P(7,:)]; % Equation (49)
9. 
  indValid=find((isnan(Xds1(1,:))+isnan(Xds1(2,:)) +isnan(Xds2(1,:))+isnan(Xds2(2,:)))==0);
10. 
  if d==1|RefStrat==1
11. 
    RD.DispTrans(d).Xow(:,indValid)=Triangulation(B,Q1,Q2, undistortPoints(RD.ProcData1(d).Xos(:,indValid)’, CamParams.CameraParameters1)’,undistortPoints( RD.ProcData2(d).Xos(:,indValid)’, CamParams.CameraParameters2)’);
12. 
  else
13. 
    RD.DispTrans(d).Xow=RD.DispTrans(d-1).Xow;
14. 
  end
15. 
  RD.DispTrans(d).Uw(:,indValid)=Triangulation(B,Q1,Q2, undistortPoints(Xds1(:,indValid)’, CamParams.CameraParameters1)’,undistortPoints(Xds2(:, indValid)’, CamParams.CameraParameters2)’)-RD.DispTrans(d).Xow (:,indValid); % Equation (51)
16. 
  RD.DispTrans(d).CamParams=CamParams;
17. 
  fprintf(‘CS transformation image: %d/%d\t\ttime:%.3f\n’,d,n,toc);
18. 
end
1. 
function [ptsOut]=Triangulation(B,Q1,Q2,pts1,pts2)
2. 
for i=1:size(pts1,2)
3. 
  T1inv=[1, 0, pts1(1,i); 0, 1, pts1(2,i); 0, 0, 1]; % Equation (35)
4. 
  T2inv=[1, 0, pts2(1,i); 0, 1, pts2(2,i); 0, 0, 1]; % Equation (35)
5. 
  B1=T2inv’*B*T1inv; % Equation (36)
6. 
  [U,~,V]=svd(B1,0);
7. 
  e1=V(:,3)./norm(V(1:2,3));
8. 
  e2=U(:,3)./norm(U(1:2,3));
9. 
  R1=[e1(1), e1(2), 0; -e1(2), e1(1), 0; 0, 0, 1]; % Equation (37)
10. 
  R2=[e2(1), e2(2), 0; -e2(2), e2(1), 0; 0, 0, 1]; % Equation (37)
11. 
  B2=R2*B1*R1’; % Equation (38)
12. 
  phi_1=B2(2,2); phi_2=B2(2,3); phi_3=B2(3,2); phi_4=B2(3,3);
13. 
  p=[- phi_4*phi_1^2*phi_3*e1(3)^4 + phi_2*phi_1*phi_3^2*e1(3)^4, phi_1^4 + 2*phi_1^2*phi_3^2*e2(3)^2 - phi_1^2*phi_4^2*e1(3)^4 + phi_2^2*phi_3^2*e1(3)^4 + phi_3^4*e2(3)^4, 4*phi_1^3*phi_2 - 2*phi_1^2*phi_3*phi_4*e1(3)^2 + 4*phi_1^2*phi_3*phi_4*e2(3)^2 + 2*phi_1*phi_2*phi_3^2*e1(3)^2 + 4*phi_1*phi_2*phi_3^2*e2(3)^2 - phi_1*phi_2*phi_4^2*e1(3)^4 + phi_2^2*phi_3*phi_4*e1(3)^4 + 4*phi_3^3*phi_4*e2(3)^4, 6*phi_1^2*phi_2^2 - 2*phi_1^2*phi_4^2*e1(3)^2 + 2*phi_1^2*phi_4^2*e2(3)^2 + 8*phi_1*phi_2*phi_3*phi_4*e2(3)^2 + 2*phi_2^2*phi_3^2*e1(3)^2 + 2*phi_2^2*phi_3^2*e2(3)^2 + 6*phi_3^2*phi_4^2*e2(3)^4, - phi_1^2*phi_3*phi_4 + 4*phi_1*phi_2^3 + phi_1*phi_2*phi_3^2 - 2*phi_1*phi_2*phi_4^2*e1(3)^2 + 4*phi_1*phi_2*phi_4^2*e2(3)^2 + 2*phi_2^2*phi_3*phi_4*e1(3)^2 + 4*phi_2^2*phi_3*phi_4*e2(3)^2 + 4*phi_3*phi_4^3*e2(3)^4, - phi_1^2*phi_4^2 + phi_2^4 + phi_2^2*phi_3^2 + 2*phi_2^2*phi_4^2*e2(3)^2 + phi_4^4*e2(3)^4, phi_3*phi_2^2*phi_4 - phi_1*phi_2*phi_4^2];
14. 
  r=roots(p); % determine roots of polynomial of Equation (43)
15. 
  r=r(imag(r)==0);
16. 
  Ds=r.^2./(1+(r.*e1(3)).^2)+(phi_3.*r+phi_4).^2./((phi_1.*r +phi_2).^2+e2(3)^2*(phi_3.*r+phi_4).^2); % Equation (42)
17. 
  [t]=min(Ds);
18. 
  pts1temp=T1inv*R1’*[t^2*e1(3); t; t^2*e1(3)^2+1]; % Equation (44)
19. 
  pts2temp=T2inv*R2’*[e2(3)*(phi_3*t+phi_4)^2; -(phi_1*t+phi_2)*(phi_3*t+phi_4); (phi_1*t+phi_2)^2+e2(3)^2*(phi_3*t+phi_4)^2]; % Equation (45)
20. 
  ptsOut1=pts1temp(1:2)./pts1temp(3); ptsOut2=pts2temp(1:2)./pts2temp(3);
21. 
  [~,~,V]=svd([ptsOut1(1)*Q1(3,:)-Q1(1,:); ptsOut1(2)* Q1(3,:)-Q1(2,:); ptsOut2(1)*Q2(3,:)-Q2(1,:); ptsOut2(2)* Q2(3,:)-Q2(2,:)],0); % Section 2.8
22. 
  ptsOut(:,i)=V(1:3,4)./V(4,4);
23. 
end

Appendix B. Utilizing Parallel Processing for ADIC3D

Parallel processing can be used to reduce ADIC3D’s execution time by making use of MATLAB’s parfor loops. More specifically, the for loops in line 11 of StereoMatch, 13 of FeatureMatch, and 18 of ImgCorr can be replaced by parfor loops. It is for this reason that data within these for loops are saved to temporary storage variables, initiated prior to the for loops, and assigned to structured arrays thereafter. Note that parfor loops cause ADIC3D to require more random-access memory.

Appendix C. UndistortPasser Function

Requiring CSTrans to analyze a large number of subsets causes MATLAB’s undistortPoints function to require a large amount of random-access memory. If it requires more memory than is available, this causes a fatal error. This is avoided by replacing calls to undistortPoints with calls to subroutine UndistortPasser, detailed in Table A1, which has inputs Xos and the calibration parameters and returns the undistorted subset positions. UndistortPasser passes batches of 100 subsets to undistortPoints in order to avoid this fatal error. Note that this also reduces the computation time of lines 11 and 15 of CSTrans.
Table A1. UndistortPasser algorithm summary.
Line NumbersTask Performed
Line 2–3Determine how many times the number of subsets is divisible by 100 and save as iterations;
Line 4for q = 1 to iterations, do
Line 5   Undistort a batch of 100 subset positions using MATLAB’s undistortPoints function;
Line 6end for
Line 7–9Undistort the remaining subsets, not processed in the for loop, using undistortPoints;
The UndistortPasser subroutine is give as
1. 
function XosOut=UndistortPasser(Xos,CamParams)
2. 
n=size(Xos,1);
3. 
iterations=floor(n/100);
4. 
for i=1:iterations
5. 
  XosOut((i-1)*100+1:i*100,:)=undistortPoints(Xos((i - 1)*100+1:i*100,:),CamParams);
6. 
end
7. 
if rem(n,100)>0
8. 
  XosOut(iterations*100+1:iterations*100+rem(n,100),:)= undistortPoints(Xos(iterations*100+1:iterations*100+rem(n, 100),:),CamParams);
9. 
end

Appendix D. Imposed Displacements of Samples 1

Table A2. Mean and standard deviation of the imposed displacements measured by the stage’s optical encoder for Sample 1 [55].
Step u ^ w   Mean   ( mm ) U STD (nm) w ^ w   Mean   ( mm ) W STD (nm)
107.0106.76
207.69106.16
306.30206.21
407.67−106.12
506.74−206.33
6−104.9106.83
7−205.7107.27
8106.5306.79
9205.6907.37
10−105.99−104.57
11−2014.65−2025.19
12107.65106.43
13206.10206.54
14−105.70106.08
15−205.14206.45
16106.29−105.01
17205.99−206.07
1806.3607.59

Appendix E. Accounting for Tangential Distortion

Tangential distortion can be accounted for during the calibration and displacement transformation processes by altering line 2 of the CSTrans subroutine as “CamParams= estimateCameraParameters(ImgCTs,WorldCTs, ‘NumRadialDistortionCoefficients’,2, ‘EstimateTangentialDistortion’,true);”. MATLAB’s undistortPoints function automatically accounts for the tangential distortion model introduced.

References

  1. Pan, B.; Xie, H.; Wang, Z.; Qian, K.; Wang, Z. Study on subset size selection in digital image correlation for speckle patterns. Opt. Express 2008, 16, 7037–7048. [Google Scholar] [CrossRef] [PubMed]
  2. Wang, Y.Q.; Sutton, M.A.; Bruck, H.A.; Schreier, H.W. Quantitative error assessment in pattern matching: Effects of intensity pattern noise, interpolation, strain and image contrast on motion measurements. Strain 2009, 45, 160–178. [Google Scholar] [CrossRef]
  3. Schreier, H.W.; Braasch, J.R.; Sutton, M.A. Systematic errors in digital image correlation caused by intensity interpolation. Opt. Eng. 2000, 39, 2915–2921. [Google Scholar] [CrossRef]
  4. Schreier, H.W.; Sutton, M.A. Systematic errors in digital image correlation due to undermatched subset shape functions. Exp. Mech. 2002, 42, 303–310. [Google Scholar] [CrossRef]
  5. Balcaen, R.; Reu, P.L.; Lava, P.; Debruyne, D. Stereo-DIC uncertainty quantification based on simulated images. Exp. Mech. 2017, 57, 939–951. [Google Scholar] [CrossRef]
  6. Wang, Y.Q.; Sutton, M.A.; Ke, X.D.; Schreier, H.W.; Reu, P.L.; Miller, T.J. On Error Assessment in Stereo-based Deformation Measurements. Exp. Mech. 2011, 51, 405–422. [Google Scholar] [CrossRef]
  7. Hu, Z.; Xie, H.; Lu, J.; Wang, H.; Zhu, J. Error evaluation technique for three-dimensional digital image correlation. Appl. Opt. 2011, 50, 6239–6247. [Google Scholar] [CrossRef]
  8. Kammers, A.D.; Daly, S. Self-assembled nanoparticle surface patterning for improved digital image correlation in a scanning electron microscope. Exp. Mech. 2013, 53, 1333–1341. [Google Scholar] [CrossRef]
  9. Jin, H.; Lu, W.Y.; Korellis, J. Micro-scale deformation measurement using the digital image correlation technique and scanning electron microscope imaging. J. Strain Anal. Eng. Des. 2008, 43, 719–728. [Google Scholar] [CrossRef]
  10. Rosu, A.M.; Pierrot-Deseilligny, M.; Delorme, A.; Binet, R.; Klinger, Y. Measurement of ground displacement from optical satellite image correlation using the free open-source software micmac. ISPRS J. Photogramm. Remote Sens. 2015, 100, 48–59. [Google Scholar] [CrossRef]
  11. Zhang, D.; Arola, D.D. Applications of digital image correlation to biological tissues. J. Biomed. Opt. 2004, 9, 691–700. [Google Scholar] [CrossRef]
  12. Palanca, M.; Tozzi, G.; Cristofolini, L. The use of digital image correlation in the biomechanical area: A review. Int. Biomech. 2016, 3, 1–21. [Google Scholar] [CrossRef]
  13. Libertiaux, V.; Pascon, F.; Cescotto, S. Experimental verification of brain tissue incompressibility using digital image correlation. J. Mech. Behav. Biomed. Mater. 2011, 4, 1177–1185. [Google Scholar] [CrossRef]
  14. Sutton, M.A.; Ke, X.; Lessner, S.M.; Goldbach, M.; Yost, M.; Zhao, F.; Schreier, H.W. Strain field measurements on mouse carotid arteries using microscopic three-dimensional digital image correlation. J. Biomed. Mater. Res. Part A 2008, 84, 178–190. [Google Scholar] [CrossRef]
  15. Genovese, K.; Lee, Y.U.; Lee, A.Y.; Humphrey, J.D. An improved panoramic digital image correlation method for vascular strain analysis and material characterization. J. Mech. Behav. Biomed. Mater. 2013, 27, 132–142. [Google Scholar] [CrossRef] [Green Version]
  16. Masc, C.M.; Hoag, A.; Hoult, N.A.; Take, W.A. Field monitoring of a bridge using digital image correlation. Proc. Inst. Civ. Eng. Bridg. Eng. 2015, 168, 3–12. [Google Scholar]
  17. Yoneyama, S.; Kitagawa, A.; Iwata, S.; Tani, K.; Kikuta, H. Bridge deflection measurement using digital image correlation. Exp. Tech. 2007, 31, 34–40. [Google Scholar] [CrossRef]
  18. Winkler, J.; Specialist, C.; Hansen, M.D. Innovative long-term monitoring of the great belt bridge expansion joint using digital image correlation. Struct. Eng. Int. 2018, 28, 347–352. [Google Scholar] [CrossRef]
  19. Yoneyama, S.; Ueda, H. Bridge deflection measurement using digital image correlation with camera movement correction. Mater. Trans. 2012, 53, 285–290. [Google Scholar] [CrossRef] [Green Version]
  20. Sousa, P.J.; Barros, F.; Lobo, P.; Tavares, P.J.; Moreira, P.M.G.P. Experimental measurement of bridge deflection using digital image correlation. Procedia Struct. Integr. 2019, 17, 806–811. [Google Scholar] [CrossRef]
  21. Ngeljaratan, L.; Moustafa, M.A. Structural health monitoring and seismic response assessment of bridge structures using target-tracking digital image correlation. Eng. Struct. 2020, 213, 110551. [Google Scholar] [CrossRef]
  22. Tian, L.; Pan, B. Remote bridge deflection measurement using an advanced video deflectometer and actively illuminated LED targets. Sensors 2016, 16, 1344. [Google Scholar] [CrossRef] [PubMed] [Green Version]
  23. Tung, S.H.; Shih, M.H.; Sung, W.P. Development of digital image correlation method to analyse crack variations of masonry wall. Sadhana 2008, 33, 767–779. [Google Scholar] [CrossRef]
  24. Nghiem, H.L.; Al Heib, M.; Emeriault, F. Method based on digital image correlation for damage assessment in masonry structures. Eng. Struct. 2015, 86, 1–15. [Google Scholar] [CrossRef]
  25. Ghorbani, R.; Matta, F.; Sutton, M.A. Full-field deformation measurement and crack mapping on confined masonry walls using digital image correlation. Exp. Mech. 2015, 55, 227–243. [Google Scholar] [CrossRef]
  26. Mazzanti, P.; Caporossi, P.; Muzi, R. Sliding time master digital image correlation analyses of cubesat images for landslide monitoring: The Rattlesnake Hills landslide (USA). Remote Sens. 2020, 12, 592. [Google Scholar] [CrossRef] [Green Version]
  27. Caporossi, P.; Mazzanti, P.; Bozzano, F. Digital image correlation (DIC) analysis of the 3 December 2013 Montescaglioso landslide (Basilicata, southern Italy): Results from a multi-dataset investigation. ISPRS Int. J. Geo-Inf. 2018, 7, 372. [Google Scholar] [CrossRef] [Green Version]
  28. Bickel, V.T.; Manconi, A.; Amann, F. Quantitative assessment of digital image correlation methods to detect and monitor surface displacements of large slope instabilities. Remote Sens. 2018, 10, 865. [Google Scholar] [CrossRef] [Green Version]
  29. Daehne, A.; Corsini, A. Kinematics of active earthflows revealed by digital image correlation and DEM subtraction techniques applied to multi-temporal LiDAR data. Earth Surf. Process. Landf. 2013, 38, 640–654. [Google Scholar] [CrossRef]
  30. Dridi, S.; Morestin, F.; Dogui, A. Use of digital image correlation to analyse the shearing deformation in woven fabric. Exp. Tech. 2012, 36, 46–52. [Google Scholar] [CrossRef]
  31. Hursa, A.; Rolich, T.; Ražić, S.E. Determining pseudo Poisson’s ratio of woven fabric with a digital image correlation method. Text. Res. J. 2009, 79, 1588–1598. [Google Scholar] [CrossRef]
  32. Helfrick, M.N.; Niezrecki, C.; Avitabile, P.; Schmidt, T. 3D digital image correlation methods for full-field vibration measurement. Mech. Syst. Signal Process. 2011, 25, 917–927. [Google Scholar] [CrossRef]
  33. Yu, L.; Pan, B. Single-camera high-speed stereo-digital image correlation for full-field vibration measurement. Mech. Syst. Signal Process. 2017, 94, 374–383. [Google Scholar] [CrossRef]
  34. Beberniss, T.J.; Ehrhardt, D.A. High-speed 3D digital image correlation vibration measurement: Recent advancements and noted limitations. Mech. Syst. Signal Process. 2017, 86, 35–48. [Google Scholar] [CrossRef]
  35. Rajaram, S.; Vanniamparambil, P.A.; Khan, F.; Bolhassani, M.; Koutras, A.; Bartoli, I.; Moon, F.; Hamid, A.; Benson Shing, P.; Tyson, J.; et al. Full-field deformation measurements during seismic loading of masonry buildings. Struct. Control Health Monit. 2017, 24, e1903. [Google Scholar] [CrossRef]
  36. Winkler, J.; Hendy, C. Improved structural health monitoring of London’s docklands light railway bridges using digital image correlation. Struct. Eng. Int. 2017, 27, 435–440. [Google Scholar] [CrossRef]
  37. LeBlanc, B.; Niezrecki, C.; Avitabile, P.; Chen, J.; Sherwood, J. Damage detection and full surface characterization of a wind turbine blade using three-dimensional digital image correlation. Struct. Health Monit. 2013, 12, 430–439. [Google Scholar] [CrossRef]
  38. Peters, W.H.; Ranson, W.F. Digital imaging techniques in experimental stress analysis. Opt. Eng. 1982, 21, 427–431. [Google Scholar] [CrossRef]
  39. Luo, P.F.; Chao, Y.J.; Sutton, M.A.; Peters, W.H. Accurate measurement of three-dimensional deformations in deformable and rigid bodies using computer vision. Exp. Mech. 1993, 33, 123–132. [Google Scholar] [CrossRef]
  40. Bay, B.K.; Smith, T.S.; Fyhrie, D.P.; Saad, M. Digital volume correlation: Three-dimensional strain mapping using x-ray tomography. Exp. Mech. 1999, 39, 217–226. [Google Scholar] [CrossRef]
  41. Pan, B. Digital image correlation for surface deformation measurement: Historical developments, recent advances and future goals. Meas. Sci. Technol. 2018, 29, 082001. [Google Scholar] [CrossRef]
  42. Peters, W.H.; Ranson, W.F.; Sutton, M.A.; Chu, T.C.; Anderson, J. Application of digital correlation methods to rigid body mechanics. Opt. Eng. 1983, 22, 738–742. [Google Scholar] [CrossRef]
  43. Lu, H.; Cary, P.D. Deformation measurements by digital image correlation: Implementation of a second-order displacement gradient. Exp. Mech. 2000, 40, 393–400. [Google Scholar] [CrossRef]
  44. Tong, W. An evaluation of digital image correlation criteria for strain mapping applications. Strain 2005, 41, 167–175. [Google Scholar] [CrossRef]
  45. Pan, B. Bias error reduction of digital image correlation using gaussian pre-filtering. Opt. Lasers Eng. 2013, 51, 1161–1167. [Google Scholar] [CrossRef]
  46. Baker, S.; Matthews, I. Lucas-kanade 20 years on: A unifying framework. Int. J. Comput. Vis. 2004, 56, 221–255. [Google Scholar] [CrossRef]
  47. Pan, B.; Wang, B. Digital image correlation with enhanced accuracy and efficiency: A comparison of two subpixel registration algorithms. Exp. Mech. 2016, 56, 1395–1409. [Google Scholar] [CrossRef]
  48. Pan, B.; Li, K.; Tong, W. Fast, robust and accurate digital image correlation calculation without redundant computations. Exp. Mech. 2013, 53, 1277–1289. [Google Scholar] [CrossRef]
  49. Gao, Y.; Cheng, T.; Su, Y.; Xu, X.; Zhang, Y.; Zhang, Q. High-efficiency and high-accuracy digital image correlation for three-dimensional measurement. Opt. Lasers Eng. 2015, 65, 73–80. [Google Scholar] [CrossRef]
  50. Solav, D.; Moerman, K.M.; Jaeger, A.M.; Genovese, K.; Herr, H.M. MultiDIC: An open-source toolbox for multi-view 3D digital image correlation. IEEE Access 2018, 6, 30520–30535. [Google Scholar] [CrossRef]
  51. Blaber, J.; Adair, B.; Antoniou, A. Ncorr: Open-source 2D digital image correlation matlab software. Exp. Mech. 2015, 55, 1105–1122. [Google Scholar] [CrossRef]
  52. Jones, E.M.C.; Iadicola, M.A. A good practices guide for digital image correlation. Int. Digit. Image Correl. Soc. 2018, 10. [Google Scholar] [CrossRef]
  53. Atkinson, D.; Becker, T. A 117 line 2D digital image correlation code written in matlab. Remote Sens. 2020, 12, 2906. [Google Scholar] [CrossRef]
  54. Sutton, M.A.; Yan, J.H.; Tiwari, V.; Schreier, H.W.; Orteu, J.J. The effect of out-of-plane motion on 2D and 3D digital image correlation measurements. Opt. Lasers Eng. 2008, 46, 746–757. [Google Scholar] [CrossRef] [Green Version]
  55. Reu, P.; Wattrisse, B.; Wang, W.; Robert, L.; Bruck, H.; Daly, S.; Rodriguez-Vera, R.; Bugarin, F. Challenge Dataset: 3D-DIC Web Page. Available online: https://sem.org/content.asp?contentid=198 (accessed on 15 October 2020).
  56. Turner, D.Z. Digital Image Correlation Engine (DICe) Reference Manual. Available online: http://dicengine.github.io/dice/index.html (accessed on 20 July 2020).
  57. Bloomenthal, J.; Rokne, J. Homogeneous coordinates. Vis. Comput. 1994, 11, 15–26. [Google Scholar] [CrossRef]
  58. Bothe, T.; Li, W.; Schulte, M.; Von Kopylow, C.; Bergmann, R.B.; Jüptner, W.P.O. Vision ray calibration for the quantitative geometric description of general imaging and projection optics in metrology. Appl. Opt. 2010, 49, 5851–5860. [Google Scholar] [CrossRef]
  59. Dunne, A.K.; Mallon, J.; Whelan, P.F. Efficient generic calibration method for general cameras with single center of projection. Comput. Vis. Image Underst. 2010, 114, 220–233. [Google Scholar] [CrossRef] [Green Version]
  60. Wei, G.Q.; De Ma, S. Implicit and explicit camera calibration: Theory and experiments. IEEE Trans. Pattern Anal. Mach. Intell. 1994, 16, 469–480. [Google Scholar] [CrossRef]
  61. Zhang, Z. A flexible new technique for camera calibration. IEEE Trans. Pattern Anal. Mach. Intell. 2000, 22, 1330–1334. [Google Scholar] [CrossRef] [Green Version]
  62. Balcaen, R.; Wittevrongel, L.; Reu, P.L.; Lava, P.; Debruyne, D. Stereo-DIC calibration and speckle image generator based on FE formulations. Exp. Mech. 2017, 57, 703–718. [Google Scholar] [CrossRef]
  63. Hou, H.S.; Andrews, H.C. Cubic splines for image interpolation and digital filtering. IEEE Trans. Acoust. 1978, 26, 508–517. [Google Scholar] [CrossRef]
  64. Pan, B.; Xie, H.; Wang, Z. Equivalence of digital image correlation criteria for pattern matching. Appl. Opt. 2010, 49, 5501–5509. [Google Scholar] [CrossRef] [PubMed] [Green Version]
  65. Hartley, R.; Zisserman, A. Multiple View Geometry in Computer Vision, 2nd ed.; Cambridge University Press: Cambridge, UK, 2004. [Google Scholar]
  66. Hartley, R.I.; Sturm, P. Triangulation. Comput. Vis. Image Underst. 1997, 68, 146–157. [Google Scholar] [CrossRef]
  67. Foroosh, H.; Zerubia, J.B.; Berthod, M. Extension of phase correlation to subpixel registration. IEEE Trans. Image Process. 2002, 11, 188–200. [Google Scholar] [CrossRef] [Green Version]
  68. Reu, P. Stereo-rig design: Stereo-angle selection—Part 4. Exp. Tech. 2013, 37, 1–2. [Google Scholar] [CrossRef]
  69. Garcia, D.; Orteu, J.J.; Penazzi, L. A combined temporal tracking and stereo-correlation technique for accurate measurement of 3D displacements: Application to sheet metal forming. J. Mater. Process. Technol. 2002, 125, 736–742. [Google Scholar] [CrossRef] [Green Version]
  70. Schreier, H.; Orteu, J.J.; Sutton, M.A. Image Correlation for Shape, Motion and Deformation Measurements: Basic Concepts, Theory and Applications; Springer: New York, NY, USA, 2009; ISBN 9780387787466. [Google Scholar]
  71. Zhou, Y.; Pan, B.; Chen, Y.Q. Large deformation measurement using digital image correlation: A fully automated approach. Appl. Opt. 2012, 51, 6674–7683. [Google Scholar] [CrossRef]
  72. Lowe, D.G. Distinctive image features from scale-invariant keypoints. Int. J. Comput. Vis. 2004, 60, 91–110. [Google Scholar] [CrossRef]
  73. Torr, P.H.S.; Zisserman, A. MLESAC: A new robust estimator with application to estimating image geometry. Comput. Vis. Image Underst. 2000, 78, 138–156. [Google Scholar] [CrossRef] [Green Version]
  74. Żołądek, H. The topological proof of abel-ruffini theorem. Topol. Methods Nonlinear Anal. 2000, 16, 253–265. [Google Scholar] [CrossRef]
  75. Zhou, Y.; Sun, C.; Chen, J. Adaptive subset offset for systematic error reduction in incremental digital image correlation. Opt. Lasers Eng. 2014, 55, 5–11. [Google Scholar] [CrossRef]
  76. Lourakis, M. Stereo Triangulation. Available online: https://www.mathworks.com/matlabcentral/fileexchange/67383-stereo-triangulation (accessed on 21 April 2020).
  77. Turner, D.Z. An overview of the gradient-based local DIC formulation for motion estimation in DICe. Sandia Rep. 2016, 1–6. [Google Scholar] [CrossRef]
  78. Lehoucq, R.B.; Reu, P.L.; Turner, D.Z. The effect of the ill-posed problem on quantitative error assessment in digital image correlation. Exp. Mech. 2017, 61, 609–621. [Google Scholar] [CrossRef]
  79. Grubbs, F.E. Procedures for detecting outlying observations in samples. Technometrics 1969, 11, 1–21. [Google Scholar] [CrossRef]
  80. Furukawa, Y.; Ponce, J. Accurate camera calibration from multi-view stereo and bundle adjustment. Int. J. Comput. Vis. 2009, 84, 257–268. [Google Scholar] [CrossRef]
  81. Vo, M. Advanced geometric camera calibration for machine vision. Opt. Eng. 2011, 50, 110503. [Google Scholar] [CrossRef] [Green Version]
  82. Pan, B.; Dafang, W.; Yong, X. Incremental calculation for large deformation measurement using reliability-guided digital image correlation. Opt. Lasers Eng. 2012, 50, 586–592. [Google Scholar] [CrossRef]
  83. Bornert, M.; Brémand, F.; Doumalin, P.; Dupré, J.C.; Fazzini, M.; Grédiac, M.; Hild, F.; Mistou, S.; Molimard, J.; Orteu, J.J.; et al. Assessment of digital image correlation measurement errors: Methodology and results. Exp. Mech. 2009, 49, 353–370. [Google Scholar] [CrossRef] [Green Version]
  84. Pan, B. Reliability-guided digital image correlation for image deformation measurement. Appl. Opt. 2009, 48, 1535–1542. [Google Scholar] [CrossRef]
  85. Thiruselvam, N.I.; Subramanian, S.J. Feature-assisted stereo correlation. Strain 2019, 55, e12315. [Google Scholar] [CrossRef]
  86. Weinzaepfel, P.; Revaud, J.; Harchaoui, Z.; Schmid, C. DeepFlow: Large displacement optical flow with deep matching. Proc. IEEE Int. Conf. Comput. Vis. 2013, 1385–1392. [Google Scholar] [CrossRef] [Green Version]
Figure 1. Schematic diagram of coordinate systems employed by the camera model.
Applsci 11 04904 g001
Figure 2. Schematic illustration of the epipolar geometry.
Applsci 11 04904 g002
Figure 3. Schematic illustration of the displacement transformation process. Note that a projection line represents the combined process of distortion correction and triangulation.
Applsci 11 04904 g003
Figure 4. Displacement in the x-direction in the world CS superimposed on the FIS1 of the ASTM tensile specimen [55].
Applsci 11 04904 g004
Table 1. Required input variables of the ADIC3D framework.
VariableVariable Description
FileNames1Cell array of character vectors containing the image file names of the first image series. All images need to be the same size.
FileNames2Cell array of character vectors containing the image file names of the second image series. All images need to be the same size.
MaskLogical matrix, which is the same size as the images, indicating which pixels should not be analyzed during correlation.
GaussFiltDefines the standard deviation and window size for the Gaussian filter in pixels as [FiltSigma, FiltSize] respectively where {FiltSigma ∈ ℝ+|FiltSigma > 0} and {FiltSize ∈ ℕ}.
StepSizeStep size in pixels {StepSize ∈ ℕ}.
SubSizeSubset size in pixels {SubSize = 2k + 1|k ∈ ℕ}.
SubShapeSubset shape {SubShape ∈ 'Square','Circle'}.
SFOrderDictates the SF order {SFOrder ∈ ℤ|0 ≤ SFOrder ≤ 2}.
RefStratLogical statement dictating reference image strategy (Section 2.6.1).
StopCritValDefines the stopping criterion value {StopCritVal ∈ ℝ|StopCritVal > 0}.
WorldCTsLocation of CTs in the world CS defined according to MATLAB’s estimateCameraParameters function.
ImgCTsLocation of CTs in the distorted sensor CSs defined according to MATLAB’s estimateCameraParameters function.
Table 2. Accessing the stereo matching data contained in ResultData.Stereo for subset q.
VariableVariable Description
P(b,q)SFPs (b = 1 for u and b = 7 for v ).
C(q)ZNCC coefficient.
Iter(q)Number of iterations until stopping criterion is satisfied (maximum of 100 iterations).
StopVal(q)Final stopping criterion value for subset q.
Table 3. Accessing the processing data for temporal matching (ResultData.ProcData1(d) and ResultData.ProcData2(d)) for image d and subset number q.
VariableVariable Description
ImgNameDeformed image name.
ImgSize(b)Image size (b = 1 for rows and b = 2 for columns).
ImgFilt(b)Standard deviation (b = 1) and window size (b = 2) for the Gaussian filter respectively in pixels.
SubSize(q)Subset size in pixels.
SubShape(q,:)Subset shape.
SFOrder(q)SF order.
Xos(b,q)Reference subset position in the distorted sensor CS of the relevant camera (b = 1 for x o and b = 2 for y o ).
P(b,q)SFPs (b = 1 for u and b = 7 for v ).
C(q)ZNCC coefficient.
Iter(q)Number of iterations until stopping criterion is satisfied (maximum of 100 iterations).
StopVal(q)Final stopping criterion value.
Table 4. Accessing the displacement transformation data for image d (contained in ResultData.DispTrans(d)) for subset q.
VariableVariable Description
Xow(b,q)Reference subset position in the world CS (b = 1 for x ^ w o , b = 2 for y ^ w o , and b = 3 for z ^ w o ).
Uw(b,q)Displacement in the world CS (b = 1 for u ^ w , b = 2 for v ^ w , and b = 3 for w ^ w ).
CamParamsCalibration parameters (extrinsic, intrinsic, and radial distortion parameters).
Table 5. ADIC3D algorithm summary.
Line NumbersTask Performed
Lines 2–3Compute image names of both image series;
Lines 4–5Compute number of images and size of the first image in first image series;
Lines 6–7Create regularly spaced reference subset positions, Xos;
Line 8Remove subsets containing invalid pixels which are defined by Mask;
Line 9–12Pre-assign ResultData structure array;
Line 13Call subroutine StereoMatch to perform stereo matching;
Line 15Call subroutine ImgCorr to perform temporal matching of first image series;
Line 17Call subroutine ImgCorr to perform temporal matching of second image series;
Line 18Call subroutine CSTrans to perform displacement transformation from the distorted sensor CSs to the world CS;
Table 6. SubShapeExtract algorithm summary.
Line NumbersTask Performed
Line 2switch SubShape;
Line 3caseSubShape = 'Square', do
Line 4–6  Extract f i and f i using SubExtract;
Line 7  Compute Δ x i using SubSize;
Line 8caseSubShape = 'Circle', do
Line 9–11  Extract f i and f i using SubExtract;
Line 12  Compute Δ x i using SubSize;
Line 13  Determine mask of elements that fall within the circular subset;
Line 14–16  Use mask to extract appropriate data for circular subset;
Line 17end switch
Table 7. SFExpressions algorithm summary.
Line NumbersTask Performed
Line 2switch SFOrder
Line 3–8caseSFOrder = 0, do assign functions for zero-order SF;
Line 9–14case SFOrder = 1, do assign functions for first-order SF;
Line 15–20case SFOrder = 2, do assign functions for second-order SF;
Line 21end switch
Table 8. SubCorr algorithm summary.
Line NumbersTask Performed
Line 2Call SFExpressions to assign equations dependent on the SF order;
Line 3Compute f i W i P ;
Line 4Compute H 1 , Equation (19);
Line 5Compute f ¯ and f ˜ ;
Line 6Initialise flag ← 0, Iter ← 1 and Δ P 1 ;
Line 7whileflag = 0, do
Line 8  Compute Δ x i , Equation (7), using estimates of P ;
Line 9  Compute g using interpolation coefficients;
Line 10  Compute g ¯ and g ˜ ;
Line 11  Compute ‖ Δ P ‖ using Equation (23);
Line 12  if ‖ Δ P < StopCritVal or Iter ≥ 100, do
Line 13    Set flag ← 1;
Line 14    Compute C, Equation (12) substituted into Equation (15);
Line 15  else, do
Line 16    Compute J , Summation expression of Equation (18);
Line 17    Compute Δ P , Equation (18);
Line 18    Update P , Equation (21);
Line 19  end if
Line 20  Set Iter ← Iter + 1;
Line 21end while
Table 9. StereoMatch algorithm summary.
Line NumbersTask Performed
Line 2Define SubExtract function to extract square subset data;
Line 3–6Load the FIS1 and FIS2 and perform Gaussian filtering on them;
Line 7Compute interpolation coefficients of G using MATLAB’s griddedInterpolant function;
Line 9Call subroutine FeatureMatch to determine SFP initial estimates;
Line 10Initialise temporary storage variables used to save correlation information during the for loop;
Line 11for subset number q = 1 to number of subsets, do
Line 12  if FeatureMatch determined SFP initial estimates for subset q, do
Line 13    Call subroutine SubShapeExtract;
Line 14    Call subroutine SubCorr;
Line 15  end if
Line 16end for
Line 17Save correlation information to RD.Stereo variable;
Line 18for image number d = 1 to d = n, do
Line 19  Compute the subset positions in the FIS2 using Equation (32);
Line 20end for
Line 21–22Determine subsets which fail stereo matching and subsets which pass;
Line 23–26Set the subset position of subsets which fail stereo matching to NaNs throughout both image series;
Line 27Display information for stereo matching;
Table 10. FeatureMatch algorithm summary.
Line NumbersTask Performed
Line 2if VLFeat library is not setup, then return an error;
Line 3–4Compute keypoint locations and descriptors for F and G using vl_sift;
Line 5Determine vector KptsInVacinity identifying the keypoints of F which fall within the perimeter of the square subsets, equivalent in size to that specified for the subset under consideration, of F;
Line 6Eliminate keypoints (and their associated descriptors) of F which do not fall within the perimeter of any of the subsets;
Line 7–8Determine matching keypoints using vl_ubcmatch;
Line 9Determine the 20 nearest keypoints for each subset stored in matrix relevantKpts;
Line 10–11Define anonymous functions RansacModel and RansacError for determining affine transformation parameters (of Equation (29)) and evaluating Equation (30) respectively;
Line 12Initialise P as NaNs;
Line 13for subset number q = 1 to number of subsets, do
Line 14  try
Line 15    Use MSAC to determine affine transformation parameters for subset q from its relevant keypoints;
Line 16    Convert affine transformation parameters to second-order SFPs using Equation (31);
Line 17  end try
Line 18end for
Line 19Display information for SIFT feature matching;
Table 11. PCM algorithm summary.
Line NumbersTask Performed
Line 2if subset positions do not contain NaNs, do
Line 3  Compute normalized cross-power spectrum in the frequency domain;
Line 4  Convert back to spatial domain;
Line 5  Find index of the maximum correlation coefficient;
Line 6  Compute index vector which relates indices of the correlation coefficient matrix to the displacements they correspond to;
Line 7–8  Obtain displacements using index of the maximum correlation coefficient;
Line 9else, do
Line 10  Set output displacements to NaN;
Line 11end if
Table 12. ImgCorr algorithm summary.
Line NumbersTask Performed
Line 2Define SubExtract function to extract square subset data;
Line 3for image number d = 2 to d = n, do
Line 4  Define G ;
Line 5  Perform Gaussian filtering on G using MATLAB’s imgaussfilt function;
Line 6  Compute interpolation coefficients of G using MATLAB’s griddedInterpolant function;
Line 7  if first image of correlation run or RefStrat = 1, do
Line 8    Define F ;
Line 9    Perform Gaussian filtering on F using MATLAB’s imgaussfilt function;
Line 10    Compute gradients for F (compute F );
Lines 11–12    Displace Xos with previous image correlation run displacement SFPs (incremental strategy);
Line 13    Call subroutine PCM to compute initial estimates of displacement SFPs;
Line 14  else, do
Line 15    Set P(d) ← P(d-1);
Line 16  end if
Line 17  Initialise temporary storage variables used to save correlation information during the inner loop;
Line 18  for subset number q = 1 to number of subsets, do
Line 19    if subset q passed stereo matching, do
Line 20      Call subroutine SubShapeExtract;
Line 21      Call subroutine SubCorr;
Line 22    end if
Line 23  end for
Line 24  Save correlation information to PD variable;
Line 25–26  Display results for image d correlation;
Line 27end for
Table 13. CSTrans algorithm summary.
Line NumbersTask Performed
Line 2Compute calibration parameters using MATLAB’s estimateCameraParameters function;
Line 3–4Compute canonical projection matrices of first and second cameras;
Line 5Load the fundamental matrix;
Line 6for image number d = 1 to d = n, do
Line 7–8   Compute x s 1 d and x s 2 d , Equation (49);
Line 9   Determine indices of subsets which do not contain NaNs in either x s 1 d or x s 2 d ;
Line 10   if first image pair of image set or RefStrat = 1, do
Line 11      Compute x ^ w o (for subsets identified in line 9) using the Triangulation subroutine and MATLAB’s undistortPoints function;
Line 12   else
Line 13      Assign x ^ w o of previous image pair to current image pair;
Line 14   end if
Line 15   Compute x ^ w d (for subsets identified in line 9), using the Triangulation subroutine and MATLAB’s undistortPoints function, and subtract x ^ w o from it to determine u ^ w , v ^ w and w ^ w using Equation (51);
Line 16   Save calibration parameters;
Line 18end for
Table 14. Triangulation algorithm summary.
Line NumbersTask Performed
Line 2for subset pair number q = 1 to number of subsets, do
Lines 3–4  Determine translation matrices of Equation (35);
Line 5  Apply translation matrices to fundamental matrix according to Equation (36);
Lines 6–8  Compute epipoles and normalize them;
Lines 9–10  Compute rotation matrices according to Equation (37);
Line 11  Apply rotation matrices to fundamental matrix according to Equation (38);
Lines 12–13  Compute polynomial coefficients of Equation (43);
Lines 14–15  Compute real roots of the polynomial;
Line 16  Evaluate polynomial of Equation (42) at these roots;
Line 17  Determine root corresponding to minimum of Equation (42);
Lines 18–20  Compute ideal subset positions according to Equations (44) and (45);
Lines 21–22  Determine 3D position of noiseless subset positions using linear triangulation method;
Line 23end for
Table 15. Displacement error metrics for Sample 1 reported at ×10−3 mm.
StepADIC3DDICeStrain Master
BiasVarianceBiasVarianceBiasVariance
347.29.1737.12355.514.1
744.27.6541.121.650.213
1561.613.457.133.577.420.1
Table 16. Displacement error metrics for Sample 2 reported at ×10−3 mm.
StepADIC3DDICeStrain Master
BiasVarianceBiasVarianceBiasVariance
31.552.485.144.5911.35.89
71.42.164.484.43.076.47
152.353.529.926.867.0321.2
Table 17. Percentage difference of computed displacements between ADIC3D and DICe.
Image Pair2505007501000
MetricMeanMaxMeanMaxMeanMaxMeanMax
u ^ w 0.03420.1310.03540.1130.03730.1180.03740.122
v ^ w 0.3742.190.62.570.8752.971.043.84
w ^ w 0.0930.4430.1930.7440.2910.9260.3451.02
Publisher’s Note: MDPI stays neutral with regard to jurisdictional claims in published maps and institutional affiliations.

