Article

Performance of CRTS-II Ballastless Track–Bridge Structural System Rebars under Fatigue Loading Test

School of Civil Engineering & National Engineering Laboratory for High Speed Railway Construction, Central South University, 68 South Shaoshan Road, Changsha 410075, China
*
Author to whom correspondence should be addressed.
Appl. Sci. 2021, 11(11), 4858; https://doi.org/10.3390/app11114858
Submission received: 21 April 2021 / Revised: 19 May 2021 / Accepted: 20 May 2021 / Published: 25 May 2021
(This article belongs to the Section Civil Engineering)

Abstract

:
To study the evolution of mechanical properties of steel rebars in the China Railway Track System Type II (CRTS II) ballastless track–bridge structural system under repeated train loads, a 1/4 scale three-span ballastless slab track simple-supported bridge structural system specimen was manufactured and subjected to a multistage fatigue test with 18 million cycles. The experimental results show that the strain amplitude of the steel bar changes proportionally to the fatigue stress amplitude, and there is an obvious strain increase in the loading stage 4, where the fatigue stress amplitude is the largest. During the test, the cumulative strain–amplitude ratio first decreases then increases. At the end of the test, the cumulative strain–amplitude ratio increases by 5.46% and 5.32%, respectively, at L/2 and L/4 sections. The load–strain curve of the steel rebar keeps the shape of an oblique straight line. The slope increases first and then decreases with a degradation at the end of the test of 5.15% and 4.81%, respectively, at L/2 and L/4 sections. The mechanical properties of the rebar are enhanced under the first three million fatigue loading cycles: this is the fatigue strengthening stage. The mechanical properties of reinforcement gradually degrade from the three millionth cycle to the end of the test: this is the fatigue damage stage. Finally, based on the material fatigue damage model and the multistage cumulative damage criterion, the change rule of the load–strain curve slope of steel rebars in the fatigue damage stage is obtained by finite element simulation. The simulation results agree well with the experimental data, proving the validity of the calculation method proposed in this paper.

1. Introduction

High-speed railways have the advantages of strong transportation capacity, high speed, safety and high efficiency, and have been widely used in China in recent years [1,2,3]. At present, the length of the high-speed railway bridges that have been built and are under service in China accounts for nearly 50% of the total operating mileage. Among them, the length of simple-supported box girder bridges with a 32 m standard span accounts for about 95% of the total length of constructed bridges [4]. The repeated train load is the main load on the high-speed ballastless track simple-supported box railway girder bridge structural system [5]. Under the long-term train load, the change in the mechanical properties of longitudinal rebars has an important impact on the mechanical performance of the track–bridge structural system. Therefore, it is of great significance to study the real deformation process, mechanical characteristics and damage evolution of the tensile rebars of the ballastless track simple-supported box girder under a repeated train load.
The fatigue performance of steel bars in the track–bridge structural system is different from that of concrete bridges, taken individually [6,7], and most of the current research focuses on the fatigue performance of steel bars in concrete beams [8,9]. Yuan [10] carried out fatigue tests on pre-stressed RC box girders and found that the fatigue strain of stirrups, deflection changes of box girders and fatigue diagonal crack damage have similar evolution trends; fatigue damage increases significantly at the initial loading stage, increases slowly with the increase in fatigue loading cycles at intermediate loading stages before growing rapidly at the final stage. Han [11] carried out experimental and numerical analyses on the residual strain of non-pre-stressed reinforcing steel in concrete beams under fatigue load. The test results show that the fatigue residual strain of non-pre-stressed rebars gradually increases during the fatigue process, and its evolution presents a “three-stage” development trend. He highlighted that the existence of residual strain will lead to the increase in the stress level of the steel rebars in the pre-stressed concrete beam and finally, proposed a model to analyze the residual strain of non-pre-stressed reinforcement under fatigue load. M.H.P. [12] studied the effect of reinforcement on reinforced concrete beams under bending fatigue load, using acoustic emission technology. The experimental results show that the steel rebar provides remarkable ductility to reinforced concrete beams in which crack opening displacement and mid-span vertical displacement increase with the increase in rebar strain under increasing fatigue load, thus increasing their fatigue life. They concluded that the fatigue life of reinforced concrete beams depends on the size and quantity of the reinforcing steel, which plays an important role in improving the fatigue life of reinforced concrete beams. Li [13] carried out fatigue tests on marine sand concrete beams, using fiber-reinforced polymer reinforcement. It was found that when the applied load reaches the cracking load, the micro-cracks in the concrete in the tensile zone continue to occur and expand, and the stress in the cracked zone of the concrete shifts to the longitudinal rebar. Therefore, the expansion of micro-cracks is characterized by strain increase in the longitudinal rebar. The consequence is that the stiffness of the reinforced concrete beams decreases, and the damage of the interface stiffness increases with the increase in the load level and number of cycles. These studies improve the fatigue theory in corresponding fields and promote the development of various bridges, to a certain extent.
Many scholars have carried out fatigue test research on reinforcing steel in railways and highway pre-stressed concrete bridges [14]. Yu [15] conducted a constant-amplitude fatigue loading test on the simple-supported T-beam of heavy-load railway pre-stressed concrete. The fatigue failure modes of heavy-load railway bridges, the variation laws of amplitude, stiffness, strain of non-prestressing bars and prestressing bars, and the concrete strain with the number of repeated loads are studied. The investigation shows that the stress amplitude ratio of the pre-stressed and non-pre-stressed bar before fatigue failure, which is caused by fatigue fracture of the non-pre-stressed bar at bottom of the beam of the heavy-load railway bridge, is about 0.6~0.7. Du [16] carries out a test and numerical analysis of the fatigue performance of the heavy-duty railway pre-stressed concrete beam under a constant and variable amplitude fatigue load, with emphasis on analyzing and fitting the residual strain of the concrete in the compression zone and gives the S–N relationships of the bottom tensile steel bar, related to the prestressing force. The test results show that the displacement and strain of the concrete and reinforcing steel in the compression zone of the beam under a variable amplitude fatigue test show a multi-stage development trend due to the increase in the multi-stage fatigue load. Combined with the multi-stage linear cumulative damage criterion, the fatigue characterization model of the tensile steel-rebar and pre-stressing steel strand is given.
The existing literature only considers individual concrete bridges under the fatigue test. Moreover, there are few research studies on the mechanical fatigue of steel bars in the high-speed railway pre-stressed concrete track–bridges structural system. The fundamental difference between the ballastless track–bridge structural system and the single concrete bridge structure is that in the track–bridge structural system, the bridge structure and the ballastless track structure overlaid on it form an interactive and interdependent organic structural system [17]; the ballastless track structure restricts the deformation of the bridge to a certain extent [18]. Therefore, the fatigue characteristics of the steel rebars in the high-speed railway ballastless track–bridge structural system under a train load are different from the above research [19]. The stress level of the steel rebars in the girder under a train load is lower, indicating high-cycle fatigue. The failure probability under service conditions is insignificant. Existing studies mainly focus on the fatigue failure mode and fatigue life of pre-stressed concrete beams. There are few studies on the evolution of the mechanical properties of the steel bars in the beam under high-cycle fatigue loading.
In this paper, a 1/4 scaled specimen of the whole track–bridge structural system was constructed, and an 18 million train-load fatigue test was carried out in the laboratory. The development of the strain, strain amplitude and slope of the load–strain curve of longitudinal steel rebars was monitored and used to analyze their fatigue behaviors. A finite element analysis method considering the fatigue damage of steel bars, and the concrete and cement-emulsified asphalt (CA) mortar is proposed to simulate the fatigue behaviors of steel bars in a ballastless track–bridge structural system during the fatigue damage stage; the calculated results are verified by the test results.

2. Experimental Program

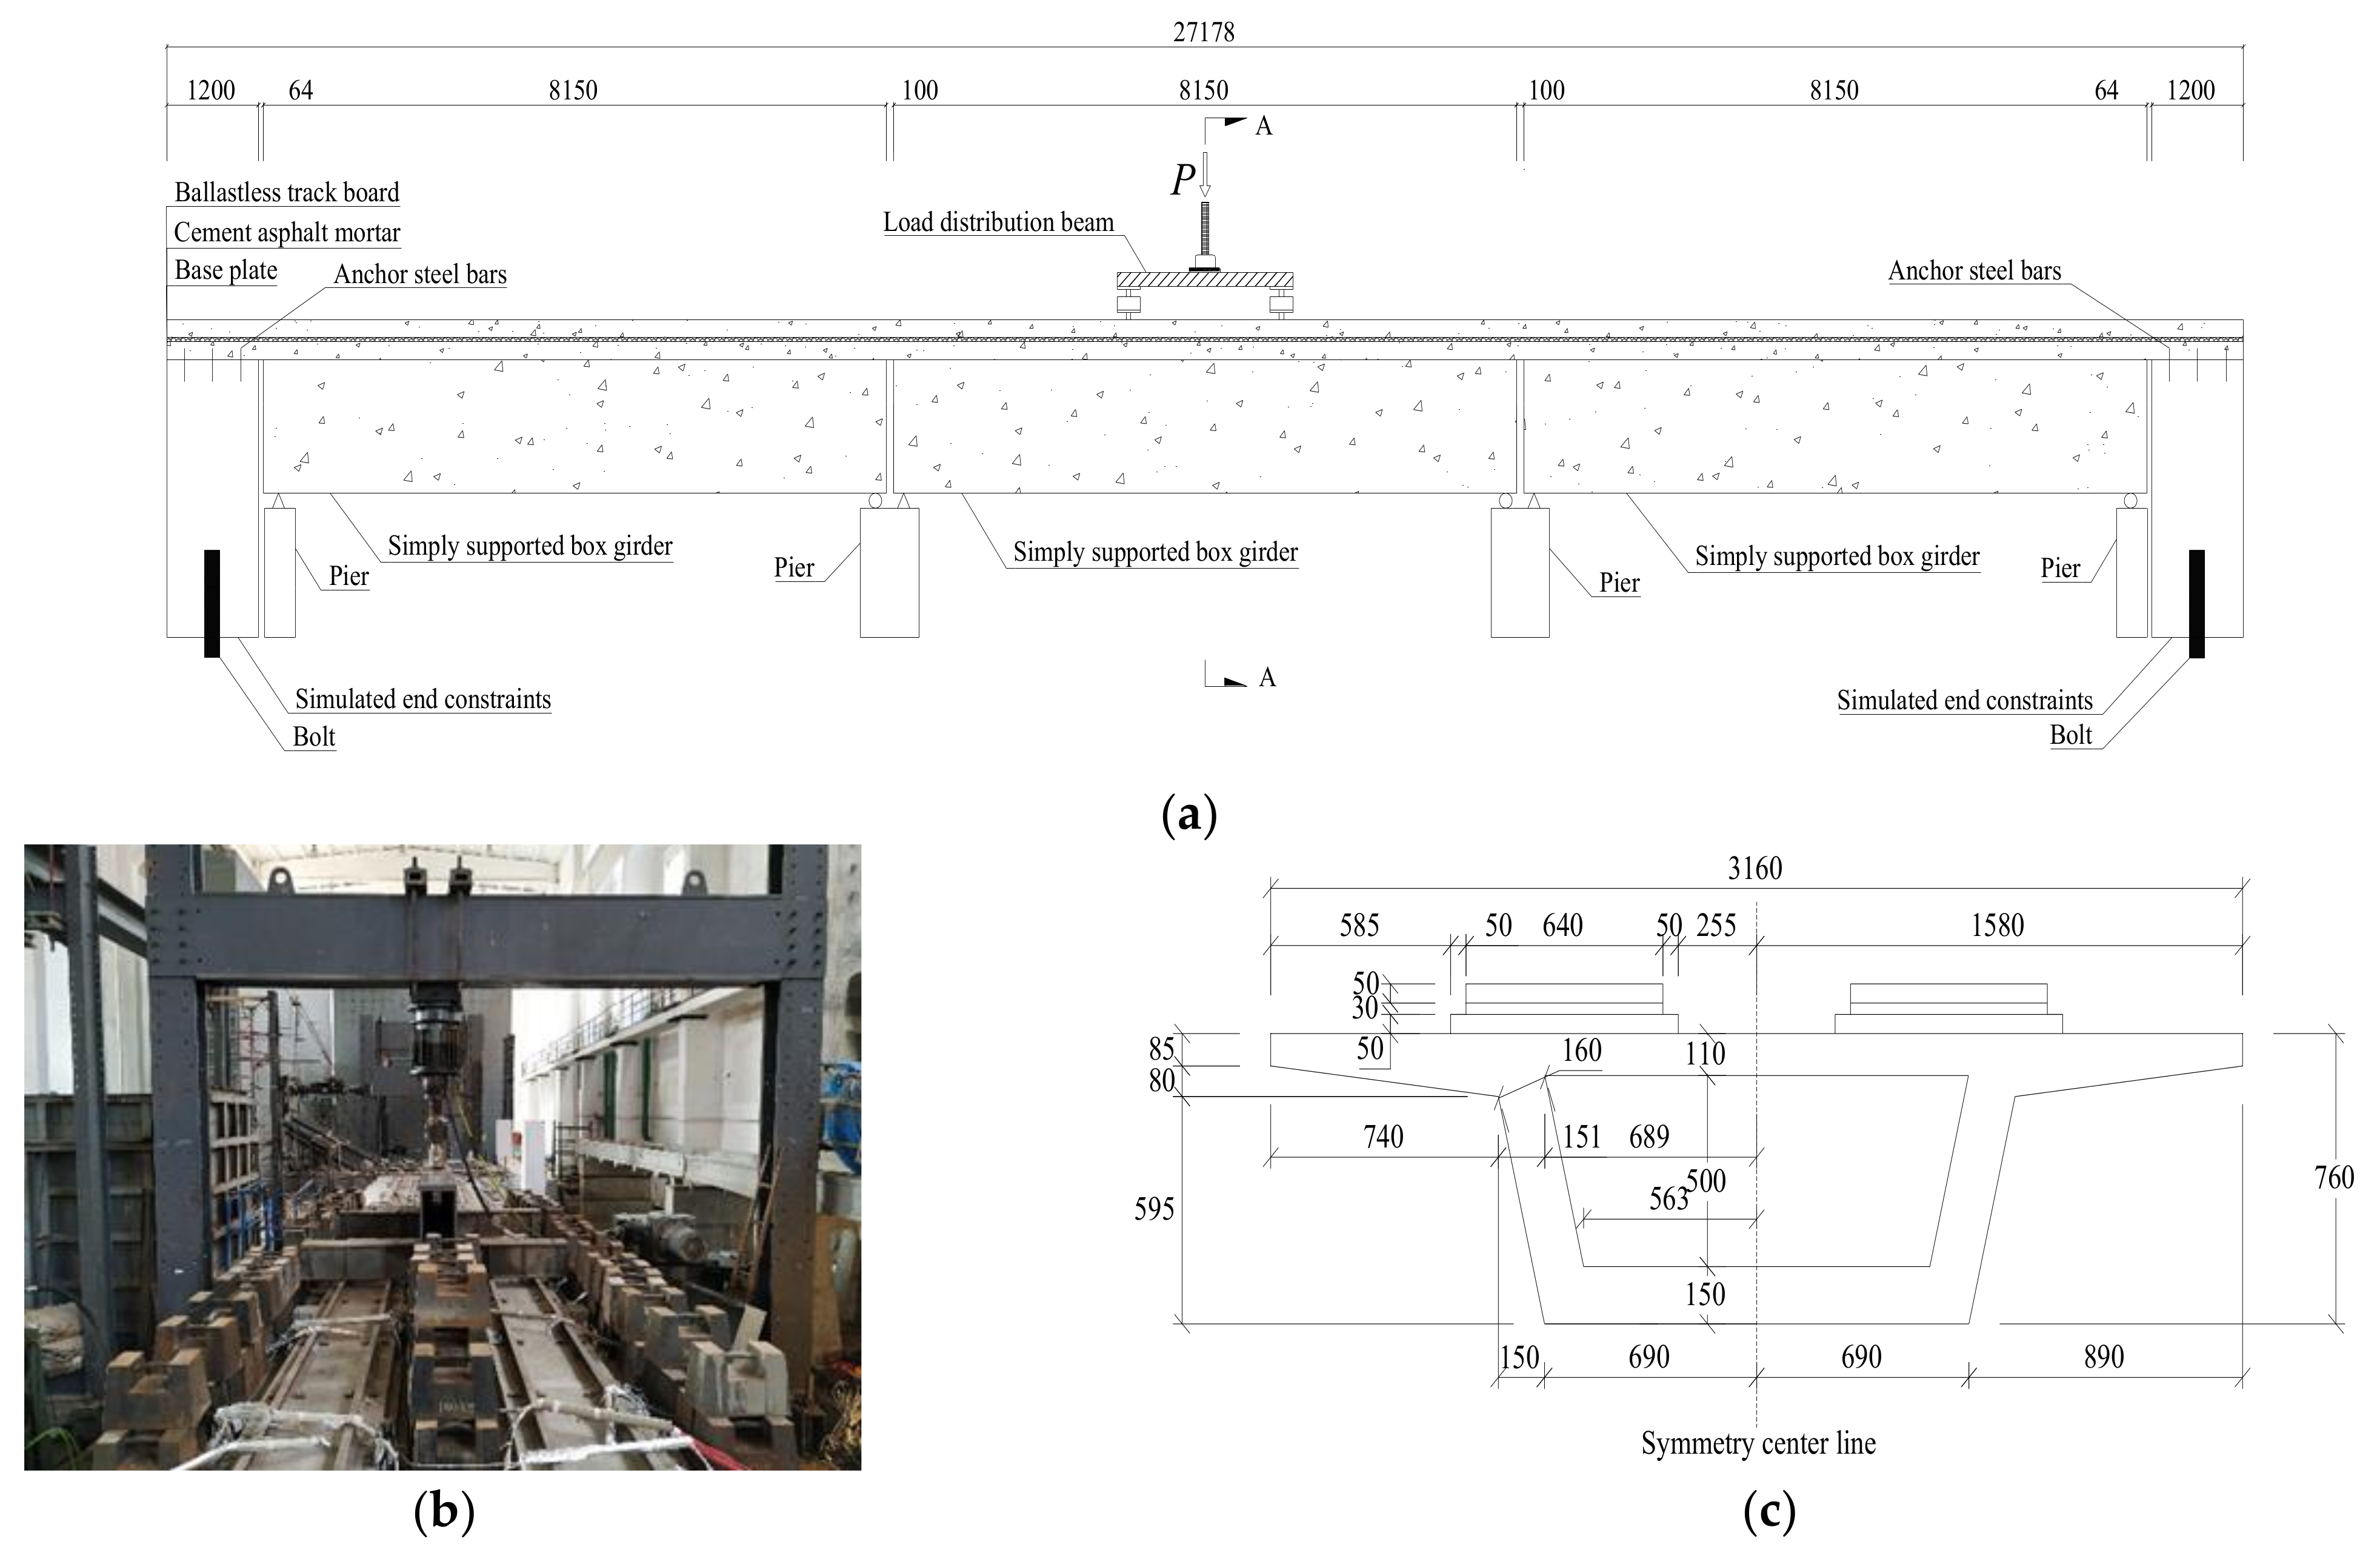
2.1. Design and Construction of the Specimen

The prototype beam is the Chinese standard 32 m pre-stressed concrete simple-supported box girder. The CRTS II slab ballastless track system was selected for the rail system. The ballastless track system from top to bottom is mainly composed of the following structures: 60 kg/m steel rail, elastic fasteners, a 200 mm thick prefabricated track slab, a 30 mm thick cement emulsified asphalt mortar filling layer, a 190 mm thick (straight line section) continuous base plate, a sliding layer, lateral stoppers and other parts. There are T-shaped wide and narrow joints between adjacent track slabs, and concrete is poured at the wide and narrow joints. There are 6 fine-rolled threaded steel bars in the track slabs. The track slabs are connected by tension locks set at the wide and narrow joints. Therefore, the track slabs and the track bed on the bridge are all longitudinally continuous structures.
The similarity principle was used to design the test specimen. The similarities between the test specimen and the prototype beam are as follows: (1) the similarity constants of structural size is 1:4, which satisfies the geometric similarity condition; (2) the top and bottom concrete stresses of the box beam are equal under self-weight, pre-stress and the train load, and the similar constant of stress is 1; (3) the concrete, emulsified asphalt mortar, steel and other materials are all consistent, and the similar constants of material line expansion coefficient and elastic modulus is 1; and (4) the specimen is a three-span continuous structure, and the constraint condition is consistent with that of the prototype.
Based on the above design criteria, a 1:4 scale model was used for the test according to the similarity principle, test accuracy requirements and the possibility of experimental conditions. The beam length is 8150 mm, the beam height is 760 mm, and the beam top width is 3160 mm. The thickness of the web of the main beam is 160 mm, the thickness of the top plate is 110 mm, and the thickness of the bottom plate is 150 mm. According to the design results of the overall structure, the reinforcement ratio of the model beam and the prototype beam are approximately equal. HRB400-grade steel is used for the steel rebar; the diameter of the longitudinal rebar is 12 mm, and the diameter of the transverse rebar is 8 mm. The prestressing tendons were arranged in the same curve as in the prototype beam. The specimen was equipped with 7 1 × 7 ΦS 15.2 bonded steel strands, pre-stressed by the post-tensioning method. Solid concrete blocks were poured at both ends of the beam. The bottom of the concrete block was connected to the ground with anchor rods, and the upper part was set with anchoring steel bars to connect to the track bed. Figure 1a–c shows, respectively, the schematic diagram of the three-span, simple-supported girder bridge, the experimental site picture, and the box girder cross-sectional dimensions.

2.2. Layout of Data Acquisition Points on Steel Rebars

In this test, HBM-quantumx mx1615b strain acquisition (HBM force sensor is a product produced by German HBM Sensor Company; it is a strain-type weighing sensor, which can measure dynamic and static strain) and an analysis system with a strain accuracy test sensitivity of 10−8 were used to collect the strain data of the steel bar. The middle beam of the three-span, pre-stressed, simple-supported box girder was tested. The resistance strain gauge was arranged on the surface of the steel rebar in five sections, including the middle of the span, quarter points and beam ends. The section numbers from the sliding end to the fixed end are 1, 2, 3, 4 and 5, respectively. The numbers of the longitudinal steel rebar are X1, X2, X3, X4 and X5. Figure 2 shows the specific locations of the measuring points.

2.3. Loading Scheme and Testing Device

In China, the standard length of a single carriage of the existing HARMONY and FUXING high-speed trains is L = 25 m, and the normal running speed of the trains is v = 250–350 km/h. Therefore, a frequency range of 2.78~3.89 Hz was calculated. According to the calculation results, the fatigue test loading frequency was selected as 3 Hz, which is within the range of the calculated frequency.
The lower limit fatigue load Pmin is the counterweight provided by the fatigue testing machine when the test beam still does not meet the load required by the equivalent stress under the action of the dead load and counterweight, calculated according to the principle of “equal stresses at the upper and lower edges of the middle span” based on the similarity ratio. The calculated lower limit fatigue load is 300 kN.

2.4. Train Load

The live load in the Chinese High-Speed Railway Design Code [20], and an equivalent load of 1ΔP (fatigue load amplitude) for the action of a single train is 120 kN, thus, the equivalent fatigue loading amplitude of a train acting on this specimen is 120 kN. Since 1ΔP was only approximately 10% of the calculated ultimate load of the test specimen, the loading amplitude was too small to obtain the obvious stiffness degradation laws of the structural system. To accelerate the stiffness degradation of the structural system and obtain its fatigue performance, the fatigue load was gradually increased by a multistage variable amplitude method. According to the results of the literature survey [15,21,22,23], the maximum fatigue load was usually 60%~70% (about 900 kN in this paper) of the calculated ultimate load of specimen. Therefore, the maximum fatigue load was set as 900 kN. According to the order of the test, the load amplitude was applied from the lowest to the highest, and four load amplitude stages were set from stage 1 to stage 4 as 1ΔP, 2ΔP, 3ΔP and 5ΔP, respectively. Figure 3a shows the fatigue loading scheme, and the specific parameters are listed in Table 1.
This multistage variable amplitude fatigue test was carried out continuously. During the fatigue test, the dynamic strain amplitude of the rebars were measured at a certain interval of the loading cycles, and a static load test was carried out to obtain the load–strain curve of the rebars. The static loading test and the fatigue test were loaded using the same testing machine, and the static loading scheme is illustrated in Figure 3b.

3. The Result of the Experiment

3.1. Rebar Strain Amplitude under Dynamic Load

Currently, the studies of the fatigue performance of pre-stressed concrete beams show that the strain amplitude of the longitudinal steel rebar has a significant influence on the fatigue life of the beams [10]. Fatigue failure of reinforced concrete beams generally starts from fatigue fracture of the steel rebar at the bottom of the beam. Under the fatigue load, fatigue cracks continuously accumulate and expand in the rebar, which results in an increase in the strain amplitude [9,15]. Therefore, the strain amplitude of the rebar under a fatigue dynamic load is measured by experiment.
Before 12 million fatigue cycles, dynamic strain data of the structural system are collected every 50,000 loading cycles; after 12 million fatigue loading cycles, dynamic strain data of the structural system are collected every 100,000 cycles. The dynamic strain amplitude curve is obtained by taking the difference between the maximum and minimum values of each dynamic strain. The evolution of the strain amplitude, according to fatigue loading cycles at L/2 and L/4 sections of X3 rebar, is shown in Figure 4.
It can be seen from Figure 4 that when the lower limit fatigue load remains unchanged and the upper limit load increases, the strain amplitude of the steel rebar increases proportionally; there is no obvious increasing trend in the steel rebar strain amplitude in loading stage 1, stage 2 and stage 3. When the upper fatigue load is increased to the limit of stage 4, the strain amplitude shows an obvious, increasing trend. The strain amplitude at L/2 section increases by 3.5%, while that at L/4 section increases by 2.1%. During the entire fatigue loading process, the maximum strain amplitude of the steel rebar is 153 με, and the corresponding stress value of 30.6 Mpa is less than 1/10 of the yield strength, thus, it is very small and shows the high-cycle fatigue of the steel rebars in the high-speed rail pre-stressed simple-supported box girder.
In order to obtain the specific increase ratio of the strain amplitude, the strain amplitude Δ ε N at the end of the fatigue test is divided by the initial strain amplitude Δ ε 0 ; the specific values obtained are shown in Table 2. The results show that in stage 1, where the loading amplitude is the smallest, the strain amplitude decreases; the maximum reduction rate is 2.96%. Many scholars have studied the fatigue performance of reinforced concrete structures and found that the structures only appear in the damage stage (repeated loading leads to the degradation of the mechanical properties of the structure.) [24,25,26], but this experiment shows that the steel rebars present no usual fatigue damage in stage 1. There is a sort of “optimization” phenomenon. In the following stages 2, 3 and 4, the maximum growth rates of the strain amplitude are 6.43%, 8.61%, and 15.40%, respectively. In the entire fatigue loading process, although stage 4 has the fewest loading cycles, the strain amplitude growth rate is the largest in this stage. It can be seen that the larger the upper fatigue load limit, the faster the strain amplitude growth and the faster the fatigue damage rate.
In order to analyze the cumulative increase in the strain amplitude of the steel rebar under the action of multi-stage fatigue load, the strain amplitude ratio of each stage of the fatigue test was accumulated, and the cumulative value of the strain amplitude ratio DN is calculated according to the following formula:
D N = ε N i ε 0 i · D i 1
where ε N i is the strain amplitude under the N-th cycle of i-th stage, ε 0 i is the initial strain amplitude of the i-th stage,   D i 1 is the final cumulative value of the strain amplitude ratio at (i − 1)-th stage, D0 = 1.
The cumulative evolution curve of strain amplitude ratio is obtained throughout the experiment, as shown in Figure 5. The cumulative strain–amplitude ratio of the steel rebar in stage 1 decreases first and then increases. The cumulative strain–amplitude ratio at the L/2 section and L/4 section reaches the minimum value at the 3 millionth fatigue loading cycle, with a decrease of 2.86% and 3.44%, respectively.
The cumulative strain–amplitude ratio gradually increases in stages 2, 3 and 4, and finally reaches the maximum value at the end of the test, with an increase of 5.46% and 5.32%, respectively at L/2 and L/4 sections. The cumulative strain amplitude ratio of the midspan section is slightly larger than that of the L/4 section during the whole experiment. The growth rate of the cumulative strain amplitude is similar in all the sections. It decreases rapidly in the early stage, increases slowly in the middle stages and increases rapidly in the late stage.

3.2. Rebar Strain Analysis under Static Load

During the fatigue loading test of the ballastless track simple-supported box girder structural system, the mechanical properties of materials in the structural system evolve continuously.
In order to analyze the evolution of the mechanical properties of the steel rebar after the fatigue loading test, the fatigue press is stopped after a certain number of fatigue loading cycles in the experiment and the static loading test is carried out on the specimen. The variation curve of the rebar strain with the increase in the external load, hereinafter referred to as the load–strain curve of the steel rebar, is obtained as shown in Figure 6.
The load–strain curve of steel rebar in Figure 6 is dense, the slope change of the curve is relatively small, and the curve keeps an oblique linear shape. It can be seen that the strain of the steel rebars is basically linear with the load increase. Under the first loading stage (3 million loading cycles), the curve inclines in the direction of the strain reduction, while between the 3 and 5 millionth loading cycles, the curve inclines in the direction of the strain increase; the slope of the load–strain curve under the action of the second, third and fourth loading stages is relatively small, the curve is relatively concentrated, and is generally inclined in the direction of the strain increase.
From Figure 6, it can be seen that the load–strain curve almost maintains a diagonal straight line throughout the test. The slope of the load–strain curve represents the resistance of steel rebars to deformation in the ballastless track simple-supported box girder structural system, so the change in the slope can be used to characterize the fatigue behavior of the steel rebars.
Here, the slope KN of the load–strain curve obtained from each static load test is calculated by the least square method, and the normalized slope KN is expressed as follows:
K N = i = 1 m ε i ε ¯ P i P ¯ j = 1 m ε i ε ¯ 2
where i represents the i-th loading cycle; m represents the total number of static load stages; P i is the i-th external load; P ¯ is the average external load;   ε i is the i-th strain increment of steel rebar; ε ¯ is the average v strain increment of steel bar.
For the sake of simplicity, the normalized slope of the load–strain curve (Figure 7) is hereinafter referred to as the slope, and the slope of the curve.
It can be seen from Figure 7 that in stage 1, the slope of the reinforcement at L/2 and L/4 sections increases first and then decreases, and in stage 2, stage 3, and stage 4, the slope decreases gradually; the increasing rate of the slope is obviously greater than the decreasing rate, and the slope of the steel rebar changes from “fast” to “slow”. At the end of the 18 millionth loading cycle, the slope of the steel rebar is lower than the initial value, showing that there is a continuous degradation of the structure during the whole fatigue loading process [27,28,29].
In order to further analyze the specific increased proportion of the slope, the slope ratio KN/K0 under different fatigue times is obtained, as shown in Figure 8, and the specific increase proportion is listed in Table 3.
It can be seen from Figure 8 and Table 3 that the slope ratio at the L/2 and L/4 sections after 3 million loading cycles gradually increase to the maximum by 5.64% and 6.19%, respectively, and the slope ratio at the end of the test basically decreased by 5.15% and 4.81%, respectively. The change trend of the slope ratio of the rebar at L/2 and L/4 sections is similar. The slope ratio at L/4 section is slightly larger than that at the L/2 section.
According to the experimental results analysis, it can be seen that under 3 million fatigue loading cycles, the strain amplitude of the steel rebar decreases gradually and the slope of the load–strain curve of the steel rebar under a static load increases gradually, which indicates enhancement of the steel rebar mechanical properties. This is the fatigue strengthening stage. In this paper, the reasons for fatigue strengthening of the steel rebar are analyzed based on the whole structural system and the single steel rebar.
The strain amplitude of the steel rebar under the first stage fatigue loading stage is 26.08 με, corresponding to a stress amplitude of 5.22 MPa, which is relatively low. According to the strain compatibility, the stress level of concrete is also very low. The ballastless track–bridge structural system is a composite structural system composed of various materials in which concrete has the largest specific gravity. The concrete structure is a discrete structure with micro-cracks and voids in the concrete before fatigue loading. Under the action of lower stress fatigue loading, the original micro-cracks and voids in the concrete in the structural system are compressed and closed by repeated micro-disturbances. The internal structure of material shows a tendency of “optimization”, so the mechanical properties of the steel rebar are enhanced.
On the one hand, the reason why low stress fatigue can improve the fatigue resistance of the steel rebar material itself is due to the unique fatigue strengthening phenomenon of the metal material itself. Zhu [30] explained the mechanism of the fatigue hardening of metals from the microscopic structure and shows that a certain degree of pre-strain can positively affect the strengthening of lattices in metals. The reason is that pre-strain can restructure the lattices, making them more uniform in arrangement and volume; this is the key to fatigue hardening. On the other hand, the overall slip and interfacial dislocation of the lattice structure under pre-strain contribute to the consumption of incompatible strain energy. Gustavsson [31] showed that the fatigue strength and fatigue life of steel plate and 20Mncr5 alloy structural steel with better toughness are improved by suitable low-amplitude fatigue loading; Gan [32] studied the fatigue damage of steel members under two-stage variable amplitude loading and showed that the load interaction had an enhanced effect on their fatigue life.
The first low-stress amplitude fatigue loading stage in this test can be assimilated to apply pre-strain to the steel rebar, and the rebars can be ideally considered to be in the elasto-plastic loading stage below the fatigue limit, which will not cause serious internal cracks and defects in the steel bars. At the same time, the development can appropriately restructure the steel lattice, the lattice arrangement is more uniform, and the volume is more uniform, so the internal strength of the steel is increased and the mechanical properties of the steel are improved.

4. Finite Element Analysis Based on Material Fatigue Damage Model

There are few experimental and theoretical studies on the performance strengthening of reinforced concrete materials, and it is currently difficult to simulate the fatigue strengthening process of the steel bars in the ballastless track simple box girder through the numerical analysis method. Therefore, only the fatigue damage stage (3–18 million loading cycles) will be analyzed. Based on the fatigue damage constitutive model of the material, a three-span ballastless track simple-supported box girder finite element model is established with the finite element software ANSYS to simulate the reduction process of the slope of the load–strain curve of the steel bar under the action of the static load.

4.1. Constitutive Model of Material

4.1.1. Constitutive Model of Steel Rebar

With reference to the “Specification for Design of Concrete Structures” [33], the static constitutive model of steel bars adopts the elastic, perfectly plastic model:
σ s = E s ε s                                                     ε s ε y f y , r + k ε s ε y           ε y < ε s ε u         0                                                             ε s > ε u
k = f s t , r f y , r ε u ε u y
where E s , σ s ,   f y , r   , f s t , r are Young’s modulus, the stress yield strength, and the ultimate strength of the steel rebar, respectively; ε y is the yield strain of the steel rebar corresponding to f y , r ; ε u is the peak strain of the steel bar corresponding to f s t , r ; and k is the slope of the hardened section of the steel rebar.
Under normal conditions, it is considered that the elastic modulus of the steel bar is almost unchanged under a fatigue load, so the fatigue constitutive model of the steel rebar is the same as the static constitutive model, and the fatigue damage of the steel rebar is reflected by changing the remaining area of the steel rebar. For fatigue damage under variable amplitude fatigue, the hypothesis of “deformation uniqueness” can be used. Sinha [34] first proposed the hypothesis of the “uniqueness of deformation” and applied it to concrete materials. It is believed that no matter what the previous repeated load history is, as long as the residual deformation is the same, when the same repeated load is applied again, the load–deformation relationship will remain unchanged, regardless of the previous load–deformation history. This is the so-called multi-stage cumulative damage criterion in this paper.
Kachanov uses the fatigue characterization model of tensile steel continuity to describe the gradual materials degradation [35], which refers to the ratio of the effective bearing area in the damaged state to the bearing area in the undamaged state. In the bending fatigue test, the fatigue failure process of longitudinal steel rebars is a process of fatigue crack accumulation and propagation, and ultimately, transient fractures occur because the residual effective area of the section cannot bear the load. Therefore, using the residual area of damage as the characterization parameter of the fatigue damage of longitudinally stressed steel bars can well reflect the whole process from fatigue damage accumulation to fracture.
It is assumed that the fatigue fracture of steel bars occurs after Nf fatigue cycles under a constant amplitude fatigue load. Assuming that the initial area of reinforcement is As and the effective area after Nf loading cycles is Afs (Nf), the following formula should be met when fatigue fracture occurs in the rebar:
A s σ s , m a x = A s f N f f y  
where σ s , m a x is the maximum value of the initial stress of steel rebars.
According to the above formula, we can get the effective area of fatigue fracture:
A s f N f = A s σ s , m a x / f y
Then the area damage Δ A S , C r at the critical point of fatigue fracture is as follows:
Δ A S , C r = A s 1 σ s , m a x / f y
It is assumed that the damage accumulation of the effective area of steel bars under constant amplitude fatigue stress conforms to the linear development trend. According to the Miner linear cumulative damage criterion, the area of damage Δ A s C F N after N fatigue cycles can be expressed as follows:
Δ A S , C r = A s 1 σ s , m a x / f y
where N is the number of loading cycles, N f is fatigue life under constant amplitude fatigue load.
The effective area A s C F N after N fatigue loading cycles is as follows:
A s C F N = A s 1 N N f 1 σ s , m a x f y
As a damage characterization parameter of longitudinal steel rebars, the effective area can be used as a representative of the deformation parameter in the multi-stage cumulative damage criterion, i.e., when the fatigue load changes to the next constant–amplitude fatigue load, it is considered that the damage of the effective area at this time is only related to this level of constant–amplitude fatigue load, but not to the previous fatigue damage history. The residual effective area under the variable–amplitude fatigue stress A s V F N is as follows:
A s V F N = A s i = 1 m 1 N i N f , i 1 σ s , max , i f y
where σ s , max , i is the maximum fatigue stress at the level of the first fatigue loading stage, and N i and N f , i are the number of real-time fatigue loading cycles and the fatigue life at the i-th fatigue loading stage, respectively.
The residual area of damage is used as the damage characterization parameter of steel rebar under longitudinal stress:
D s V F N = A S A s V F N A S
D s V F N = 1 i = 1 m 1 N i N f , i 1 σ s , max , i f y
where D s V F N is the amount of damage of steel rebar under variable amplitude fatigue loading for N loading cycles.
The fatigue life of steel rebars is given as follows [36]:
lg N f = 9.75 1.51   lg σ  

4.1.2. Concrete Constitutive Model

In this paper, concrete damage plastic model is used for numerical simulation, while the fatigue damage of concrete is based on a uniaxial constitutive model under concrete static conditions. According to the constitutive relation recommended by the Chinese Design of Concrete Structures specifications [33], the static constitutive relation of concrete is determined as follows:
σ = 1 d t E 0 ε
σ = 1 d c E 0 ε
where σ and ε are the tensile (compressive) stress and the strain of concrete, respectively; E 0 is the initial elastic modulus of concrete; d t and d c , the damage evolution parameters of concrete materials under tension and compression, selected according to the specification.
Based on the above-mentioned uniaxial constitutive model of concrete, the time-varying and random nature of the concrete material damage after fatigue loading is comprehensively considered and the concrete static compressive stress–strain curve is recommended to be calculated according to the following formula:
σ N = 1 d C 1 D k E 0 ε N
where D k is the degradation coefficient of the elastic modulus when concrete is compressed.
D k = 1 S D 0 , N
where S is the stress level: the ratio of the maximum compressive stress to the compressive strength.
The fatigue damage variable of concrete under tension (compression) D ± N can be solved by the following formula:
D ± N = D 1 ± + D 0 , N ± · D N ± D 1 ±
where D 1 ± is the damage variable after the first fatigue loading cycle of concrete, D N ± is the damage variable at fatigue failure of concrete and D 0 , N ± is the normalized damage variable under fatigue tension (compression) of concrete under the N-th loading cycle. The values of the above variables are determined according to references [36,37].
The evolution of D 0 , N ± has a “three-stage” trend, characteristic of structural fatigue damage. Because the fatigue life of concrete beam is very large, the load cycle ratio ( N i N f , i ) of each stage is very small. It can be seen from the formula of D 0 , N ± that the increase in fatigue damage in the first 50,000 loading cycles is very large. If the multi-stage linear damage criterion is used, the fatigue damage increases sharply every time the load is changed, which is obviously inconsistent with the actual situation. Therefore, the accumulated damage criterion for multi-stage is revised in this paper. The starting point for calculating the fatigue damage value under the second, third and fourth stage loads is changed from 0 to the 50,000-th loading cycle. Based on this, the constitutive model of concrete compression fatigue under variable amplitude fatigue load is as follows:
σ n = i = 1 m 1 d C 1 D k , i E 0 ε N
The concrete compressive damage variable under variable amplitude fatigue load D c V F N is as follows:
D c V F N = 1 i = 1 m 1 D k , i
where D k , i is the damage variable of concrete under compression in the i-th stage.
After fatigue loading, it is recommended that the static tensile stress–strain curve of concrete be calculated according to the following formula:
σ N + = 1 d t 1 D N + D j , N + 1 D j , N + E 0 ε N +
Non-recoverable deformation damage variable D j , N + of tensioned concrete is taken as shown in reference [36].
Based on the modified multi-stage cumulative damage criterion, the tensile fatigue constitutive model of concrete under variable amplitude fatigue load is as follows:
σ N + = i = 1 m 1 d t 1 D N , i + D j , N , i + 1 D j , N , i + E 0 ε N +
The tensile damage variable of concrete under variable amplitude fatigue load D c V F + N is as follows:
D c V F + N = 1 i = 1 m 1 D N , i + D j , N , i + 1 D j , N , i +
The fatigue life of concrete is determined by the following formula [38]:
lg N f ± = 14.7 13.5 σ m a x ± σ m i n ± f c u ± σ m i n ±
where σ m a x ± and σ m i n ± are the corresponding stresses under the upper and lower load limits, respectively, and f c u ± represents the tensile and compressive strength values of concrete.

4.1.3. The Constitutive Model of Cement Asphalt Mortar

In this paper, the cement asphalt mortar static and fatigue viscoelastic-damage constitutive model is introduced in order to study the evolution of cement asphalt mortar fatigue damage [39].
The stress–strain curve of the CRTS-II cement asphalt mortar material in the compression process measured by uniaxial compression test is as follows:
σ = 1.761 × 10 7 ε 6.069 ε 0.135
In order to simplify the calculation, the constitutive relationship of the static force and fatigue damage is taken as 1/10 of the compression. Therefore, the following only briefly describes the fatigue random damage constitutive model of CA mortar material under compression. The fatigue constitutive relationship of CRTSII cement asphalt mortar under constant amplitude fatigue load in compression is as follows:
σ = 1 D M , N E f 0 ε
The irreversible deformation elastic damage variable D M , N is determined by reference [39].
The fatigue elastic modulus at the N-th fatigue loading cycle is as follows:
E f N = Δ ε 1 Δ ε N · E f 0
Δ ε 1 = ε m a x , 1 + ε r , 1 +
Δ ε N = ε m a x , N + ε r , N +
where ε m a x , 1 + is the total fatigue strain of the CA mortar under the first loading cycle, ε r , 1 + is the residual strain at the first loading cycle, ε m a x , N + is the total fatigue strain at the N-th load (at the time of fatigue failure), and ε r , N + is the residual strain at the N-th load. The above variables are determined according to reference [39].
According to the revised multi-stage linear cumulative damage criterion, the fatigue constitutive relationship of CA mortar under variable amplitude fatigue is deduced as follows:
σ = i = 1 m Δ ε 1 Δ ε N , i · E f 0 ε
The damage variable D C A V F N of CA mortar under variable amplitude fatigue load is as follows:
D C A V F = 1 i = 1 m Δ ε 1 Δ ε N , i
The fatigue life of CA mortar is calculated by the following formula [40]:
Lg N f = 10.08 8.05 S
where S is the stress level—the ratio of the maximum compressive (tensile) stress to the compressive (tensile) strength.

4.2. Establishment of Finite Element Mode

The beam, track bed, CA mortar and track slab are all simulated by Solid65 element. The steel rebars, stirrups and prestressing strands are simulated by link8. The CHN60 heavy rails are simulated by beam 189. The interface of each layer of the track structure is simulated by the interface cohesion model. The mechanical parameters of the interface between the track slab and the CA mortar refer to the values in [41]. Since the contact elements CONTA173 and TARGE170 are suitable for contact analysis of 3D structures, the aforementioned elements are used to simulate the sliding layer between the beam and the base plate. At the same time, the literature shows that the friction coefficient of the sliding layer is usually between 0.2 and 0.3, and this article takes 0.2. The bridge and the track bed are provided with shear grooves above the fixed ends. Since the connection of the shear grooves is close to rigidity, the linear spring Combin14 with a stiffness of 1.0 × 10⁸ N/mm is used in the simulation. The shear steel bar is simulated by the linear spring element Combin14 with a longitudinal stiffness of 3 × 10⁵ N/mm and a vertical tensile and compression stiffness of 2 × 10⁶ N/mm.
Based on the above constitutive models of different materials, as well as the geometric dimensions of different parts, interface relations and element selections, the finite element model of the CRTS II ballastless track–bridge is established in ANSYS, as shown in Figure 9.

4.3. Simplified Calculation Method of Fatigue Damage

Because the fatigue strengthening stage cannot be simulated, and in order to compare with the experimental data, the stiffness increase factor If in the steel bar at the 3 millionth loading cycle obtained from the experimental test is used to expand the strain increase under different fatigue loading cycles by (1 + If) times, so as to compare the finite element calculation results with the experimental results. The simplified calculation method of fatigue damage adopts the equivalent static method, which is essentially an applicable method to transform the dynamic fatigue process into a separate static calculation process. According to the static constitutive model of the above materials, the stress level of each layer of the structure system during fatigue loading at each level is calculated, and the fatigue life Nf of each structural layer is determined according to the S-N curve. Then the different fatigue loading cycles ratio N/Nf are calculated respectively, and the material constitutive relationship through the above-mentioned material fatigue damage model is updated. Finally, the strain increments of the steel rebars in the ballastless track simple-supported box girder under different static loads within the fatigue test are calculated.
Table 4 presents the fatigue life of the different layers of the ballastless track–bridge structural system under various fatigue loads.
Combining the fatigue life of the material and the fatigue constitutive model, the damage of the different materials, as the number of fatigue loading increases, is obtained and is plotted in the following Figure 10. Due to the different stress levels of structural layers, the fatigue damage of the materials varies greatly. It can be seen from Figure 9 that the damage of CA mortar increases the fastest, reaching 37.21% at the end of the test. The damage of the steel rebar, support beam, track slab and track bed are relatively closed (between 11% and 18% at the end of the test).

4.4. Model Verification

In this paper, the experimental data and finite element results before fatigue loading were selected to verify the rationality of the finite element model. As shown in Figure 11, the experimental curves and simulation curves of monitoring points in L/2 and L/4 sections are in good agreement with the finite element result; the maximum error is less than 5%. Therefore, the model simulated well the changes in the fatigue mechanical properties of the steel rebars.

4.5. Analysis and Discussion of Finite Element Results

The load–strain curve change curve of the steel rebar under different fatigue loading cycles are obtained through the finite element model, as shown in Figure 12a,b. Observing the load–strain curve obtained by the finite element method, it can be seen that the curves are oblique straight lines and are relatively concentrated.
The slope of the load–strain curve through the finite element model under different fatigue loading cycles is obtained by the least square method, and then multiplied by the slope increasing factor at the 3 millionth loading cycle to obtain the slope change curve, as shown in Figure 12c,d. Finally, the slope value ratio curve of the steel bars, calculated by the finite element model, is obtained as shown in Figure 12e,f. The change trend of the slope and slope ratio of the steel bars calculated by the finite element model is basically consistent with our experimental results, and the values are relatively close.
It can be seen from Figure 12 that the finite element results are in good agreement with the experimental results, and the Pearson correlation coefficients of the L/2 section and L/4 section in Figure 12c,d are 0.986 and 0.982, respectively. Based on the above results, it can be determined that the calculation method proposed in this paper can accurately simulate the evolution process of the mechanical properties of the steel rebars in the ballastless track–bridge structural system under a train load.

5. Conclusions

In this paper, an 18 million cycle multistage fatigue loading test was carried out on the CRTS-II ballastless track–bridge structural system, and the fatigue properties of the steel rebar were experimentally studied. Finally, the fatigue damage process of the steel rebars was simulated by the finite element method, and the following conclusions can be drawn:
  • The strain amplitude of the steel rebar changes proportionally to the fatigue load amplitude, and there is no obvious increase in the strain amplitude under loading stages 1, 2 and 3. Loading stage 4 has the fewest loading cycles, but the highest growth rate (15.40%), which indicates that the greater the fatigue load amplitude, the faster the evolution of the fatigue performance of the steel rebar. During the whole test, the cumulative strain amplitude ratio first decreased and then increased. At the end of the test, the cumulative strain amplitude ratio at L/2 and L/4 sections increased by 5.46% and 5.32%, respectively.
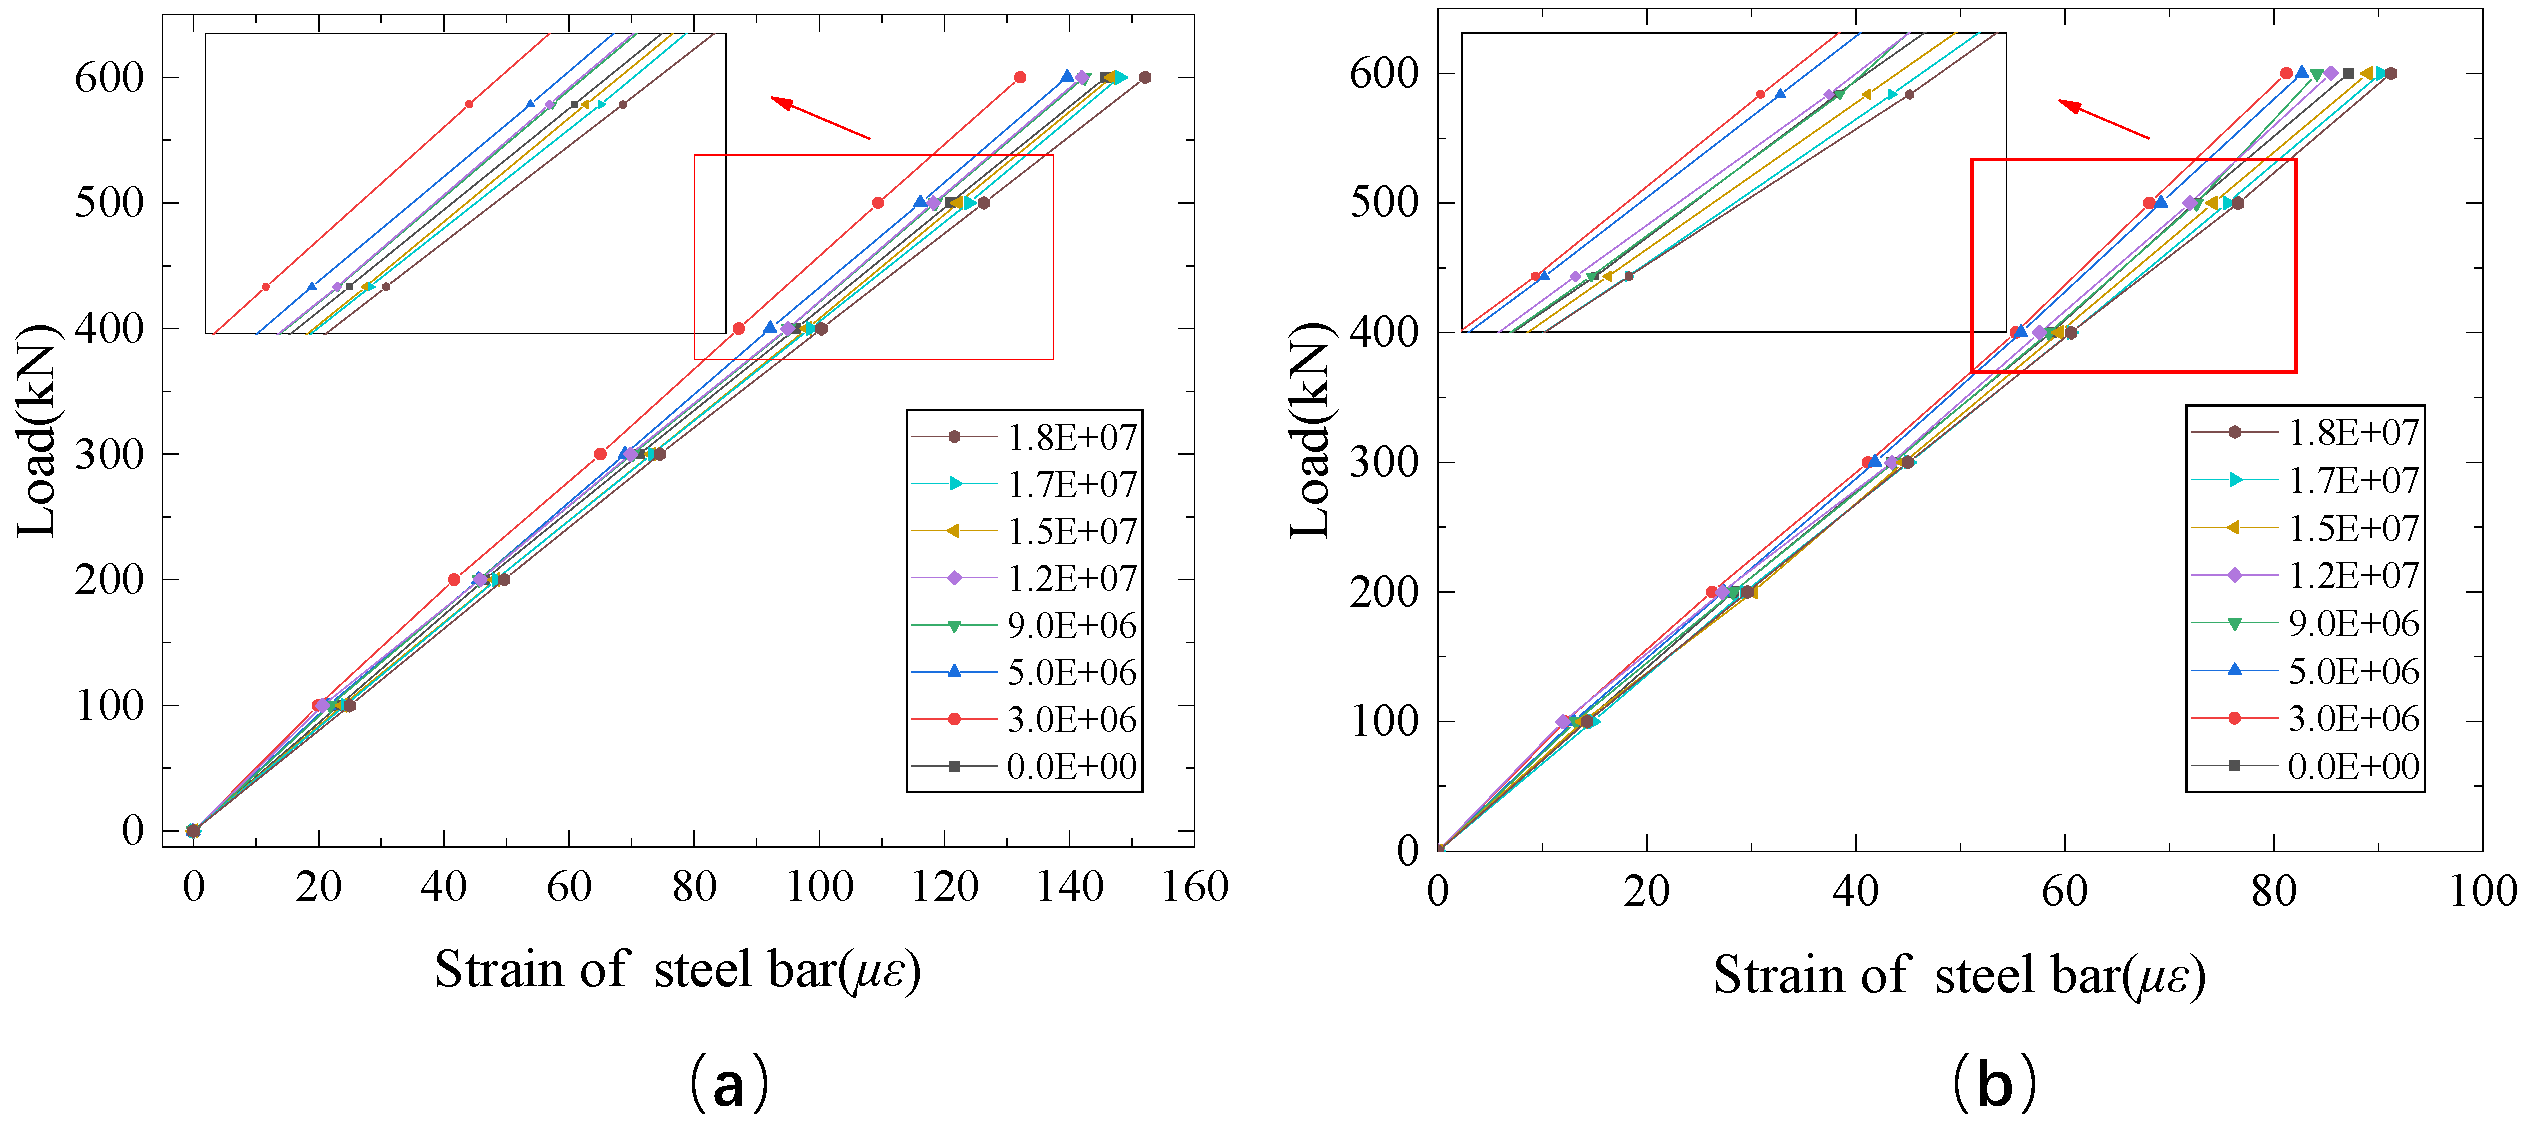
  • The load–strain curve of the steel rebars basically maintains the shape of an oblique linear line. Under the first loading stage, the steel rebar load–strain curve “inclines” in the direction of the decreasing strain, while under stages 2, 3 and 4, the curve “inclines” in the direction of the increasing strain. The slope of the load–strain curve is obtained by the least square method and it is found that the slope first increases and then decreases. At the end of the test, the slopes at L/2 and L/4 sections are decreased by 5.15% and 4.81%, respectively.
  • Rebars have a fatigue strengthening stage under the first loading stage. The strain amplitude of the rebars gradually decreases from the first to the 3 millionth loading cycle, and the strain amplitudes at L/2 and L/4 sections are reduced by 3.45% and 4.40%, respectively. The slope of the steel rebar load–strain curve gradually increases from the first to the 3 millionth loading cycle, and the slopes at L/2 and L/4 sections are increased by 5.64% and 6.28%, respectively.
  • Under the action of the last 15 million loading cycles, steel rebars are in the stage of fatigue damage, and the slopes at L/2 and L/4 sections are reduced by 10.22% and 10.36%, respectively. Based on the fatigue constitutive model of steel bar, concrete and CA mortar, and the multi-stage cumulative damage criterion, the slope change of the fatigue damage stage of the steel rebar is calculated by the finite element method. The numerical simulation results are in good agreement with the experimental data. It is verified that the calculation method proposed in this paper can accurately simulate the evolution process of the mechanical properties of the steel rebars in the ballastless track–bridge structural system.
  • This paper only studies the fatigue mechanical properties of the steel bars in the beam, which is a preliminary exploration of the fatigue performance of the ballastless track–bridge structure system under a train load. In the following research, we will further analyze the mechanical fatigue properties of the bridge structure, track structure and ballastless track–bridge structure system and make further reports.

Author Contributions

Conceptualization, L.Z. (Lingyu Zhou), L.Z. (Lifan Zou), L.Z. (Lei Zhao), Y.Y., A.D.M. and Y.G.; methodology, L.Z. (Lingyu Zhou), L.Z. (Lifan Zou), L.Z. (Lei Zhao), Y.Y., A.D.M., and Y.G.; software, L.Z. (Lingyu Zhou), L.Z. (Lifan Zou), L.Z. (Lei Zhao), Y.Y., A.D.M. and Y.G.; validation, L.Z. (Lingyu Zhou), L.Z. (Lifan Zou), L.Z. (Lei Zhao), Y.Y., A.D.M. and Y.G.; formal analysis, L.Z. (Lingyu Zhou), L.Z. (Lifan Zou), L.Z. (Lei Zhao), Y.Y., A.D.M., and Y.G.; investigation, L.Z. (Lingyu Zhou), L.Z. (Lifan Zou), L.Z. (Lei Zhao), Y.Y., A.D.M. and Y.G.; resources, L.Z. (Lingyu Zhou), L.Z. (Lifan Zou), L.Z. (Lei Zhao), Y.Y., A.D.M. and Y.G.; data curation, L.Z. (Lingyu Zhou), L.Z. (Lifan Zou), L.Z. (Lei Zhao) and A.D.M.; writing—original draft preparation, L.Z. (Lingyu Zhou), L.Z. (Lifan Zou), L.Z. (Lei Zhao), Y.Y., A.D.M. and Y.G.; writing—review and editing, L.Z. (Lingyu Zhou), L.Z. (Lifan Zou), L.Z. (Lei Zhao), Y.Y., A.D.M., and Y.G.; visualization, L.Z. (Lingyu Zhou), L.Z. (Lifan Zou), L.Z. (Lei Zhao), Y.Y., A.D.M. and Y.G.; supervision, L.Z. (Lingyu Zhou) and Y.G.; project administration, L.Z. (Lingyu Zhou) and Y.G.; funding acquisition, L.Z. (Lingyu Zhou) and Y.G. All authors have read and agreed to the published version of the manuscript.

Funding

This research was supported by the National Natural Science Foundation of China, grant numbers U1934217, 51578546; the Fundamental Research Funds for the Central Universities of Central South University, China, grant numbers 2020zzts157; the Graduate Education Innovation Project and Professional Ability Improvement Project of Hunan Province, China, grant number CX20200368.

Acknowledgments

Special thanks go to the reviewers for their valuable suggestions. The authors also would like to thank their colleagues at Central South University for research design, etc.

Conflicts of Interest

The authors declare no conflict of interest.

References

  1. Liu, M.Y.; Shen, L.Z. Impact of high-speed railway network on inter-city connections and its heterogeneity: Taking Nanjing City as the center of network. Prog. Geogr. 2021, 40, 647–659. (In Chinese) [Google Scholar] [CrossRef]
  2. Zhou, L.Y.; Zou, L.F.; Zhao, L.; Yuan, Y.H. Performance of prestressed reinforcement in fatigue test of simply supported box girder bridge on ballastless track of high-speed railway. J. Cent. South Univ. 2021, 52, 509–518. (In Chinese) [Google Scholar]
  3. Zhou, L.Y.; Wei, T.Y.; Zhang, G.C.; Zhang, Y.Y.; Akim Djibril Gildas, M. Experimental study of the influence of extremely repeated thermal loading on a ballastless slab track-bridge structure. Appl. Sci. 2020, 10, 461. [Google Scholar] [CrossRef] [Green Version]
  4. Zhao, G.T. Research and Application of General Construction Technologies for High-Speed Railway in China. J. China Railw. Soc. 2019, 41, 87–100. (In Chinese) [Google Scholar]
  5. Zhou, L.Y.; Yang, L.Q.; Shan, Z.; Peng, X.S.; Mahunon, A.D. Investigation of the Fatigue Behaviour of a Ballastless Slab Track–Bridge Structural System under Train Load. Appl. Sci. 2019, 9, 3627. [Google Scholar] [CrossRef] [Green Version]
  6. Pu, Q.H.; Wang, H.Y.; Gou, H.Y.; Bao, Y.; Yan, M. Fatigue Behavior of Prestressed Concrete Beam for Straddle-Type Monorail Tracks. Appl. Sci. 2018, 8, 1136. [Google Scholar] [CrossRef] [Green Version]
  7. Tong, L.W.; Xiao, S.; He, L.; Zhang, Y.F.; Zhao, X.L. Fatigue behavior of steel reinforced concrete (SRC) beams with different shear span-to-depth ratios. Eng. Struct. 2018, 166, 339–353. [Google Scholar] [CrossRef]
  8. Tran, N.L. Shear model mSM-c for slender reinforced concrete members without shear reinforcement subjected to fatigue loads. Eng. Struct. 2021, 233, 1–20. [Google Scholar] [CrossRef]
  9. Zou, R.; Liu, F.; Xiong, Z.; He, S.H.; Li, L.J.; Wei, W. Experimental study on fatigue bond behaviour between basalt fibre-reinforced polymer bars and recycled aggregate concrete. Constr. Build. Mater. 2021, 270, 1–18. [Google Scholar] [CrossRef]
  10. Yuan, M.; Yan, D.H.; Zhong, H.; Liu, Y.H. Experimental investigation of high-cycle fatigue behavior for prestressedconcrete box-girders. Constr. Build. Mater. 2017, 157, 424–437. [Google Scholar] [CrossRef]
  11. Han, J.G.; Song, Y.P.; Wang, L.C.; Song, S.D. Residual strain analysis of non-prestressed reinforcement in PPC beams under fatigue loading. Mater. Struct. 2015, 48, 1785–1802. [Google Scholar] [CrossRef]
  12. Prashanth, M.H.; Singh, P.; Chandra Kishen, J.M. Role of longitudinal reinforcement on the behavior of under reinforced concrete beams subjected to fatigue loading. Int. J. Fatigue 2019, 125, 271–290. [Google Scholar] [CrossRef]
  13. Li, L.J.; Hou, B.; Lu, Z.Y.; Liu, F. Fatigue behaviour of sea sand concrete beams reinforced with basalt fibre-reinforced polymer bars. Constr. Build. Mater. 2018, 179, 160–171. [Google Scholar] [CrossRef]
  14. Lu, Z.H.; Ma, Y.F.; Yu, Z.W.; Song, L. The adaptability study on the operation of heavy-Haul trains on existing railway bridges. J. Railw. Sci. Eng. 2016, 13, 1–9. (In Chinese) [Google Scholar]
  15. Yu, Z.W.; Li, J.Z.; Song, L. Experimental study on fatigue behaviors of heavy-haul railway bridges. China Civ. Eng. J. 2012, 45, 115–126. (In Chinese) [Google Scholar]
  16. Du, Y.X.; Wei, J.; Yuan, J.; Lai, Y.F.; Sun, D.H. Experimental research on fatigue behavior of prestressed concrete beams under constant-amplitude and variable-amplitude fatigue loading. Constr. Build. Mater. 2020, 259, 1–25. [Google Scholar] [CrossRef]
  17. Zhao, C.; Dou, Y.M.; Sun, J.S.; Li, Y.F. Study of heavy load traffic effect on fatigue performance of pre-stressed concrete beams. Build. Struct. 2017, 47, 1–5. (In Chinese) [Google Scholar]
  18. Zhou, L.Y.; Zhao, L.; Mahunon, A.D.; Zhang, Y.Y.; Li, H.Y.; Zou, L.F.; Yuan, Y.H. Experimental study on stiffness degradation of Crts II ballastless track-bridge structural system under fatigue train load. Constr. Build. Mater. 2021, 283, 1–14. [Google Scholar] [CrossRef]
  19. Yu, Z.W.; Zhou, L.Y.; Zhao, L. Research on Time-Dependent Behavior of High-Speed Railway Ballastless Track-Bridge Structural System: Cooperative Performance Test of High-Speed Railway Ballastless Track-Bridge Structural System; Central South University: Changsha, China, 2018. (In Chinese) [Google Scholar]
  20. TB10621-2014. Design Code for High Speed Railway; China Railway Publishing House: Beijing, China, 2014; pp. 60–64. [Google Scholar]
  21. Zhang, J.Q.; Li, P.F.; Mao, Y.; Dong, Z.H. The Mechanical Properties of Reinforced Concrete Plate-Girders when Placed Under Repeated Simulated Vehicle Loads. Materials 2019, 12, 1831. [Google Scholar] [CrossRef] [Green Version]
  22. Liu, F.P.; Zhou, J.T.; Yan, L. Study of stiffness and bearing capacity degradation of reinforced concrete beams under constant-amplitude fatigue. PLoS ONE 2018, 13, 1–20. [Google Scholar] [CrossRef] [Green Version]
  23. Hada, H.A.; Nanni, A. Fatigue Behavior of FRCM-Strengthened RC Beams. J. Compos. Constr. 2020, 24, 1–10. [Google Scholar]
  24. Wu, B.J.; Li, Z.X.; Tang, K.K.; Wang, K. Microscopic Multiple Fatigue Crack Simulation and Macroscopic Damage Evolution of Concrete Beam. Appl. Sci. 2019, 9, 4664. [Google Scholar] [CrossRef] [Green Version]
  25. Hassanin, A.I.; Fawzy, H.M.; Elsheikh, A.I. Fatigue loading characteristic for the composite steel-concrete beams. Frat. Integrita Strutt. 2021, 55, 110–118. [Google Scholar]
  26. Hillebrand, M.; Hegger, J. Fatigue Testing of Shear Reinforcement in Prestressed Concrete T-Beams of Bridges. Appl. Sci. 2020, 10, 5560. [Google Scholar] [CrossRef]
  27. Liang, J.S.; Nie, X.; Masud, M.; Li, J.; Mo, Y.L. A study on the simulation method for fatigue damage behavior of reinforced concrete structures. Eng. Struct. 2017, 150, 25–38. [Google Scholar] [CrossRef]
  28. Xu, J.J.; Zhu, P.; Ma, J.; Qu, W.J. Fatigue flexural analysis of concrete beams reinforced with hybrid GFRP and steel bar. Eng. Struct. 2019, 199, 1–16. [Google Scholar] [CrossRef]
  29. Tong, L.W.; Liu, B.; Zhao, X.L. Numerical study of fatigue behaviour of steel reinforced concrete (SRC) beams. Eng. Fract. Mech. 2017, 178, 477–496. [Google Scholar] [CrossRef]
  30. Zhu, Z.Y.; Zhu, Y.L.; Dai, G.Z.; Wang, Q.Y. Microstructural evolution of strain rate related tensile elastic prestrain on the high-cycle fatigue in medium-carbon steel. Mater. Sci. Eng. A 2019, 764, 1–9. [Google Scholar] [CrossRef]
  31. Gustavsson, A.; Melander, A. Fatigue of a highly prestrained dual-phase sheet steel. Fatigue Fract. Eng. Mater. Struct. 1995, 18, 201–210. [Google Scholar] [CrossRef]
  32. Gan, J.; Zhao, K.; Wang, Z.; Wang, X.L.; Wu, W.G. Fatigue damage of designed T-type specimen under different proportion repeating Two-Step variable amplitude loads. Eng. Fract. Mech. 2019, 221, 1–13. [Google Scholar] [CrossRef]
  33. GB 50010-2010. Code for Design of Concrete Structures; China Architecture & Building Press: Beijing, China, 2015; pp. 19–21. [Google Scholar]
  34. Sinha, B.P.; Gerstle, K.H.; Tulin, L.G. Stress-strain relations for concrete under cyclic loading. ACI J. 1964, 61, 195–211. [Google Scholar]
  35. Kachanov, L.M. Time of the rupture process under creep condition. Izv. Akad. Nauk. SSSR Otd. Tek. 1958, 8, 26–31. [Google Scholar]
  36. Shan, Z. Stochastic Damage Model for Concrete and Its Application. Ph.D. Thesis, Central South University, College of Civil Engineering, Changsha, China, 2017; pp. 125–131. [Google Scholar]
  37. Yu, Z.W.; Shan, Z.; Ouyang, Z.Y.; Guo, F. A simple damage model for concrete considering irreverible mode-II microcracks. Fatigue Fract. Eng. Mater. Struct. 2016, 39, 1419–1432. [Google Scholar] [CrossRef]
  38. The Concrete Fatigue Task Forces. Research on Failure Reliability Checking Calculation Method of Reinforced Concrete Flexural Components; China Construction Industry Publishing House: Beijing, China, 1994; pp. 26–27. [Google Scholar]
  39. Yu, Z.W.; Shan, Z.; Li, X. Research on Time-Dependent Behavior of High-Speed Railway Ballastless T Rack-Bridge Structural System: Stochastic Viscoelastic—Damage Constitutive Model of Crts Ii Ca Mortar Layer; Central South University: Changsha, China, 2018. (In Chinese) [Google Scholar]
  40. Xu, Q.Y.; Lin, Q.T.; Feng, Z.Y.; Lou, P.; Yang, R.; Chen, W.; Zhang, Z. Theoretical study on fatigue stress spectrum of longitudinal connected slab track on bridge. J. Southwest Jiaotong Univ. 2018, 53, 906–912. [Google Scholar]
  41. Liu, X.Y.; Su, C.G.; Liu, D.; Xiang, F.; Gong, C.; Zhao, P.R. Research on the bond properties between slab and CA mortar layer and the parameters study of cohesive model. J. Railw. Eng. Soc. 2017, 3, 22–28. [Google Scholar]
Figure 1. Track–bridge specimen: (a) Elevation chart of three-span test girder bridge (unit: mm); (b) top view of the specimen; (c) section A: Cross section at mid span (unit: mm).
Applsci 11 04858 g001
Figure 2. Layout of rebar strain measuring points: (a) Strain measurement point map on rebar steel; (b) strain measurement point diagram of rebar profile.
Applsci 11 04858 g002
Figure 3. The loading scheme: (a) Fatigue dynamic test; (b) static load test.
Applsci 11 04858 g003
Figure 4. Strain amplitude curve of steel bar: (a) L/2 section; (b) L/4 section.
Applsci 11 04858 g004
Figure 5. The cumulative evolution of the strain amplitude ratio.
Applsci 11 04858 g005
Figure 6. Load–strain curve of ordinary steel bar (a) L/2 section; (b) L/4 section.
Applsci 11 04858 g006
Figure 7. Slope change curve (a) L/2 section; (b) L/4 section.
Applsci 11 04858 g007
Figure 8. Slope ratio curve.
Applsci 11 04858 g008
Figure 9. Finite element model of ballastless track–bridge structure: (a) Mesh of bridge–track cross-section; (b) longitudinal reinforcement and stirrups (one span); (c) sketch of finite element model of structural system.
Applsci 11 04858 g009
Figure 10. Damage curves of different materials.
Applsci 11 04858 g010
Figure 11. Comparison of finite element model and experimental results.
Applsci 11 04858 g011
Figure 12. Comparative analysis of finite element results and experimental results: (a) Load–strain curve of L/2 section; (b) Load–strain curve of L/4 section; (c) Slope change curve of L/2 section; (d) Slope change curve of L/4 section; (e) Slope ratio curve of L/2 section; (f) Slope ratio curve of L/4 section.
Applsci 11 04858 g012aApplsci 11 04858 g012b
Table 1. The loading parameters of the fatigue test.
ProgramPmin (kN)Pmax (kN)ΔP (kN)FrequencyFatigue Cycles
Stage 13004201203 Hz5.0 × 106
Stage 23005402403 Hz7.0 × 106
Stage 33006603603 Hz5.0 × 106
Stage 43009006003 Hz1.0 × 106
Table 2. The strain amplitude ratio ( Δ ε N / Δ ε 0 ).
SectionStage 1Stage 2
Initial RatioEnd RatioIncreasing Rate (%)Initial RatioEnd RatioIncreasing Rate (%)
L/21.000.98−2.102.092.145.32
L/41.000.97−2.962.102.166.43
SectionStage 3Stage 4
Initial RatioEnd RatioIncreasing Rate (%)Initial RatioEnd RatioIncreasing Rate (%)
L/23.193.267.015.545.7015.40
L/43.313.398.615.675.8214.85
Table 3. Slope evolution.
SectionInitial RatioStage 1Stage 2
Slope RatioDegradation Rate (%)Slope RatioDegradation Rate (%)
L/21.001.04−4.441.004.01
L/41.001.05−5.021.004.33
SectionStage 3Stage 4Total Degradation Rate (%)
Slope RatioDegradation Rate (%)Slope RatioDegradation Rate (%)
L/20.963.980.951.475.15
L/40.973.930.951.404.81
Table 4. Fatigue life of different materials.
Loading StageStage 1Stage 2Stage 3Stage 4
Structure
Steel rebar1.11 × 1091.50 × 1087.77 × 1073.36 × 107
Support beam4.04 × 10122.52 × 10114.40 × 10101.62 × 109
Track slab2.54 × 1097.33 × 1081.95 × 1081.21 × 107
Track bed1.13 × 10103.80 × 1094.42 × 1082.48 × 107
Cement asphalt mortar1.45 × 1092.11 × 1085.02 × 1078.71 × 106
Publisher’s Note: MDPI stays neutral with regard to jurisdictional claims in published maps and institutional affiliations.

