Article

More Than Just Concrete: Acoustically Efficient Porous Concrete with Different Aggregate Shape and Gradation

1
Department of Energy (DENERG), Corso Duca degli Abruzzi 24, Politecnico di Torino, 10129 Torino, Italy
2
CEMEX Innovation Holding AG—Brügg Branch, Römerstrasse 13, 2555 Brügg, Switzerland
3
CEMEX Innovation Holding AG, General-Guisan-Strasse 6, 6300 Zug, Switzerland
*
Author to whom correspondence should be addressed.
Appl. Sci. 2021, 11(11), 4835; https://doi.org/10.3390/app11114835
Submission received: 27 April 2021 / Revised: 18 May 2021 / Accepted: 21 May 2021 / Published: 25 May 2021
(This article belongs to the Special Issue Acoustic Properties of Absorbing Materials)

Abstract

:

Featured Application

The use of acoustically efficient porous concrete with weighted absorption coefficients (αw) in the range of 0.30 to 0.75 for noise control in outdoor and indoor applications.

Abstract

The interest in the use of resistant acoustic materials has put further attention on the use of porous concrete in the building industry. This work investigates the acoustic properties of four different mix designs of porous concrete obtained with two types of aggregates, that is, normal weight and lightweight aggregates. The assessment of the sound-absorbing performances has been conducted in the small-scale reverberation room (SSRR) at Politecnico di Torino (Italy), in agreement with the procedure indicated in the ISO 354 Standard. For each concrete type, three panel thicknesses, i.e., 20 mm, 40 mm, and 60 mm, were tested. Moreover, different mounting conditions were investigated, considering the combination of single panels in multiple layers, adding an air gap between the panel and the backing, and inserting a layer of rock wool in the air gap itself. The results show weighted absorption coefficients (αw) in the range of 0.30 to 0.75 depending on the thickness and mounting conditions. These encouraging values make these materials useful for efficient practical applications in indoor and outdoor environments.

Graphical Abstract

1. Introduction

The implementation of noise control strategies in outdoor environments is a challenging task for several professionals, and an increasing number of studies highlight the importance of the architectural design on urban noise mitigation in canyon streets [1,2] squares [3] and inner yards [4]. A detailed overview of the acoustic strategies used for the building envelope design in order to improve the urban acoustic environment is given in [5]. These studies have pointed out the need for sound-absorbing and -scattering materials suitable for outdoor environments. Moreover, several indoor spaces such as airports, train stations, schools, etc. are characterized by requirements similar to those of outdoor spaces regarding highly durable and resistant acoustic materials. Therefore, this work aims to investigate the sound absorbing properties of porous concrete of different mix designs, thicknesses and mounting conditions, as this material results suitable for outdoor and indoor applications. Compared to other porous sound absorbers, porous concrete has the capability to withstand the atmospheric elements, and therefore it is suitable for applications in outdoor and indoor environments when resistance, low deformability, and high durability are required.
Porous absorbers are the most widespread type of sound absorbers. According to their microstructure, porous absorbers can be further classified into granular, cellular, and fibrous [6,7]. The most fundamental properties of porous materials influencing their sound absorbing properties are flow resistivity and porosity and second, pore shape factor and tortuosity [7].
Conventional concrete is generally characterized by poor sound-absorbing properties, as the prevailing phenomena occurring are sound reflections. In general, normal concrete has an absorption coefficient value of 0.05–0.10 [8]. However, porous concrete has the capability to work as a porous sound-absorbing material as it is characterized by high porosity, i.e., open pore structure on its surface and an interconnected network of pores. It is also known as pervious, gap-graded, permeable, or enhanced porosity concrete [9] and is currently widely used in urban environments as paving material to support environmentally sustainable rainwater management [10]. It has been also exploited for its acoustic absorbing properties in traffic noise barriers and railway noise reduction [11,12,13]. Pervious concrete mainly consists of normal Portland cement, coarse aggregates (aggregate dimension greater than 5 mm), and water, which generate a void content that generally ranges from 15% to 35% [10,14,15,16]. Pervious concrete acoustic panels belong to the class of granular sound absorbers with pores created by the presence solid aggregates which are bonded together by a cementitious binder. The key factor to allow sound absorption to occur is the accurate definition of the quantity of binder to ensure that there is enough binder to keep the aggregate together without clogging the pore network and still allow for an appropriate resistance for its use and handling. Overall, the sound-absorbing properties of granular materials tend to be uneven in frequency and to be characterized by peaks [17].
Different strategies have been proposed with the intent to improve the sound absorbing properties, i.e., with the aim to enhance the rate and the evenness of the sound absorption provided by altering the microstructural properties of the pervious concrete. Note that these strategies applied to the mix design aim to vary the fundamental properties, i.e., flow resistivity, porosity, pore shape factor, and tortuosity, which control the absorbing performance. Indeed, the sound absorption properties of porous concrete are strictly related to the void ratio of the concrete. Therefore, it is important to adequately control the void ratio and aggregate type, which influence tortuosity and flow resistivity [18], pore size, and pore aperture size, which are used to control porosity [8]. A higher void ratio leads to higher and wider peak values in acoustic absorption coefficients, resulting in a shift of the peak of the coefficient towards the higher frequencies [12,19,20].
The effect on sound absorption of the aggregate size and different aggregate types by blending or combining them in multiple layers has been studied in [11,13,21,22]. Aggregate size can be used to control the pore dimensions, as the median pore size increases for increasing aggregate size [19,21]. With respect to aggregate size, it has been observed that most previous studies endorse the use of aggregate with dimensions in the range 1 to 10 mm [11,21,22], as smaller aggregates would clog the pores, thus reducing porosity, and bigger ones, despite increasing the pore volume, would reduce the tortuosity of the pore network. When considering the use of different aggregate types such as lightweight and normal-weight aggregates, the study in [22] suggests that lightweight aggregates can absorb cement paste from micropores on the surface of the aggregates. As a result, for an equal absolute volume ratio of aggregates, smaller size lightweight aggregates result in slightly higher sound absorbing performance, as they have a larger total surface area compared to bigger ones, and therefore the cement paste covering the aggregates can be better absorbed when smaller aggregates are used and result in higher void ratio values with respect to normal weight aggregates [22]. Other studies have investigated the use of different materials as aggregates, such as crumb rubber, cenospheres, and recycled aggregates [12,13,23,24,25]. The possibility of blending aggregates with different size in the concrete matrix has been studied in [19,21], highlighting that, as a general rule, aggregate size should be selected in order to ensure that smaller aggregates do not enter the pores created by the bigger ones. Porous concretes with blends of aggregates of different materials have been tested in [11], where expanded perlite aggregates were replaced by different percentages of slag, evidencing a nonlinear impact on the sound absorption performance of the panels. Concrete samples featuring aggregates of different dimensions or material have been combined into layers in [11,13,22], evidencing the coupling two layers of concrete with the external one featuring aggregates with lower bulk densities or bigger pores sizes compared to the back layer lead to increased sound absorbing performances.
Slight differences in sound absorption have been reported regarding the shape of the aggregates; for instance, this was shown in [22], i.e., which has compared round shape (lightweight) and irregular shape (normal weight) aggregates with similar gradation.
Moreover, as for all the acoustic porous materials, the thickness of the porous layer also results as important for the acoustic absorption coefficient spectra. The principal maximum peak of the absorption coefficient is displaced to lower frequencies when the thickness increases [13,18,21]. However, there is a threshold regarding the thickness of granular materials above which the absorption does not increase further [7]. Table A1 (Appendix A) briefly summarizes the details and the main findings of previous research investigating the effects of design factors on the sound absorption coefficient of porous concrete. The studies which analyzed different aggregate size, material and shape, and on panel thickness have been clustered evidencing if and the extent to which such variable was found to have an influence on the sound absorbing properties of the panels.
Recent reviews on the strategies that have been proposed to enhance the sound absorbing performances of concrete have been presented in [17,26]. However, these reviews highlight the fact that further research is required to provide larger datasets to refine and produce better estimation of the sound absorption of concrete materials.
Therefore, the following study aims to provide further experimental data on the investigation of some design guidelines for sound absorbing concrete emerging from the past research regarding the aggregate shape and size. The present study investigates, through a systematic research approach, the effects of concrete mix design (four different conditions), sample thickness (three different conditions), and mounting conditions (three different conditions) on the absorption properties of porous concrete tested in a small-scale reverberation room (SSRR). Therefore, the main aim of this study is to define the sample configuration that could lead to an increase of the sound absorption properties of concrete panels. More than 30 different combinations of the aforementioned variables have been considered. Note that besides providing a useful database of measured data in addition to previous research, this work presents novel configurations, that is, mounting conditions with an air gap and combination in multiple layers with other porous materials. To the authors’ knowledge, this has not been studied in previous literature.
This work aims to increase awareness on the porous concrete properties among several professionals such as architect, designers, acousticians, policy-makers, etc. that deal with noise control strategies in outdoor and indoor environments.

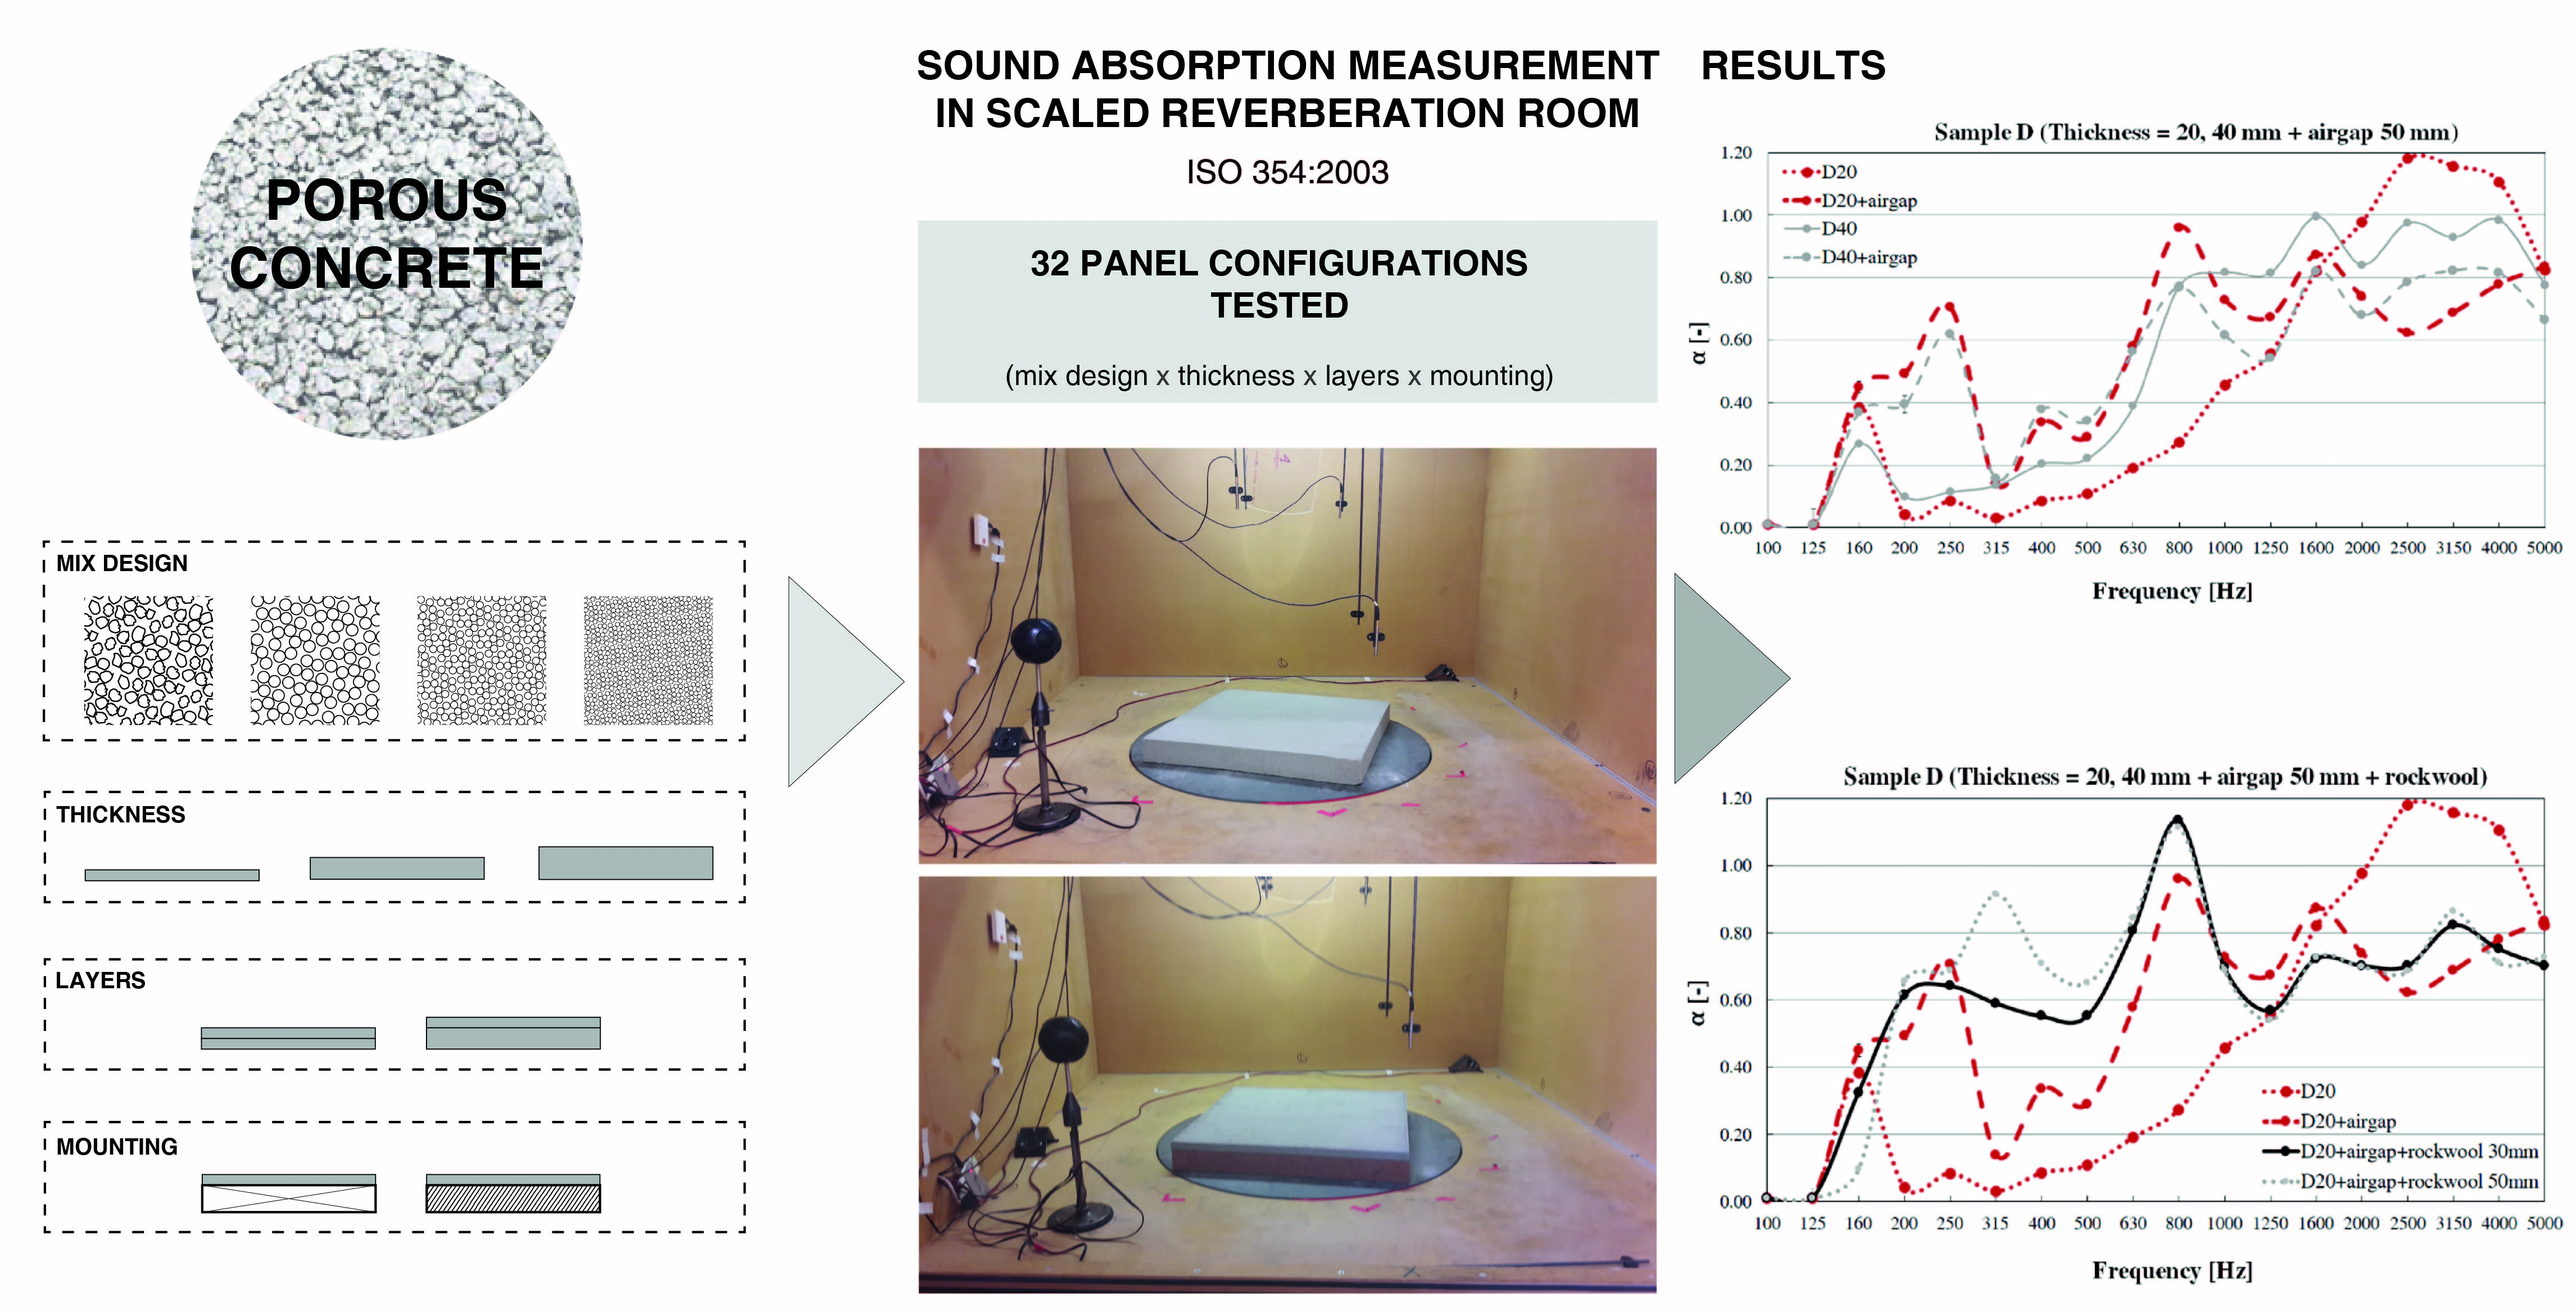
2. Materials and Methods

The research has been organized through the following steps:
(1)
Selection of different concrete mix design and preparation of samples for the measurements.
(2)
Selection of different mounting methods.
(3)
Measurement of the frequency-dependent sound absorption αs in the SSRR.
(4)
Computation of the weighted sound absorption coefficients as single index αw and comparisons.

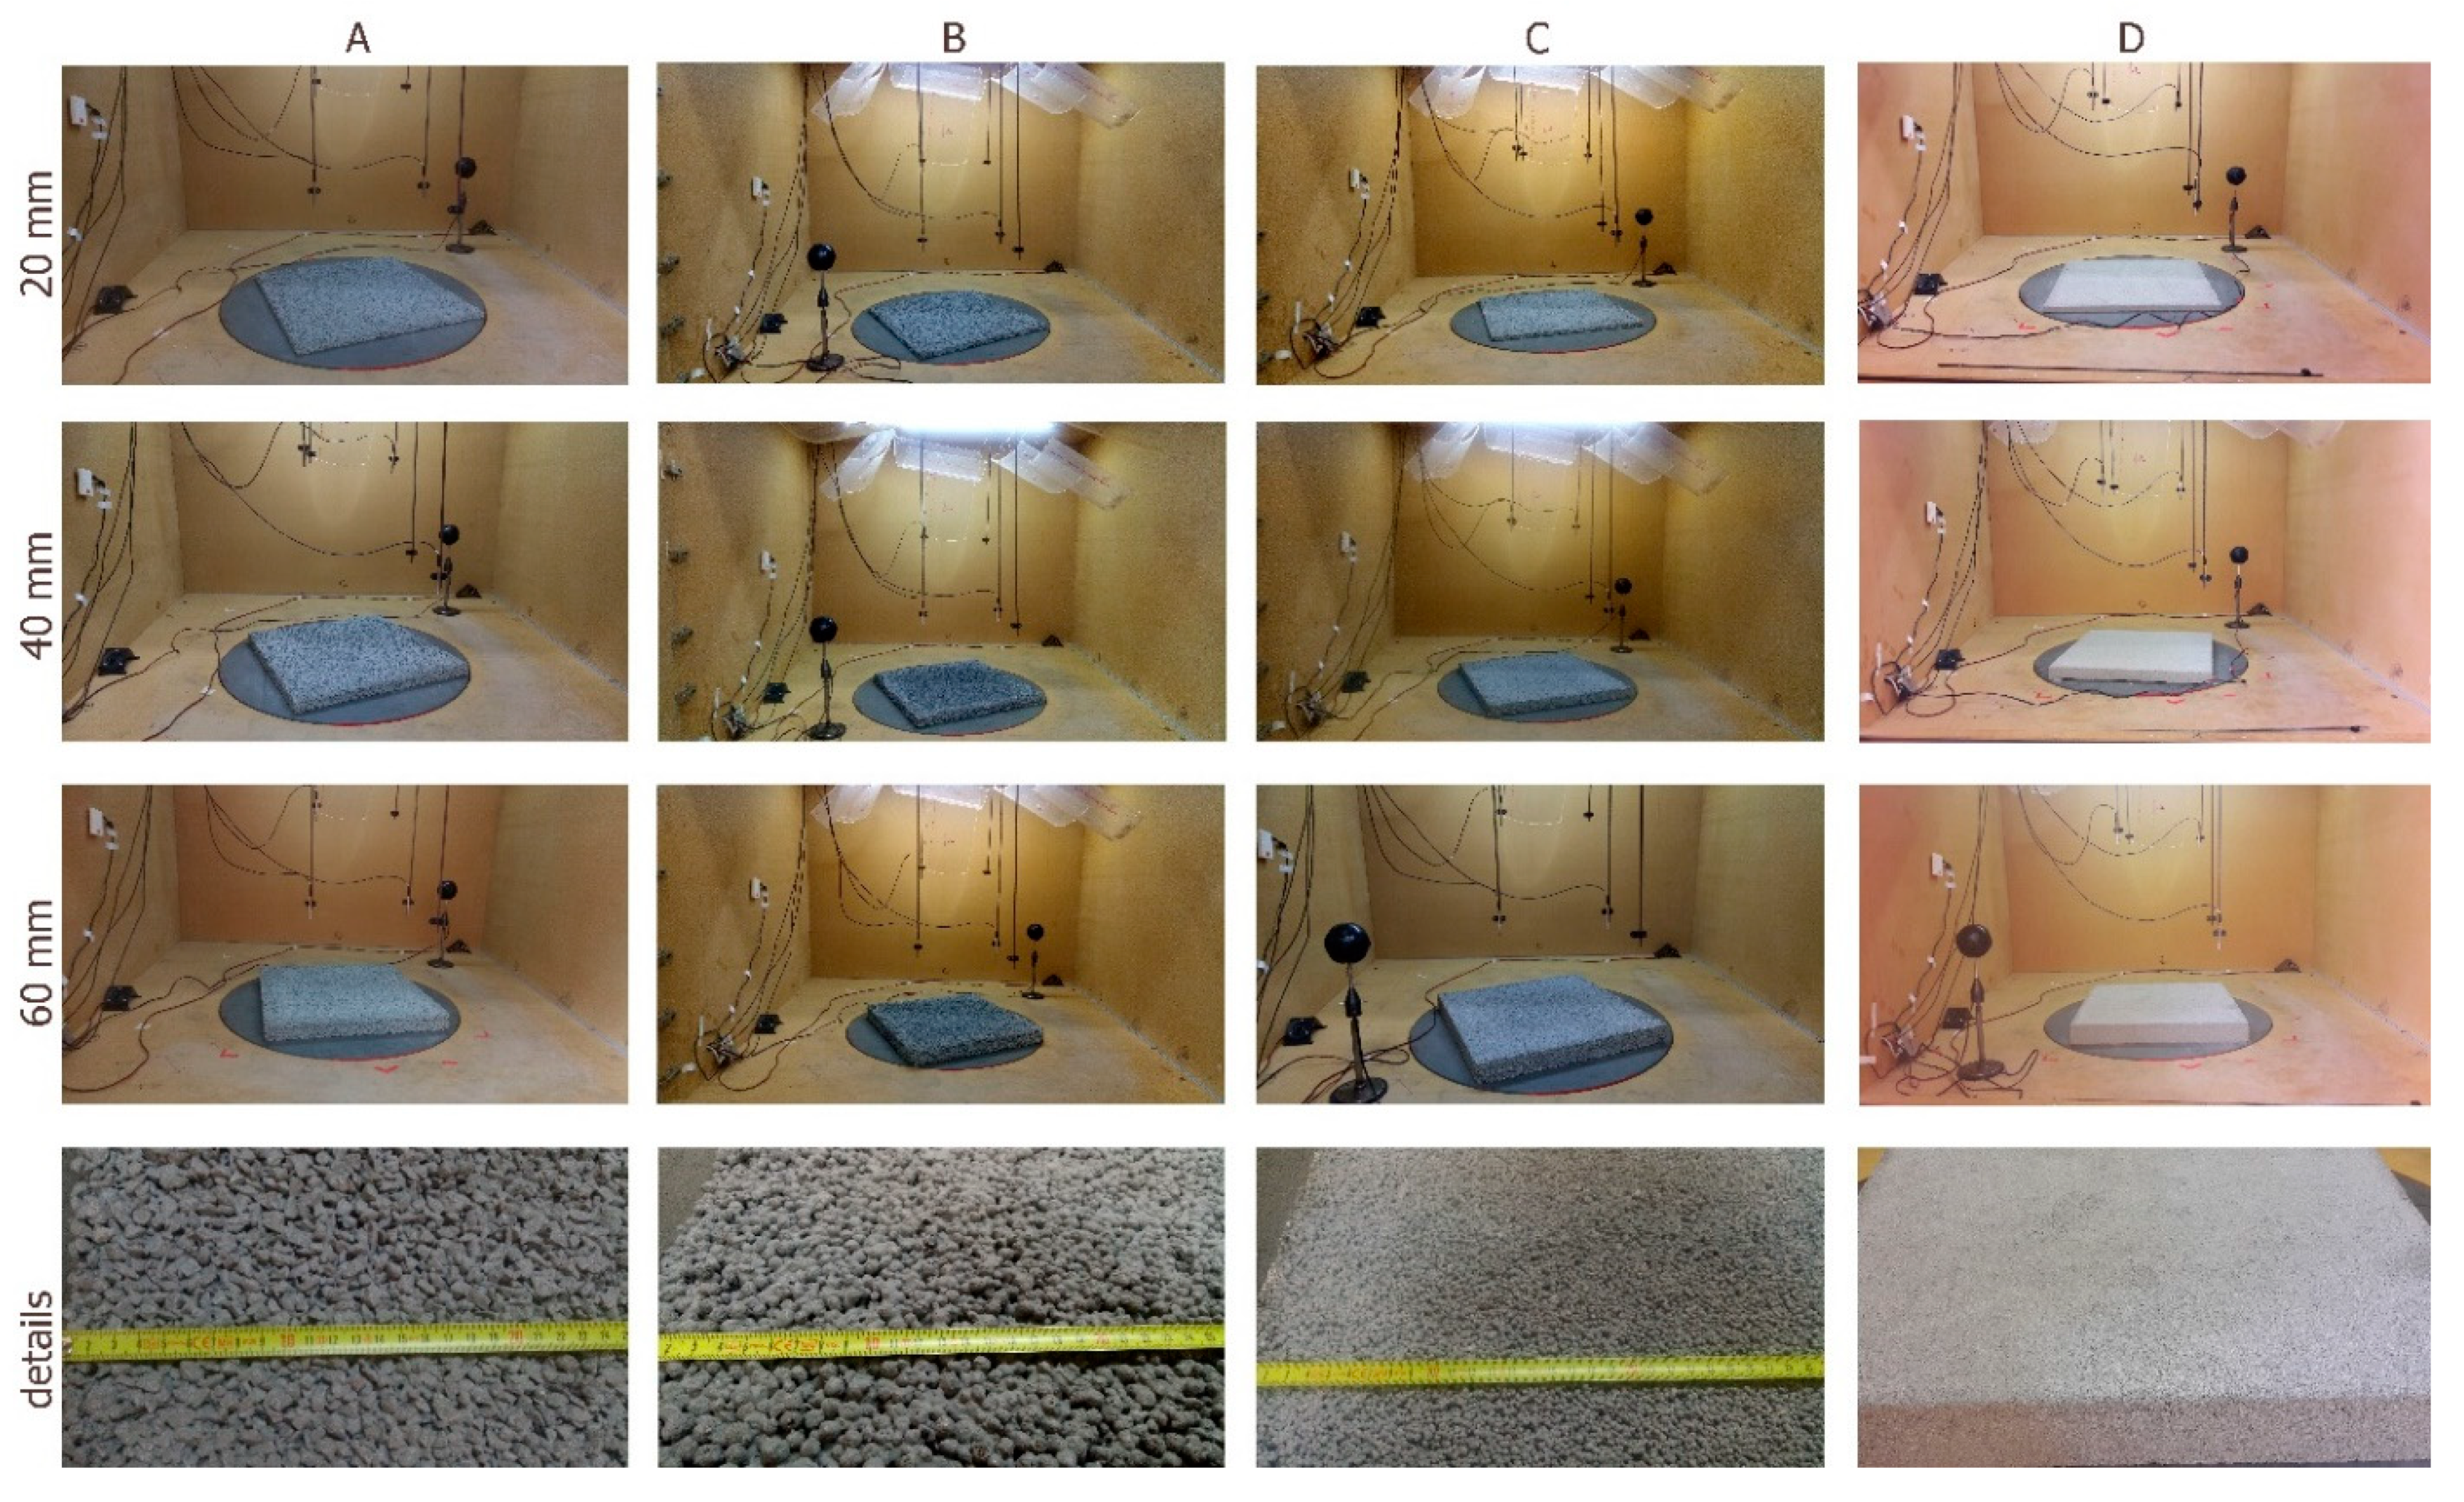
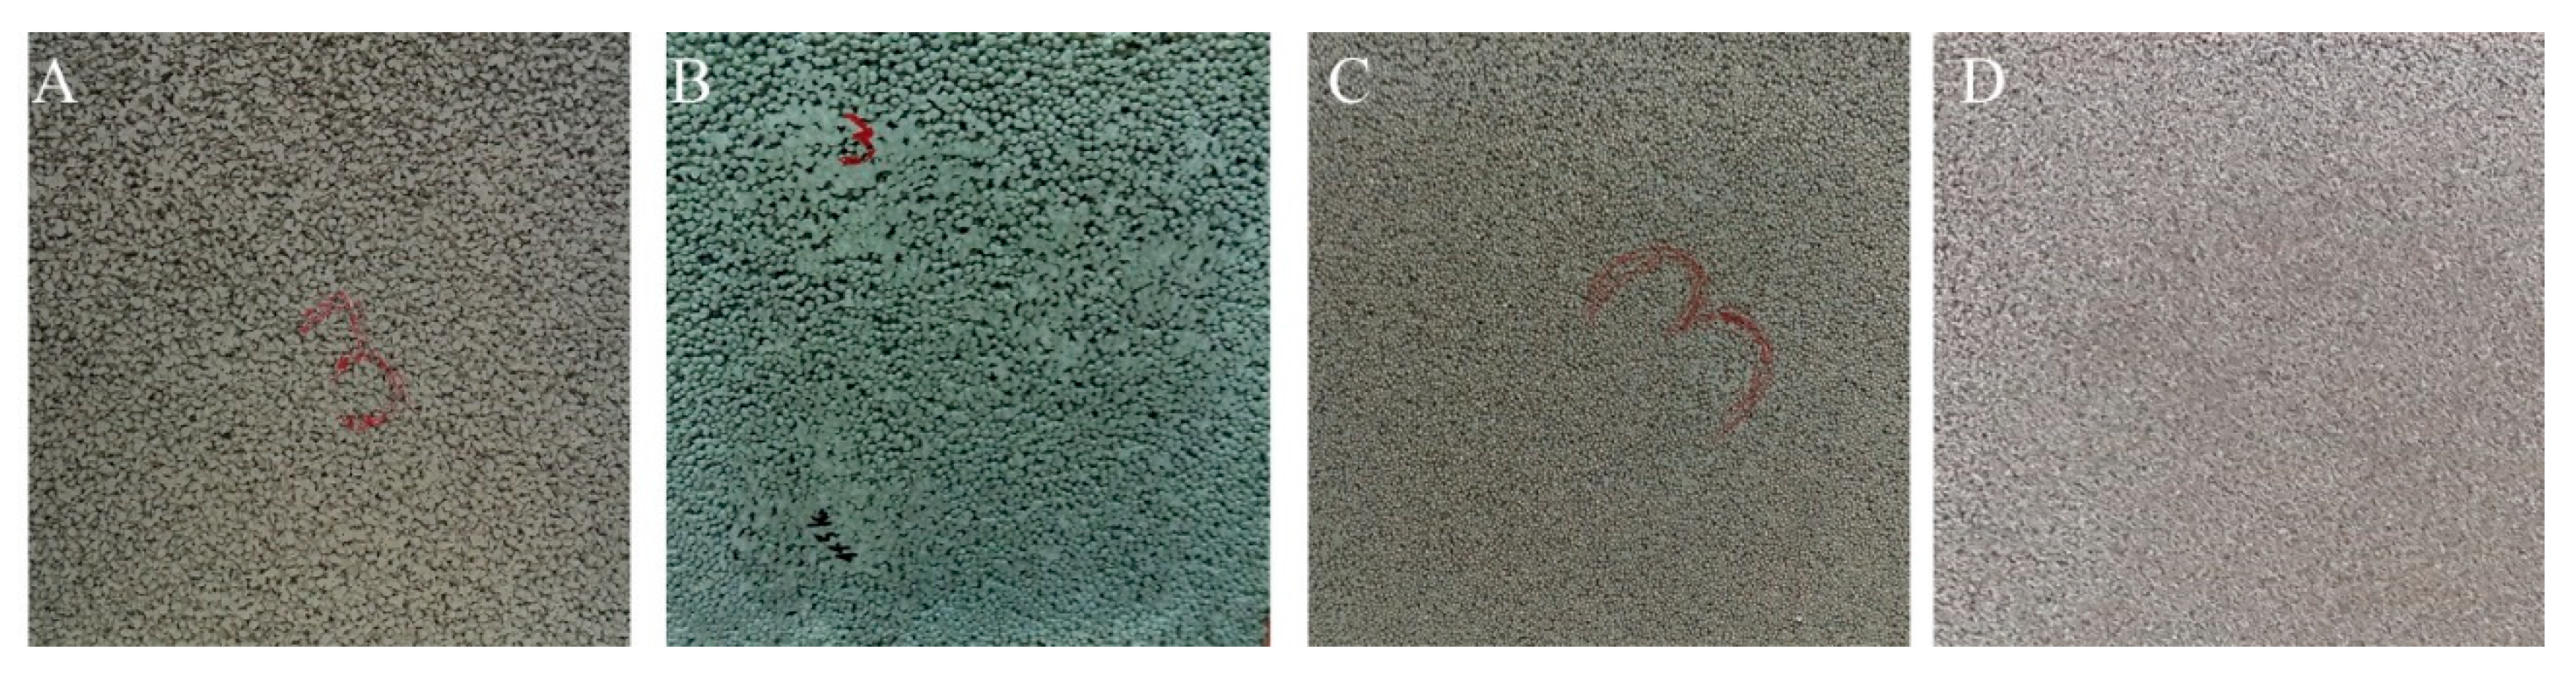
2.1. Tested Concretes

Information regarding the porous concrete types, identified with the letters A, B, C, and D, are summarized in Table 1. The following parameters are reported: aggregate size (according to EN 933-2:2020 [27]), aggregate particle density (according to EN 1097-6:2013 [28]), void ratio (according to ASTM C1754/C1754M [29]), flexural strength (according to EN 12390-5:2019 [30]), previous concrete density (according to ASTM C1754/C1754M [29]), and water permeability (according to ASTM D2434-19 [31]). Two different types of aggregates have been used in the mix design: normal weight and lightweight. The normal weight aggregates have been used in concrete type A and have an irregular shape with an average dimension of 4–8 mm, while the lightweight aggregates have an almost perfect round shape, i.e., spherical, with different dimensions ranging between 4 and 8 mm, 2 and 4 mm, and 0.5 and 1 mm for concretes B, C, and D, respectively.
Details of the aggregate shape can be visualized in Figure 1.
Concrete A differs significantly from the other three regarding the concrete density value, which is strongly affected by the higher values of the aggregate particle density. The four concretes present a similar void ratio. However, while this parameter is constant for concretes A, B, and C, it decreases for concrete type D, which features smaller aggregates. It can also be noticed that there is a decrease in the flexural strength for lower densities and smaller aggregate dimensions.
For each concrete, three different sample types have been manufactured with three different thicknesses, i.e., 20 mm, 40 mm, and 60 mm (Figure 1); for each of them, three samples have been produced. The panels are square-shaped in plan with a side dimension of 60 cm. Three different mounting conditions were tested for the samples with a thicknesses of 20 and 40 mm, that is, coupling different samples in multiple layers (Figure 2), adding a 50 mm air gap between the sample and the room floor (Figure 3), and adding a layer of fibrous material (rock wool) in the air gap itself (Figure 4). The identification codes of the samples and mounting conditions have been summarized in Table 2. The coupling of different samples in multiple layers has been performed only within the same concrete in order to compare their performance with single layers of the same thickness and investigate any anisotropy at the back surface of each layer. The multiple layer configuration is obtained by superimposing one panel to the other, with no joint or glue connecting them. This mounting solution could be practically useful when modular solutions are explored and would limit the need for different formwork thicknesses. The introduction of a rock wool layer in the air gap has been tested with sample D of 20 mm thickness only as it resulted in the highest sound absorption performances compared to the 20 mm samples of A, B, and C concretes. In this case, two thicknesses of the rock wool layer—30 and 50 mm—have been introduced in the air gap.
The assessment of the sound absorbing performances has been conducted in the small-scale reverberation room (SSRR) of Politecnico di Torino (Italy), following the procedure indicated in the ISO 354 Standard [32]. The reliability of the measurement was tested with respect to reproducibility and repeatability, by repeating the measures three times on three different samples of the same typology and considering their arithmetic mean to describe the performances of each type. The sound absorbing properties are expressed as 1/3 octave band sound absorption coefficients (α) and also as weighted sound absorption coefficients (αw) for an easier comparison.

2.2. Sound Absorption Coefficient Measurements

The small-scale reverberation room (Figure 1, Figure 2, Figure 3 and Figure 4) is installed in the Applied Acoustics laboratory at DENERG (Department of Energy, Politecnico di Torino, Torino, Italy). The room has been primarily built for random-incidence scattering coefficient measurements according to ISO 17497-1 [33], but it is also suitable for measurement of sound absorption coefficient according to ISO 354 [32,34]. It is an oblique angled room with pairs of non-parallel walls with a volume of 2.86 m3 and a total area of 12.12 m2. A more detailed description of the room construction has been provided in Shtrepi and Prato [35].
The measurement procedure consists in using the integrated impulse response method [32] for simultaneous measurements on six different microphone positions in two conditions, i.e., with and without the sample inside the room. The measurement chain consists of six 1/4” BSWA Tech MPA451 microphones and ICP104 (BSWA Technology Co., Ltd., Beijing, China), two ITA High-Frequency Dodecahedron Loudspeakers with their specific ITA power amplifiers (ITA-RWTH, Aachen, Germany), and a sound card Roland Octa-Capture UA-1010 (Roland Corporation, Shizuoka, Japan). This setup allows to perform 12 measurements, which refer to the minimum number required by ISO 354:2003 [32]. The software used for the measurements, i.e., sound generation, recording, and signal processing, is MATLAB combined with the functions of the ITA-Toolbox (an opensource toolbox by RWTH-Aachen, Aachen, Germany) [36].
For each of the 12 measurements the reverberation time relative to a 20 dB decay, i.e., T20, is evaluated and used to estimate the T60, i.e., the reverberation time occurring for a 60 dB decay, as done in the full-scale reverberation room (FSRR) data processing. The data are spatially averaged with the ensemble averaging method in order to obtain the reverberation times T1 and T2, which are obtained without and with the sample inside the room, respectively. Equations (1) and (2) are applied to estimate the random-incidence absorption coefficient αs.
The difference between T1 and T2 measurements is used to calculate the variation of the equivalent sound absorption area AT [m2] based on Sabine’s theory:
A T = 55.3 V 1 c 2 T 2 1 c 1 T 1 4 V m 2 m 1
where T1 and T2 [s] are the reverberation times of the empty reverberation room and of the reverberation room with the test specimen, respectively; V [m3] is the volume of the empty reverberation room; c1 and c2 [m/s] are the propagation speed of sound in air in the room without and with the sample: c1 = 331 + 0.6 t1, t1 [°C] is the air temperature; and m1 and m2 [m−1] is the power attenuation coefficient of the climatic conditions in the reverberation room without and with the sample (calculated according to ISO 9613-1 [37]).
The random-incidence absorption coefficient αs is defined as
α S = A T S
where S [m2] is the area covered by the test sample. Note that the edge area is included in the calculations of S considering the four concretes as isotropic materials [38].

3. Results

The results of the measured sound absorption coefficients are reported in the graphs in Figures 5, 7 and 8 and discussed in separate sections, based on the tested conditions, i.e., thickness and mounting method for each concrete type (A–D). Figures 5, 7 and 8 present an immediate reading of the design factors considered within the sample typology to evidence improvements/deterioration given the mix design. Furthermore, the figures in Appendix B compare the results of considered panel samples (A–D) for a given design factor, in order to help the reader with a more immediate understanding of the differences between samples (A–D). In the end, more general conclusions are drawn to compare the performances of the different sample types. Moreover, the single index for weighted sound absorption (αw) in SSRR measurements has been estimated and used for comparisons.

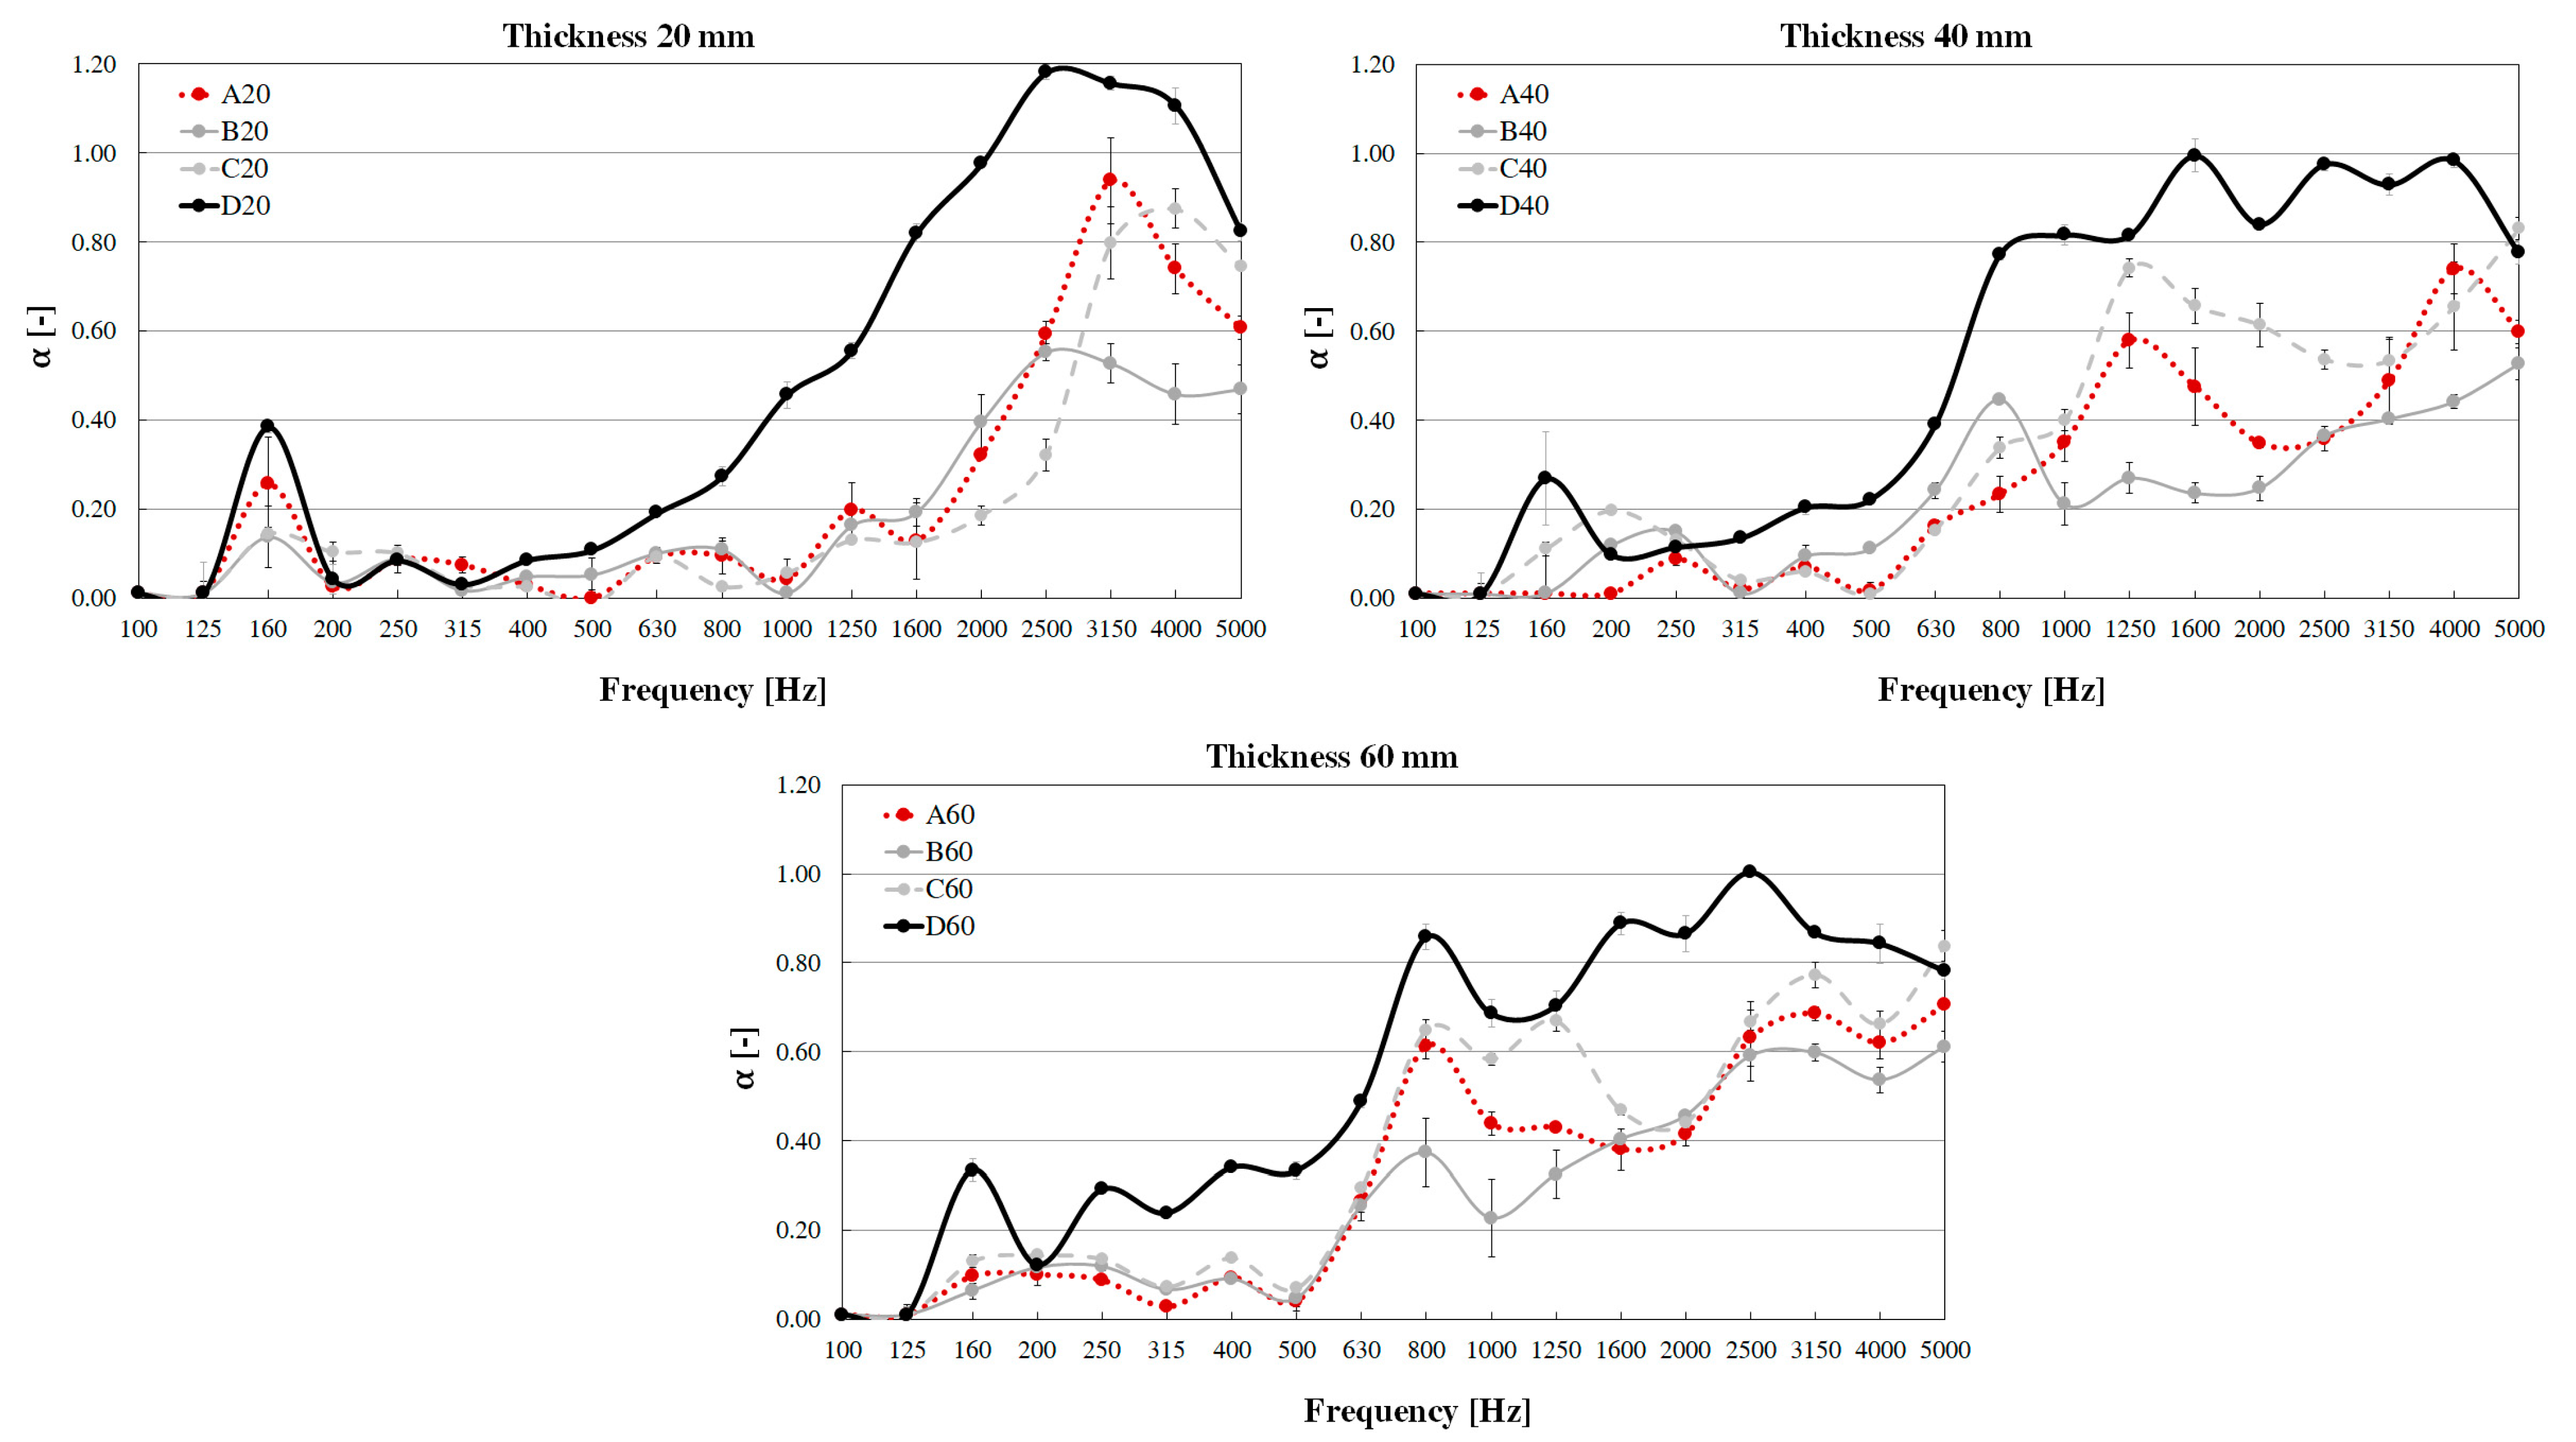
3.1. Effect of Sample Thickness and Concrete Type

Figure 5 shows the graphs of the four samples (A–D) for three different thicknesses of the single layers. Overall, the absorption spectra of panels A are uneven, and tend to provide poor absorption (<0.25) at frequencies lower than 630 Hz, while at higher frequencies, the sound absorption coefficients ranges between 0.40 and 0.70 for panels with either 40 mm or 60 mm thicknesses. The 20 mm thick panel features an absorption peak at 3150 Hz, which reaches the value of 0.90 and provides a poor absorption (<0.25) at frequencies lower than 2000 Hz. The 40 and 60 mm panels present a higher absorption coefficient with respect to the 20 mm panels in the 500–2000 Hz frequency range.
The absorption spectra of samples B are uneven and tend to provide poor absorption (<0.25) at frequencies lower than 630 Hz for panels with either 40 mm or 60 mm thicknesses, while at higher frequencies the absorption coefficient ranges between 0.20 and 0.60. The 20 mm thick panel features an absorption peak at 2500 Hz of about 0.60 and provides poor absorption (<0.25) at frequencies lower than 1600 Hz. This might be due to the curing process of the 40 mm sample, which might have led to lower porosity of these samples.
The absorption spectra of panels C are also slightly uneven and tend to provide poor absorption (<0.25) at frequencies lower than 630 Hz for panels with either 40 mm or 60 mm thicknesses, while at higher frequencies, the absorption ranges between 0.40 and 0.80. The 20 mm thick panel features an absorption peak around 4000 Hz, achieving a value of 0.90 and provides poor absorption (<0.25) at frequencies lower than 1600 Hz. The absorption coefficient for this thickness becomes lower than 0.25 at frequencies below 2000 Hz. The 60 mm sample reaches significant high values of absorption coefficient (>0.40) at 800 Hz, while the 40 mm panel at 1250 Hz.
The absorption spectra of panel D are more even than the other three typologies, and tend to provide significant absorption (>0.40) at frequencies higher than 630 Hz for panels with either 40 mm or 60 mm thicknesses, where the sound absorption ranges between 0.40 and 1. The 20 mm thick panel feature an absorption peak between 2500 Hz and 4000 Hz, achieving a value of 1.20; the peak is broader than those featured by 20 mm thick panels of types A–C. Values higher than 1 may occur in the measurements with finite sample size for materials with high absorption properties [39,40]. The 20 mm sample of panel D achieves significant absorption (>0.40) above 1000 Hz, while for panels A–C, this occurred above 2500 Hz, 2000 Hz, and 3150 Hz, respectively. The sound absorbing performances of thicker panels are extended towards the lower frequencies, in the range below 1600 Hz. Indeed, for the thicker panels (40 mm and 60 mm), the significant absorption range is extended in a similar way down to 630 Hz.

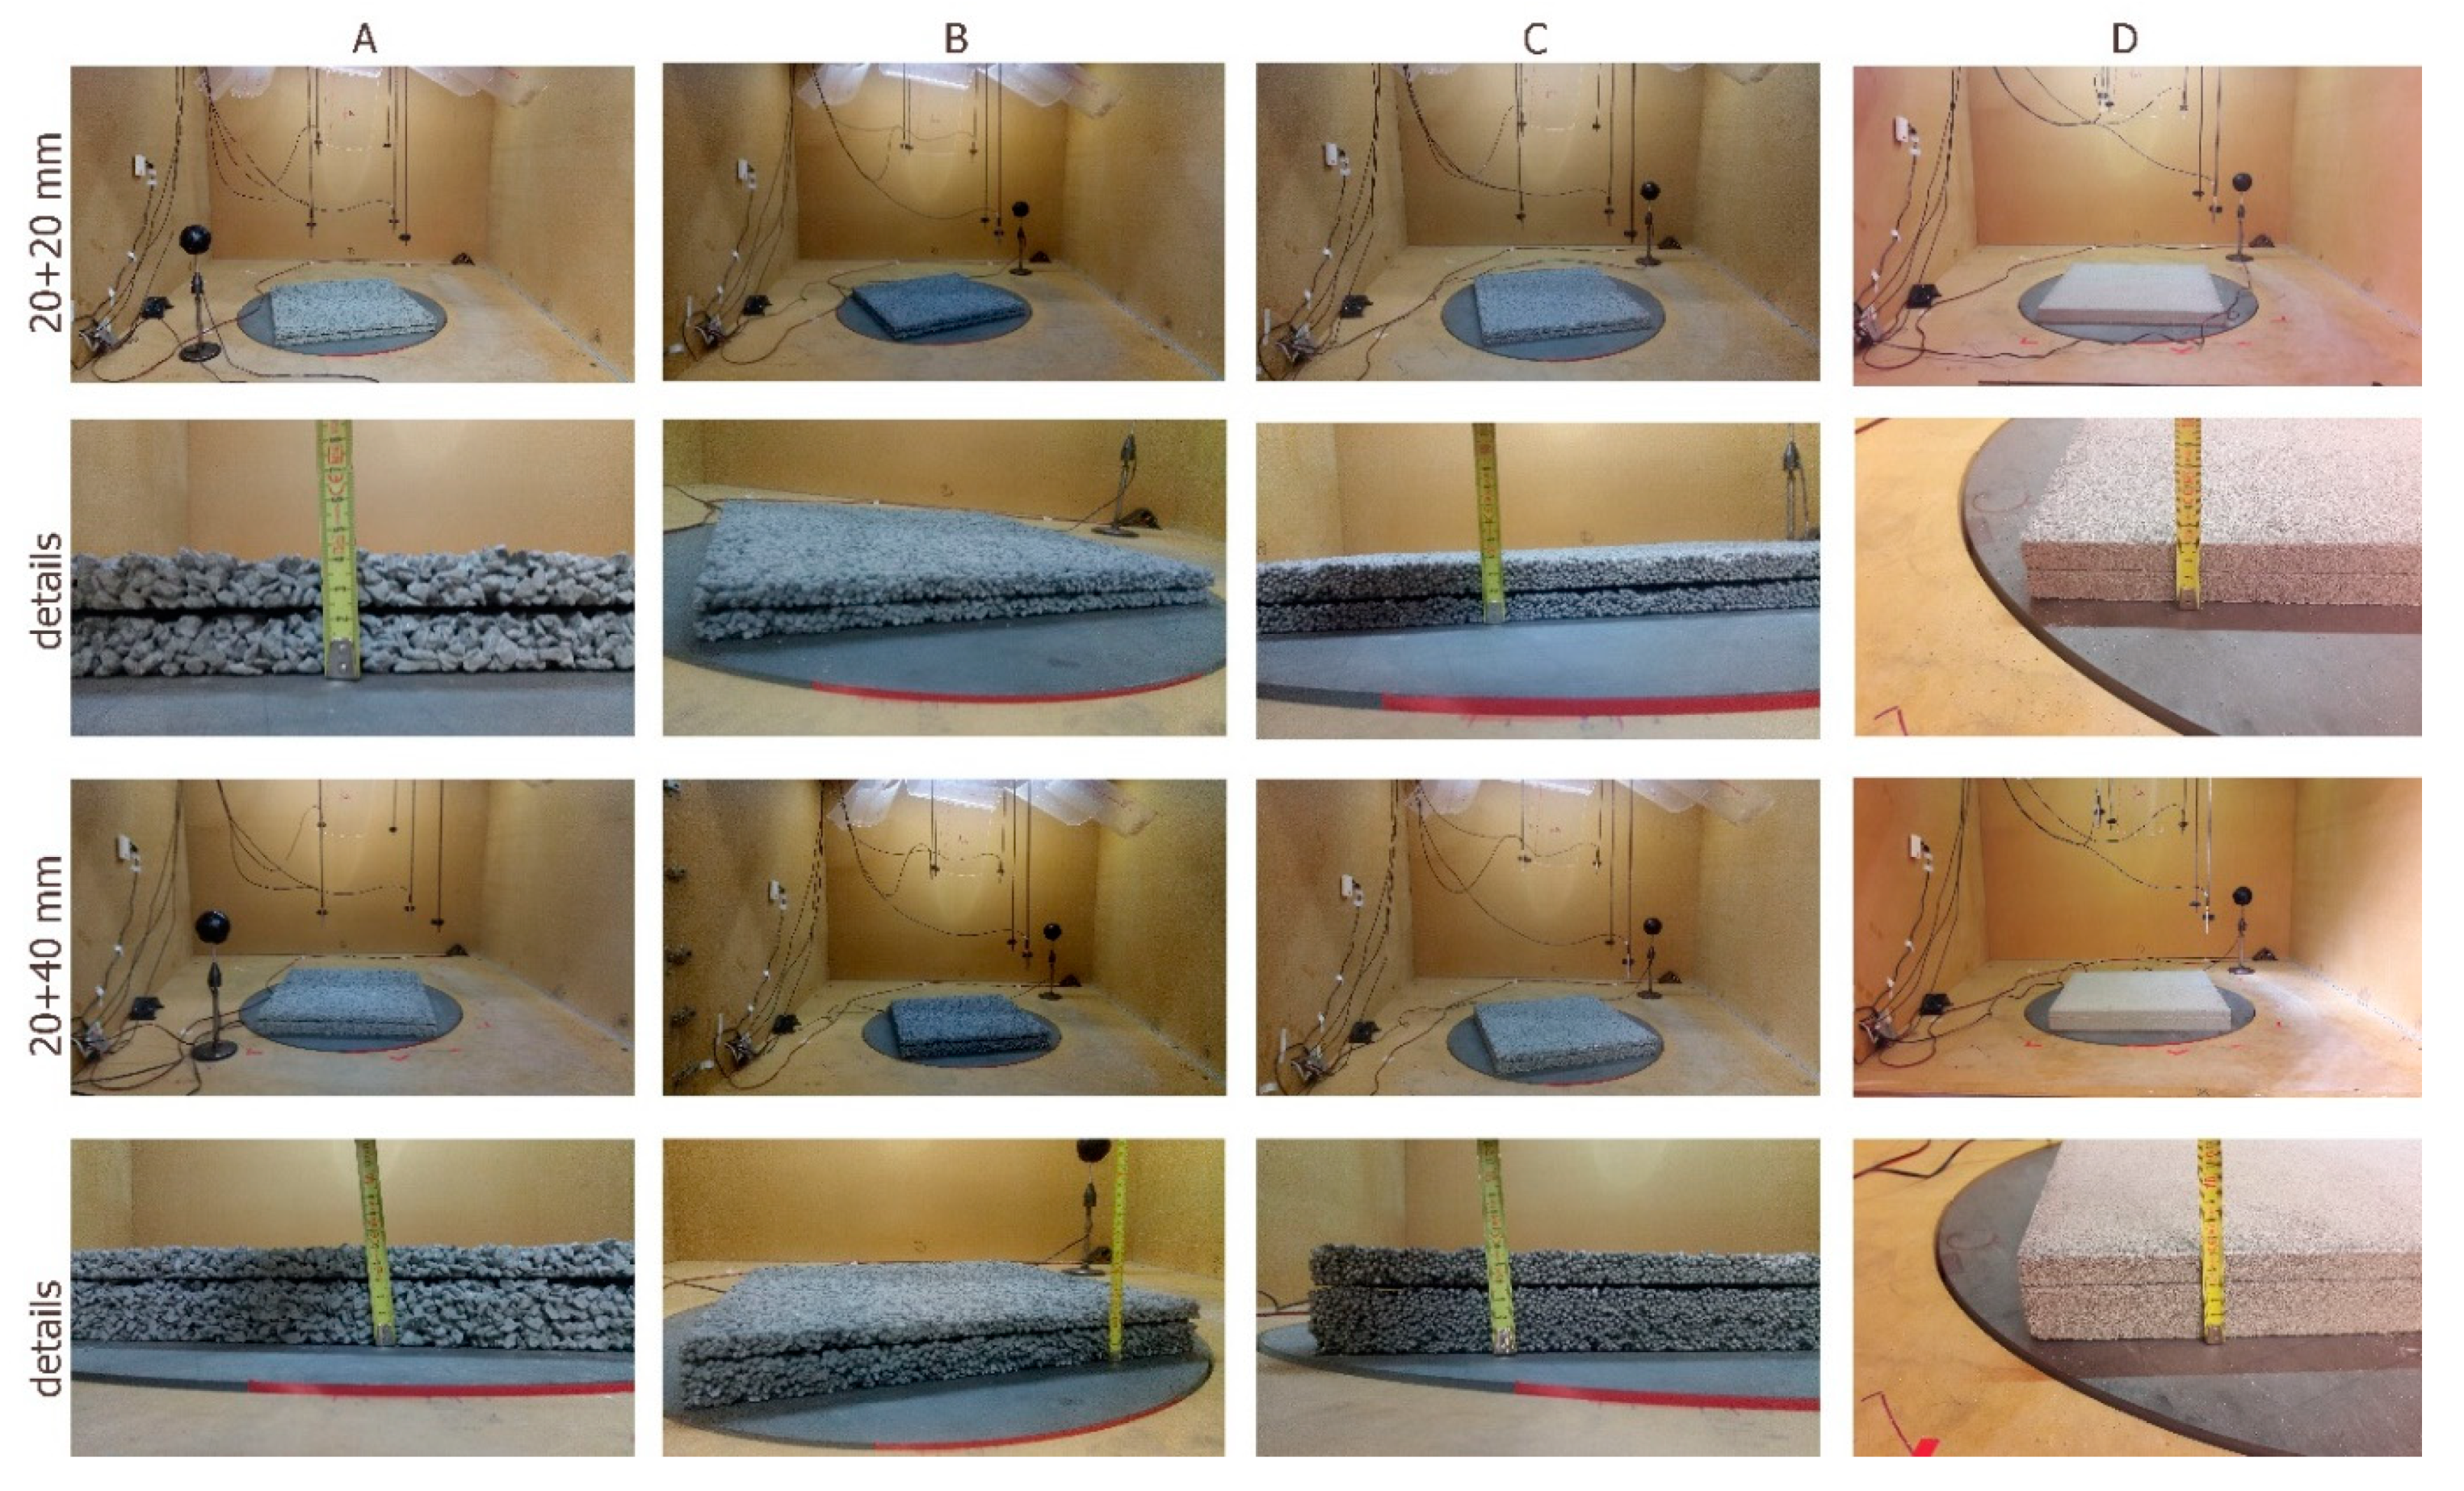
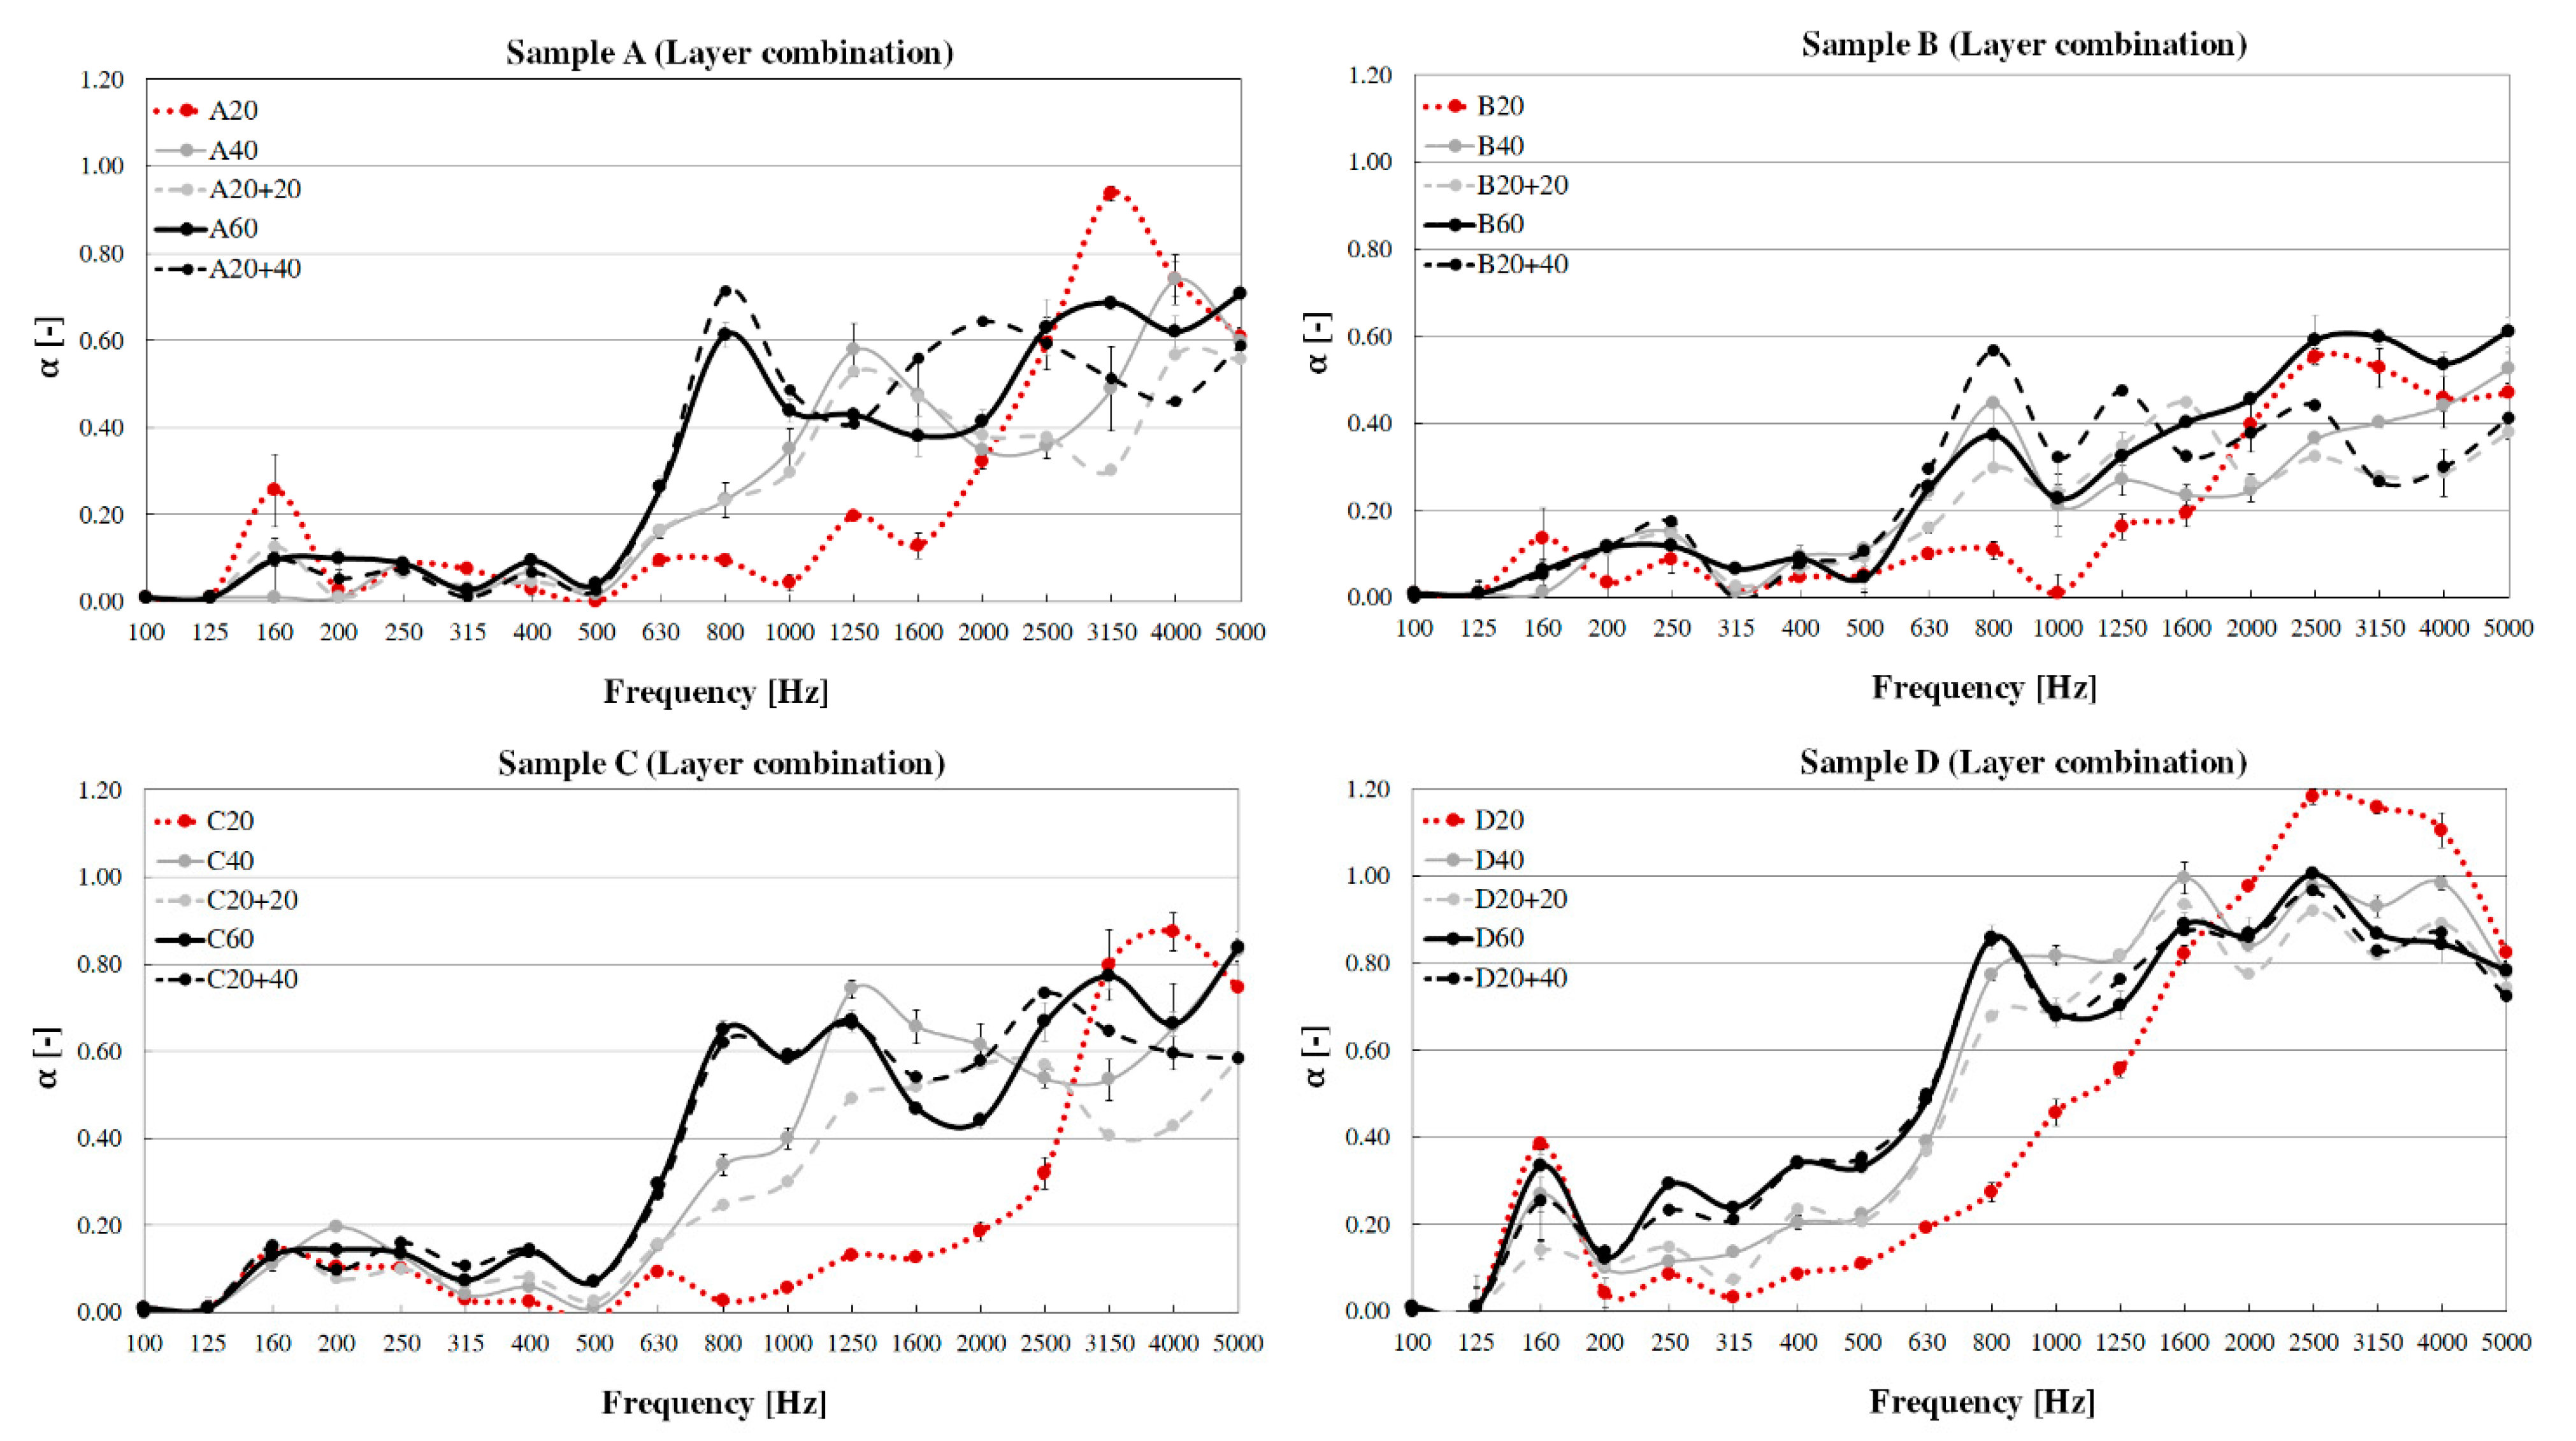
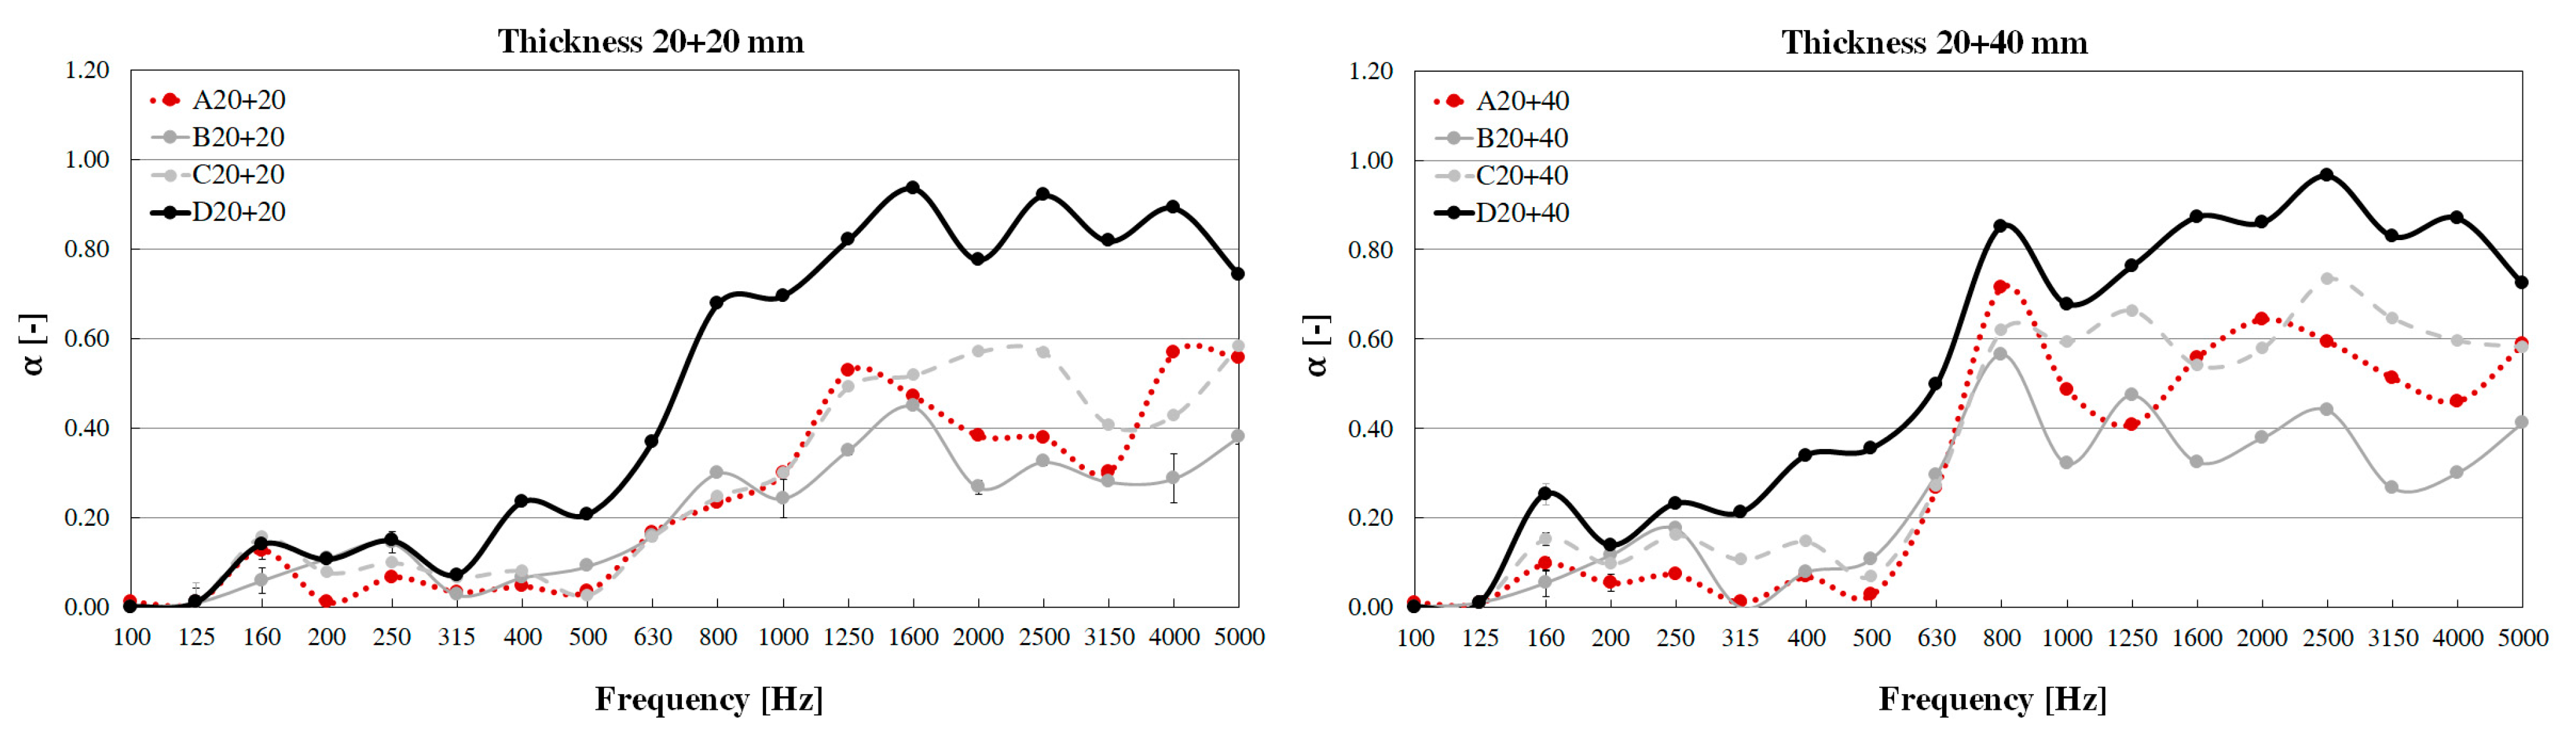
3.2. Effect of Sample Mounting in Multiple Layers

The graphs in Figure 5 show the absorption coefficients of the four sample types both in the single layer and multiple layer configurations with panel thicknesses of 20, 40, and 60 mm, for an easier comparison. Sample A graph shows that the sound-absorbing performances achieved when coupling two panels of 20 mm thick are comparable to those achieved by a single panel with a thickness of 40 mm. A similar trend is observed comparing the 60 mm thick panel with the combination of 20 + 40 mm thick panels. However, there are some differences occurring above 1250 Hz. It can be observed that above 2500 Hz both the 20 + 20 mm and the 20 + 40 mm combination show lower values of sound absorption compared to the 40 and the 60 mm single layers samples, respectively. It can be noticed that the multiple layer 20 + 40 mm of sample A outperforms the 60 mm sample only at the 800 Hz peak and in the frequency range 1250 to 2500 Hz.
Sample B graph shows that the sound absorbing performances achieved when coupling two panels 20 mm thick are comparable to those achieved by a single panel with a thickness of 40 mm. However, the combination 20 + 20 outperforms the 40 mm single layer panel in the range of 1000 to 2000 Hz. By contrast, the performances of the 60 mm thick panel are higher than those of 20 + 40 mm thick panels combined for frequencies higher than 1600 Hz. The multiple layer 20 + 40 outperforms the 60 mm sample in the range 630–1250 Hz.
The results of Sample C show that the sound absorbing performances achieved when coupling two panels that are 20 mm thick are slightly lower than those achieved by a single panel with a thickness of 40 mm, particularly for frequencies range 800–2000 Hz and above 3150 Hz. The performances of the 60 mm thick panel are comparable with those achieved by the combination of 20 + 40 mm thick panels. However, the multiple layer 20 + 40 outperforms the 60 mm sample in the range 1250–2500 Hz.
Sample D results show that the sound absorbing performances achieved when coupling two panels 20 mm thick are comparable to those achieved by a single panel with a thickness of 40 mm. A similar trend is observed comparing the performances achieved by a 60 mm thick panel with that of the combination of 20 + 40 mm thick panels. This might be due to the high and uniform porosity obtained for all the samples of type D compared to the other panel types, as seen in Figure 6. In these cases, further care should be put in the treatment of the mix design and its curing in samples A, B, and C, as heavier aggregates might sediment and result in nonuniform distribution of the pores within the panel and its front/back surfaces.

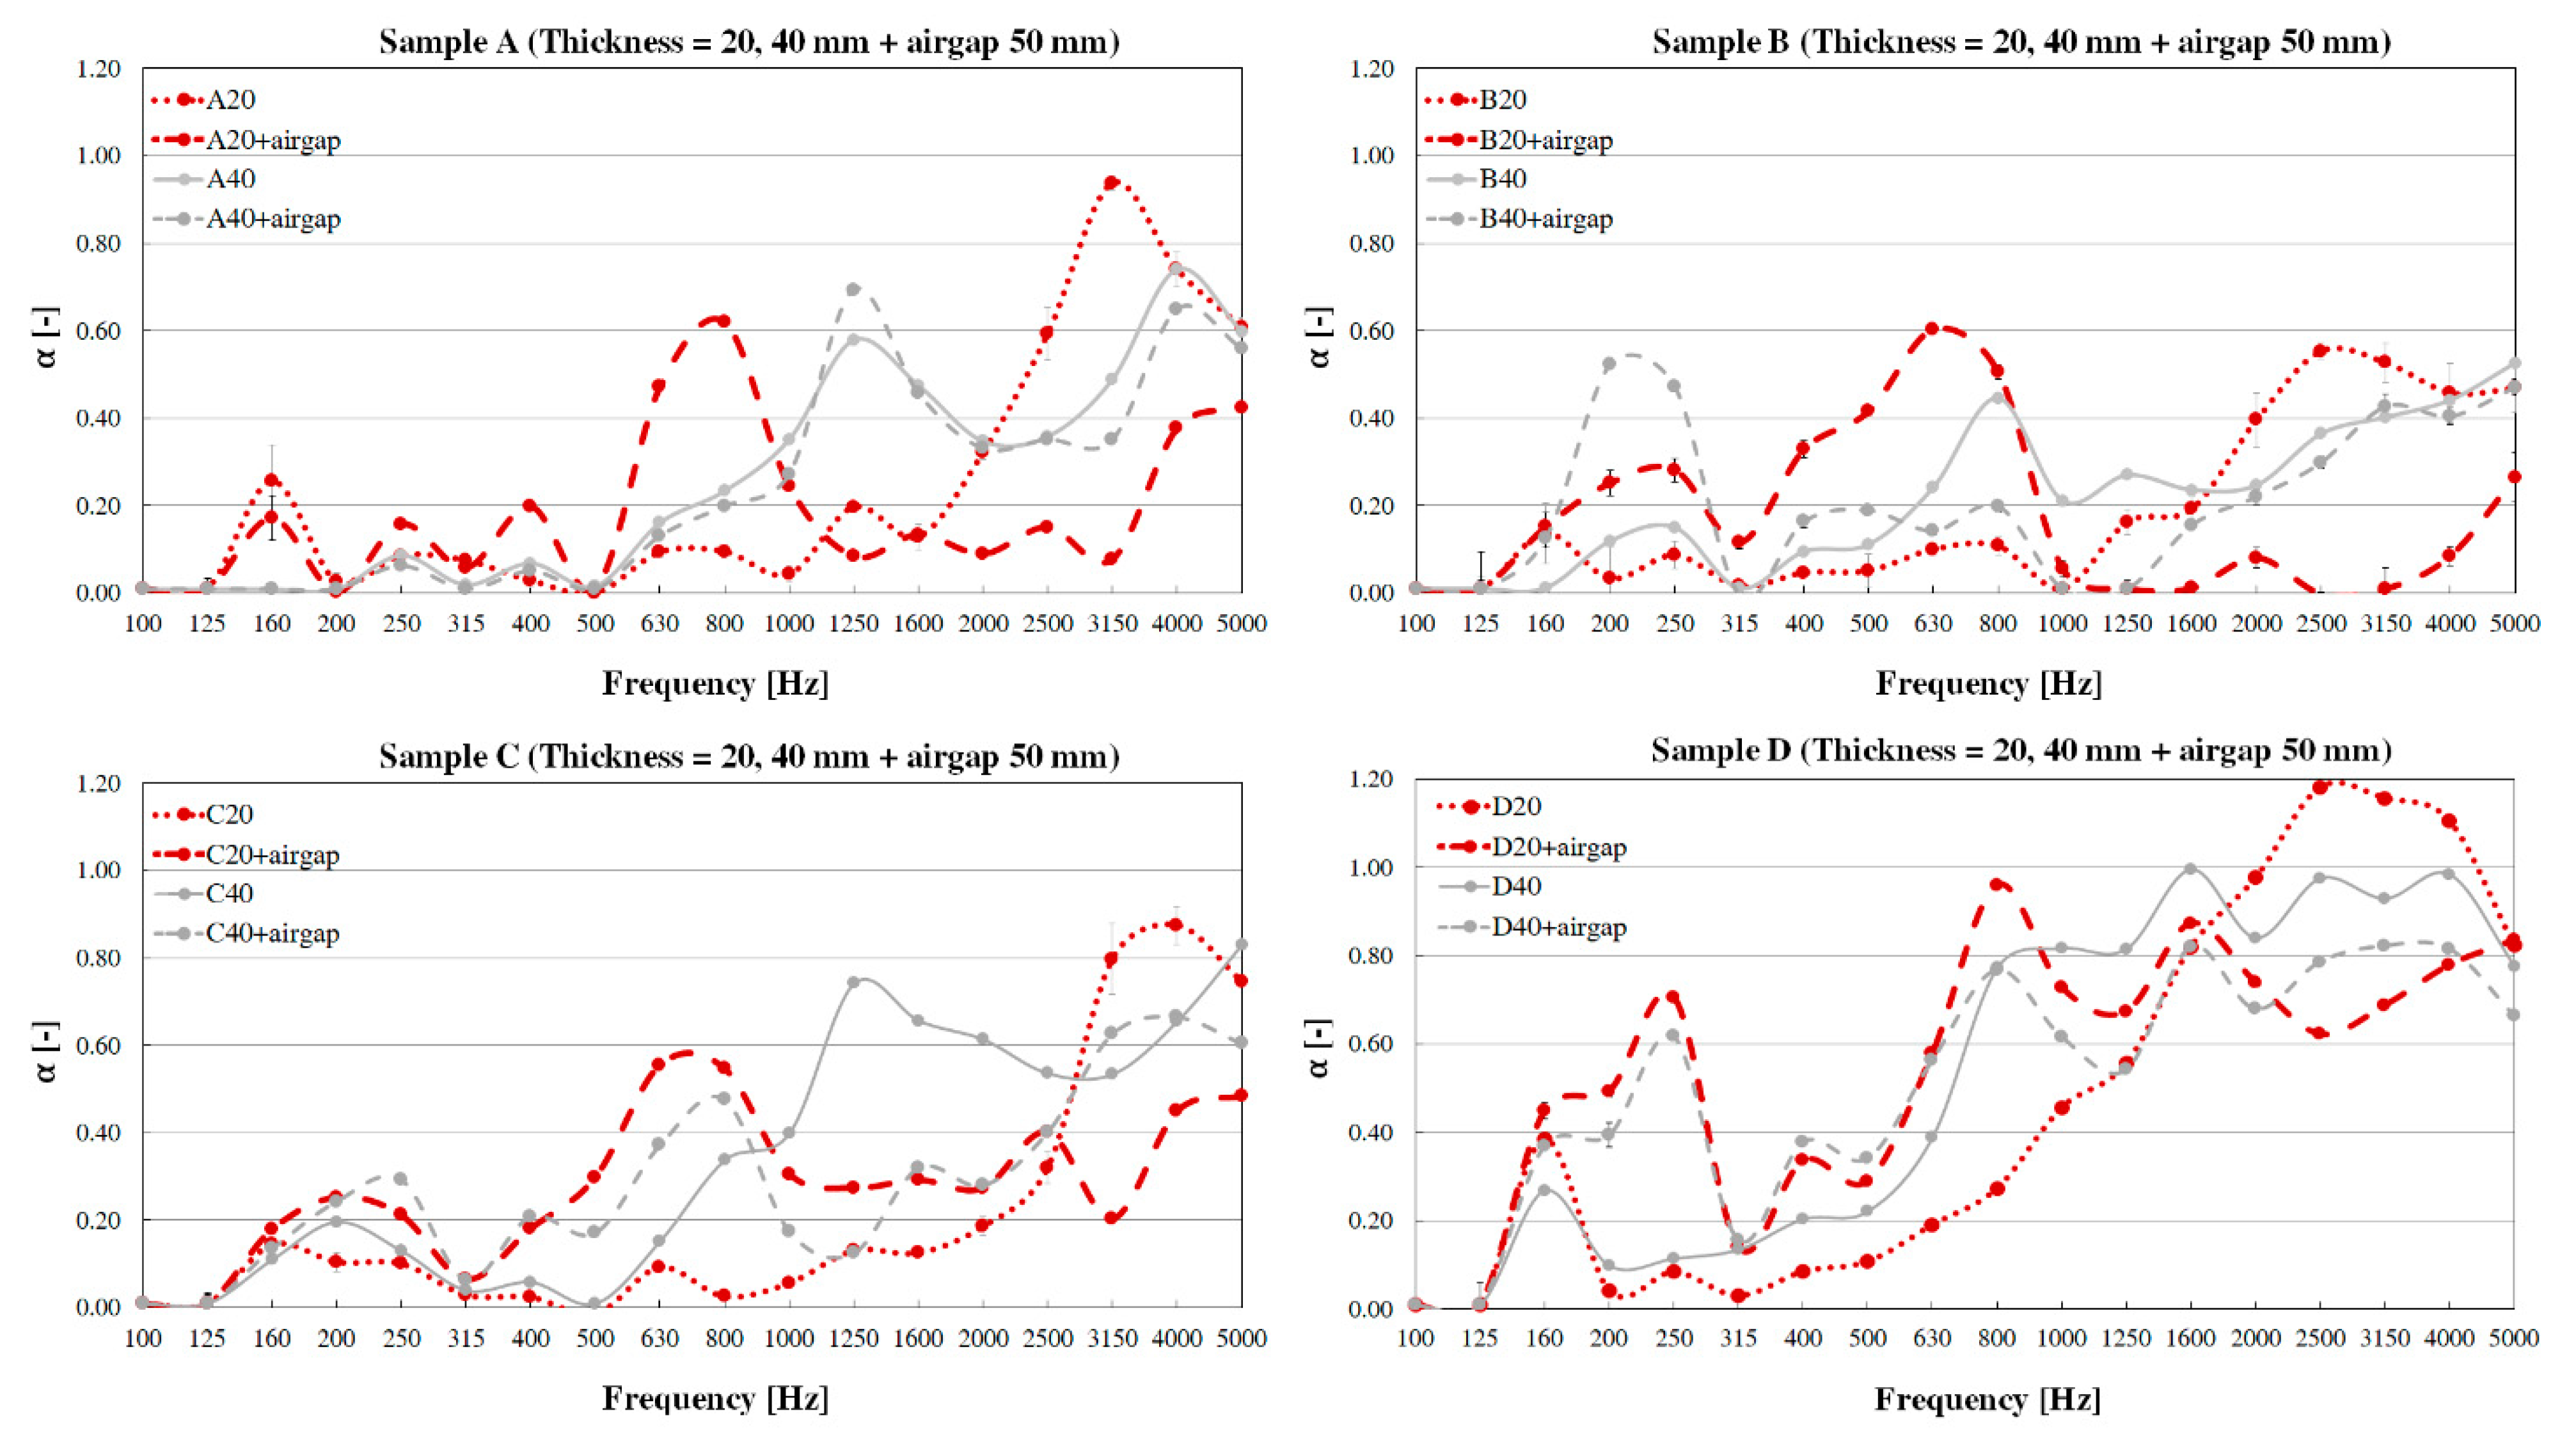
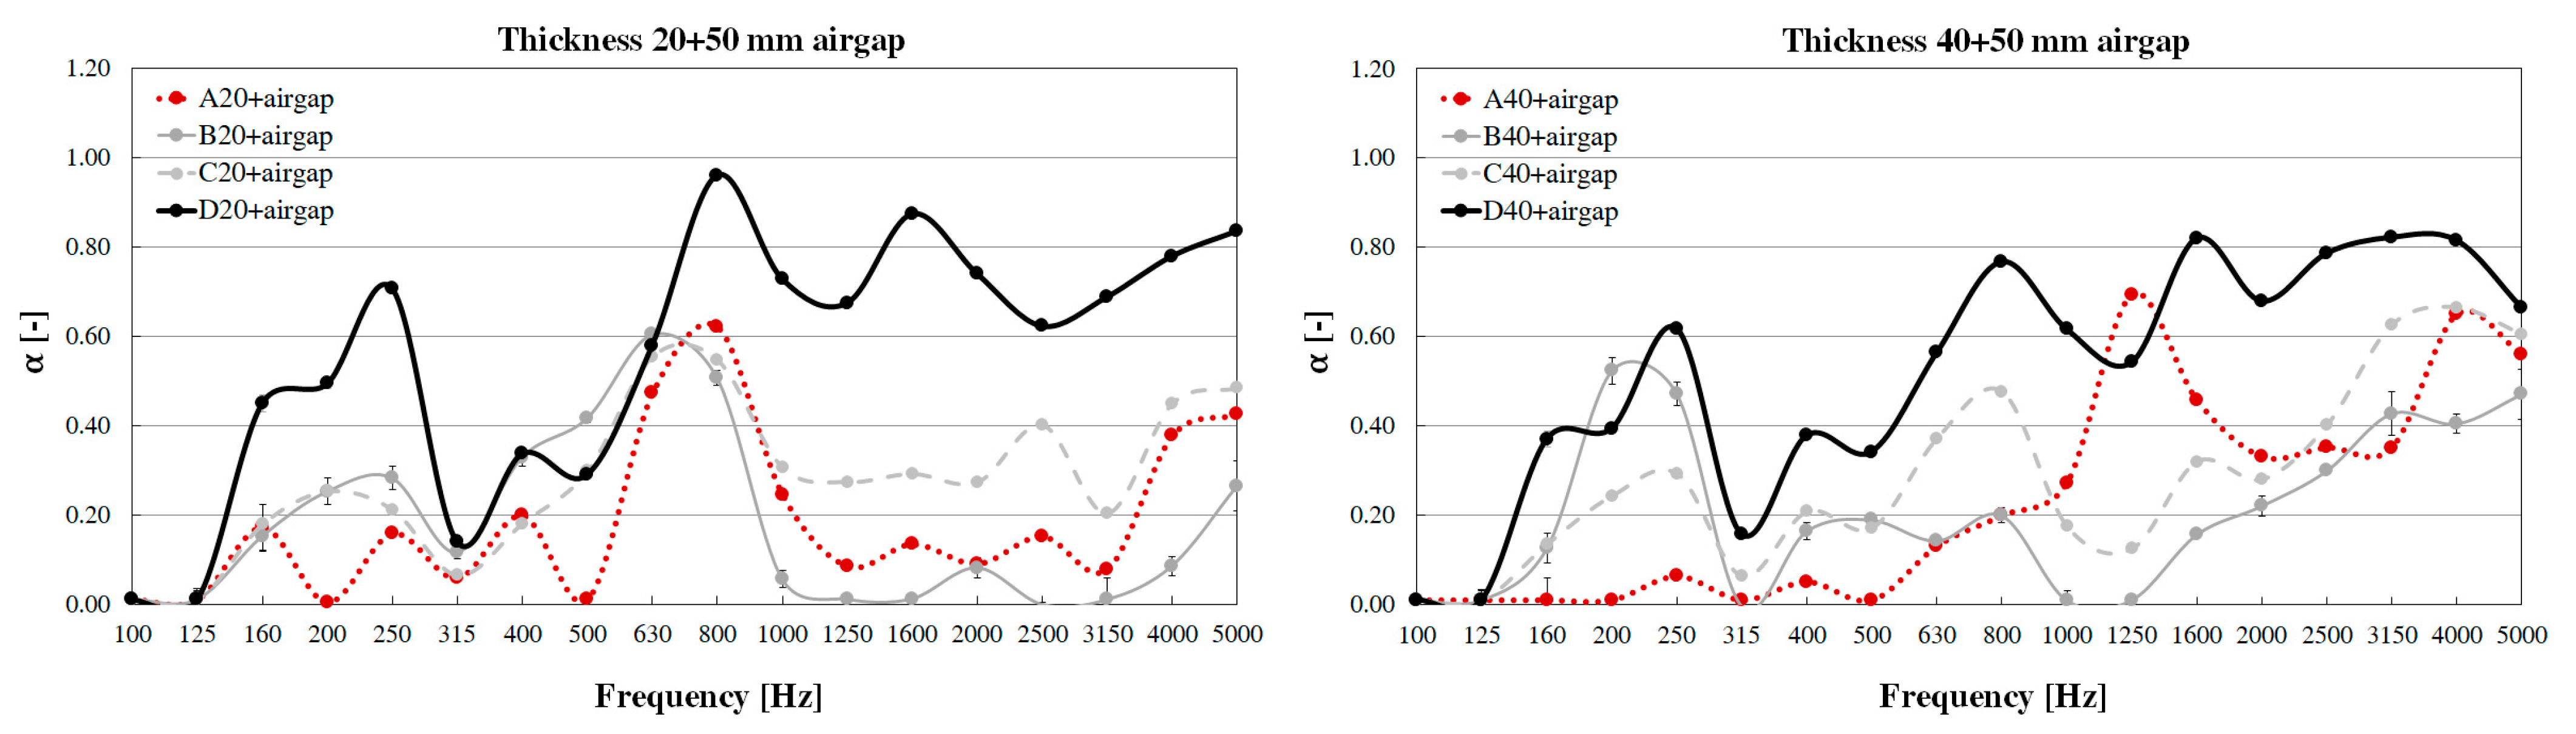
3.3. Effect of Sample Mounting with an Air Gap

The graphs in Figure 7 show the four sample types (A–D) mounted with an air gap of 50 mm between the panel and the rigid backing, i.e., the SSRR floor. The graph of Sample A shows that the performance is enhanced at the lower frequencies when an air gap is left between the panel of 20 mm and the backing, while the sound absorption at high frequencies decreases. The maximum peak is shifted at lower frequencies, i.e., at ~630 Hz, with an absorption coefficient of ~0.60. The 40 mm layer seems to be less affected by the presence of the air gap and the maximum peaks remain unvaried in frequency for this thickness. However, a slight decrease is reported at high frequencies and an increase of about 0.10 is observed at the peak value corresponding to 1250 Hz.
Sample B shows different trends for the 20 mm and 40 mm layers. However, when an air gap is left between the panels and the backing, the performance is enhanced at the lower frequencies for the 20 mm and 40 mm layers. The high frequency sound absorption decreases for the 20 mm layer when the air gap is added, while the maximum peak is shifted at lower frequencies, i.e., at ~630 Hz, with an absorption coefficient of ~0.60. The 40 mm layer seems to be less affected by the presence of the air gap at high frequencies above 2000 Hz. Conversely, the air gap seems to decrease the absorption over the 630 to 2000 Hz range for the 40 mm layer. A peak value appears at the frequency of 200 Hz with a value of about 0.55 of the absorption coefficients.
Sample C shows a decrease of the absorption coefficient at high frequencies for both 20 mm and 40 mm layers when an air gap is left between the panels and the backing. For the 20 mm panel, this is significant above 2500 Hz, while for the 40 mm panel, it is more evident in the 1000 to 2500 Hz range. The performances are slightly enhanced at the lower frequencies in the range 315 to 800 Hz for the 20 mm sample and in the range 315 to 2500 Hz for the 40 mm sample, with the maximum peaks that are shifted at 630 Hz and 800 Hz, respectively.
The sound-absorbing performances of sample D show a decrease at high frequencies when an air gap is left between the panels and the backing above 1600 Hz and above 800 Hz for the 20 mm and 40 mm panels, respectively. Nevertheless, the sound absorption coefficients in those ranges result above 0.55. The performances are enhanced at the lower frequencies, where several peaks appear around 250 Hz, 400 Hz, and 800 Hz. The absorption coefficient increases for both thicknesses in the 160 to 630 Hz range when the air gap is added, showing a very similar trend for both 20 mm and 40 mm panels.

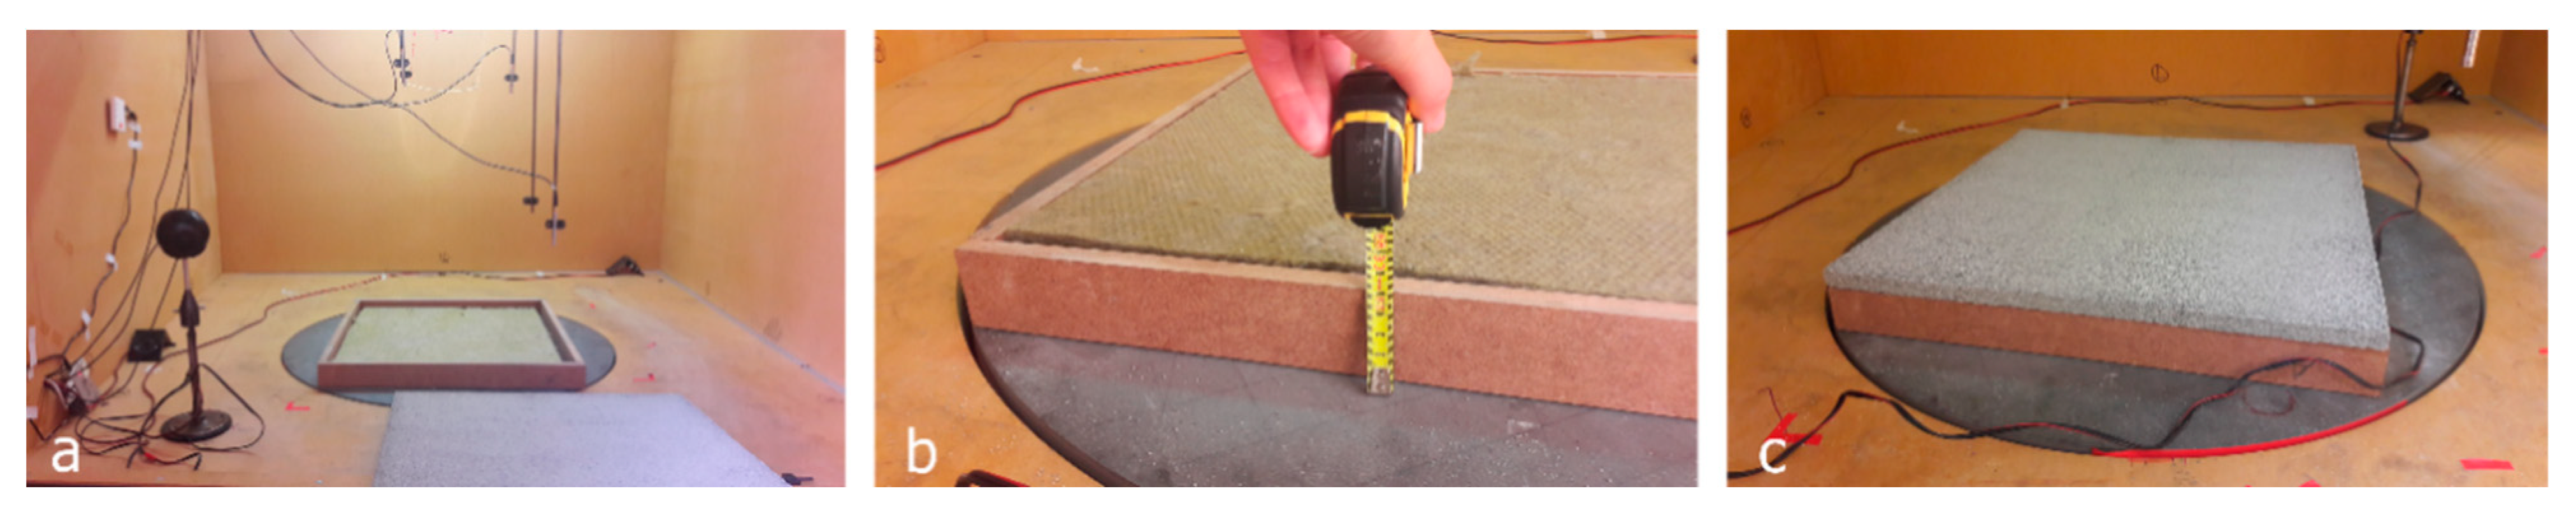
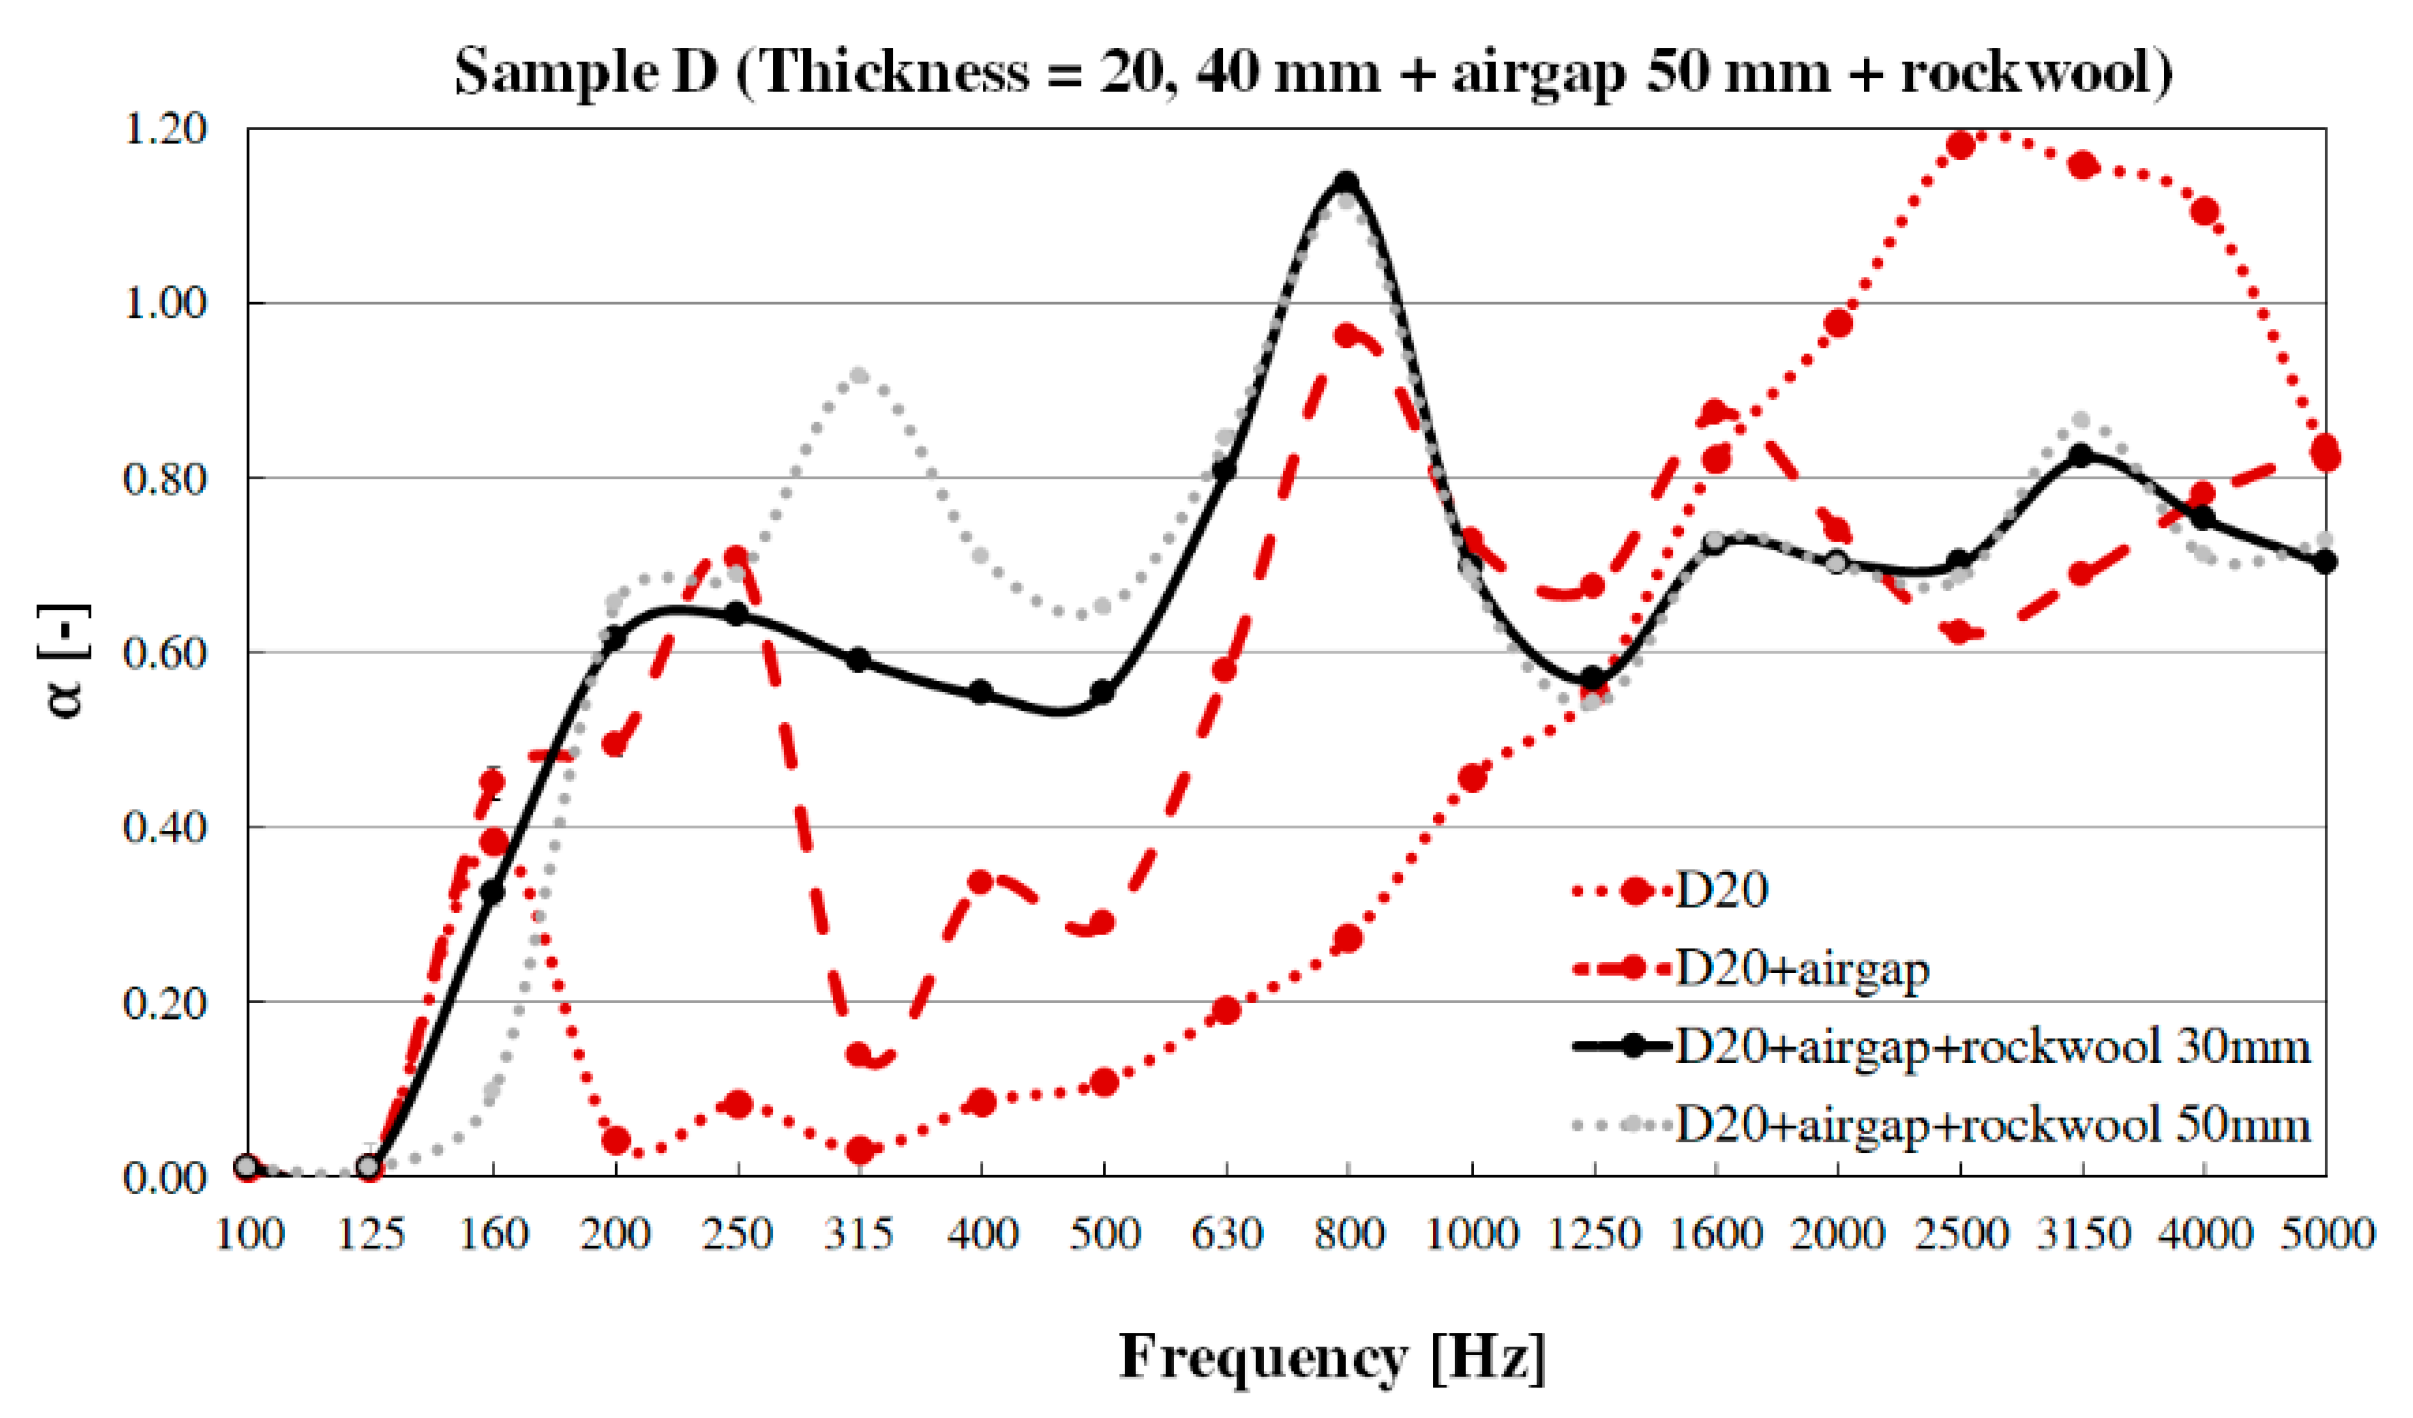
Effect of Sample Mounting with an Air Gap Filled with Porous Material

The previous sections showed that sample D presents the highest sound absorption coefficients extended over the broader range of frequencies. In order to further improve the performance of the combination of panel D with an air gap, another strategy has been used considering the air gap filled with porous material. The introduction of a rock wool layer in the air gap has been tested with the sample of 20 mm thickness only. Two thicknesses of the rock wool layer, that is, 30 and 50 mm, have been introduced in the air gap. Recall that the air gap considered here is of 50 mm. Therefore, the first layer of rock wool (30 mm) allowed to have a 20 mm air gap left between the concrete sample and the rock wool layer, while the 50 mm rock wool allowed to test a fully filled air gap.
Figure 8 shows that the with the insertion of 30 mm and 50 mm rock wool in the air gap the sound absorption coefficients have very similar trends above 630 Hz. Generally, the combination of an air gap with a porous material (e.g., rock wool) is shown to improve the acoustic performance down to 250 Hz. A peak value at 800 Hz is further increased when the air gap is filled with rock wool compared to the empty condition. Furthermore, a significant improvement is obtained in the 250 to 800 Hz frequency range reaching values of sound absorption coefficients of 0.60–0.90.

3.4. Single Number Acoustic Index αw

Based on the above results, the weighted sound absorption coefficients αw derived from the SSRR measurements were calculated. These single indices are useful for an immediate and practical comparison of the performance of different conditions. The higher the αw values, the better the material capability in sound absorption. Their values normally range from 0 to 1, with 1 meaning 100% sound absorption.
The weighted sound absorption coefficient αw is derived from practical sound absorption coefficients, αp which is calculated as an average of the one-third octave sound absorption coefficients within the octave in accordance with ISO 11,654 [41]. Weighted sound absorption coefficient αw can be obtained with the reference curve (α250 = 0.8; α500 = 1; α1000 = 1; α2000 = 1; α4000 = 0.9), which is shifted in steps of 0.05 towards the αp values until the sum of unfavorable deviations is less or equal to 0.10. The unfavorable deviations occur when the measured value is lower than the value of the reference curve. Finally, the weighted sound absorption coefficient is the value of the adjusted reference curve at 500 Hz.
Table 3 shows that there are a few differences among the single indices within each concrete data. It is evident from these values that the highest performance is obtained for panel type D. The αw values for the single layer of type D samples become significant (>0.40) for a thickness of 60 mm. The single layers of 20 mm and 40 mm present an improvement of the αw values when they are mounted with an air gap behind (αw = 0.50). This mounting condition performance is further improved when the air gap is filled with a porous material. It can be noticed that when the entire gap is filled with rock wool (50 mm), the highest αw is obtained. A significant improvement due to the air gap is also obtained for sample C, while a slight improvement is reported for sample A. Conversely, depending on the sample thicknesses, sample B values of αw are either not affected or reduced when the air gap is added at the back of the 20 mm and 40 mm thick layers, respectively.

4. Discussion

Given the results herein, a few aspects can be highlighted with respect to previous findings presented in Section 1 and Appendix A. The sound-absorbing properties of the panels under examination (i.e., A–D) were generally found to be extended towards the lower frequencies with increasing thicknesses of the panels (i.e., 20 mm, 40 mm, or 60 mm). The result is coherent with the findings of previous studies, such as in [13,18,21]. However, panel B exhibits an unexpected behavior, as while the sound absorbing properties of the thicker panels are higher at lower frequencies compared to the 20 mm sample, as it can be seen in the 500 to 1600 Hz frequency range, the 20 mm thick sample outperforms the 40 mm thick one in the range of 1600 to 4000 Hz. Moreover, no peak shift towards the lower frequencies is reported for the 60 mm thick panel compared to the 40 mm thick one, as both present an absorption peak at 800 Hz. These two aspects may suggest that the superficial and inner porosity of panels B are not uniform among the different thicknesses. Moreover, it can be argued that for this typology that the thickness threshold is ~40 mm, i.e., no further increase of the absorption coefficient below 800 Hz is obtained with the thickness increase from 40 to 60 mm [7]. Sample D outperforms the other typologies and confirms that its superficial and inner structures are made of many small and uniformly distributed pores and apertures connected with each other and with the outer surface [11].
When comparing samples with round lightweight aggregates, i.e., B–D, it can be observed that there is a decrease in the sound absorption when the aggregate size increases from 0.5–1 mm (sample D) to 4–8 mm (sample B). This is due to an increase in the median pore size when increasing aggregate size as shown in [21], which would reduce the tortuosity of the pore network, thus resulting in lower absorption values. Indeed, sample D has a lower water permeability (Table 1), which is inversely correlated to tortuosity [42]. Moreover, note that sample A with crushed normal weight aggregates results in higher values of the absorption coefficient when compared to sample B, which has similar void ratio (25%) and aggregate dimensions (4–8 mm) to sample A, but features different aggregate shapes and densities, i.e., round lightweight aggregates. This might be due to a higher tortuosity enabled by internal pores with varied size connected to the surface, which is coherent with the aspects highlighted in [11]. This kind of difference was not observed in previous studies, that is, the work in [22], where only slight differences between round-shape (lightweight) and irregular shape (normal weight) aggregates with the same gradation were found.
When considering panels composed of two layers, the presented results have highlighted some discrepancies between the sound absorbing performances of multilayered panels and those of a single layer panel of the same thickness in case of panel samples A–C. Conversely, samples D in the multilayered and single layer solution of equal thickness exhibit similar performances. This behavior may be linked to the different degrees of uniformity in the pore distribution of the different panel samples. In samples D, both sides of the panel present a uniform distribution of the pores apertures and the measurement results also suggest a higher connection of the internal pores to the surface as highlighted in [11]. Differently, for samples A–C, the closed pores presented in the back side of the panels (Figure 6) may not allow full activation of the absorption of the second layer. This highlights that the sound absorption performances of such sample may be improved if greater attention is paid during the treatment of the mix design and its curing in samples.
By comparing the sound absorbing performances of the different panel types measured mounted with an air gap of 50 mm, it emerges that the panel type D outperforms the other typologies. It presents a more uniform frequency-dependent sound absorption, a broader frequency range of high values of absorption coefficient, and absorption coefficients higher than those of other panel typologies. The performances of panels type C are slightly better than those of panels A and B. The worst performance is presented by panel type B, which is generally associated with the lower sound absorbing coefficient throughout the spectrum. This might be due to the effect of regular and bigger aggregates, which lead to reduced tortuosity of the pore network [21]. However, the behavior of samples A, B and C does not change much with the air gap, suggesting that the sound is at least partly blocked by the sample. Indeed, as it was highlighted also for the multilayer investigation, for the other three typologies the back sides of the panels (Figure 6) present a higher number of closed pores, which do not allow to fully activate the absorption due to the combination with the air gap.
Generally, when considering the additional layer of air gap, note that the performance of the 20 mm sample behaves as a layer of microperforated panel mounted with an air gap, i.e., presenting a clear sound absorption coefficient peak at low frequencies with poor values at higher frequencies [7]. This similarity is more evident for samples A and B, which are expected to have pore networks with lower tortuosity due to the greater dimension of the aggregates (4–8 mm) as presented in [21]. The 40 mm sample shows a similar behavior, which can resemble that of a multilayer microperforated panel (MPP) [43]. In this case, the thickness of the panel allows for a higher tortuosity of the pore network, which still allows for some absorption at higher frequencies. Indeed, the microperforated panel sound absorption model presented by Maa [44,45] has been used in several studies to describe the acoustic behavior of concrete.
By partially or completely filling the air gap at the back of the 20 mm thick sample D with rock wool as porous material within the air gap, the sound absorbing performances were reported to improve down to 250 Hz. This is because the air resonance in the air gap and porous material layer is further damped by the porous material layer. This is coherent with the findings related to MPPs [43] and highlights the improvements on absorption with broader bandwidth and lower frequencies efficiency. These solutions’ results are appropriate for several outdoor applications dealing with railway noise and traffic noise reductions and feature a spectrum of interest in the range of 125 to 4000 Hz [46]. Moreover, the investigated mounting systems could be integrated with structural multilayer building facades [47,48].
Note that it was observed that although sample D results with the highest performance in terms of evenness and rate, it presents poor performances related to wear resistance compared to the other types, which may hamper their application in actual scenarios if no facings or other protective solutions are used. Another option is to use panels of type B and C, which, when coupled in layers of 20 + 40 mm, reach sound-absorbing performances close to those of the same configuration of panels type D for frequencies higher than 800 Hz. Alternatively, a systematic investigation may be useful to detect the thresholds values of the concrete parameters (e.g., paste volume) in order to obtain acceptable mechanical properties and still preserve highly efficient acoustical properties.
The study highlights the necessity to develop a higher number of experimental investigations by controlling the variables of the mix design in more systematic way. This approach has been possible to follow only through model applications as in [45].

5. Conclusions

The present study has been carried out in order to characterize the sound absorbing performances of a set of porous concrete panels varying in concrete mix design (A–D), thickness and mounting method. The measurements have been conducted in the 1:5 scale reverberation room of the Politecnico di Torino, in accordance with the ISO 354-1:2003 standard. The sound absorbing performances of the different panels have been described as 1/3 octave band and as weighted sound absorption coefficient αw. The following conclusions have been drawn.
(i)
The mix design with the smallest round lightweight aggregate dimensions (0.5–1 mm), referred to as panel D, gave the most effective sound absorption coefficient for all the three sample thicknesses as well as for the mounting condition with an air gap at their back. It was shown that the worst performing mix design feature round lightweight aggregate with the greater dimensions (4–8 mm) referred to as panel B.
(ii)
Samples with crushed normal weight aggregates of 4–8 mm, referred to as panel A, showed higher values of absorption coefficients compared to samples with round lightweight aggregates of the same dimensions. The performance is comparable to that of the sample with round lightweight aggregates of smaller gradation (2–4 mm) referred to as panel C. This was attributed to the pores dimensions and inner distribution which affects the pores tortuosity.
(iii)
The sound-absorbing performances of the porous concrete panels tend to increase at low frequencies for greater panel thicknesses. In most cases, solutions with single panels or double-layered panels of an equivalent thickness provide similar performances. This mounting solution could be useful in practice for modular solutions and to limit the need for different formwork thicknesses.
(iv)
The mounting method is shown to greatly influence the sound-absorbing performances. For all porous concrete types considered, the sound absorption performances are enhanced for lower frequencies by leaving a 50 mm air gap behind the panel. However, the air gap significantly lowers the high frequencies performance of the thinnest samples (20 mm).
(v)
The frequency dependent absorption coefficient and the weighted absorption coefficient αw comparisons showed that, depending on the mounting method, the performance of the concrete samples with aggregate dimensions of 0.5–1 mm, i.e., panel D, can be further improved. The αw reaches values 0.50 and 0.75 for the condition with an empty air gap of 50 mm and air gap completely filled with a rock wool layer, respectively. These values are comparable to those of most used conventional porous materials.
Note that the mix design mechanical properties remain a crucial aspect that need to be considered when the applicability of such materials is discussed. It was observed that the material with higher acoustic performance (round lightweight aggregate of 0.5–1 mm) presents poor performances related to wear resistance, which makes the application of such panels in actual scenario impractical. Therefore, we endorse further testing in the attempt to find the most performing solution balancing sound absorption with wear resistance performances. Alternatively, when wear resistance is required, it is possible to use panels of type B and C, which, when coupled in layers of 20 + 40 mm, reach sound-absorbing performances close to those of the same configuration of panels type D for frequencies higher than 800 Hz.
Further research could be conducted along this line of research to explore other mix design and mounting method strategies to hopefully increase awareness about the potential benefits of the application of sound absorbing porous concrete in the frame of the architectural and urban design strategies. Such research may include (1) acoustic absorption of materials with blended aggregates of different dimensions, weights and shapes, (2) acoustic absorption for alternative mounting methods, (3) acoustic absorption modeling of porous concrete of single layers and multilayer structure, and (4) possible applications in case studies for outdoor and indoor environments.

Author Contributions

Conceptualization, L.S., A.A., G.V., and D.Z.; methodology, L.S. and A.A.; formal analysis, L.S. and E.B.; investigation, L.S. and E.B.; resources, G.V. and D.Z.; data curation, L.S. and E.B.; writing—original draft preparation, L.S. and E.B.; writing—review and editing, L.S., A.A., E.B., and G.V.; visualization, L.S. and E.B.; supervision, L.S. and A.A.; project administration, L.S., A.A., and G.V.; funding acquisition, A.A. and L.S. All authors have read and agreed to the published version of the manuscript.

Funding

The work has been funded by CEMEX Innovation Holding AG.

Institutional Review Board Statement

Not applicable.

Informed Consent Statement

Not applicable.

Data Availability Statement

Not applicable.

Acknowledgments

The authors are grateful to Marta Bivanti and Giuseppe Vannelli for their contribution to the small-scale reverberation room measurements. They would like to thank the colleagues of CEMEX Innovation Holding AG who helped in manufacturing the samples.

Conflicts of Interest

The authors declare no conflict of interest.

Appendix A

Summary of the main findings of past studies on the effect on sound absorption of aggregate size.
Table A1. Summary of the main findings of past studies on the effect on sound absorption of aggregate size, dimensions and type, and panel thickness. Abbreviations used in the table body: lightweight (LW); normal weight (NW); limestone (LS); aggregate (aggr.); sound absorption (α).
Mix Design
Variable
Effect [Refs]DetailsMethodMain Findings
Aggregate sizeInfluence [11]0–2 mm/1–5 mm/1–3 mmSingle sized1–3 mm and 1–5 mm aggr. result in higher α
Influence [19,21]2.36–4.75 mm/4.75–9.5 mm/9.5–12 mmSingle sizedConcrete with 2.36–4.75 mm and 4.75–9.5 mm aggr. provide higher α than that with 9.5–12 mm aggr.
BlendedThe effect of blending aggr. on α varies depending on the aggr. size. Best performance with blends of 2.36–4.75 mm and 4.75–9.5 mm aggr.
Limited
influence [22]
4–8 mm/8–12 mm/12–19 mmSingle sizedSlight increase in α for smaller aggr. (4–8 mm) compared to bigger ones
Influence [12,13]>5 mm/1.25–5 mm/<1.25 mmSingle sizedConcrete with aggr. dimensions >5 mm feature higher α than alternatives with smaller aggr.
LayeredThree-layered solutions with the aggr. dimensions (from exterior layer) of >5 mm/1.25–5 mm/<1.25 mm result in the higher α
No influence [22]8–13 mm/13–19 mmLayeredThe variation of aggr. dimensions in the back layer does not affect the α
Aggregate
material
Influence [11]Expanded perlite/slag/clay ceramsiteSingle typeExpanded perlite aggr. provides the highest α with respect to slag and clay ceramsite
Expanded perlite/slag% replacementThe α decrease with the relative increase in content of slag over expanded perlite aggr.
LayeredThe combination of 8 cm slag (lower layer) and 12 cm expanded perlite (upper layer) is the most performing one among those considered
Influence [22]LW + NW aggr./only LW aggr.LayeredLayered solution with LW aggr. in the exterior layer and NW aggr. in the back layer outperform single layer with LW aggr.
Limited
influence [22]
NW/LW aggr.Single typeA slight increase in α is reported for crushed NW aggr. in comparison to rounded LW ones with similar sizes. The results do not seem consistent when varying the thickness of the concrete panel
Influence [13]Bottom ash vs. normal aggr.Single typeBottom ash concrete results in higher or comparable α than a typical porous concrete sample
Influence [23]Crumb rubber/fine normal aggr.% replacementReplacing fine aggr. with crumb rubber ones increase α, for increasing percentages of replacement (up to 20%)
Influence [24]Bottom ash/recycled/LS aggr.% replacementThe replacement of LS aggr. with bottom ash and recycled aggr. result in higher α; the 2 nd peak shifts towards the higher frequencies for higher percentages of replacement
No influence [20]Recycled aggr./LS aggr.% replacementWith equal target void ratio, the effect of replacing LS aggr. with recycled ones had very slight influence
Influence [25]Cenosphere additionSingle typeThe increase of volume fraction of cenospheres result in increased α from 0 to 20 to 40%; further increases result in lower performance
Aggregate shapeLimited
influence [22]
Crushed/rounded aggr.Single typeA slight increase of α is reported for crushed NW aggregates in comparison to rounded LW ones with similar sizes. The results do not seem consistent when varying the thickness of the concrete panel
ThicknessInfluence [13,18,21]Panel thickness
variation
Single layerThe peak of the α is displaced to lower frequencies for increasing panel thicknesses

Appendix B

Graphs supplemental to the results provided as a direct comparison between different concrete typologies regarding thickness variation, multilayer combination, and mounting condition over an airgap.
Figure A1. Comparison of the absorption coefficients for samples A–D with different thicknesses. Sample A: crushed normal weight aggregates 4–8 mm; Sample B: round lightweight aggregates 4–8 mm; Sample C: round lightweight aggregates 2–4 mm; Sample D: round lightweight aggregates 0.5–1 mm.
Applsci 11 04835 g0a1
Figure A2. Comparison of the absorption coefficients for samples A–D with different thicknesses obtained from multiple layer combinations (20 + 20 and 20 + 40 mm). Sample A: crushed normal weight aggregates 4–8 mm; Sample B: round lightweight aggregates 4–8 mm; Sample C: round lightweight aggregates 2–4 mm; Sample D: round lightweight aggregates 0.5–1 mm.
Applsci 11 04835 g0a2
Figure A3. Comparison of the absorption coefficients for samples A–D with different thicknesses (20 and 40 mm) mounted over an airgap of 50 mm. Sample A: crushed normal weight aggregates 4–8 mm; Sample B: round lightweight aggregates 4–8 mm; Sample C: round lightweight aggregates 2–4 mm; Sample D: round lightweight aggregates 0.5–1 mm.
Applsci 11 04835 g0a3

References

  1. Sanchez, G.M.E.; Van Renterghem, T.; Thomas, P.; Botteldooren, D. The Effect of Street Canyon Design on Traffic Noise Exposure along Roads. Build. Environ. 2016, 97, 96–110. [Google Scholar] [CrossRef] [Green Version]
  2. Badino, E.; Manca, R.; Shtrepi, L.; Calleri, C.; Astolfi, A. Effect of Façade Shape and Acoustic Cladding on Reduction of Leisure Noise Levels in a Street Canyon. Build. Environ. 2019, 157, 242–256. [Google Scholar] [CrossRef]
  3. Calleri, C.; Shtrepi, L.; Armando, A.; Astolfi, A. Evaluation of the Influence of Building Façade Design on the Acoustic Characteristics and Auditory Perception of Urban Spaces. Build. Acoust. 2018, 25, 77–95. [Google Scholar] [CrossRef]
  4. Taghipour, A.; Sievers, T.; Eggenschwiler, K. Acoustic Comfort in Virtual Inner Yards with Various Building Facades. Int. J. Environ. Res. Public Health 2019, 16, 249. [Google Scholar] [CrossRef] [PubMed] [Green Version]
  5. Yang, W.; Jeon, J.Y. Design Strategies and Elements of Building Envelope for Urban Acoustic Environment. Build. Environ. 2020, 182. [Google Scholar] [CrossRef]
  6. Adams, T. Sound Materials; Frame Publisher: Amsterdam, The Netherlands, 2016; ISBN 94-92311-01-1. [Google Scholar]
  7. Cox, T.J.; D’Antonio, P. Acoustic Absorbers and Diffusers: Theory, Design and Application, 3rd ed.; Taylor & Francis: Abingdon-on-Thames, UK, 2017; ISBN 978-0-367-65841-0. [Google Scholar]
  8. Neithalath, N.; Weiss, J.; Olek, J. Characterizing Enhanced Porosity Concrete Using Electrical Impedance to Predict Acoustic and Hydraulic Performance. Cem. Concr. Res. 2006, 36, 2074–2085. [Google Scholar] [CrossRef]
  9. Ibrahim, A.; Mahmoud, E.; Yamin, M.; Patibandla, V.C. Experimental Study on Portland Cement Pervious Concrete Mechanical and Hydrological Properties. Constr. Build. Mater. 2014, 50, 524–529. [Google Scholar] [CrossRef]
  10. Scholz, M.; Grabowiecki, P. Review of Permeable Pavement Systems. Build. Environ. 2007, 42, 3830–3836. [Google Scholar] [CrossRef]
  11. Zhao, C.; Wang, P.; Wang, L.; Liu, D. Reducing Railway Noise with Porous Sound-Absorbing Concrete Slabs. Adv. Mater. Sci. Eng. 2014, 2014, 1–11. [Google Scholar] [CrossRef] [Green Version]
  12. Arenas, C.; Vilches, L.F.; Cifuentes, H.; Leiva, C.; Vale, J.; Fernández-Pereira, C. Development of Acoustic Barriers Mainly Composed of Co-Combustion Bottom Ash. In Proceedings of the World of Coal Ash (WOCA) Conference, Denver, CO, USA, 9–12 May 2011. [Google Scholar]
  13. Arenas, C.; Leiva, C.; Vilches, L.F.; Cifuentes, H. Use of Co-Combustion Bottom Ash to Design an Acoustic Absorbing Material for Highway Noise Barriers. Waste Manag. 2013, 33, 2316–2321. [Google Scholar] [CrossRef] [PubMed]
  14. ACI Committee 522-10. Report on Pervious Concrete; American Concrete Institute: Farmington Hills, MI, USA, 2010; ISBN 978-0-87031-364-6. [Google Scholar]
  15. Kovác, M.; Sicáková, A. Pervious Concrete as a Sustainable Solution for Pavementsin Urban Areas. In Proceedings of the 10th International Conference “Environmental Engineering”; VGTU Technika, Vilnius, Lithuania, 27–28 April 2017. [Google Scholar]
  16. Kosmatka, S.H.; Wilson, M.L. Design and Control. of Concrete Mixtures, 15th ed.; Portland Cement Association: Skokie, IL, USA, 2011; Volume EB001, ISBN 0-89312-272-6. [Google Scholar]
  17. Tie, T.S.; Mo, K.H.; Putra, A.; Loo, S.C.; Alengaram, U.J.; Ling, T.-C. Sound Absorption Performance of Modified Concrete: A Review. J. Build. Eng. 2020, 30, 101219. [Google Scholar] [CrossRef]
  18. Neithalath, N. Development and Characterization of Acoustically Efficient Cementitious Materials. Ph.D. Thesis, Purdue University, West Lafayette, IN, USA, 2004. [Google Scholar]
  19. Neithalath, N.; Weiss, J.; Olek, J. Improving the Acoustic Absorption of Enhanced Porosity Concrete with Fiber Reinforcement. In Proceedings of the International RILEM Symposium on Concrete Science and Engineering: A Tribute to Arnon Bentur, Evanston, IL, USA, 21–24 March 2004; Kovler, K., Marchand, J., Mindess, S., Weiss, J., Eds.; RILEM Publications SARL: Paris, France, 2004. [Google Scholar]
  20. Park, S.B.; Seo, D.S.; Lee, J. Studies on the Sound Absorption Characteristics of Porous Concrete Based on the Content of Recycled Aggregate and Target Void Ratio. Cem. Concr. Res. 2005, 35, 1846–1854. [Google Scholar] [CrossRef]
  21. Marolf, A.; Neithalath, N.; Sell, E.; Wegner, K.; Weiss, J.; Olek, J. Influence of Aggregate Size and Gradation on Acoustic Absorption of Enhanced Porosity Concrete. ACI Mater. J. 2004, 101, 82–91. [Google Scholar]
  22. Kim, H.K.; Lee, H.K. Influence of Cement Flow and Aggregate Type on the Mechanical and Acoustic Characteristics of Porous Concrete. Appl. Acoust. 2010, 71, 607–615. [Google Scholar] [CrossRef]
  23. Sukontasukkul, P. Use of Crumb Rubber to Improve Thermal and Sound Properties of Pre-Cast Concrete Panel. Constr. Build. Mater. 2009, 23, 1084–1092. [Google Scholar] [CrossRef]
  24. Ngohpok, C.; Sata, V.; Satiennam, T.; Klungboonkrong, P.; Chindaprasirt, P. Mechanical Properties, Thermal Conductivity, and Sound Absorption of Pervious Concrete Containing Recycled Concrete and Bottom Ash Aggregates. KSCE J. Civ. Eng. 2018, 22, 1369–1376. [Google Scholar] [CrossRef]
  25. Tiwari, V.; Shukla, A.; Bose, A. Acoustic Properties of Cenosphere Reinforced Cement and Asphalt Concrete. Appl. Acoust. 2004, 65, 263–275. [Google Scholar] [CrossRef]
  26. Fediuk, R.; Amran, M.; Vatin, N.; Vasilev, Y.; Lesovik, V.; Ozbakkaloglu, T. Acoustic Properties of Innovative Concretes: A Review. Materials 2021, 14, 398. [Google Scholar] [CrossRef]
  27. EN 933-2:2020. Tests for Geometrical Properties of Aggregates. Part. 2: Determination of Particle Size Distribution-Test. Sieves, Nominal Size of Apertures; The British Standards Institution: London, UK, 2020. [Google Scholar]
  28. EN 1097-6:2013. Tests for Mechanical and Physical Properties of Aggregates. Part. 6: Determination of Particle Density and Water Absorption; The British Standards Institution: London, UK, 2013. [Google Scholar]
  29. ASTM C1754/C1754M. Standard Test. Method for Density and Void Content of Hardened Pervious Concrete; ASTM International: West Conshohocken, PA, USA, 2012. [Google Scholar]
  30. EN 12390-5:2019. Testing Hardened Concrete. Part 5: Flexural Strength of Test. Specimens; The British Standards Institution: London, UK, 2019. [Google Scholar]
  31. ASTM D2434−19. Test. Method for Permeability of Granular Soils (Constant Head); ASTM International: West Conshohocken, PA, USA, 2019. [Google Scholar]
  32. ISO 354:2003. Acoustics-Measurement of Sound Absorption in a Reverberation Room; International Organization for Standardization: Geneva, Switzerland, 2003. [Google Scholar]
  33. ISO 17497-1:2004. Acoustics-Sound-Scattering Properties of Surfaces. Part 1: Measurement of the Random-Incidence Scattering Coefficient in a Reverberation Room; International Organization for Standardization: Geneva, Switzerland, 2004. [Google Scholar]
  34. Shtrepi, L.; Astolfi, A.; D’Antonio, G.; Vannelli, G.; Barbato, G.; Mauro, S.; Prato, A. Accuracy of the Random-Incidence Scattering Coefficient Measurement. Appl. Acoust. 2016, 106, 23–35. [Google Scholar] [CrossRef]
  35. Shtrepi, L.; Prato, A. Towards a Sustainable Approach for Sound Absorption Assessment of Building Materials: Validation of Small-Scale Reverberation Room Measurements. Appl. Acoust. 2020, 165, 107304. [Google Scholar] [CrossRef]
  36. ITA-Toolbox for MATLAB® v.R2018b; Developed at the Institute of Technical Acoustics at RWTH Aachen University; RWTH Aachen University: Aachen, Genmary, 2018.
  37. ISO 9613-1:1993. Acoustics-Attenuation of Sound during Propagation Outdoors. Part 1: Calculation of the Absorption of Sound by the Atmosphere; International Organization for Standardization: Geneva, Switzerland, 1993. [Google Scholar]
  38. Bartel, T.W. Effect of Absorber Geometry on Apparent Absorption Coefficients as Measured in a Reverberation Chamber. J. Acoust. Soc. Am. 1981, 69, 1065–1074. [Google Scholar] [CrossRef]
  39. Embleton, T.F.W. Absorption Coefficients of Surfaces Calculated from Decaying Sound Fields. J. Acoust. Soc. Jpn. 1971, 50. [Google Scholar] [CrossRef]
  40. Scrosati, C. Towards More Reliable Measurements of Sound Absorption Coefficient in Reverberation Rooms: An Inter-Laboratory Test. Appl. Acoust. 2020, 165, 107298. [Google Scholar] [CrossRef]
  41. ISO 11654:1997. Acoustics-Sound Absorbers for Use in Buildings–Rating of Sound Absorption; International Organization for Standardization: Geneva, Switzerland, 1997. [Google Scholar]
  42. Ahmad, S.; Azad, A.K.; Loughlin, K.F. A Study of Permeability and Tortuosity of Concrete. In Proceedings of the 30th Conference on Our World in Concrete and Structures (OWICS), Singapore, 23–24 August 2005. [Google Scholar]
  43. Liu, Z.; Zhan, J.; Fard, M.; Davy, J.L. Acoustic Properties of Multilayer Sound Absorbers with a 3D Printed Micro-Perforated Panel. Appl. Acoust. 2017, 121, 25–32. [Google Scholar] [CrossRef]
  44. Maa, D.-Y. Microperforated-Panel Wideband Absorbers. Noise Control Eng. J. 1987, 29, 77–84. [Google Scholar] [CrossRef]
  45. Kim, H.K.; Lee, H.K. Acoustic Absorption Modeling of Porous Concrete Considering the Gradation and Shape of Aggregates and Void Ratio. J. Sound Vib. 2010, 329, 866–879. [Google Scholar] [CrossRef]
  46. Kephalopoulos, S.; Paviotti, M.; Anfosso-Lédée, F. Common Noise Assessment Methods in Europe (CNOSSOS-EU); Publications Office of the European Union: Luxembourg, 2012. [Google Scholar]
  47. Calleri, C.; Astolfi, A.; Shtrepi, L.; Prato, A.; Schiavi, A.; Zampini, D.; Volpatti, G. Characterization of the Sound Insulation Properties of a Two-Layers Lightweight Concrete Innovative Façade. Appl. Acoust. 2019, 145, 267–277. [Google Scholar] [CrossRef]
  48. Kousis, I.; Pisello, A.L. For the Mitigation of Urban Heat Island and Urban Noise Island: Two Simultaneous Sides of Urban Discomfort. Environ. Res. Lett. 2020, 15, 103004. [Google Scholar] [CrossRef]
Figure 1. Sample (A): crushed normal weight aggregates 4–8 mm; Sample (B): round lightweight aggregates 4–8 mm; Sample (C): round lightweight aggregates 2–4 mm; Sample (D): round lightweight aggregates 0.5–1 mm.
Applsci 11 04835 g001
Figure 2. Multiple layers of 20 + 20 mm and 20 + 40 mm. Sample (A): crushed normal weight aggregates 4–8 mm; Sample (B): round lightweight aggregates 4–8 mm; Sample (C): round lightweight aggregates 2–4 mm; Sample (D): round lightweight aggregates 0.5–1 mm.
Applsci 11 04835 g002
Figure 3. Mounting on 50 mm air gap. Sample (A): crushed normal weight aggregates 4–8 mm; Sample (B): round lightweight aggregates 4–8 mm; Sample (C): round lightweight aggregates 2–4 mm; Sample (D): round lightweight aggregates 0.5–1 mm.
Applsci 11 04835 g003
Figure 4. (a) 30 mm and (b) 50 mm rock wool filling 50 mm air gap. (c) Sample D of 20 mm over one of the two conditions.
Applsci 11 04835 g004
Figure 5. Comparison of the absorption coefficients for samples (AD) with different thicknesses obtained from multiple layer combinations (20, 40, 20 + 20, 60, and 20 + 40 mm). Sample (A): crushed normal weight aggregates 4–8 mm; Sample (B): round lightweight aggregates 4–8 mm; Sample (C): round lightweight aggregates 2–4 mm; Sample (D): round lightweight aggregates 0.5–1 mm.
Applsci 11 04835 g005
Figure 6. Back surface for Sample (A): crushed normal weight aggregates 4–8 mm; Sample (B): round lightweight aggregates 4–8 mm; Sample (C): round lightweight aggregates 2–4 mm; Sample (D): round lightweight aggregates 0.5–1 mm.
Applsci 11 04835 g006
Figure 7. Comparison of the absorption coefficients for samples (AD) of different thicknesses (20 and 40 mm) mounted with an air gap of 50 mm. Sample (A): crushed aggregates 4–8 mm; Sample (B): round lightweight aggregates 4–8 mm; Sample (C): round lightweight aggregates 2–4 mm; Sample (D): round lightweight aggregates 0.5–1 mm.
Applsci 11 04835 g007
Figure 8. Sample D single layer of 20 mm combined with an air gap of 50 mm filled with a rock wool layer of 30 and 50 mm.
Applsci 11 04835 g008
Table 1. Four mix design of porous concrete characteristics with respect to: aggregate size, aggregate particle density, void ratio, flexural strength, previous concrete density, and water permeability.
ConcretesAggregate
Typology
Aggregate Size
[mm]
Aggregate Particle
Density [kg/m3]
Void Ratio
[%]
Flexural
Strength [MPa]
Pervious Concrete Density [kg/m3]Water
Permeability [mm/s]
Acrushed
normal weight aggregates
4–82650 ± 3025 ± 23.5 ± 0.51955 ± 209.5 ± 1.1
Bround
lightweight
aggregates
4–8905 ± 8525 ± 31.5 ± 0.3932 ± 3510.9 ± 1.7
Cround
lightweight
aggregates
2–4325 ± 3525 ± 21 ± 0.2514 ± 207.4 ± 0.9
Dround
lightweight
aggregates
0.5–1510 ± 7020 ± 20.5 ± 0.1682 ± 153.6 ± 0.5
Table 2. Summary of the tested samples and configurations of the porous concrete. Single layers have been tested in configurations of multiple layers, with air gap and with rock wool in the airgap (+tested and −untested configurations of single layers).
Concrete TypeOverall Thickness [mm]Layer Thickness [mm]Air Gap 50 mmRock Wool Thickness [mm]
Single LayerMultiple Layers
A2020 +-
404020 + 20+-
606020 + 40--
B2020 +-
404020 + 20+-
606020 + 40--
C2020 +-
404020 + 20+-
606020 + 40--
D2020 +-
30
50
404020 + 20+-
606020 + 40--
Table 3. Comparison of single acoustic indices related to the weighted absorption coefficient (αw) for the four concrete types (A–D).
Sample CharacteristicsABCD
20 mm0.100.100.100.20
40 mm0.150.250.150.30
60 mm0.250.250.250.45
20 + 20 mm0.150.250.150.30
20 + 40 mm0.200.250.250.40
20 mm + 50 mm air gap0.200.100.350.50
40 mm + 50 mm air gap0.200.100.300.50
20 mm + 50 mm air gap (rock wool 30 mm) 0.70
20 mm + 50 mm air gap (rock wool 50 mm) 0.75
Publisher’s Note: MDPI stays neutral with regard to jurisdictional claims in published maps and institutional affiliations.

