Article

Comfort Distance—A Single-Number Quantity Describing Spatial Attenuation in Open-Plan Offices

Acoustics Laboratory, Turku University of Applied Sciences, Joukahaisenkatu 3, FI-20520 Turku, Finland
*
Author to whom correspondence should be addressed.
Appl. Sci. 2021, 11(10), 4596; https://doi.org/10.3390/app11104596
Submission received: 27 April 2021 / Revised: 12 May 2021 / Accepted: 17 May 2021 / Published: 18 May 2021
(This article belongs to the Special Issue Advances in Architectural Acoustics)

Abstract

:
ISO 3382-3 is globally used to determine the room acoustic conditions of open-plan offices using in situ measurements. The key outcomes of the standard are three single-number quantities: distraction distance, rD, A-weighted sound pressure level of speech, Lp,A,S,4m, and spatial decay rate of speech, D2,S. Quantities Lp,A,S,4m and D2,S describe the attenuation properties of the office due to room and furniture absorption and geometry. Our purpose is to introduce a new single-number quantity, comfort distance rC, which integrates the quantities Lp,A,S,4m and D2,S. It describes the distance from an omnidirectional loudspeaker where the A-weighted sound pressure level of normal speech falls below 45 dB. The study explains why the comfort criterion level is set to 45 dB, explores the comfort distances in 185 offices reported in previous studies. Based on published data, the rC values lie typically within 3 m (strong attenuation) and 30 m (weak attenuation). Based on this data, a classification scheme was proposed. The new quantity could benefit the revised version of ISO 3382-3.

1. Introduction

Office noise and lack of speech privacy are among the environmental factors causing the largest dissatisfaction in open-plan offices [1]. One of the main reasons for this might be that work performance in concentration-demanding tasks has been found to improve with reducing intelligibility of irrelevant speech [2]. This is supported by the finding that disturbance due to noise was lower in offices having lower speech intelligibility [3]. Behavioral means can significantly affect the amount of irrelevant speech in offices, such as reducing speech effort, using high-quality headsets during phone meetings, or preferably to move to another room during such calls. Likewise, one can try to avoid the adverse effects of noise by moving to a silent environment during concentration-demanding work tasks. Room acoustic treatment can also reduce office noise. The disturbance caused by remote speech can be reduced by simultaneous application of sound absorbers (e.g., ceiling, walls, screens, and furniture), blocking of sound propagation (e.g., screens, and furniture), and electroacoustic sound masking [4]. Virjonen et al. [5] have shown that open-plan offices can significantly differ from each other with respect to acoustic quality. Therefore, the potential of solving noise problems in offices with room acoustic means is large.
ISO 3382-3 standard [6] was published in 2012 to promote the room acoustic design of offices. It describes a method for determining the room acoustic properties of open-plan offices using acoustic measurements. The measurement reports five single-number quantities (SNQs) that together fully describe the room acoustic performance of an open-plan office:
  • the spatial decay rate of A-weighted sound pressure level (SPL) of speech, D2,S [dB], i.e., the reduction of A-weighted SPL of speech when the distance to the speaker is doubled (Figure 1),
  • the A-weighted SPL of speech at 4 m distance from the speaker, Lp,A,S,4m [dB] (Figure 1),
  • distraction distance, rD [m], i.e., the distance from the speaker where Speech Transmission Index, STI, falls below 0.50,
  • privacy distance, rP [m], i.e., the distance where Speech Transmission Index, STI, falls below 0.20, and
  • A-weighted SPL of the background noise of an unoccupied office, Lp,A,B.
ISO 3382-3 [6] defines the SPL of normal effort speech to be used in the determination of the abovementioned SNQs. This guarantees that different operators obtain similar measurement results from the same office as shown by the Round Robin test of Hongisto et al. [7]. D’Orazio et al. [8] reported measurement results from the office where the background noise level, Lp,A,B, varied even 13 dB within a single measurement path. ISO 3382-3 [6] states that the mean of LpA,B values along the measurement positions shall be used in the position-dependent STI determinations. In such special cases, the uncertainty of rD and rP may be higher than in the Round Robin test of Ref. [7] where the spatial distribution of background noise was smooth.
ISO 3382-3 [6] was largely based on the method described by Hongisto et al. [9], who studied 15 different open-plan offices. An extended version involving 16 offices was published later by Virjonen et al. [5]. They suggested the abovementioned SNQs that deal with spatial decay instead of temporal decay of sound since reverberation time was not associated with spatial decay rate in a non-diffuse sound field. Therefore, reverberation time did not belong to the reported SNQs of ISO 3382-3. Furthermore, they showed that the A-weighted SPL of speech was usually linearly associated with logarithmic distance. Because speech is the main noise source in offices, it was justified to focus on the spatial decay of A-weighted SPL of speech.
ISO 14257 [10] was an important role model in the development of ISO 3382-3 because the new quantities were revolutionary at that time when most room acousticians were used to measuring reverberation time and background noise levels in the first place. ISO 14257 [10] was among the first acoustic standards that focused on a non-diffuse sound field. It involved two SNQ’s that were considered during the standardization of ISO 3382-3: rate of spatial decay of SPL per distance doubling, DL2 [dB], and excess of SPL, DLf [dB]. The latter describes how much the spatial decay rate deviates from the free field. However, these quantities were determined in octave bands. Such a large amount of reported outcomes did not serve the purpose of ISO 3382-3 of providing simple and scarce SNQs as the main outcomes. Because it was evident from office surveys that speech is the main noise source, and that speech has a standardized spectrum shape and overall level, the approach of using A-weighted SPL of speech was justified. This led to the definition of D2,S as a primary quantity describing the spatial decay rate. However, it was not alone sufficient to describe the spatial decay since the sound attenuation in the nearfield varies a lot between offices due to different room height, screen height, and room absorption. Therefore, Lp,A,S,4m was chosen to be used as an anchor point for D2,S slope instead of DLf, since the former was easier to understand and determine. It should be noted that the SNQs of ISO 3382-3 had to be understandable also among non-acousticians involved with office design, such as building owners, workplace designers, material and furniture providers, authorities, facility managers, occupational physicists, ergonomists, HR people, managers, and office users.
During the standardization process, which lasted from 2009 to 2012, Nilsson and Hellström [11] proposed an alternative option to Lp,A,S,4m and DLf: the distance of comfort, dC [m]. It was the distance, where an acceptable A-weighted SPL of speech was achieved. It should be noted that dC is not an alternative quantity of distraction distance rD since dC is purely based on spatial attenuation of speech and it ignores the background noise level of the room, unlike rD. However, their approach did not gain support at that time since there was too little published evidence about the suitable dC values, and it was also based on DLf which was already discarded in ISO 3382-3. Furthermore, there was already some uncertainty about the acceptance of rD among acousticians and non-acousticians. It was found safer to limit the distance-related SNQs to rD and rP, which were derived from the spatial decay of STI.
Authors’ interactions with non-acousticians have learned that privacy-related SNQs, i.e., rD and rP, have been well understood. An important reason for this was a study, which showed that cognitive performance deteriorates with increasing STI, i.e., with reducing speech privacy [12]. A later important reason was a cross-sectional study showing that shorter rD was associated with a lower probability of being highly disturbed by office noise [3]. Against expectations, D2,S did not show any association with that probability. The most probable reason is that the latter ignores the effect of background noise (masking).
Authors’ experience has been that the attenuation-related SNQs, i.e., D2,S and Lp,A,S,4m, have been more difficult to understand by non-acousticians. The reason for this is that both quantities have the same unit but different definitions. It would be useful to have a simpler attenuation-related SNQ to facilitate communication with non-acousticians.
Seddigh et al. [13] described the room acoustic properties of their open-plan offices by comfort distance as introduced by Nilsson and Hellström [11]. They defined the comfort distance as the distance where the A-weighted SPL of speech falls below Lp,A,C = 48 dB. However, the comfort criterion level, Lp,A,C, was not based on a thorough analysis of the existing measurement data.
The A-weighted SPL of speech, Lp,A,S, depends linearly on logarithmic distance, r, from the speaker. Therefore, Lp,A,S can be determined from the linearly fitted SNQ values of ISO 3382-3 by
L p , A , S = L p , A , S , 4 m + 2 D 2 , S D 2 , S log 10 ( 2 ) log 10 ( r )
If Lp,A,S equals the comfort criterion level, Lp,A,C, the distance rC, where this is achieved, i.e., comfort distance, gets a general form:
r C = 2 ( L p , A , S , 4 m L p , A , C + 2 D 2 , S ) / D 2 , S
This form was recently used by Hongisto et al. [7]. They set the comfort criterion level to Lp,A,C = 45 dB. However, they did not describe the origin of that choice. Most importantly, the comfort distance can be calculated by the SNQs which are already determined in ISO 3382-3. Some countries already have mandatory target values or voluntary classification systems for the room acoustic quality of open-plan offices using the SNQs of ISO 3382-3 [14,15]. It would be useful to find suitable limiting values for the acoustic classes A–D also for comfortable distance. Because rC belongs among the key SNQs in the draft international standard ISO DIS 3382-3 [16], the elaboration of the scientific basis of rC is justified.
The purpose of our study is to present the scientific basis of comfort distance to better introduce it as a new SNQ in the revised version of ISO 3382-3 [6,16]. The second purpose was to compare the ISO 3382-3 [6] data reported in previous studies to calculate the range of typical comfort distance values using Equation (2). The third purpose was to propose limit values for the classification of comfort distance based on all available data.

2. Materials and Methods

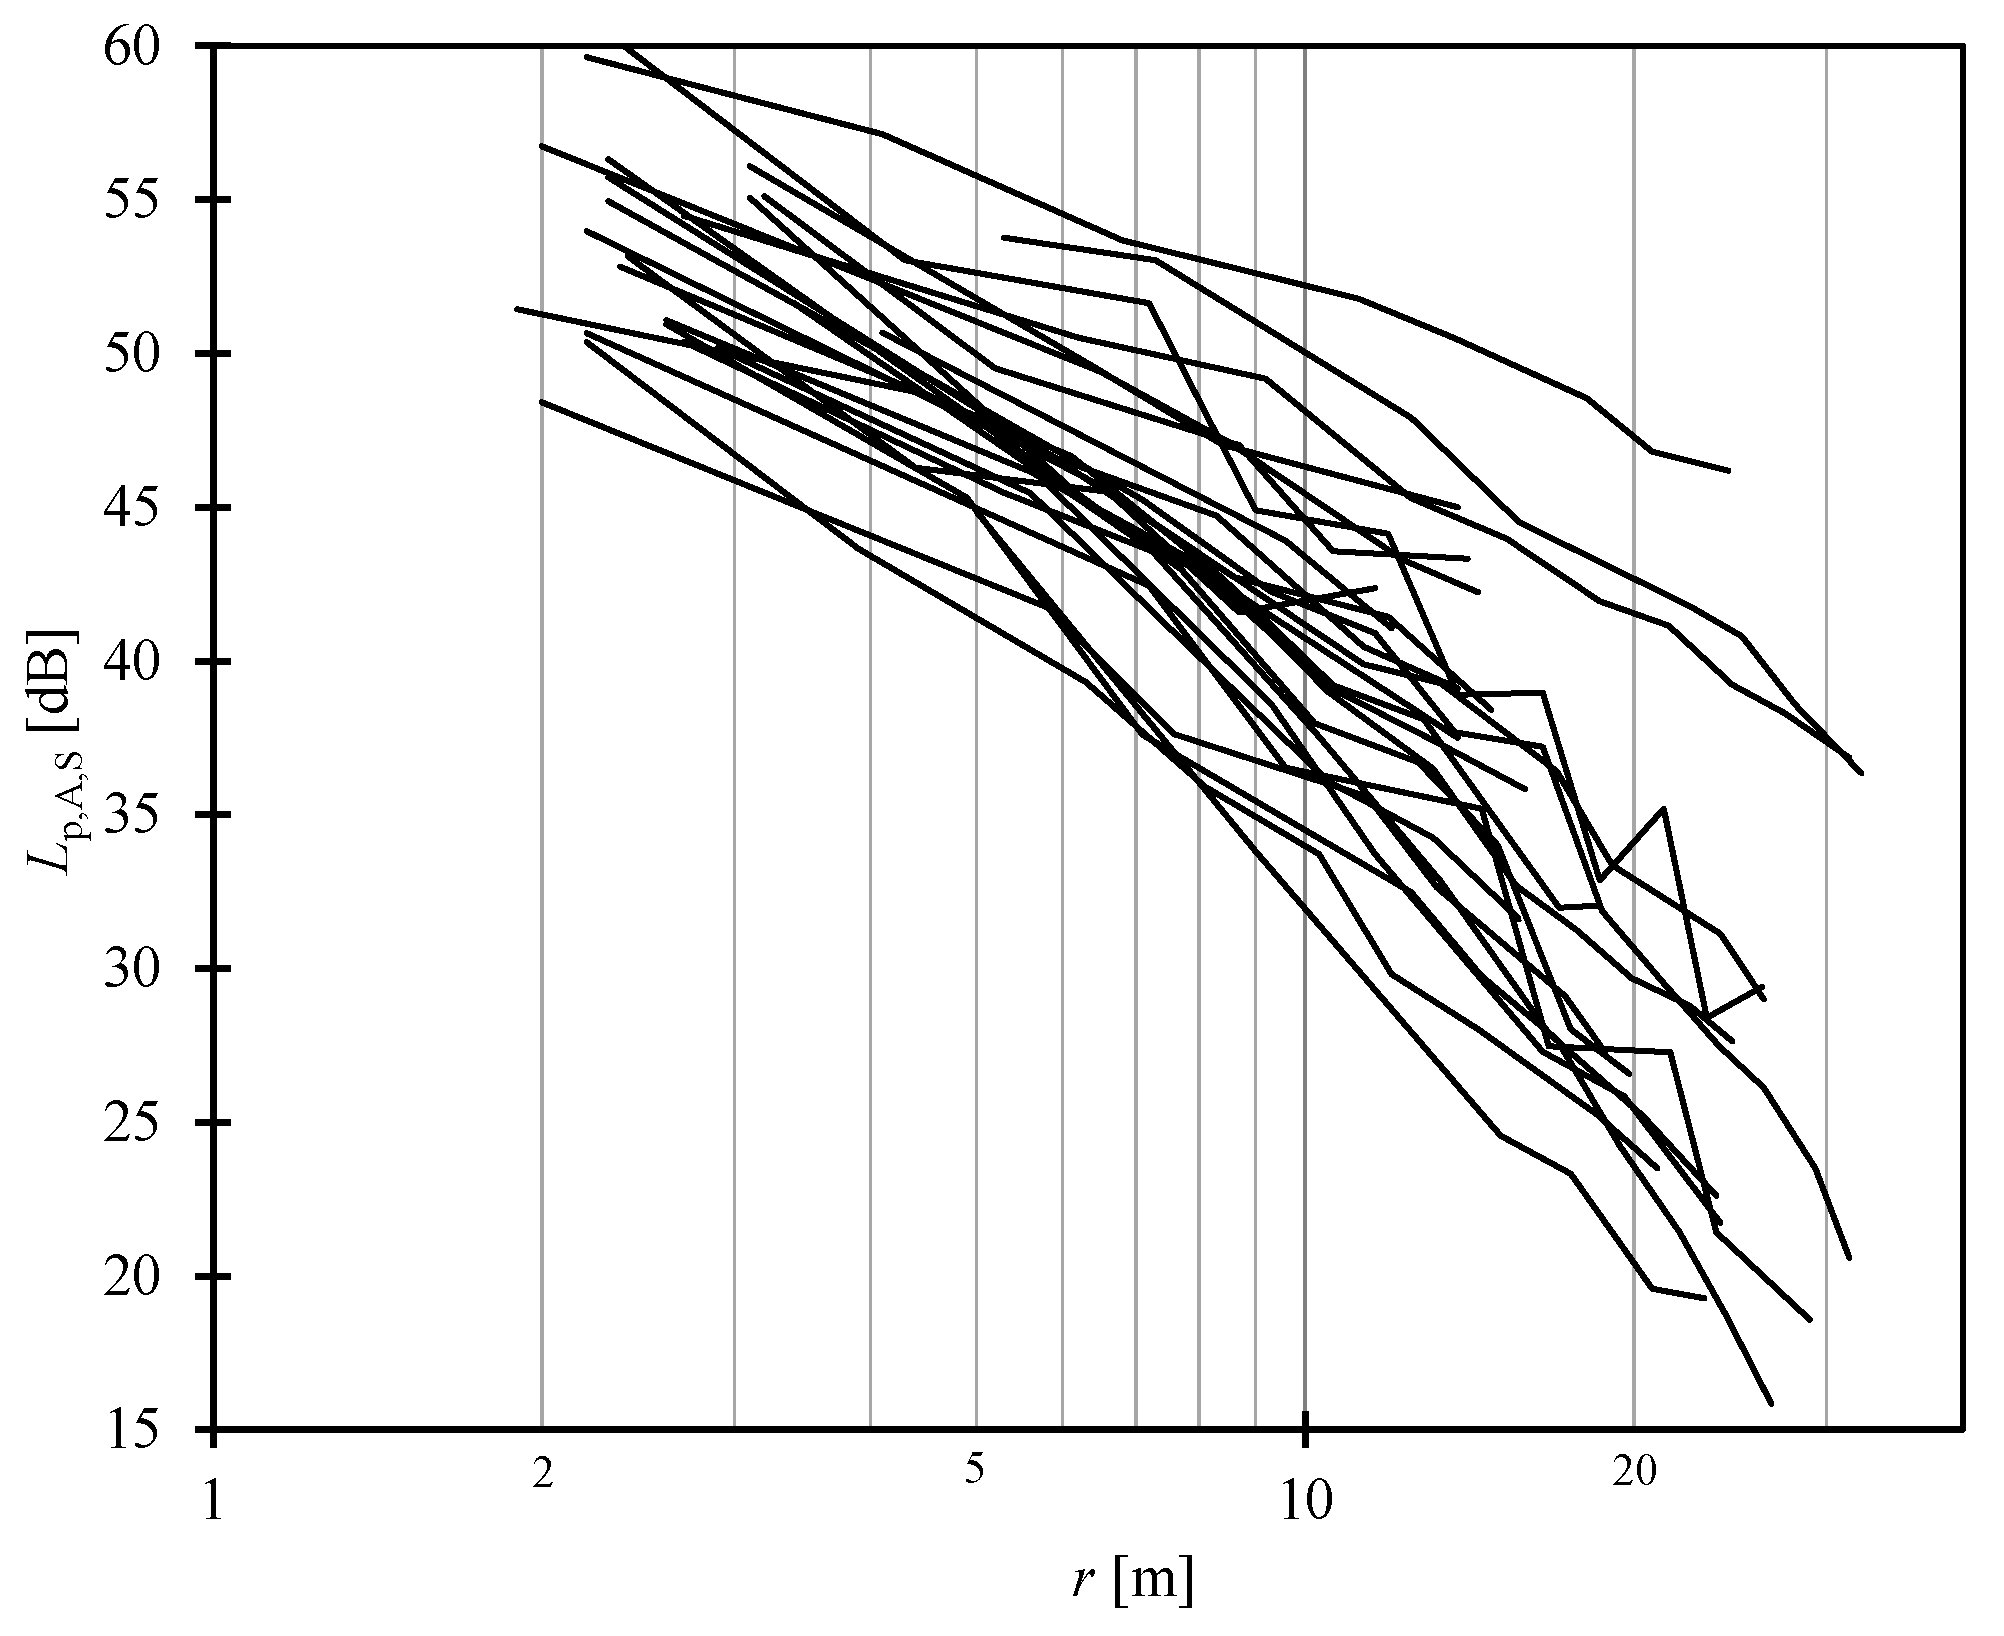
We utilized the measurement data of D2,S and Lp,A,S,4m of Keränen and Hongisto [17], which represents well the range of values where the SNQs of ISO 3382-3 could usually lie. They reported altogether 26 measurements in acoustically different open-plan offices (Table 1, Figure 2). Each measurement corresponds to a single path in one direction.
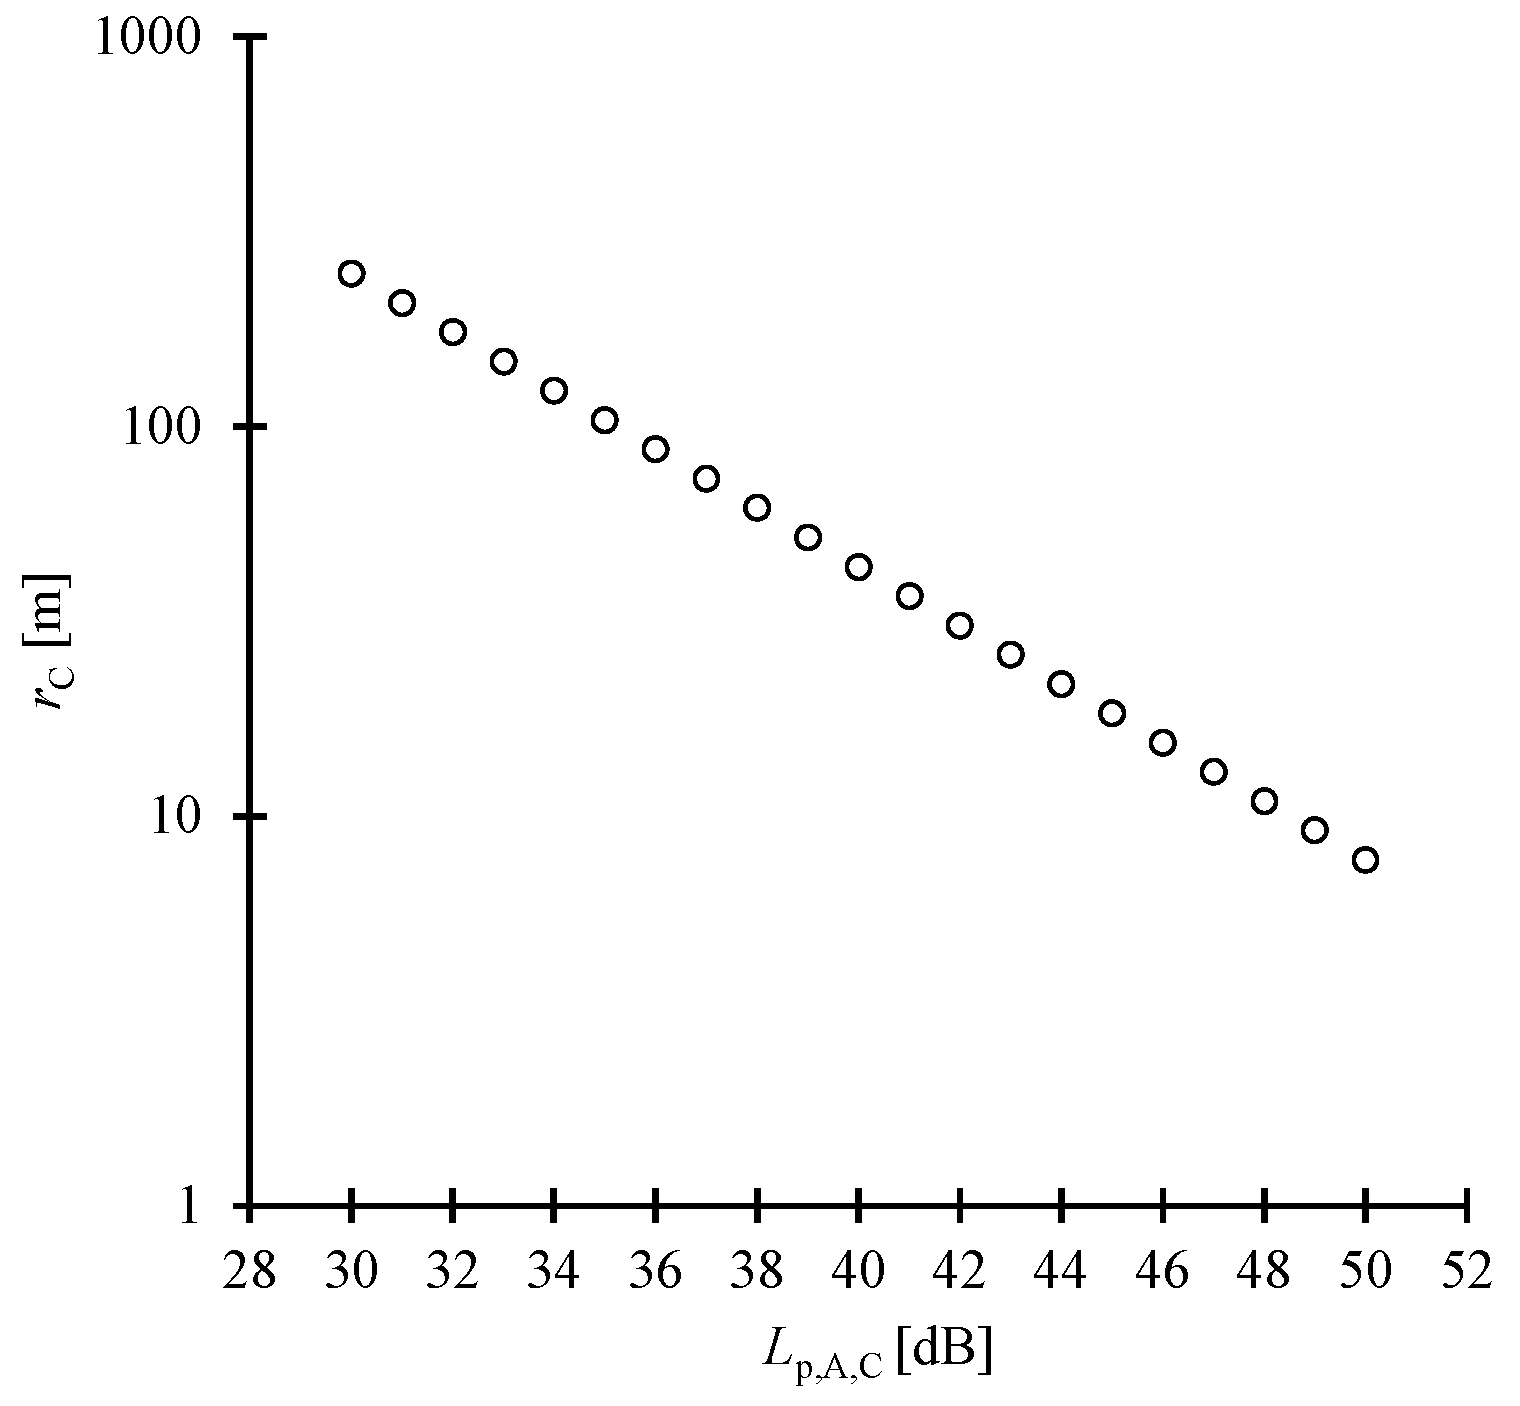
We determined the comfort distance for the 26 offices of Table 1 using 21 different values for the comfort criterion level, Lp,A,C. The values ranged from 30 to 50 dB in 1-dB steps. The calculation was made using Equation (2). The method is depicted in Figure 3 for office ID 1. This way, each office was assigned by 21 different comfort distances. Simple statistics (mean, minimum, maximum 68% confidence intervals) were determined at every comfort criterion level for the distribution of comfort distances over the 26 offices.
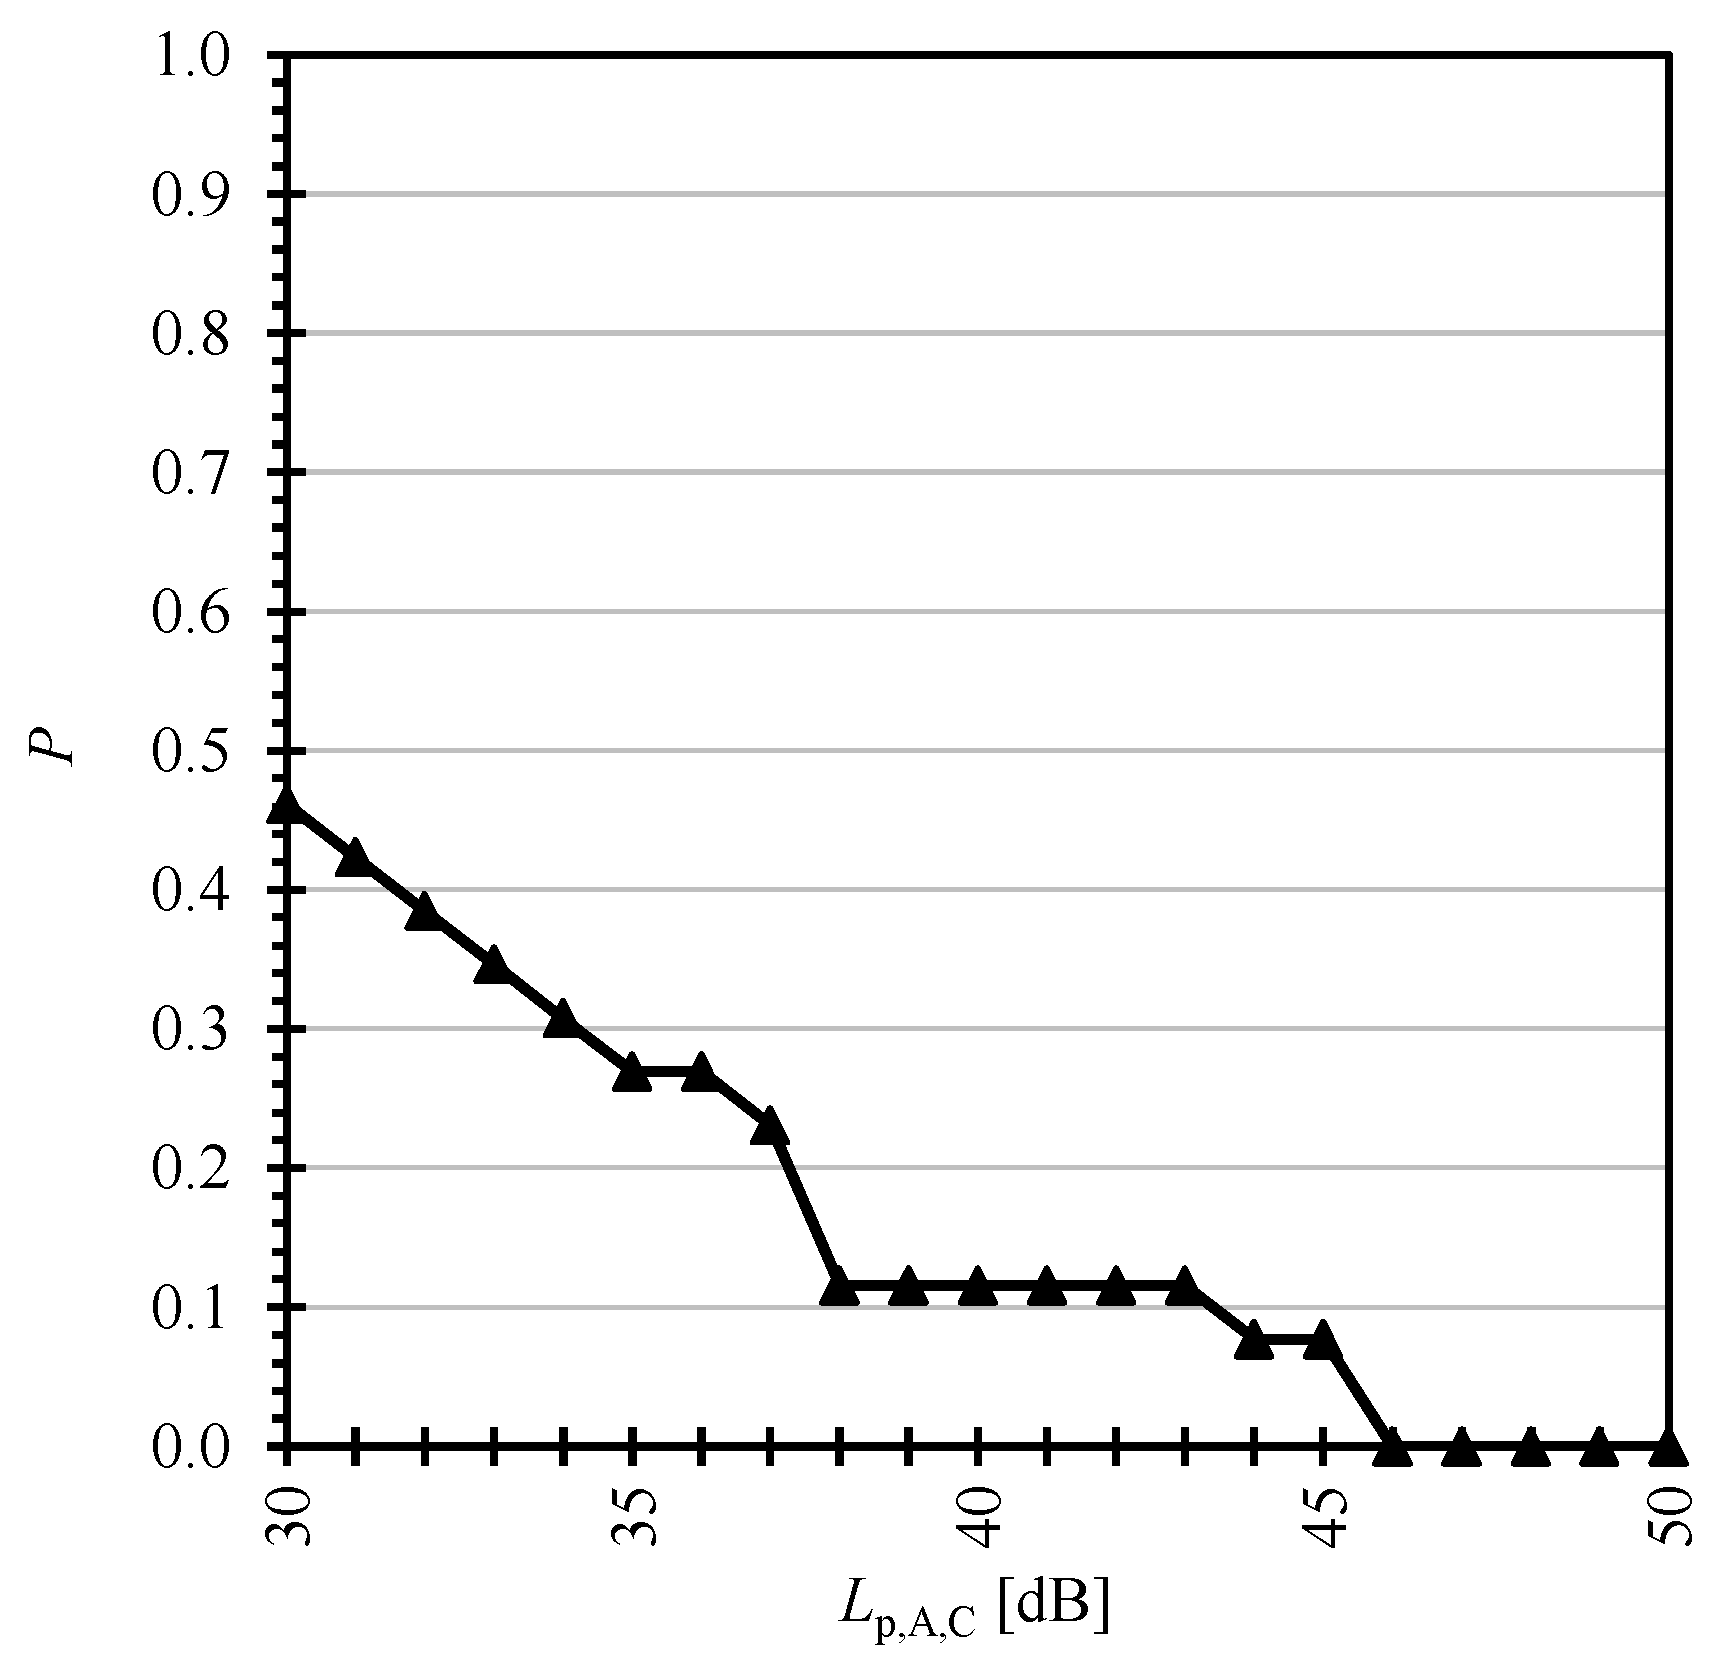
It was justified to presume in general that comfort distance should not be larger than the length of the office. Therefore, we calculated for every Lp,A,c value the probability P that the comfort distance rC was larger than the room length within the sample, by
P = N 0 N
where N0 is the number of offices (out of 26 offices in question) fulfilling the adverse criterion rC > L and N is the total number of offices (26). The room length L of each office is given in Table 1. The desirable situation is P = 0. It indicates a high probability that the comfort distance is shorter than a room in most offices beyond the sample of Table 1 since the sample of Table 1 represents a broad range of acoustically different offices.
Our second purpose involved a comparison between previous studies. Some important previous studies are described in Table 2.

3. Results

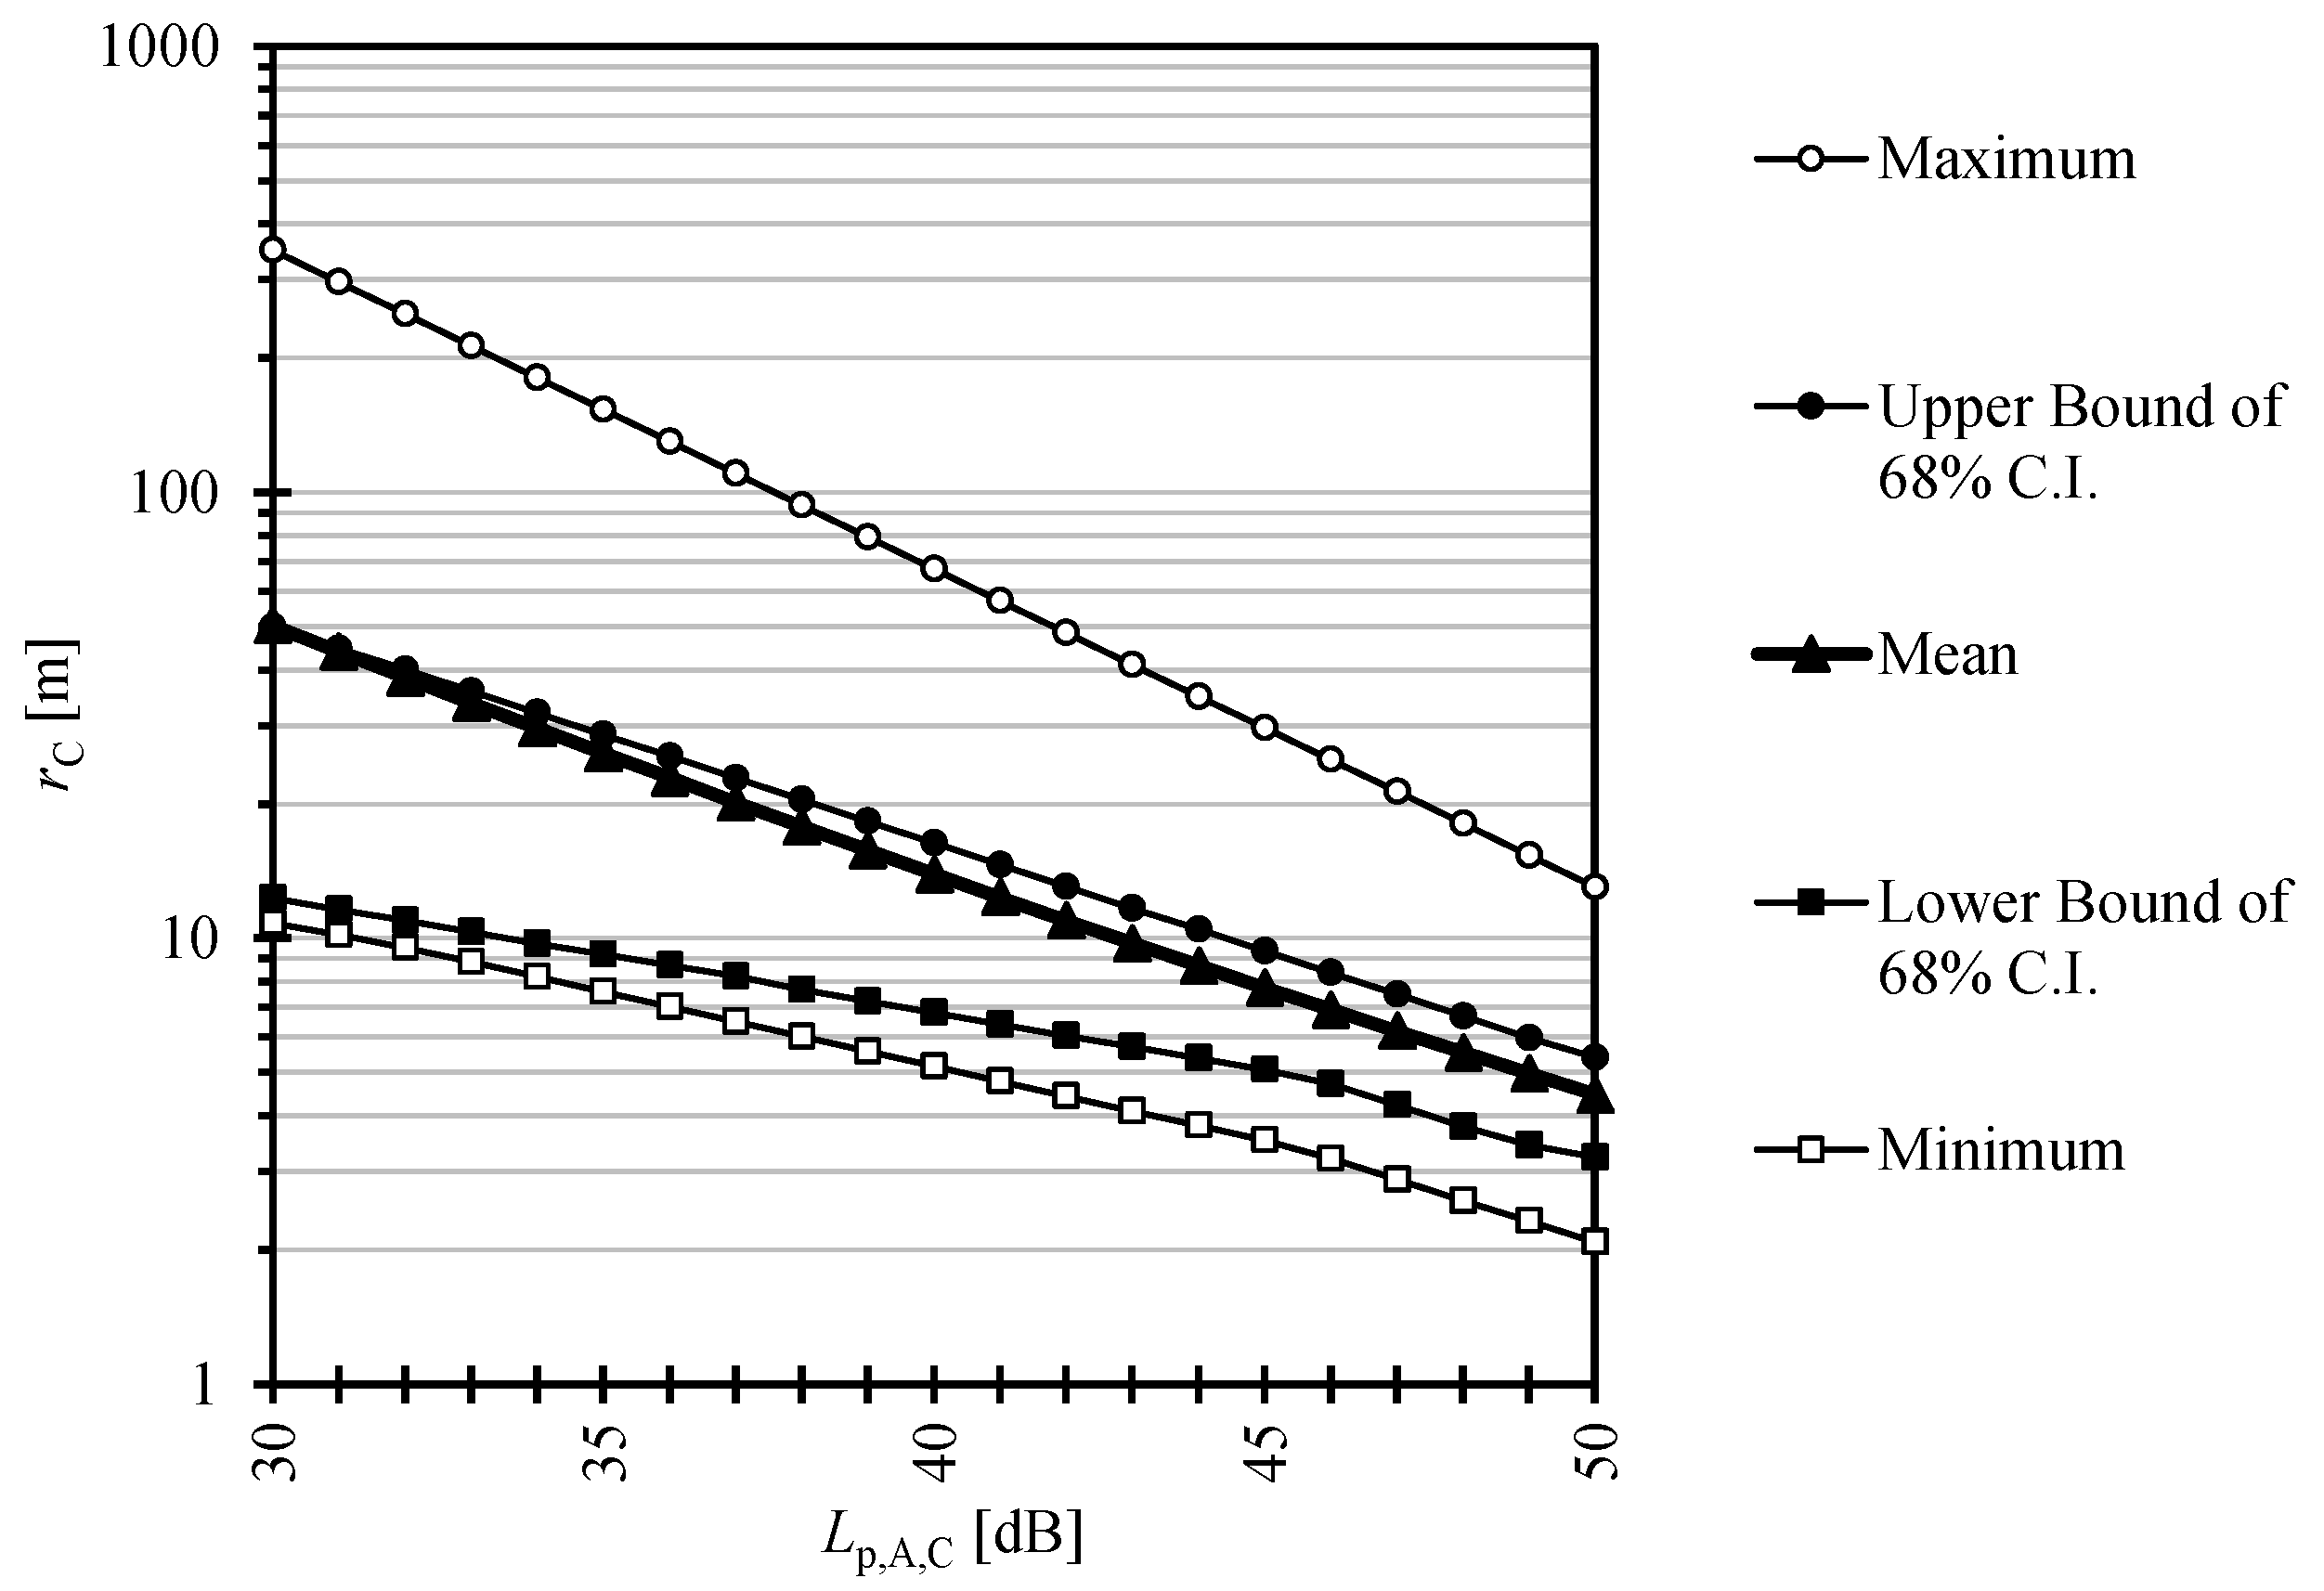
The comfort distances of the 26 offices of Ref. [17] for comfort criterion levels ranging from 30 to 50 dB are shown in Figure 4. The corresponding probabilities that the comfort distances exceeded the length of the office are shown in Figure 5.
Figure 5 clearly shows that the probability P reaches zero when Lp,A,C > 45 dB. Therefore, this value was chosen as the comfort distance criterion. Further justification for this choice is given in Section 4.
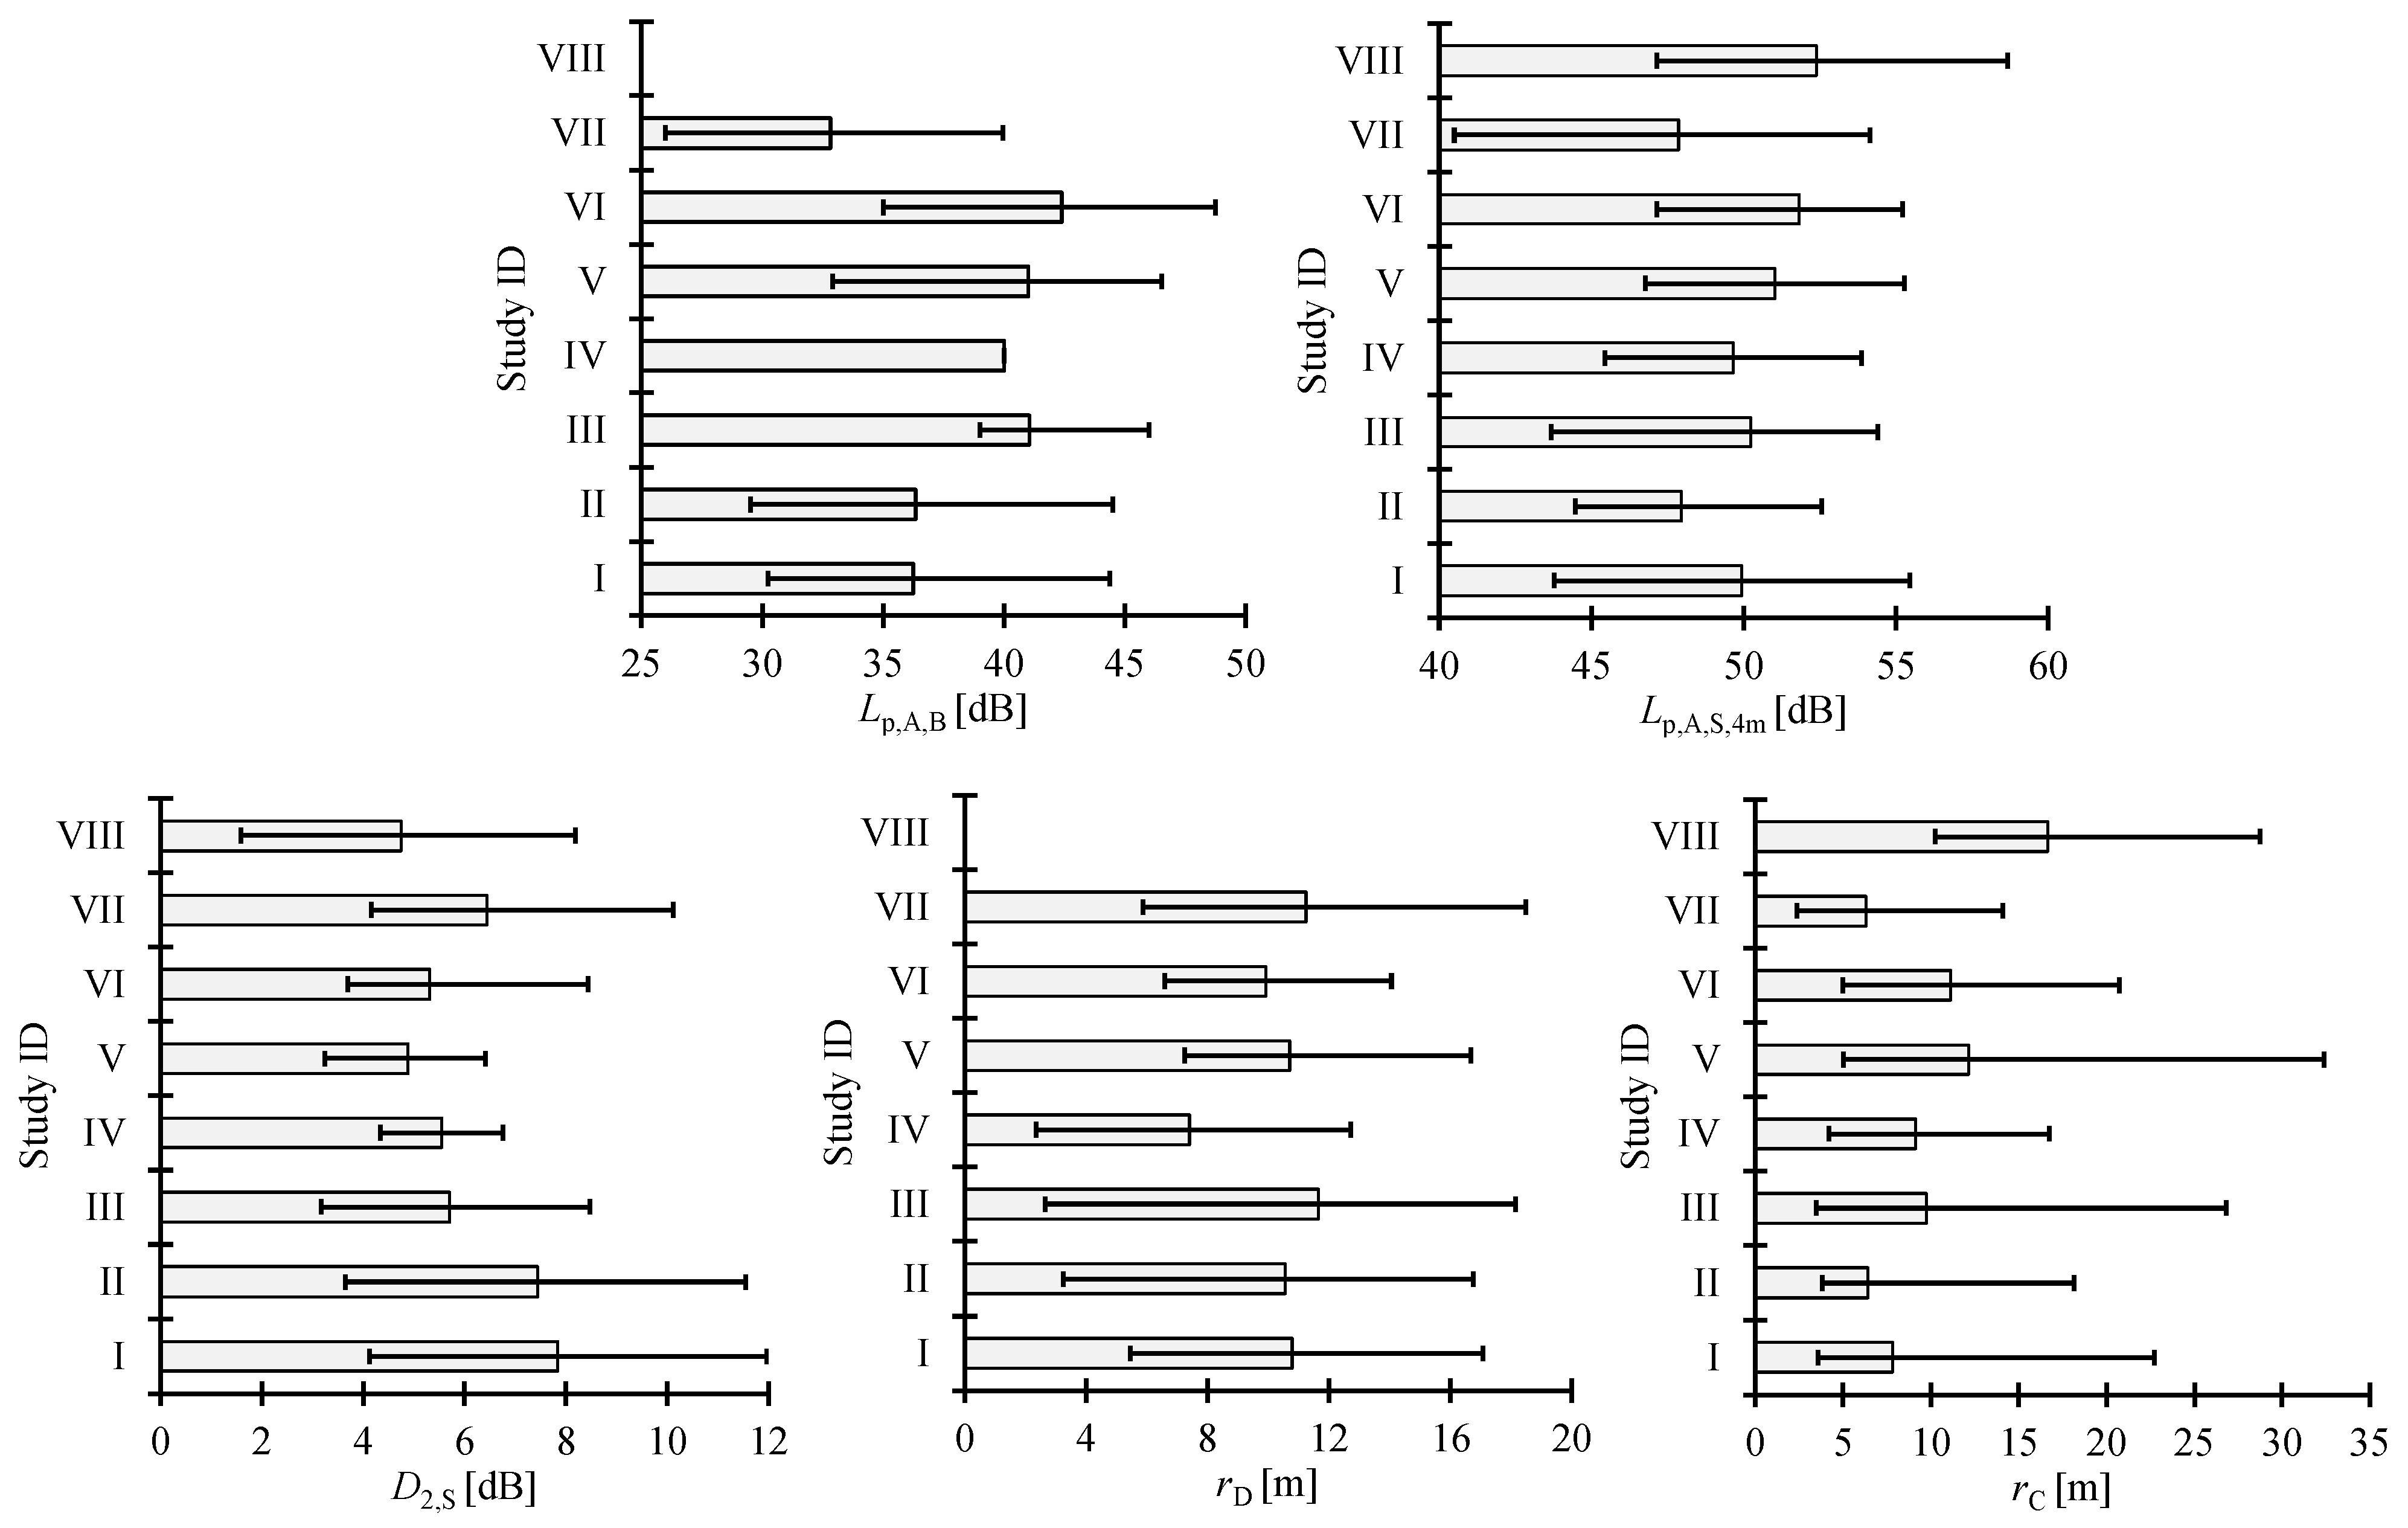
Figure 6 presents a statistical overview of the single-number values of ISO 3382-3 for the eight studies of Table 2 and the comfort distance calculated by Equation (2). The average of all 179 comfort distances was 9.3 m. The lower and upper bounds of the 68% and 95% confidence intervals were 4.7, 3.5, 13.8, and 25.3 m, respectively.
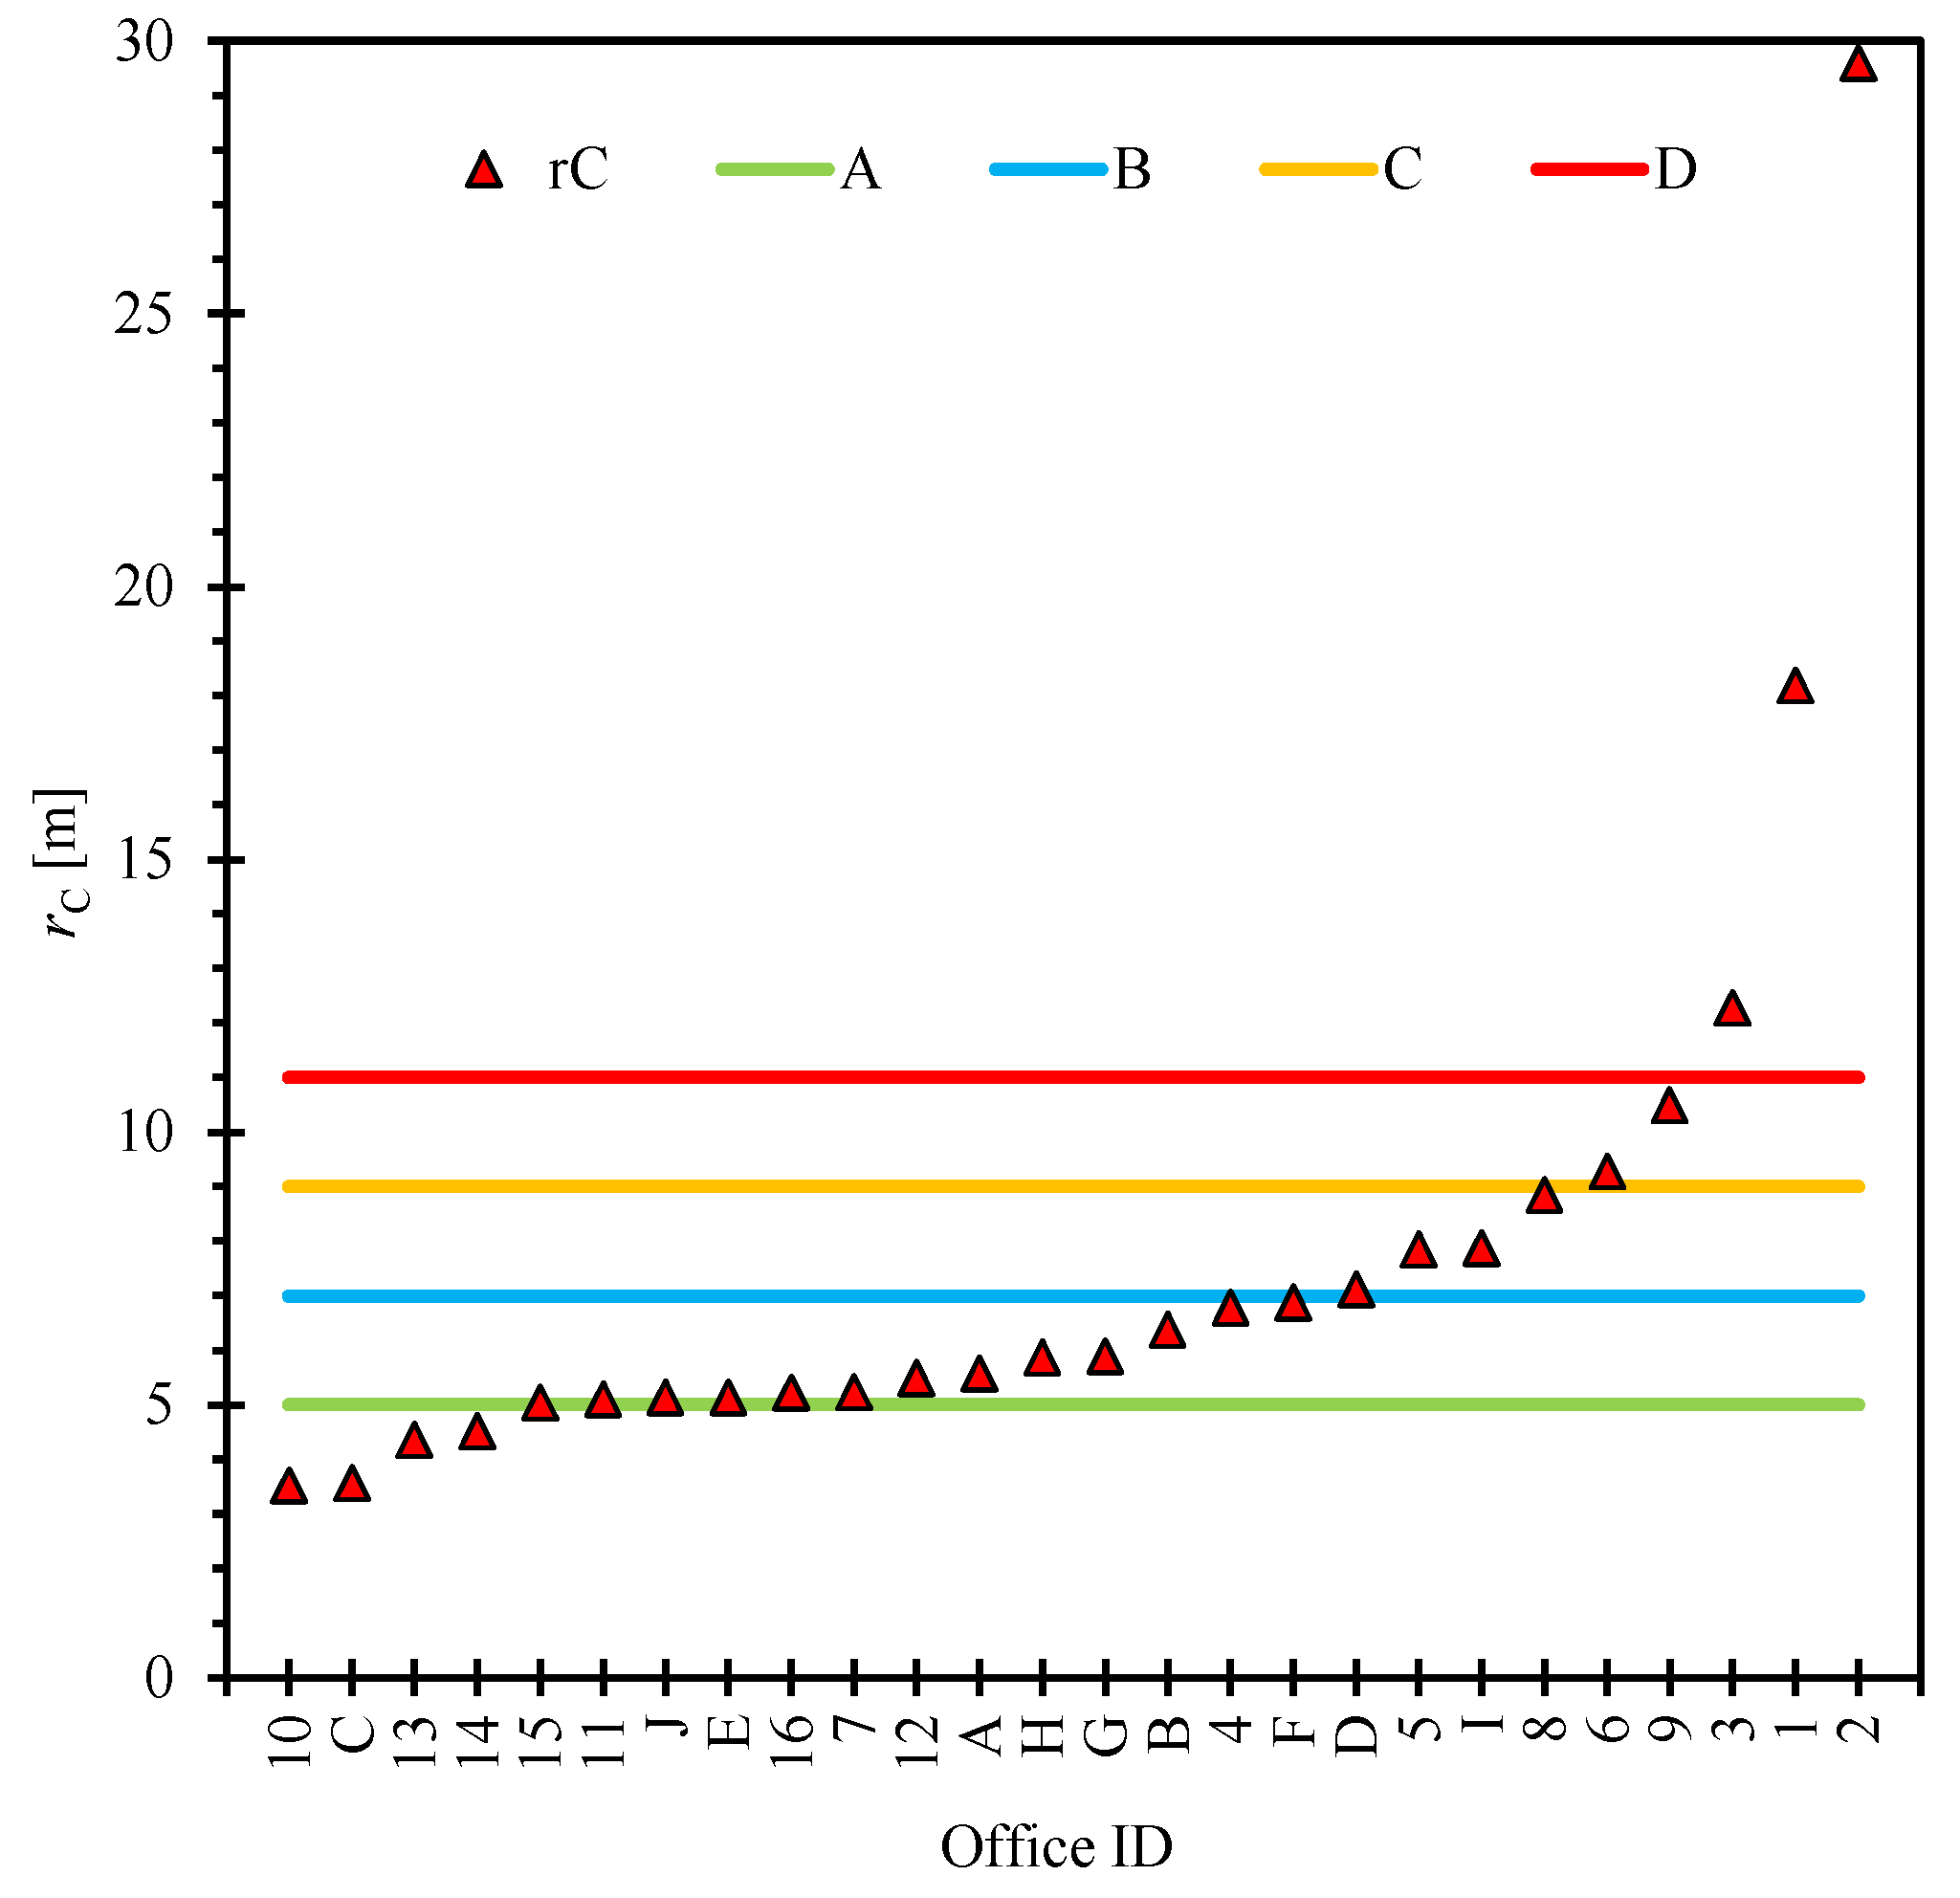
Figure 7 presents an analysis of how the acoustic classes A–D of comfort distance could be set in a balanced way for the 26 offices of Table 1. We paid attention to three criteria: each class involves at least two offices, the classes are equally spaced, and some offices (two worst ones) can remain unclassified. The limit values for classes A to D became 5, 7, 9, and 11 m for rC. The ranges for classes A–D are [0–5) m, [5–7) m, [7–9) m, and [9–11) m, respectively. Values of 11 m and higher are unclassified.
Using the same criteria, the proposed limit values for classes A to D became 11, 9, 7, and 5 dB for D2,s, 47, 49, 51, and 53 dB for Lp,A,S,4m, and 6, 8, 10, and 12 m for rD.

4. Discussion

As expected, comfort distance increased strongly when the comfort criterion level Lp,A,C was reduced. Noise annoyance of broadband steady-state noise is usually low when the level is below 35 dB LAeq [22]. Using this level as a comfort criterion level is not justified since the comfort distance would exceed 50 m in most offices of our sample. On the other hand, setting the comfort criterion level to 48 dB, as Seddigh et al. [13] did, is not justified since such a high level is probably no longer perceived as comfortable. For example, Veitch et al. [23] and Hongisto et al. [24,25] suggested that the level of sound masking should not exceed 45 dB LAeq to avoid the triggering of noise annoyance due to masking sound itself. It is also notable that Bottalico et al. [26] showed that people start to raise voice effort due to the Lombard effect when the background noise level exceeds 43.3 dB LAeq. This supports the use of a comfort criterion level lower than 48 dB. The mean levels during the workday are usually 48–59 dB LAeq,8h according to a major survey of offices [27]. This supports also that 48 dB might not be comfortable since it exceeds the average activity noise level. The probability of comfort distance being larger than room length reached zero when the comfort criterion level was 46 dB or larger. Thus, setting the comfort criterion level higher than 45 dB is not supported from this practical viewpoint. In conclusion, it is feasible to set the comfort criterion level at most to Lp,A,C = 45 dB. Among the 26 open-plan offices of Ref. [17], the mean value of rC was 7.8 m and the values ranged from 3.5 to 30.0 m, when Lp,A,c = 45 dB.
Figure 6 involves a broad perspective over the eight studies of Table 2. If laboratory study VIII is ignored due to the small room size, the rest of the studies indicate a somewhat similar distribution of comfort distances as Study I [17], where the classification scheme was based upon. All eight studies suffer from selection bias: offices have not been randomly selected from the building population. Because of that, none of the studies declare that their data represents the general distribution of acoustic quality in their country. In this light, Figure 6 also suggests that the distribution of room acoustic properties of open-plan offices do not drastically differ from each other in different countries. Figure 6 also represents the best available knowledge on the room acoustics of open-plan offices at the global level. It would be important to systematically analyze the target values and measurement results also from other countries to see the progress in room acoustic design at a global level. This would help in the development of research, business, design guidelines, and target values in the future.
The classification scheme was created using three criteria explained in Section 3. The scheme may look demanding with respect to the distribution shown in Figure 6 since only a minority of offices can reach class A. For example, an office representing the mean of the 26 offices of Ref. [17], i.e., rC = 7.8 m, reaches only class C. Informative (non-mandatory) annex of international standard draft ISO DIS 3382-3 [16] describes that “Typical values of rC with poor and good room acoustic conditions are rC > 11 m and rC < 5 m, respectively”. This description is supported by our proposal.

5. Conclusions

The scientific basis of comfort distance was introduced. Comfort distance was calculated using the single-number values of D2,S and Lp,A,S,4m determined according to in situ measurements by ISO 3382-3 [6]. Comfort distance describes the distance where A-weighted SPL of normal effort speech falls below 45 dB. The mean value of comfort distance was 7.8 m in our database containing 26 offices. The values ranged from 3 to 30 m.
A classification scheme was presented according to which the best class (A) is reached when comfort distance is shorter than 5 m. The worst class (D) is reached when the comfort distance is between 9–11 m. Values above 11 m are unclassified.
Comfort distance could be used as an option in the revised ISO 3382-3 standard to facilitate the comparison of open-plan offices with respect to speech attenuation performance and to facilitate the communication of measurement results with non-acousticians. Furthermore, comfort distance enables the classification of speech attenuation performance using a single quantity instead of two quantities.

Author Contributions

Conceptualization, V.H.; methodology, V.H. and J.K.; validation, J.K.; formal analysis, V.H.; investigation, V.H. & J.K.; resources, V.H.; data curation, V.H. and J.K.; writing—original draft preparation, V.H. and J.K.; writing—review and editing, V.H. and J.K.; visualization, V.H.; supervision, V.H.; project administration, V.H.; funding acquisition, V.H. Both authors have read and agreed to the published version of the manuscript.

Funding

This research was funded by ACADEMY OF FINLAND (grant No. 314788) and Turku University of Applied Sciences.

Institutional Review Board Statement

Not applicable.

Informed Consent Statement

Not applicable.

Conflicts of Interest

The authors declare no conflict of interest. The funders had no role in the design of the study; in the collection, analyses, or interpretation of data; in the writing of the manuscript, or in the decision to publish the results.

References

  1. Frontczak, M.; Schiavon, S.; Goins, J.; Arens, E.; Zhang, H.; Wargocki, P. Quantitative relationships between occupant satisfaction aspects of indoor environmental quality and building design. Indoor Air 2012, 22, 119–131. [Google Scholar] [CrossRef] [Green Version]
  2. Haapakangas, A.; Hongisto, V.; Liebl, A. The relation between the intelligibility of speech and cognitive performance—A revised model based on laboratory studies. Indoor Air 2020, 30, 1130–1146. [Google Scholar] [CrossRef] [PubMed]
  3. Haapakangas, A.; Hongisto, V.; Eerola, M.; Kuusisto, T. Distraction distance and disturbance by noise—An analysis of 21 open-plan offices. J. Acoust. Soc. Am. 2017, 141, 127–136. [Google Scholar] [CrossRef] [PubMed]
  4. Keränen, J.; Hongisto, V.; Hakala, J. The effect of sound absorption and screen height on spatial decay of speech in open-plan offices. Appl. Acoust. 2020, 166, 107340. [Google Scholar] [CrossRef]
  5. Virjonen, P.; Keränen, J.; Hongisto, V. Determination of acoustical conditions in open-plan offices—Proposal for new measurement method and target values. Acta Acust. Acust. 2009, 95, 279–290. [Google Scholar] [CrossRef] [Green Version]
  6. International Standard ISO 3382-3:2012 Acoustics—Measurement of Room Acoustic Parameters—Part 3: Open Plan Offices; International Organization for Standardization: Geneve, Switzerland, 2012.
  7. Hongisto, V.; Keränen, J.; Labia, L.; Alakoivu, R. Precision of ISO 3382-2 and ISO 3382-3—A Round-Robin test in an open-plan office. Appl. Acoust. 2021, 175, 107846. [Google Scholar] [CrossRef]
  8. D’Orazio, D.; Rossi, E.; Garai, M. Comparison of different in situ measurements techniques of intelligibility in an open-plan office. Build. Acoust. 2018, 25, 111–122. [Google Scholar] [CrossRef]
  9. Hongisto, V.; Virjonen, P.; Keränen, J. Determination of acoustical conditions of open offices—Suggestions for acoustic classification. In Proceedings of the 19th International Congress on Acoustics, Madrid, Spain, 2–7 September 2007. [Google Scholar]
  10. International Standard ISO 14257:2001. Acoustics—Measurement and Parametric Description of Spatial Sound Distribution Curves in Workrooms for Evaluation of Their Acoustical Performance; International Organization for Standardization: Geneve, Switzerland, 2001.
  11. Nilsson, E.; Hellström, B. Room acoustic design in open-plan offices. In Proceedings of the Euronoise, Edinburgh, UK, 26–28 October 2009. [Google Scholar]
  12. Hongisto, V. A model predicting the effect of speech of varying intelligibility on work performance. Indoor Air 2005, 15, 458–468. [Google Scholar] [CrossRef] [PubMed]
  13. Seddigh, A.; Berntson, E.; Jönsson, F.; Bodin Danielson, C.; Westerlund, H. Effect of variation in noise absorption in open-plan office: A field study with a cross-over design. J. Environ. Psychol. 2015, 44, 34–44. [Google Scholar] [CrossRef] [Green Version]
  14. Selzer, J.; Schelle, F. Practical aspects of measuring acoustics in German open plan offices. In Proceedings of the Euronoise, Crete, Greece, 27–31 May 2018; pp. 1919–1924. [Google Scholar]
  15. Hongisto, V.; Keränen, J. Open-plan offices—New Finnish room acoustic regulations. In Proceedings of the Euronoise, Crete, Greece, 27–31 May 2018. [Google Scholar]
  16. Draft International Standard. ISO DIS 3382-3:2021 Acoustics—Measurement of Room Acoustic Parameters—Part 3: Open Plan Offices; International Organization for Standardization: Geneve, Switzerland, 2021.
  17. Keränen, J.; Hongisto, V. Prediction of the spatial decay of speech in open-plan offices. Appl. Acoust. 2013, 74, 1315–1325. [Google Scholar] [CrossRef]
  18. Wenmaekers, R.; Van Hout, N. How ISO 3382-3 acoustic parameter values are affected by furniture, barriers and sound absorption in a typical open plan office. In Proceedings of the 23rd International Congress on Acoustics, Aachen, Germany, 9–13 September 2019. [Google Scholar]
  19. Cabrera, D.; Yadav, M.; Protheroe, D. Critical methodological assessment of the distraction distance used for evaluating room acoustic quality of open-plan offices. Appl. Acoust. 2018, 140, 132–142. [Google Scholar] [CrossRef]
  20. Yadav, M.; Cabrera, D.; Love, J.; Kim, J.; Holmes, J.; Caldwell, H.; de Dear, R. Reliability and repeatability of ISO 3382-3 metrics based on repeated acoustic measurements in open-plan offices. Appl. Acoust. 2019, 150, 138–146. [Google Scholar] [CrossRef]
  21. Lüthi, G.; Desarnaulds, V. Analysis of open plan acoustic parameters based on Swiss and international databases of in situ measurements. In Proceedings of the ICSV27, Prague, Czech Republik, 12–16 July 2020. [Google Scholar]
  22. Virjonen, P.; Hongisto, V.; Radun, J. Annoyance penalty of periodically amplitude-modulated wide-band sound. J. Acoust. Soc. Am. 2019, 146, 4159–4170. [Google Scholar] [CrossRef] [PubMed]
  23. Veitch, J.; Bradley, J.; Legault, L.; Norcross, S.; Svec, J. Masking Speech in Open-Plan Offices with Filtered Pink Noise Noise: Noise Level and Spectral Composition Effects on Acoustic Satisfaction; Internal Report IRC-846; Institute for Research in Construction: Ottawa, ON, Canada, 1 April 2002. [Google Scholar]
  24. Hongisto, V.; Oliva, D.; Rekola, L. Subjective and Objective Rating of Spectrally Different Pseudorandom Noises—Implications for Speech Masking Design. J. Acoust. Soc. Am. 2015, 137, 1344–1355. [Google Scholar] [CrossRef] [PubMed]
  25. Hongisto, V.; Varjo, J.; Oliva, D.; Haapakangas, A.; Benway, E. Perception of water-based masking sounds—Long-term experiment in an open-plan office. Front. Psychol. 2017, 8, 1117. [Google Scholar] [CrossRef] [PubMed]
  26. Bottalico, P.; Passione, I.I.; Graetzer, S.; Hunter, E.J. Evaluation of the Starting Point of the Lombard Effect. Acta Acust. Acust. 2017, 103, 169–172. [Google Scholar] [CrossRef] [PubMed] [Green Version]
  27. Yadav, M.; Cabrera, D.; Kim, J.; Fels, J.; de Dear, R. Sound in occupied open-plan offices: Objective metrics with a review of historical perspectives. Appl. Acoust. 2021, 177, 107943. [Google Scholar] [CrossRef]
Figure 1. A-weighted SPL, Lp,A, as a function of distance, r, to the speaker (black circles) and a linear fit over the data (dashed line). Definitions for D2,S, LpA,S,4m, and rC are given in Section 1. The data is not related to this study.
Applsci 11 04596 g001
Figure 2. Measured A-weighted SPL of speech, Lp,A,S, as a function of distance, r, from the omnidirectional loudspeaker, for the 26 open-plan offices of Table 1. The number of measurement positions per office ranged from 4 to 13. The required minimum number of positions is four.
Applsci 11 04596 g002
Figure 3. Example of the comfort distances, rC, obtained for office ID 1 for different comfort criterion levels, Lp,A,C, from 30 to 50 dB.
Applsci 11 04596 g003
Figure 4. The range of comfort distance values, rC, as a function of the comfort criterion level, Lp,A,C, for the 26 offices of Ref. [17] calculated by Equation (2). Mean, maximum, minimum, and 68% confidence interval (C.I.) within the sample of 26 offices are shown.
Applsci 11 04596 g004
Figure 5. The probability P among the 26 offices of Ref. [17] that the comfort distance, defined by comfort criterion level Lp,A,C, was larger than the room length.
Applsci 11 04596 g005
Figure 6. Distribution of measurement results according to ISO 3382-3 standard in the eight studies of Table 2. Bars are the means and whiskers are the 95% confidence intervals.
Applsci 11 04596 g006
Figure 7. Rank ordered comfort distance, rC, as a function of office ID (red triangles) for the 26 offices of Table 1. The proposed limits for classes A–D are indicated by horizontal lines. The figure expects that Lp,A,C = 45 dB.
Applsci 11 04596 g007
Table 1. The data of the 26 offices of Ref. [17] used in our study. L is the length of the office in the direction of the measurement path. The other quantities were defined in Section 1. The notation (both numbers and letters) is adopted from Ref. [17].
OfficeLLp,A,BLp,A,S,4mD2,SrD
ID[m][dB][dB][dB][m]
1163953.84.014.2
2274557.24.218.5
3164252.54.69.5
4604149.45.75.6
5183550.96.015.4
6364452.66.25.4
7193147.56.313.8
8193952.46.410.3
9424054.46.715.3
10233943.49.05.5
11343548.39.29.9
12323749.49.49.3
13363146.511.49.5
14353147.111.56.2
15703149.011.78.1
16273349.912.410.0
A183447.44.916.2
B333249.16.015.3
C692944.06.411.4
D173850.46.411.9
E233447.97.88.8
F163551.58.211.1
G363250.39.314.0
H283850.39.46.0
I303853.99.09.7
J333949.311.69.3
Table 2. Eight studies I–VIII reporting measurement data according to ISO 3382-3. N is the number of reported paths.
StudyIDNCountryComment
Keränen and Hongisto (2013) [17]I26Finlanda
Haapakangas et al. (2017) [3]II21Finlandb
Selzer and Schelle (2018) [14]III34Germanyc
Wenmaekers and van Hout (2019) [18]IV4Laboratoryd
Cabrera et al. (2018) [19]V20Australiae
Yadav et al. (2019) [20]VI36Australiaf
Lüthi and Desarnaulds (2020) [21]VII22Switzerlandg
Keränen et al. (2020) [4]VIII22Laboratoryh
a. 26 separate offices, one path per office; b. 21 separate offices, one path per office; c. 13 offices with 2 to 4 paths; d. Conditions were built by researchers in a real office, why it is called as a laboratory setup; e. 20 separate offices, one path per office; f. 27 offices with one path, 5 offices with two paths, 2 offices with three paths; g. 22 separate offices; h. Lp,A,B and rD were disregarded since background noise was adjustable. Mean of two paths. Six conditions with rC > 45 m were ignored.
Publisher’s Note: MDPI stays neutral with regard to jurisdictional claims in published maps and institutional affiliations.