Article

Application of Collision Warning Algorithm Alarm in Fishing Vessel’s Waterway

1
Ocean Science and Technology School, Korea Maritime and Ocean University, Busan 49112, Korea
2
Division of Navigation Convergence Studies, Korea Maritime and Ocean University, Busan 49112, Korea
3
Korea Maritime Institute, Busan 49111, Korea
4
SafeTechResearch, Inc., Daejeon 34050, Korea
5
Graduate School, Korea Maritime and Ocean University, Busan 49112, Korea
*
Author to whom correspondence should be addressed.
Appl. Sci. 2021, 11(10), 4479; https://doi.org/10.3390/app11104479
Submission received: 21 April 2021 / Revised: 10 May 2021 / Accepted: 11 May 2021 / Published: 14 May 2021

Abstract

:
The aim of this study is to apply a collision warning algorithm for a small fishing vessel in a fishing waterway to verify its alarm operation and to validate its feasibility. For this purpose, a scenario-based real ship test was conducted, and cases extracted from real sea data (Vpass data) were applied. Moreover, zones with frequent alarms and high-risk waters were compared. First, we installed millimeter-wave communication terminals in three small fishing vessels and applied our algorithm based on two scenarios. Furthermore, we applied the collision warning algorithm by extracting two cases encountered by multiple ships from the Vpass data. The results show that the algorithm triggered alarms continuously under risky situations. This study also compares waterway risk levels as assessed by maritime risk-assessment tools (potential assessment of risk model, environment stress model, and International Association of Marine Aids to Navigation and Lighthouse Authorities Waterway Risk Assessment Program MkII) and the locations having frequent alarms based on Vpass data collected for 7 days. Not only did the eastern sea of Yeongheung Island indicate that more alarms were triggered, but we found high-risk results from the risk-level assessment, indicating that the risky zones and the frequent alarm zones were identical. Additional research is necessary to develop an algorithm based on qualitative evaluation by actual ship operators. In addition, since fishing vessels navigate differently from general navigation methods during fishing, it is necessary to develop additional algorithms for this.

1. Introduction

Globally, marine accidents involving fishing vessels form a large part of research in marine engineering [1,2]. The casualties of fishing vessel accidents are more serious than those of other accidents [3]. As for the types of accidents, the incidence of collisions is remarkably high, and those caused by the collision of fishing vessels account for a large portion of the total casualties [4,5].
To prevent fishing vessel maritime accidents internationally, in 2012, the International Convention on Standards of Training, Certification, and Watchkeeping for Fishing Vessel Personnel, which establishes certification and minimum training requirements for fishing crew members, entered into force, and Cape Town Agreement (CTA) was adopted, which established the minimum global standards for the design, construction, equipping, and inspection of fishing vessels [6,7]. Additionally, the International Labor Organization has made various efforts to provide a global standard for workers in the fishing industry, including adopting the Work in Fishing Convention No. 118 in 2007 [8]. Although these voluntary and regulatory safety initiatives have reduced losses, fishing is still the most dangerous occupation at sea [9].
The International Regulations for Preventing Collisions at Sea (COLREG) is an internationally applied maritime traffic law that is intended to reduce or eliminate collisions [10]. Therefore, even for ships that are not subject to compliance, such as small vessels, understanding the principles of the regulations and the application of appropriate navigation measures will help prevent collisions.
In a study on the cause of fishing vessel collision accidents, it was found that the skippers of the vessels were often involved in fishing operations, which makes it difficult for them to recognize encounters with other ships [1,11]. Funda et al. [12] suggested that watchkeeping should be performed by a sufficient number of crew members to monitor navigation in coastal waters where there is a high risk of collision. However, owing to the nature of fishing vessel operations, watchkeeping is often neglected [1]. In particular, for smaller vessels, the number of crewmembers is generally smaller. Hence, it is very likely that the crew will place watchkeeping at a lower priority than fishing work. An et al. [13] suggested that the navigation support services should be provided for non-safety of life at sea (SOLAS) ships such as fishing vessels, and Jung [1] argued that it was necessary to develop devices that automatically identify ships at risk of collision and generate an alarm for the fishing vessels on board. However, operator assistance systems for small ships such as fishing vessels are mostly simple systems that utilize automatic identification system (AIS) equipment to sound alarms when another ship is within a certain distance from its own ship [14].
As mentioned, studies on collision avoidance between fishing vessels and small ships have suggested the adoption of collision avoidance systems and alarms. Lee [15] proposed an alarm system to detect other ships and obstacles within 50 m by emitting ultrasonic pulses of 40 kHz to raise the navigators’ cognitive ability by emitting alarm signals. Kao et al. [16] monitored ships approaching in real time using radar signal receivers and marine geographic information systems (MGIS) to prevent collisions of small ships; when a collision risk is detected, operators are notified by a buzzer or warning light. Additionally, it proposes appropriate transitions or shifts for collision avoidance and the results are shown on a display screen. Kao and Chang [17] proposed a model to generate collision avoidance methods for the safeguarding of fishing boats using fuzzy logic control methods and MGIS. The maximum relative velocity, condition of the sea, and evacuation time are considered as three language input variables for the application of fuzzy logic control, and after displaying safeguarding measures on an MGIS platform, the risk index of the two ships is evaluated based on the difference in the calculated area. Seo et al. [18] integrated AIS receivers and servers to collect all global positioning system (GPS) locations and AIS information of smartphones to develop a safe navigation support system to sound an alarm when the fishing vessel is approaching within 500 m of another ship in accordance with the guidelines of the Ministry of Land, Infrastructure, and Transport of Japan. Subash et al. [2] developed a collision avoidance system that can alert the fishing vessels about other approaching vessels or objects. The system consists of an Arduino Uno, ultrasonic and vibration sensor, GPS, and global system for mobile communication modules. An ultrasonic sensor is used to identify the longitude and latitude of the ship or object and sends an alert to the fishing vessels in the form of a message, where a buzzer was used as an alarm. Hu et al. [19] proposed an algorithm to resolve the risk associated with collision by analyzing fishing vessel activity data. The distance to the closest point of approach (DCPA) and time to the closest point of approach (TCPA) were used as variables of basic collision risk, and the fuzzy C-means clustering method was applied to analyze the fishing vessel vulnerability. These two methods were combined to reduce the navigational collision risk.
As described, many studies have been conducted to prevent collisions between fishing vessels and other small ships; however, the criteria for collision risk assessment are mostly based on distance, DCPA, and TCPA. Additionally, fishing vessels differ from merchant ships in terms of their navigation environment, operational characteristics, and operating performance. Hence, the collision risk assessment standards of merchant ships cannot be directly applied to fishing vessels. Therefore, risk assessment standards that reflect the characteristics of fishing vessels and small ships are necessary [20,21,22].
In a previous study, a collision avoidance algorithm for fishing vessels was developed using millimeter-wave communication with a 0.1 s cycle [23]. However, the risk involved in fishing vessels should be predicted in advance because it is difficult to predict the risk due to the steering characteristics of fishing vessels, such as 50°–100° off course standard deviation in the case of fishing operations and 5°–10° in the case of sailing [24]. Additionally, frequent alarms can distract operators by preventing them from performing other operational tasks and can result in neglectful alarm deactivation [25]. Therefore, highly effective collision avoidance algorithms should generate alarms continuously, and timely warnings should be displayed only in the most dangerous situations to avoid unwarranted distraction.
In this study, small fishing vessels under navigation are targeted, but vessels engaged in fishing using fishing gear that limits their maneuverability are excluded from the study. Vessels under navigation for the purpose of sailing before or after fishing are included because they are considered to be ships in the course of sailing [26]. This study applies the algorithm to a scenario-based actual ship experiment to verify its efficacy, and the alarm is analyzed by extracting actual sea-area data cases. We also compare frequent alarm occurrence zones with high-risk sea areas to determine whether the developed algorithms work effectively in hazardous areas. Figure 1 shows the flow of the study.

2. Collision Warning Algorithm for Small Fishing Vessels

The aim of this study is to verify the operation of a millimeter-wave communication-based collision warning algorithm for small fishing vessels and to validate its feasibility by applying it to a real ship test in a real sea area. This algorithm was developed in one of our previous research works [23]. Therefore, it is necessary to provide a brief introduction to the previously developed collision warning algorithm. The developed algorithm differs from others in its use of the potential assessment of risk (PARK) model, as summarized in Section 2.1; the algorithm is described in Section 2.2.

2.1. PARK Model

The PARK model is a maritime transportation risk-level assessment model based on the awareness of ship operators and the characteristics of the coastal areas of South Korea [27]. The model considers factors that may impact maritime transportation safety, gathered through surveys administered to ship operators. Table 1 lists the internal and external elements of the model.
To analyze the effect of each factor, a survey was conducted with 3.5% of the navigation officers available in Korea. Based on the results of the quantitative investigation, the values of factors that indicate the impact of each element on the marine traffic safety of a ship were analyzed using variance and multiple comparison analysis methods. Table A1 of Appendix A shows the coefficient values representing the effect of each factor on the marine traffic safety of the ship in the PARK model. The model was derived using regression analysis, and the risk was quantitatively calculated using Equation (1).
Risk   Value = 5.081905 + T p + T f + L f + W f + C f + L p + P f + 0.002517                            · L + C p + S f + H i / o + S p 0.004930 · S d 0.430710 · D
where
T p :Type factor T f :Tonnage factor L f :Length factor
W f :Width factor C f :Career factor L p :License factor
P f :Position factor L :Target ship length overall (LOA)
C p :Crossing factor S f :Side factor H i / o :In/out harbor factor
S p :Speed factor S d :Speed difference D :Distance
Additionally, the risk level determined by the model is adjusted by the length of the ship, the DCPA, and the TCPA.

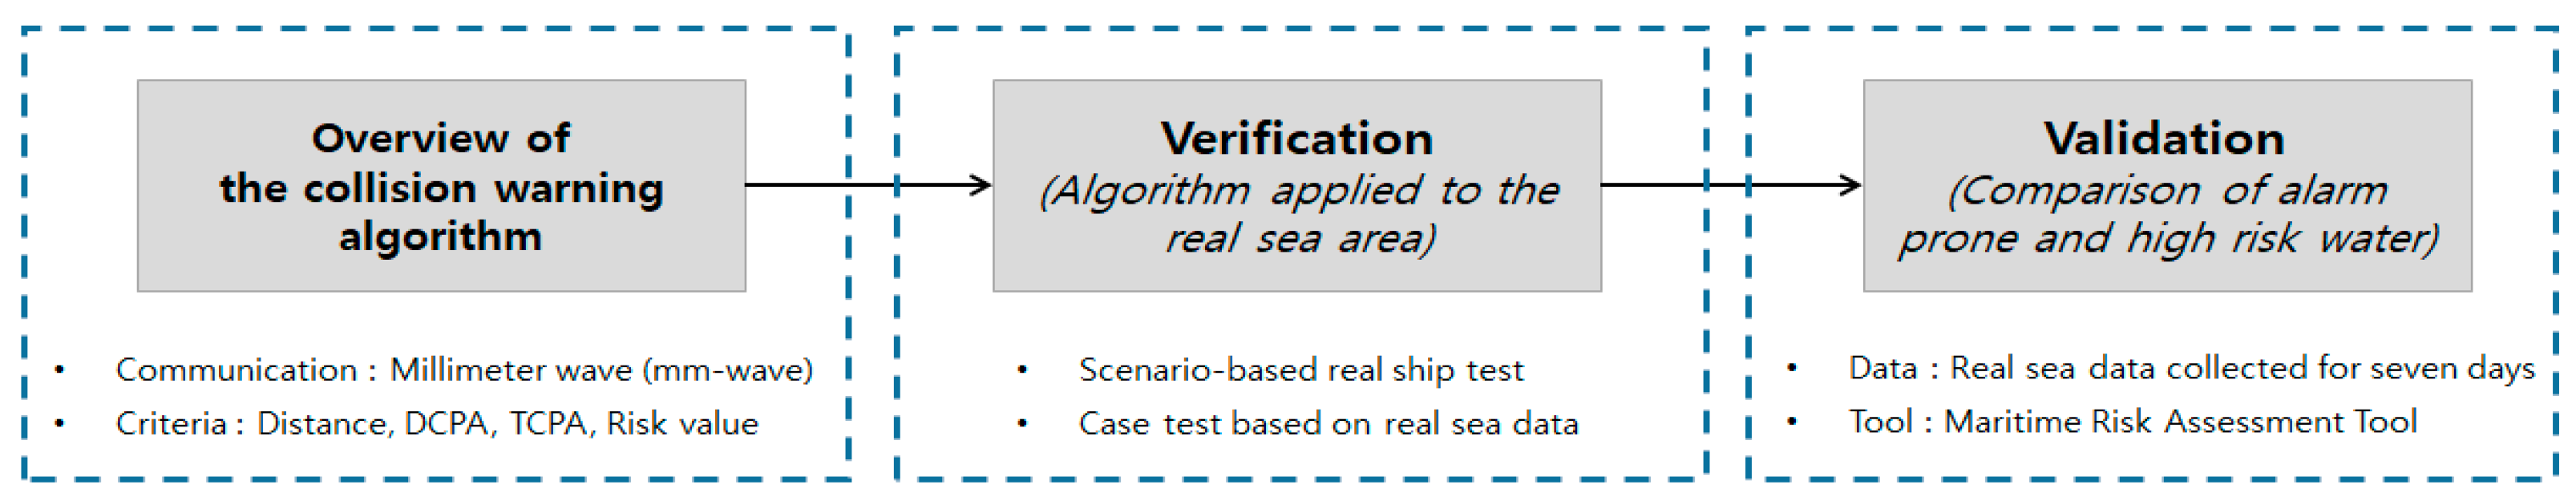
2.2. Overview of the Collision Warning Algorithm

To reflect the steering characteristics of small fishing vessels, a previous work applied the minimum criteria for safety based on millimeter-wave communication using a transmission cycle of 100 ms to develop a collision warning algorithm [23]. The parameters used in identifying ships subject to a high risk of collision include distance, DCPA, TCPA, and the PARK model risk value. Figure 2 shows the overview of the algorithm for small fishing vessels.
The algorithm developed in the study supplements the noncontinuous alarms that result from the course-keeping performance and steering characteristics of a ship by combining DCPA, TCPA, and PARK model risk value criteria and configuring the alarm so that it occurs at three different stages depending on the distance. The distance criteria for the alarm are classified based on the results of a survey of 19 fishing vessel captains. Pre-alarm is the alarm stage when the ship operator can identify the risk in advance when two ships approach each other at a high speed ≥24 kts. From the survey, it is considered that the average distance from which the fishing boat’s ship operator perceives another ship is 2713.13 m. The first main alarm is the alarm stage when the ship operator can identify a collision risk and determine the situation when there is a distance of 0.5–1 miles between two ships. This is also based on the survey, where an average of 1700.11 m was determined to be the distance at which a captain begins to constantly observe other ships. The second main alarm is the alarm stage that is set to generate the alarm in a situation when the distance is closer to within 0.5 miles. This step is based on an average distance of 563.58 m at which a fishing vessel captain normally initiates a collision avoidance maneuver.

3. Application of Collision Warning Algorithm to Real Ship Test

3.1. Overview of the Real Ship Test

To verify whether the developed algorithm generates alarms adequately in real seas, a real ship test was conducted for three small fishing vessels at sea near Yeongheung Island, Incheon, South Korea, between 7 a.m. and 4 p.m. on 17 October 2019. The weather was cloudy, and the daily average wind speed was 3.5 kts, which is considered to be relatively calm according to the Beaufort Scale 2 [28]. The three target ships were small, weighing ≤10 t, and had an LOA of approximately 10 m. The selection of a target ship was based on the fact that ships having a weight <20 t account for 69.65% of the other ships, including other fishing ships among registered ships in Korea [29]. Table 2 lists the specifications of each ship.
For the test, we installed an omnidirectional antenna (9 dBi) and an exclusive millimeter-wave communication terminal in the three small fishing vessels that sailed according to real ship test scenarios. We verified the generation of collision alarms in accordance with the developed algorithm. Figure 3 shows the images of the front portion of each ship and the installed antennas.
There are limitations to constructing a scenario that reflects actual maritime traffic conditions. Therefore, the scenarios were designed to include two situations: head-on and crossing situations, as classified by COLREGs [10]. The first scenario included two ships sailing in parallel while another ship sails toward them from the opposite side. The second scenario involved all three ships approaching a single location from different directions. In scenario 1, ships A and C and ships B and C are applied to the head-on situation, and in scenario 2, the crossing situation is applied to each ship. Figure 4 illustrates the two scenarios.

3.2. Results of the Real Ship Test

The results of the real ship test showed the locations at which step-by-step alarms in each scenario were generated in different colors to indicate the alarm-based track. The time at which the step-by-step alarms were generated was analyzed. In addition, one ship was designated as a reference ship. The alarms based only on DCPA and TCPA criteria and those based only on the PARK model risk value criterion were compared with those based on the combination of DCPA, TCPA, and PARK model risk value criteria.
1.
Scenario 1
In scenario 1, ship A and ship B sailed in parallel, while ship C sailed toward them from the opposite direction for approximately 6 min. The results of the analysis are shown in Figure 5 and Table 3.
Figure 5a shows the alarms generated according to the tracks of the three ships that sailed in accordance with Scenario 1, and Figure 5b shows the graphs of the alarms based only on DCPA and TCPA criteria, those based only on PARK model risk value criterion, and those based only on the algorithm applied in this study, which are all applied to ship C. The figures indicate the alarms based on time so that they can be compared with each other. Table 3 presents the data of the time when the step-by-step alarm was first generated in each ship.
As shown in Figure 5a and Table 3, ships B and C encountered each other at 99.3 s after the test started. The alarm criteria were met and the first main alarm was generated continuously in ships B and C owing to the risk value. At 105.1 s, the first main alarm was generated in ship A owing to the risk of collision with ship C; thus, the first main alarm was generated in all three ships. Ships B and C came closer to each other at 161.1 s and the alarm stage changed to the second main alarm that was momentarily generated in ship A at 211.5 s as its alarm criteria with ship B was satisfied. Ships B and C became dangerously close to each other at ~254 s, which resulted in a step-by-step alarm. The first main alarm was generated continuously in ship A as it came closer to ship C and was turned off at ~240 s. However, because ship A had a temporary encounter with ship B during its encounter with ship C, the second main alarm was generated.
As shown in Figure 5b, when only the DCPA and TCPA criteria were applied, the normal situation without alarm generation and the first or second main alarm were indicated alternately, resulting in the generation of noncontinuous alarms. After ~200 s, the alarms were not generated despite being under risky situations because the criteria for the alarm conditions could not be met. In the case of applying only the PARK model risk value criterion, the alarms were generated continuously. However, they were generated in the pre-alarm stage, which was triggered even when the two ships were far away from each other and there was enough time to respond to the encounter. Therefore, ship operators would rely less on those alarms. However, the algorithm applied in this study continuously generated an alarm in a step-by-step manner in risky situations and was able to alert ship operators to risky situations when the first and second main alarms were generated alternately.
2.
Scenario 2
In scenario 2, all three ships navigated toward a single location for approximately five min, and the analysis results are shown in Figure 6 and Table 4.
As shown in Figure 6a and Table 4, ships B and C encountered each other at 176.4 s after the test started to satisfy the DCPA and TCPA criteria and the first main alarm was generated for the first time. Then, it was continuously generated owing to the risk value. At 191.6 s, the first main alarm was generated on ship A as well owing to the encounter between ships A and B indicating that it was generated on all three ships. At 210.9 s, ships A and B came close to each other such that the alarm stage was changed to the second main alarm in both ships. At 224.5 s, ship C also met the distance criteria and the second main alarm was generated.
As shown in Figure 6b, when the developed algorithm along with DCPA and TCPA criteria were applied, the first main alarm was generated at 176.4 s. However, the alarm went on and off repeatedly under only DCPA and TPCA criteria because of the course-keeping performance of small fishing vessels. Furthermore, for ~28 s (from 252.0 to 280.0 s) despite the close distance that caused risky situations, the DCPA and TCPA criteria were not met and an alarm was not generated. As in scenario 1, step-by-step alarms were generated continuously only under the PARK model risk value criterion. However, pre-alarm was generated despite sufficient time for the encounter. Hence, the algorithm developed in this study helps the operator to acknowledge the danger by displaying a relatively continuous alarm signal in a dangerous situation without disturbing the operator with frequent alarms at longer distances.

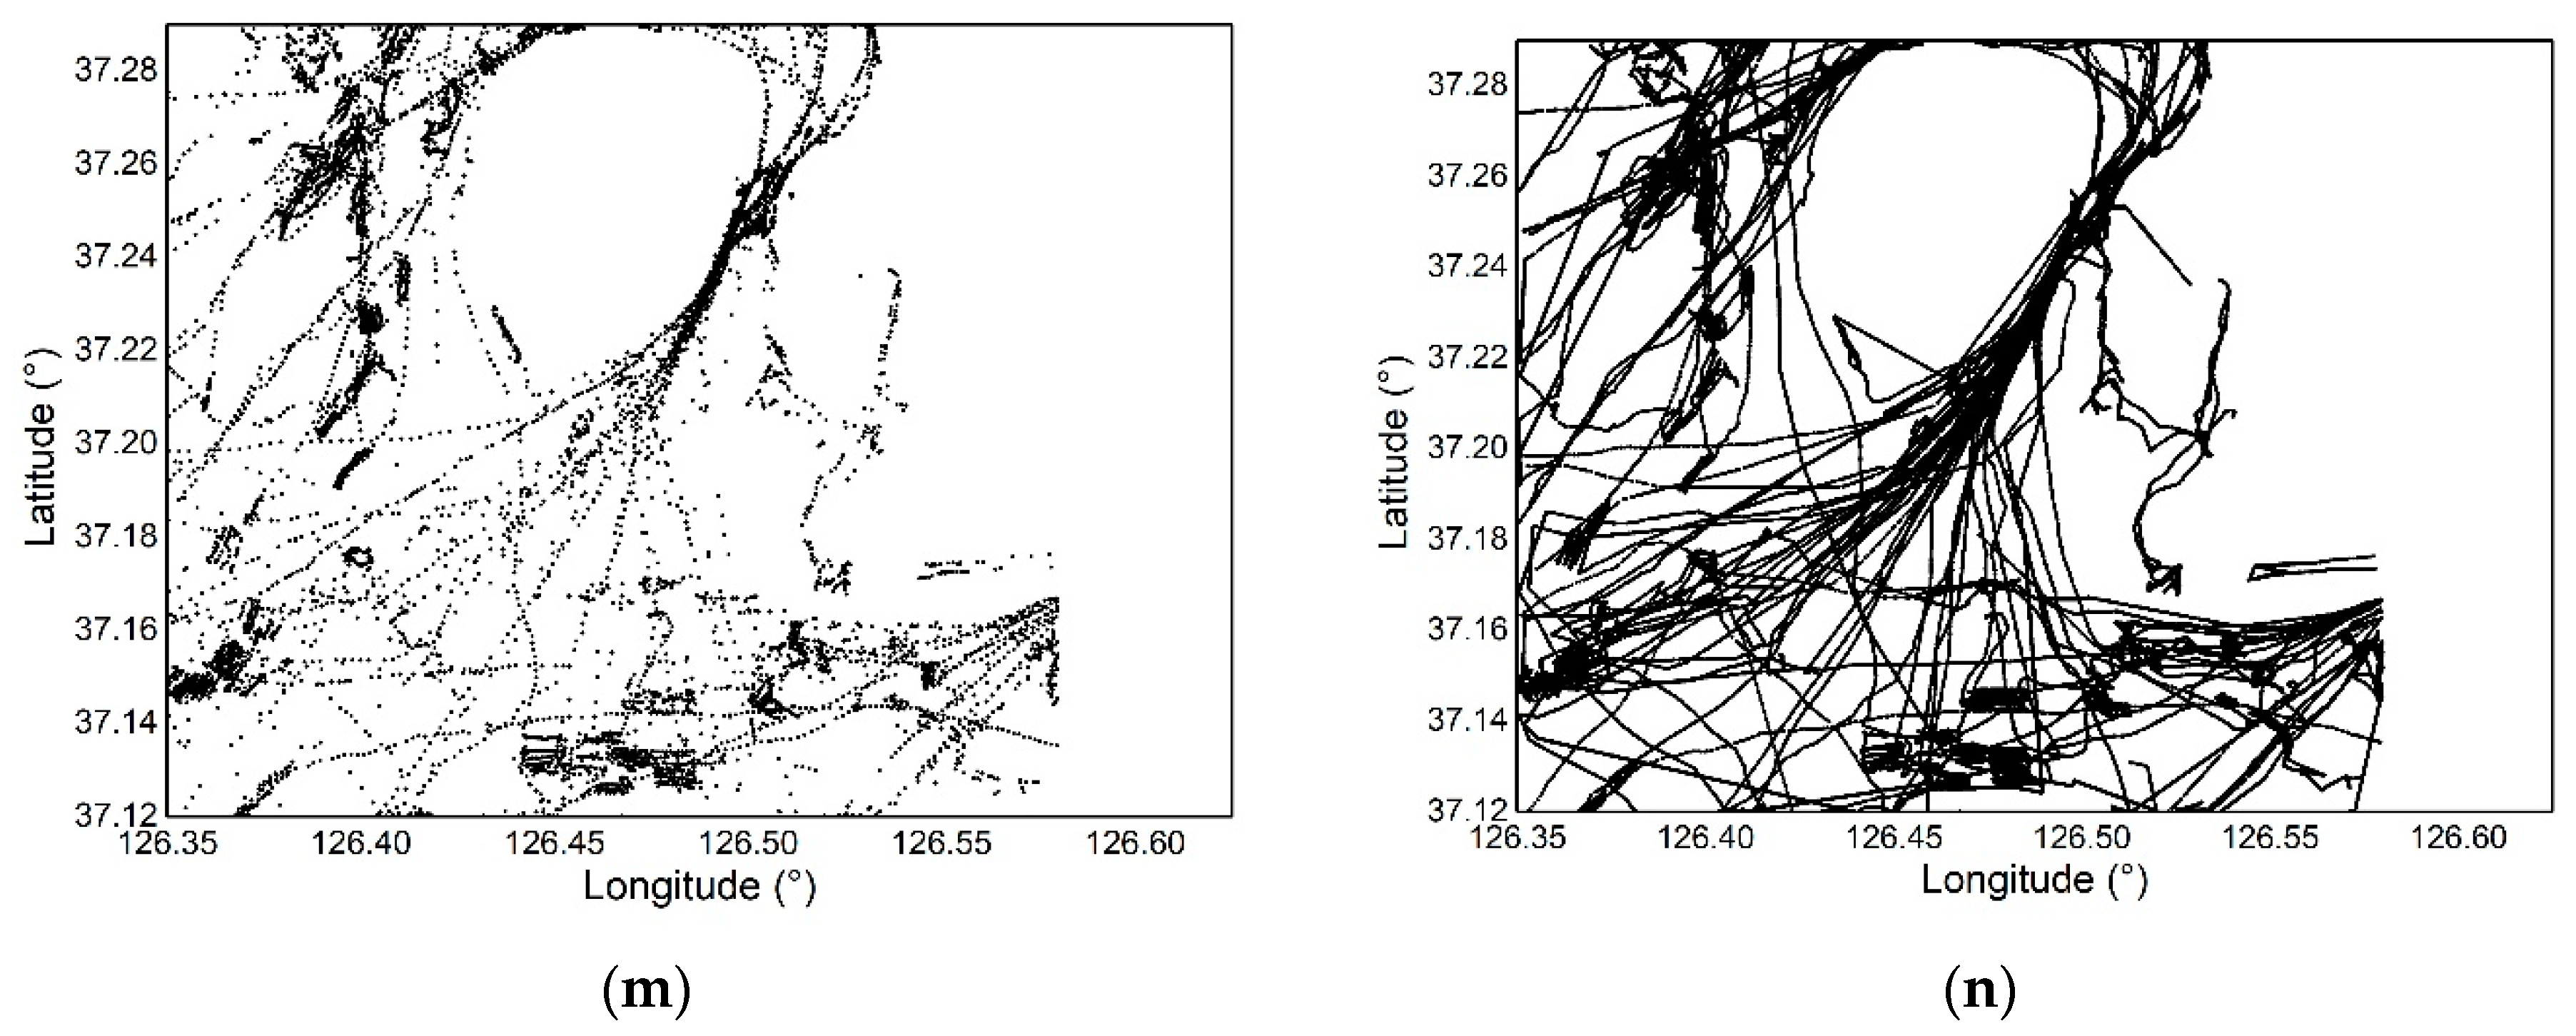
4. Application in Fishing Vessel’s Waterway Based on Vpass Data

This study applied the collision warning algorithm to the fishing vessel’s waterway by extracting two cases based on real sea vessel traffic (Vpass) data and compared the maritime risks and alarm generation based on the vessel traffic data collected over seven days. The study used the Vpass data collected for seven days during 15–21 May in 2014 and the target area was the sea of Yeongheung Island, South Korea. Vpass is a wireless device that automatically transmits the location of a ship [30] and should be installed in small fishing vessels where AIS is not installed according to the Fishing Vessels Act [31]. Therefore, this study used the Vpass data suitable for small fishing vessels that are considered as the target ships in this study.
However, ship navigation information is transmitted every 10 min or less in Vpass [32]. As a result of analyzing the 7-day Vpass data, intervals within 1 min accounted for 75.74%, and those within 3 min accounted for 90.74%. For accuracy, interpolation, a pre-processing step of data, was performed. The Vpass data were interpolated in chunks of 100 ms when they applied to the case study and chunks of 10 s for the effective application to risk assessment. These activities were performed using the linear interpolation method and Equation (2).
P ( t + Itv ) = l 1 l P ( t ) + l 2 l P ( t + α )  
where
P ( t ) : Position at time t ( x 1 , y 1 )
P ( t + α ) : Position after time α   ( x 2 , y 2 )
P ( t + Itv ) : Position after interval to be interpolated
l 1 : Distance between P ( t ) and   P ( t + Itv )
l 2 : Distance between P ( t + Itv )   and P ( t + α )
l : Distance between P ( t )   and P ( t + α )     < l 1 + l 2 = l >
here, the prerequisite is   α > Itv .
Figure 7 shows the Vpass data plot diagrams before and after interpolation. The interpolation result plot diagrams for each date are shown in Figure A1 of Appendix B.

4.1. Case Study of the Collision Warning Algorithm Application Based on Vpass Data

1.
Case 1
In Case 1, six ships encountered each other where ships A, B, and C sailed northeast, ship D sailed southwest, ship E drifted at a low speed through the water, and ship F sailed southwest at a low speed while changing its course toward the northeast. The 10 min ship navigation data were extracted and the analysis results are shown in Figure 8 and Table 5.
Figure 8a shows the tracks of the six ships with different colors representing the alarm stages and Figure 8b shows the time-zone comparison in the graph of the alarms generated on ship D for DCPA and TCPA criteria, PARK model risk value criterion, and developed algorithm. Table 5 shows the results of the data analysis on the alarm situations at ship D.
According to Figure 8a and Table 5, ship D encountered ship C head-on at 9.7 s, which generated the first main alarm. As the distance between the ships decreased, the alarm stage changed to the second main alarm, and the alarms were continuously generated. At 113.2 s, the alarm was turned off as the risky situation for ship C had terminated. Later from 247.8 to 317.2 s, the encounter with ship B caused the continuous generation of the second main alarm for ~69 s. As shown in Figure 8b, when only DCPA and TCPA criteria were applied, the first main alarm was generated momentarily and then was terminated. However, when the developed algorithm was used, the alarms were generated continuously until the first main alarm changed to the second main alarm. Furthermore, when only DCPA and TCPA criteria were applied, the alarms were terminated at 76.1 s despite the very close encounter between the two ships. In the case of the developed algorithm, the alarms were generated until the risky situation had terminated completely when the distance was 76.88 m. However, when the PARK model risk value criterion was applied, the pre-alarm, first main alarm, and second main alarm were turned off alternately and repeatedly, which would confuse ship operators.
2.
Case 2
Case 2 presents a situation in which four ships encountered one another. Ships A, B, and C sailed northeast toward Jindu Harbor, while ship D drifted around Jindu Harbor. The 10 min ship navigation data were extracted, and the results of the analysis are shown in Figure 9 and Table 6.
According to Figure 9a and Table 6, ship B approached Jindu Harbor at a steady speed and encountered ship D, which drifted around Jindu Harbor, creating a risky situation. Thus, the first main alarm was generated at 171.6 s, and it changed to the second main alarm after 1.3 s. The alarm was generated continuously until 226.8 s when the PARK model risk value decreased below five and the alarm was turned off. Similarly, when ship B came closer to ship D at 318.1 s to generate the second main alarm at 341.2 s, it created a risky situation for ship A, which approached in the same direction initially, generating the alarm continuously for 96 s. When the risk criteria were removed, the alarm was turned off and generated again at 452.2 s until 471.4 s when the risk was removed. As shown in Figure 9b, the alarms were generated when the developed algorithm and the DCPA and TCPA criteria were applied. However, when only DCPA and TCPA criteria were applied, the alarms were turned on and off repeatedly when the first alarm was generated at 171 s and was turned off at ~ 266.8 s. Similar to the real ship test or in the other cases when only the PARK model risk value criterion was applied, alarms were generated at a significant distance from one another, which could reduce the ship operator’s confidence.

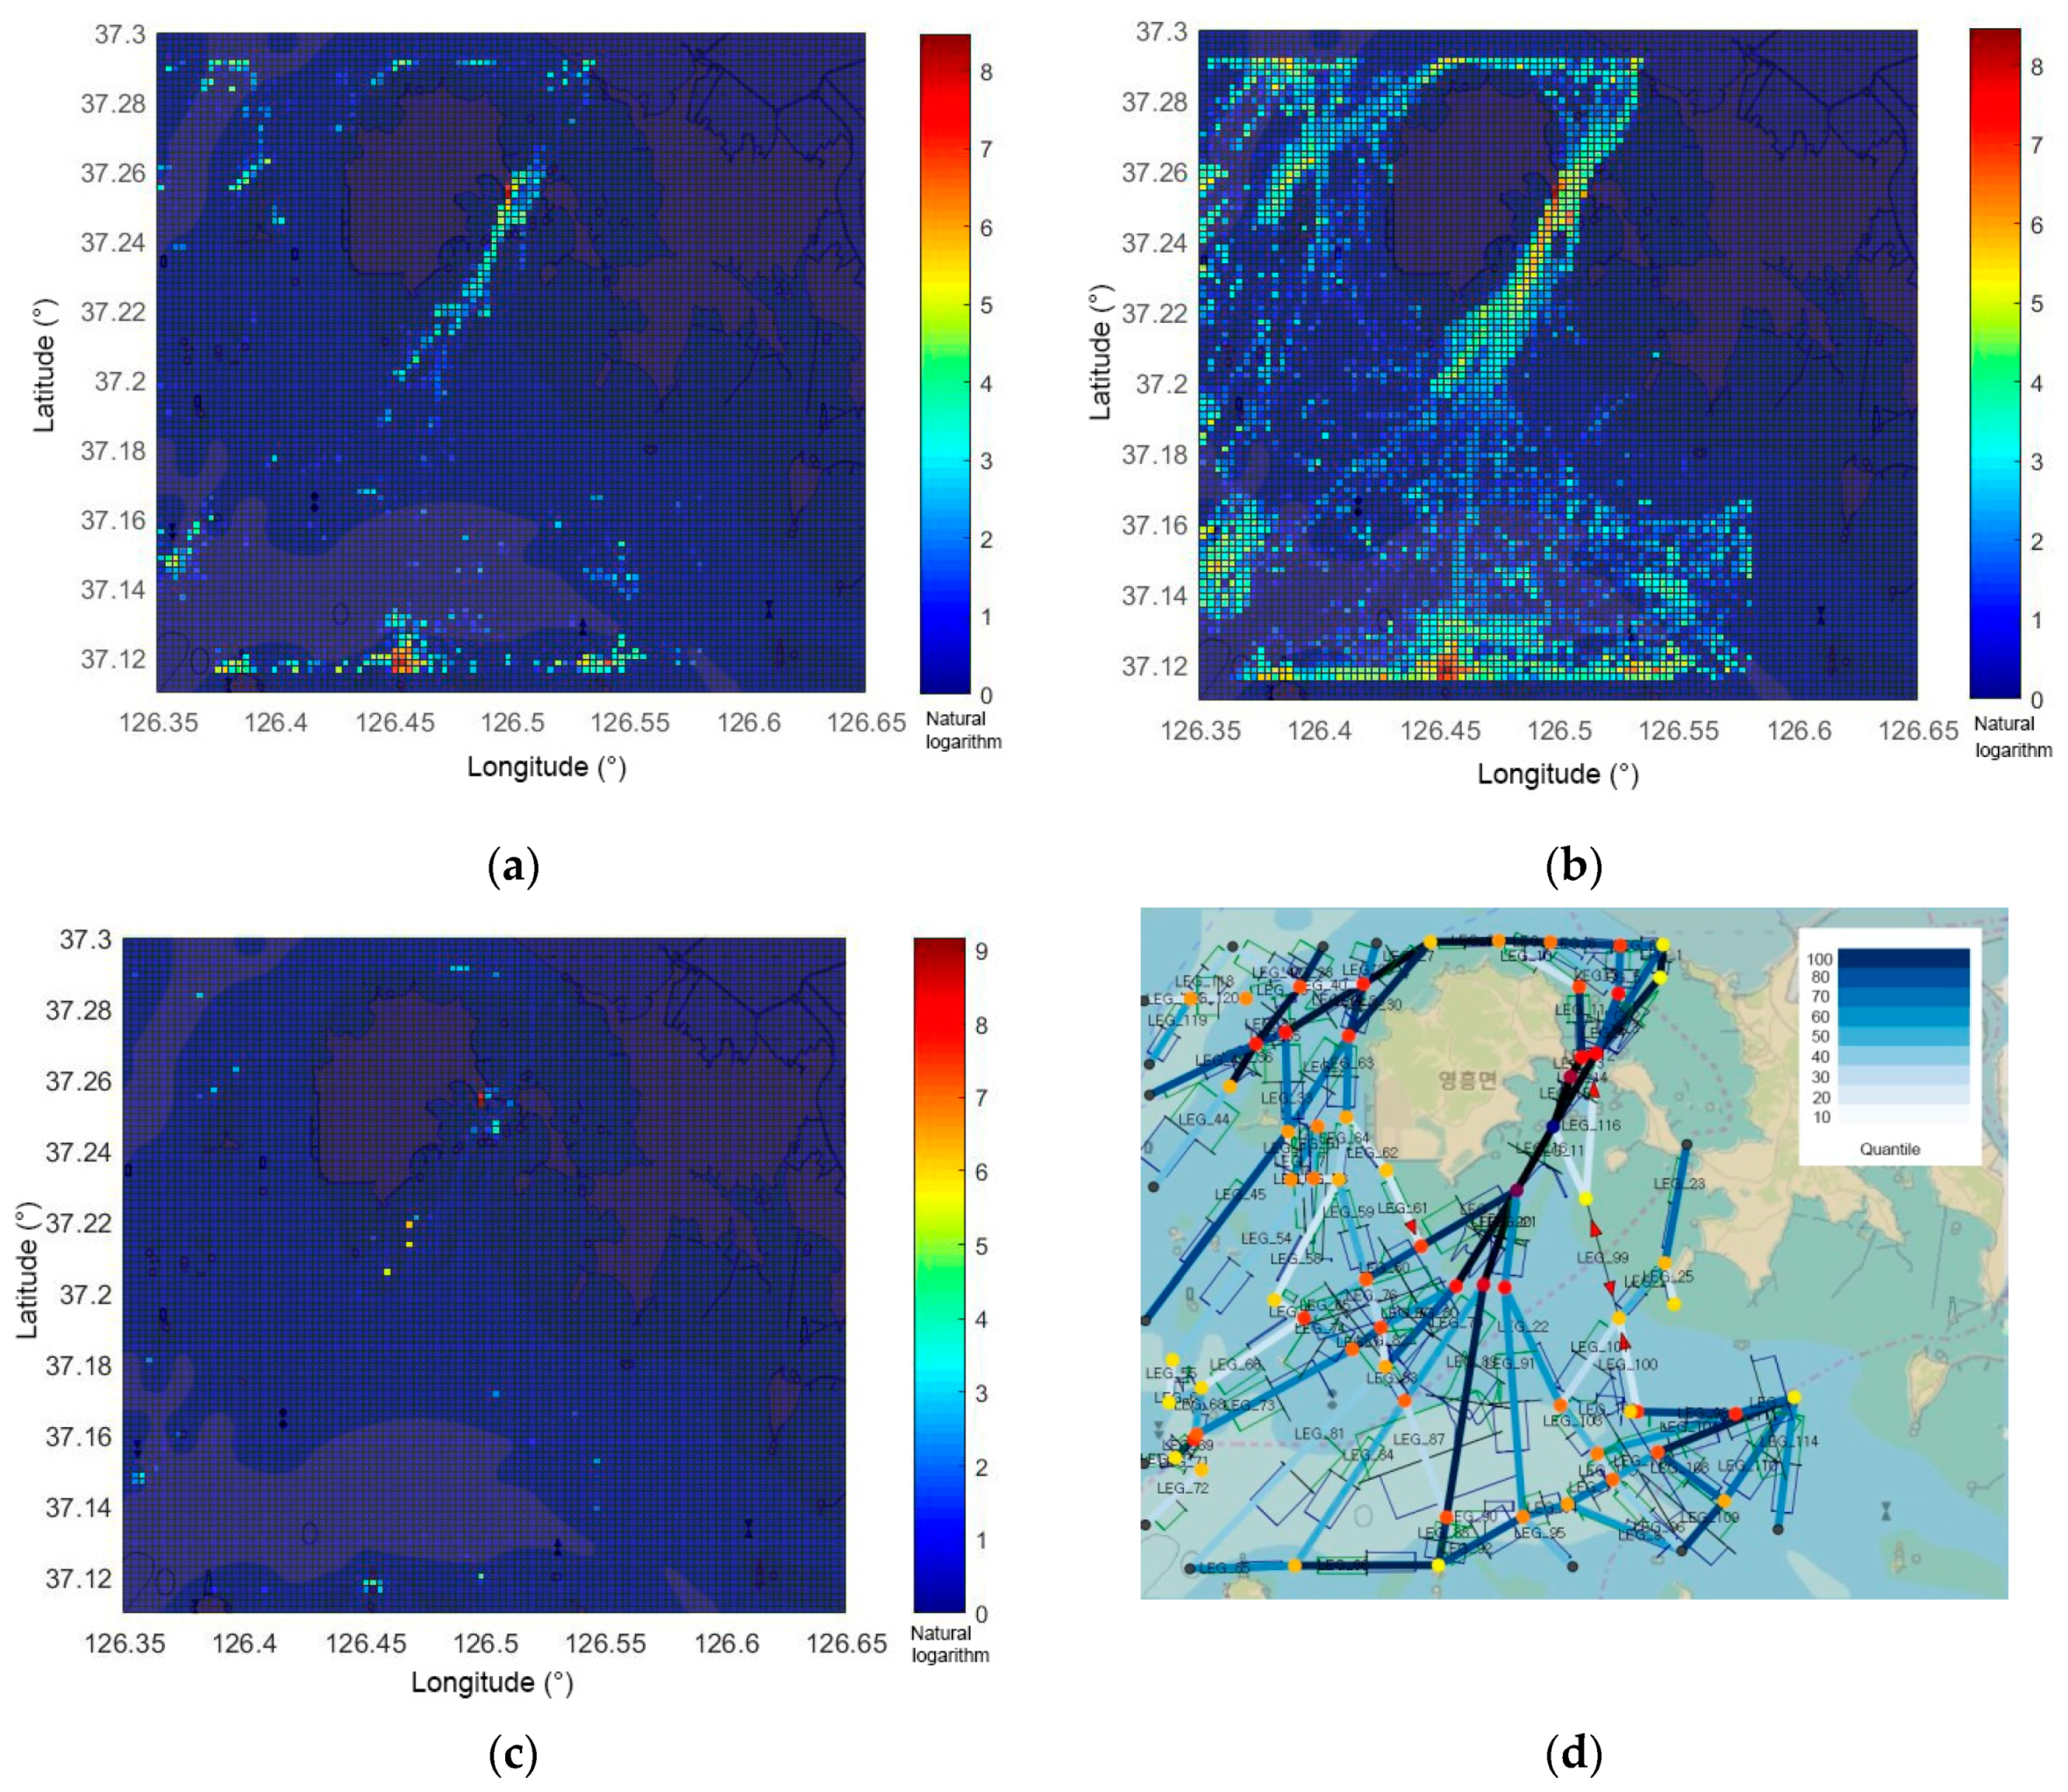
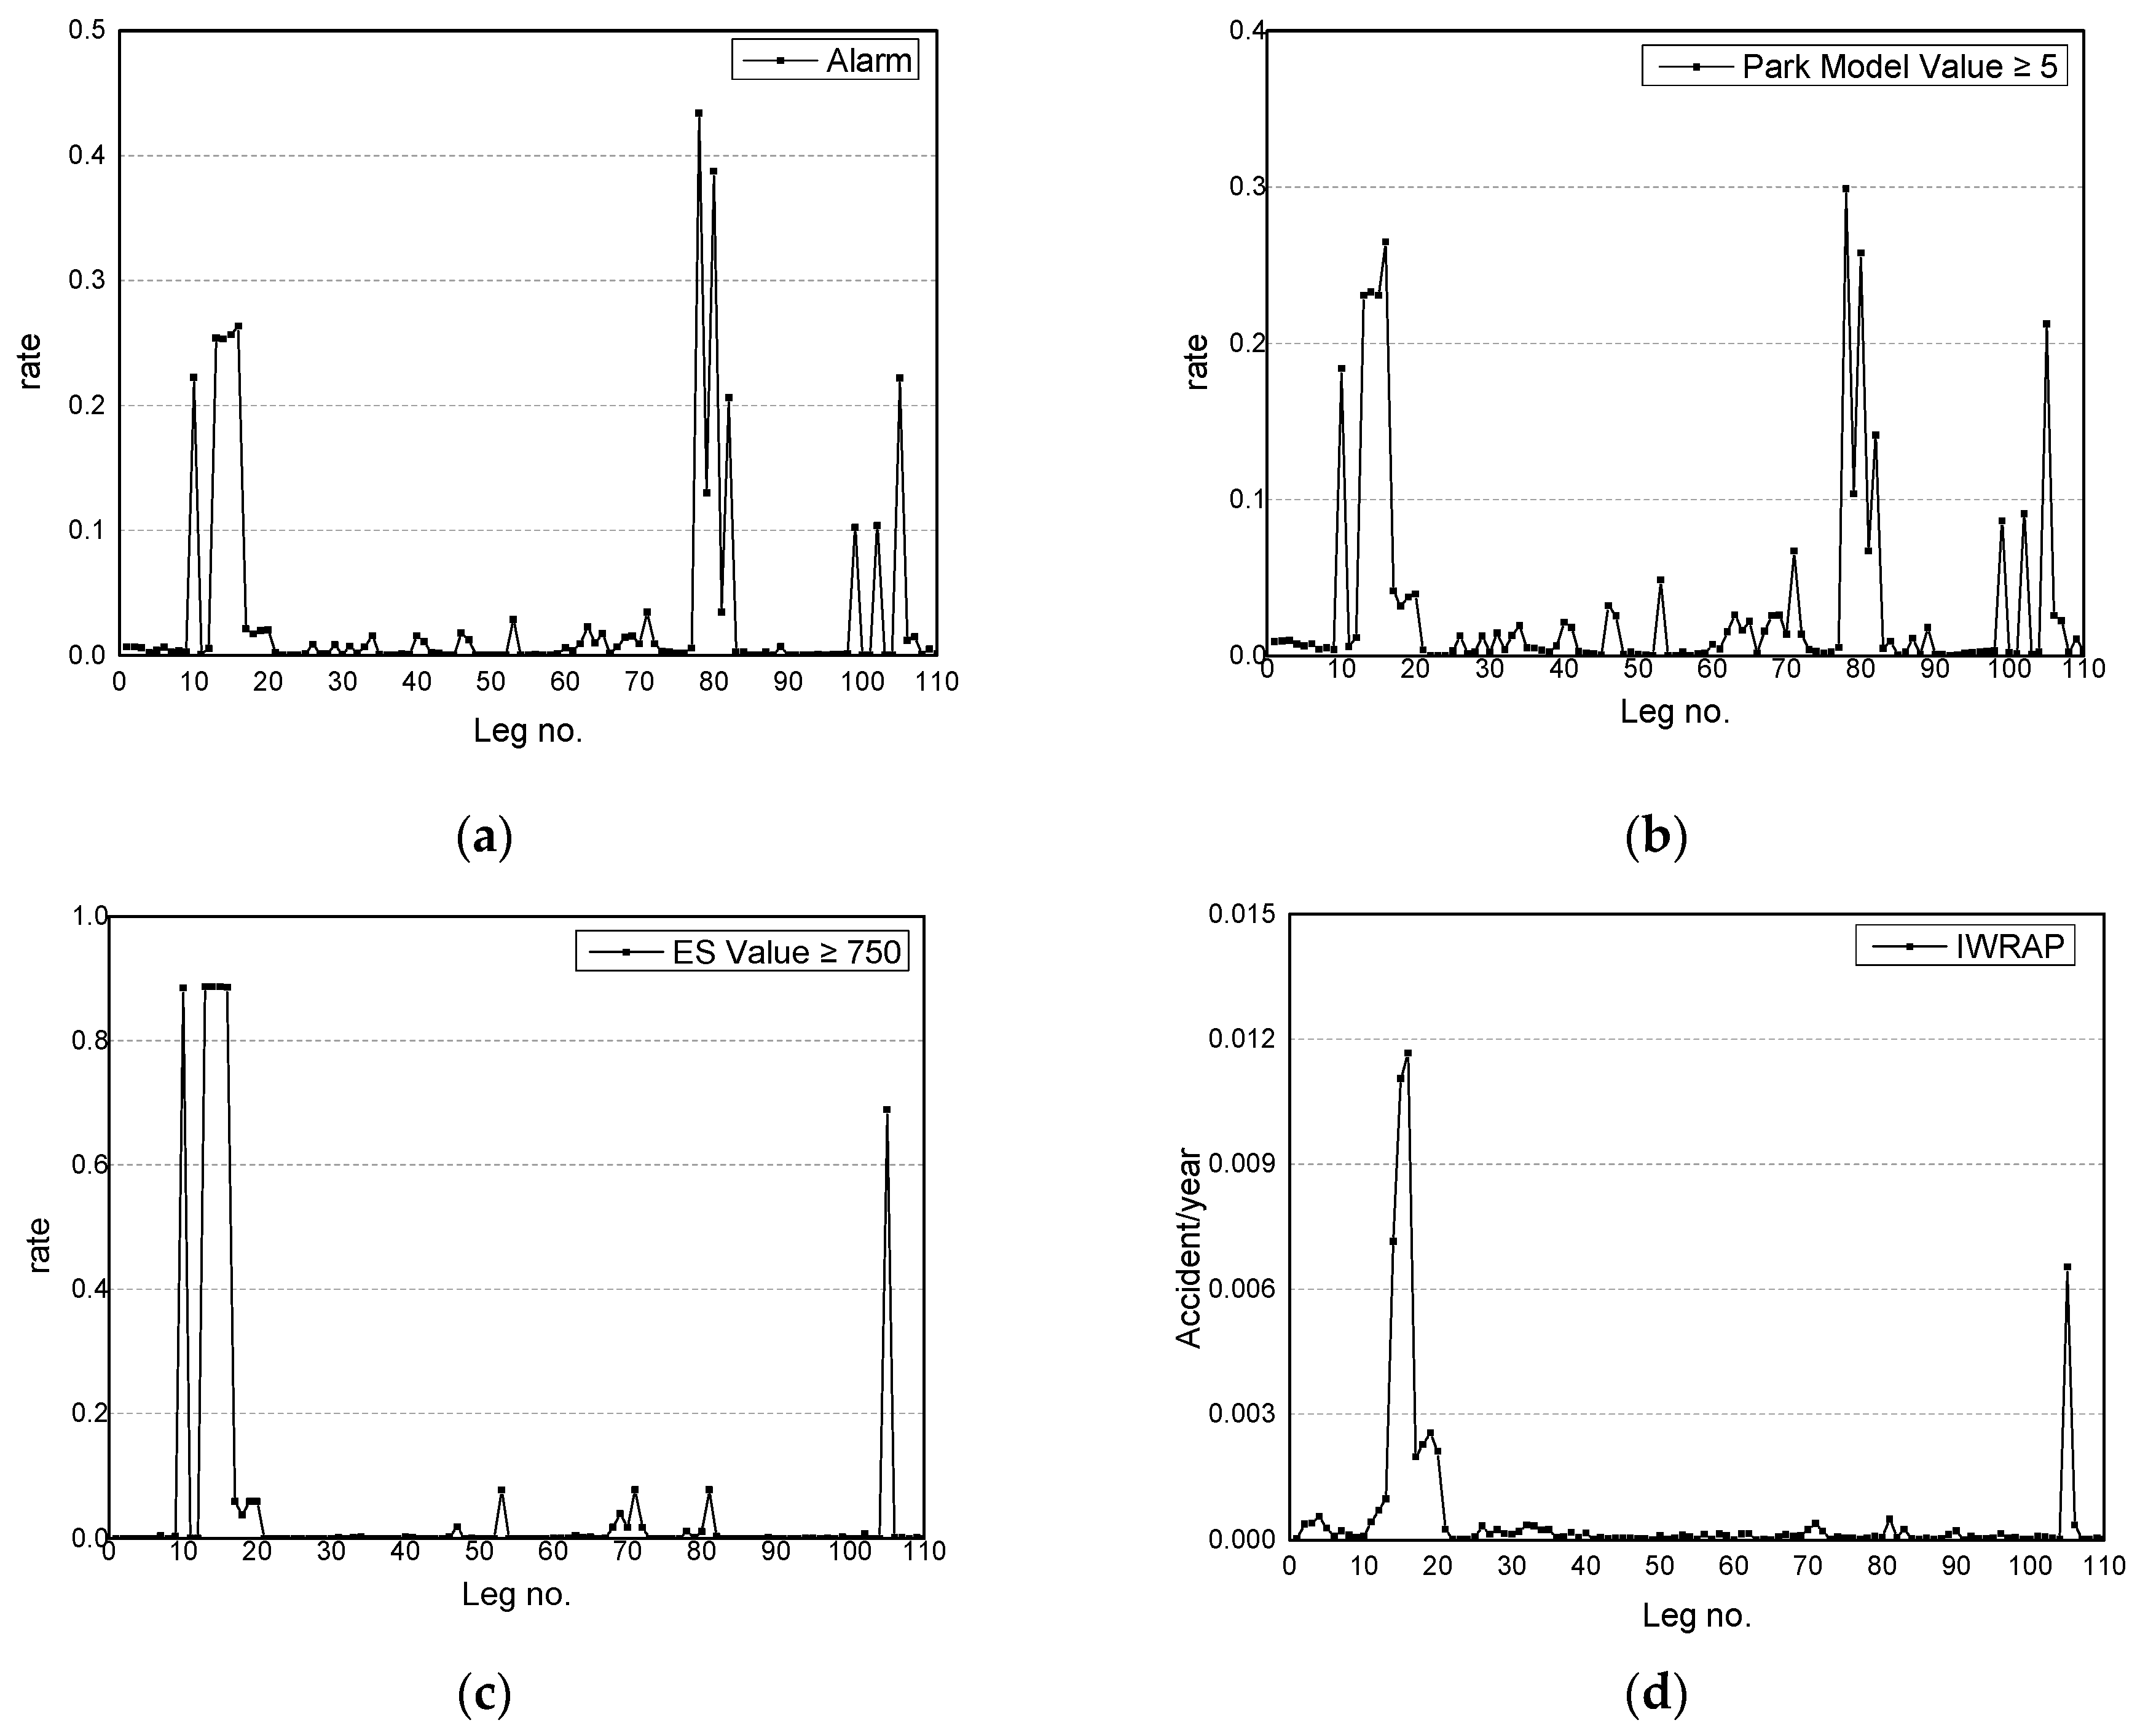
4.2. Comparison of the Waters That Generated Alarms and the Risk Waters Based on the Maritime Risk Assessment Tools

To validate whether an alarm occurs in dangerous seas using the collision warning algorithm, alarm-prone and high-risk water areas were compared. A high-risk water evaluation was conducted using the environmental stress (ES) model and the International Association of Marine Aids to Navigation and Lighthouse Authorities (IALA) Waterway Risk Assessment Program MkII (IWRAP). Since no model has been developed to assess the risk of small vessels, the ES model, which is commonly used in Korea and Japan, and the IWRAP were used.

4.2.1. Overview of the Maritime Risk Assessment Tools

1.
ES Model
The ES model is a quantitative numerical model based on the scale of the burden that the operator feels difficulty in steering due to the surrounding environment (terrain, other ships, etc.) of the vessel by environmental stress (ES) value, which is the evaluation index [33]. The difficulty in steering was based on the case where conditions, such as natural, geographic, facility, and transportation restrict the behavior of the ship operator. The size of the load applied to the ship operator was considered, in addition to the behavioral restrictions. If the stress value is due to the steering environment, it is called the land of ES value (ESL), and if it is due to transportation environments, it is called the ship of ES value (ESS). The size of the load that combines these values is called the aggregation of ES value (ESA). The ESS value was used because this study assesses the risks among ships. To calculate the ES value, the risk concerning the relative distance between the ships in relation to collision (SJ) value must first be calculated; the calculation method is shown as Equations (3) and (4).
SJs = f ( R / V )
SJs = α × ( R / Lm ) + β
where
SJs :Risk concerning the relative distance between the ships in relation to collision;
R :Relative distance between two ships;
V :Relative speed of the two ships;
Lm :Average length of the two ships;
      α = 0.00192 × Lm
     If crossed from starboard, β = 0.65 × ln L m 2.07 .
     If crossed from portside, β = 0.65 × ln L m 2.35 .
     If meeting from the stem, β = 0.65 × ln L m 2.0 .
     If the own ship is overpassed from the stern, β = 0.65 × ln L m 0.85 .
The SJs value is calculated as a risk level from −3 to +3, and this is a value based on the subjective judgment of the navigator. The risk level of −3 to +3 by each course angle, which is calculated by each 1° of course angle, was converted into the scale of 0 and 6 where +3 is 0 and −3 is 6. The risk levels were summed up in the range of ±90°, and the value was set to ESS. Moreover, 0 × 180 = 0 was set as the minimum, and 6 × 180 = 1000 was set as the maximum. The SJs value corresponds to the ship operator’s sense of risk, where 3–0 is not risky and risk, −1 is somewhat risky, −2 is risky, and −3 is very risky. Thus, for a range between 0 and 1000, the load rank was categorized as negligible when the scope was between 0 and 500, marginal when the scope was between 500 and 750, critical when the scope was between 750 and 900, and catastrophe when the scope was between 900 and 1000.
2.
IWRAP MkII
IWRAP MkII is a useful modeling tool for waterway risk assessment because it estimates the frequency of ship collisions and stranding based on traffic volume, traffic distribution, and undersea geographic information [34]. Since this study assesses the risk of ship collisions, the focus is only on collisions. The conceptual theory for calculating the frequency of collision or stranding follows the principle formulated by Fjujii, as shown in Equation (5).
λ col = P C × N G
where
  • N G   : Geometric number of collision or grounding candidates;
  • P C   : Causation factor.
Collisions are mainly divided into two categories: those caused by the passage zone (head-on or overtaking collision) and those caused by two routes crossing or merging at the curve of the fairway (crossing collision). The equation for estimating the frequency of head-on or overtaking collision is given by Equation (6), and that of a crossing collision is given by Equation (7).
N G head on = Lw i , j P G   i , j head on V ij V i ( 1 ) V j ( 2 ) ( Q i ( 1 ) Q j ( 2 ) )
where
Lw : Length of the segment;
Q i Q j : The number of passages per unit time for each ship type and size;
V i V j : Speed of the ships;
P G : The probability that two ships will collide in a head-on situation;
N G crossing = i . j Q i ( 1 ) Q j ( 2 ) V i ( 1 ) V j ( 2 ) D ij V ij 1 sin θ   for   10 ° < | θ | < 170 °
where
D ij : Apparent collision diameter;
θ : Encounter angle of two ships.
IWRAP MkII imports maritime traffic data and sets the length and width of legs according to traffic flow. Then, it is possible to develop an IWRAP model that predicts the annual collision frequency after analyzing the distribution of traffic by converting it to the number of traffic vessels per year.

4.2.2. Comparison between Waters with Alarms and Risky Waters

This study assessed the risk level of the target waters using waterway risk assessment tools (i.e., PARK model, ES model, and IWRAP MkII) based on the Vpass data of the surrounding waters of Yeongheung Island collected for 7 days. The aim of this study was to verify the feasibility of the developed algorithm by identifying whether alarms were generated in the actual risk waters compared with areas having frequent alarms. Figure 10 shows the results of this analysis.
Figure 10a–c depict target waters divided into a 100 × 100 grid. Risk waters, including the alarm generated zones, areas with PARK model risk value at or over five, and those with ES value at or over 750, are indicated as heat maps. Figure 10d shows the results of collision frequency estimation using IWRAP MkII. It was observed that the Yeongheung waterways in the east of Yeongheung Island and the northern and southern areas of the target waters were zones having frequent alarms and were also assessed as risk waters by the PARK, ES model, and IWRAP MkII. Thus, we confirmed that frequent alarms are generated in actual risky waters. For a more accurate comparison, the study attempted to identify risk legs by applying an identical location, length, and width of the leg used in IWRAP MkII. Figure 11 shows images in which 110 legs were applied in accordance with the traffic flow in the target waters, and Figure 12 presents a comparison between the generated alarms and the risk-level assessment results.
Figure 12a shows the ratio of alarms generated at the corresponding leg to the total number of alarms. The 10 legs in the order of most alarms generated were legs 78, 80, 16, 15, 13, 14, 10, 105, 82, and 79. Figure 12b shows the ratio of the number with the PARK model risk value at or above five at the corresponding leg to the total number with the PARK model risk value at or above five. The 10 legs in the order of risk level assessed as highly risky by the PARK model were legs 78, 16, 80, 14, 13, 15, 105, 10, 82, and 79. Figure 12c shows the ratio of the number with the ES value at or above 750 at the corresponding leg to the total number with the ES value at or above 750. The 10 legs in the order of risk level assessed as risky by the ES model were legs 13, 14, 15, 16, 10, 105, 71, 81, 53, and 17. Figure 12d shows the number of estimated yearly collisions depending on the leg evaluated by IWRAP MkII. The 10 legs in the order of highest yearly estimated collisions were legs 16, 15, 14, 105, 19, 18, 20, 17, 13, and 12. In all these figures, legs 13, 14, 15, 16, and 105, which represent the eastern waters of Yeongheung Island, showed the highest number of alarms and highest risk levels. Additionally, the legs in the south or approaching the south of the target waters, legs 53, 71, 79, 81, and 82, were not in the top-10 rankings. However, they had multiple alarms and were identified as risky based on PARK and ES models. The southern zone of the target waters is congested with fishing ships during spring and summer [35]. Considering that the used data were collected in May, those areas were assessed to be risky, owing to the many fishing ships. In particular, the areas with legs 78 and 80 that had many alarms and were risky according to the PARK model are heavy traffic waters, because the waterways approaching the pilot station and Daesan Harbor as well as the silica mine extraction zones are collocated [36]. In Figure 12a,d, the high-risk water assessed by IWRAP and the alarm-prone zone did not match compared with other risk-assessment tools. This is because IWRAP evaluates risk based on traffic flow, whereas fishing boats do not have a particular route pattern, owing to their characteristics. Thus, there seems to be a low rate of coincidence.

5. Conclusions and Future Work

This study proposed a collision warning algorithm for application in small fishing vessels in real seas and validated its feasibility. To verify the algorithm, a real ship test was conducted, and the collision warning algorithm was applied to cases extracted from Vpass data, which were real sea data. These data were collected over seven days and were used to obtain the risk assessment results for target waters, the results of which were compared with those of the frequent alarm waters to validate the feasibility of the algorithm.
First, this study conducted a real ship test based on two scenarios targeting three small fishing vessels in real seas. In addition, the developed algorithm was applied to the two cases that were extracted based on the real sea (Vpass) data. Then, the alarms based only on DCPA and TCPA criteria and those based only on the PARK model risk value criterion were compared with the alarms based on the algorithm of this study (a combination of DCPA and TCPA criteria and PARK model risk value criterion) to verify whether continuous alarms were generated relatively well. When only DCPA and TCPA criteria were applied, noncontinuous alarms or no alarms were generated, even when the ships were approaching a risky situation. When only the PARK model risk value criterion was applied, continuous alarms were generated from the pre-alarm stage. This usually occurs when two ships are farther apart, and there is sufficient time to react before an encounter. This may lead to alarm fatigue for the ship operator and can reduce the effectiveness of the collision warning alarm. It may also lead to the degradation of the reliability of the warning system for ship operators. However, the developed algorithm was able to warn the ship operator of a Danby continuously, generating an alarm step by step in a dangerous situation.
Based on the Vpass data collected for 7 days, the study used risk assessment tools such as the PARK model, the ES model, and the IWRAP MkII to assess the risk level of the target waters and compared the results with those of the frequent alarm zones. It was noted that there were frequent alarms in the eastern waters of Yeongheung Island, and the risk level was high in all models. Furthermore, the zones toward and to the south of the target waters are risky areas, where fishery concentration zones and waterways approach the pilot station and Daesan Harbor. There are also silica mine extraction zones in the area. The risk assessment based on ES Model and IWRAP MkII was relatively low, but the PARK model evaluated this sea area as high risk. By applying the PARK model to the collision warning algorithm, it was confirmed that this sea area is an alarm-prone area.
In summary, from this study, it was confirmed that the collision warning algorithm for small vessels that we developed in a previous study generates an appropriate alarm when a vessel encounters a dangerous situation. Furthermore, the feasibility of the algorithm was validated by confirming that the dangerous area and the alarm-prone area coincide.
In this study, we experimented in clear weather conditions according to the Beaufort scale 2; hence, there is a need to increase the reliability of the algorithm by setting a range of max environmental parameters while experimenting in various weather conditions in the future. Additionally, these results only apply to one sea geographical area. Thus, it must be further validated by applying it to several sea areas in the future. Since there is no model capable of evaluating maritime risk for small vessels, this study was based on a commonly used adaptable model. Therefore, this maritime risk assessment may be inappropriate for unforeseen scenarios involving small boats. To compensate for this, it will be necessary to develop a maritime risk assessment tool specifically for small vessels that will fit Pc values to small ships when executing IWRAP MkII. Additionally, fishing vessels have different sailing patterns during sailing vs. fishing. Thus, each algorithm needs to be upgraded, and the applicability of the algorithm must be improved by collecting actual ship operators’ qualitative assessments while supplementing the algorithm.

Author Contributions

Conceptualization, Y.-S.P. and M.-K.L.; methodology, M.-K.L., M.P., and N.-E.K.; software, M.-K.L., E.L., and N.-E.K.; validation, Y.-S.P., M.-K.L., and S.P.; data curation, M.-K.L.; writing—original draft preparation, M.-K.L.; writing—review and editing, Y.-S.P. and S.P.; visualization, M.-K.L. and E.L.; supervision, Y.-S.P.; project administration, Y.-S.P.; funding acquisition, Y.-S.P. All authors have read and agreed to the published version of the manuscript.

Funding

The contents of this paper are the results of the research project of the Ministry of Science and ICT of Korea [Project Name: 1711080083, Regional R&D Innovation Support Project].

Conflicts of Interest

The authors declare no conflict of interest.

Appendix A

Table A1. Factor values indicating the effect of each element the marine traffic safety of a ship in the PARK Model.
Ton Factor Length Factor Width Factor
not more than 500 ton0.634656not more than 70 m−1.065590not more than 10 m0.500588
500–1,000 ton−0.22998070–90 m−2.48791010–15 m−0.025510
1,000–3,000 ton2.18081390–108 m−0.53392015–20 m0.210588
3,000–5,000 ton−0.093240108–123 m−0.14200020–25 m−0.289200
5,000–7,000 ton−0.345600123–140 m−0.09125025–30 m0.360838
7,000–10,000 ton−0.765630140–160 m0.75482830–35 m0.099504
10,000–15,000 ton−0.126220160–185 m−0.49936035–40 m0.343936
15,000–20,000 ton−0.131530185–223 m−0.92794040–45 m0.046159
20,000–25,000 ton0.217815223 −243 m0.562870more than 45 m−0.289570
25,000–30,000 ton−0.145350243–259 m0.046498
30,000–50,000 ton−0.656140259–277 m0.709714Type Factor
50,000–60,000 ton0.063690more than 277 m−0.249550fishing vessel−0.072820
60,000–75,000 ton−0.381260 container ship−0.335320
75,000–100,000 ton0.313252License Factor pure car carrier−0.031670
more than 100,000 ton0.000000merchant 1 class0.177682tanker−0.082580
merchant 2 class0.109177LNG/LPG carrier0.315854
Career Factor merchant 3 class0.245199passenger ship−1.597980
not more than 1 year−0.104830 towing vessel−0.116540
1–3 years−0.332360Position Factor other cargo ship0.000000
3–5 years−0.064230captain0.184283
more than 5 years−0.136730chief officer0.176755Speed Factor
second officer0.296052OS speed # TS speed0.120578
Crossing Factor third officer−0.075180OS speed < TS speed−0.056520
CR450.468465 OS speed > TS speed0.000000
CR900.500211Side Factor
CR1350.660194TS on Stbd side−0.056600In/Out Harbor Factor
HO0.626923TS on Port side0.000000OS inner harbor0.062305
OS outer harbor0.000000

Appendix B

Figure A1. (a) Vpass data plot on 15 May 2014; (b) The plot after the interpolation of Vpass data with 10 s intervals on 15 May 2014; (c) Vpass data plot on 16 May 2014; (d) The plot after the interpolation of Vpass data with 10 s intervals on 16 May 2014; (e) Vpass data plot on 17 May 2014; (f) The plot after the interpolation of Vpass data with 10 s intervals on 17 May 2014; (g) Vpass data plot on 18 May 2014; (h) The plot after the interpolation of Vpass data with 10 s intervals on 18 May 2014; (i) Vpass data plot on 19 May 2014; (j) The plot after the interpolation of Vpass data with 10 s intervals on 19 May 2014; (k) Vpass data plot on 20 May 2014; (l) The plot after the interpolation of Vpass data with 10 s intervals on 20 May 2014; (m) Vpass data plot on 21 May 2014; (n) The plot after the interpolation of Vpass data with 10 s intervals on 21 May 2014.
Applsci 11 04479 g0a1aApplsci 11 04479 g0a1bApplsci 11 04479 g0a1c

References

  1. Jung, C.H. A Study on the Improvement of Safety by Accidents Analysis of Fishing Vessels. J. Fish. Mar. Sci. Educ. 2018, 30, 179–186. [Google Scholar]
  2. Subash, T.D.; Pradeep, A.S.; Joseph, A.R.; Jacob, A.; Jayaraj, P.S. Intelligent Collision Avoidance system for fishing boat. Mater. Today Proc. 2020, 24, 2457–2463. [Google Scholar] [CrossRef]
  3. Håvold, J.I. Safety culture aboard fishing vessels. Saf. Sci. 2010, 48, 1054–1061. [Google Scholar] [CrossRef]
  4. Kim, S.H.; Kim, H.S.; Lee, Y.W. The causes and counterplan for marine casualties of fishing boats according to the fishing types. J. Korean Soc. Fish Ocean Technol. 2020, 56, 246–257. [Google Scholar] [CrossRef]
  5. Korean Maritime Safety Tribunal. Statistics of Marine Accidents. 2019. Available online: https://www.kmst.go.kr/kcom/cnt/selectContentsPage.do?cntId=21010000 (accessed on 4 December 2020).
  6. IMO. The International Convention on Standards of Training, Certification and Watchkeeping for Fishing Vessel Personnel [Adopted in July 1995]; International Maritime Organization: London, UK, 1995. [Google Scholar]
  7. IMO. Cape Town Agreement of 2012 [Adopted in October 2012]; International Maritime Organization: London, UK, 2012. [Google Scholar]
  8. ILO. The ILO Work in Fishing Convention No. 118 [Adopted in May 2007]; International Labour Organization: Geneva, Switzerland, 2007. [Google Scholar]
  9. FAO. Joining Forces to Shape the Fishery Sector of Tomorrow; Food and Agriculture Organization of the United Nations: Rome, Italy, 2020. [Google Scholar]
  10. IMO. Convention on the International Regulations for Preventing Collisions at Sea, [with Amendments Adopted from December 2009]; International Maritime Organization: London, UK, 1972. [Google Scholar]
  11. Wang, J.; Pillay, A.; Kwon, Y.S.; Wall, A.D.; Loughran, C.G. An analysis of fishing vessel accidents. Accid. Anal. Prev. 2005, 37, 1019–1024. [Google Scholar] [CrossRef] [PubMed]
  12. Uğurlu, F.; Yıldız, S.; Boran, M.; Uğurlu, Ö.; Wang, J. Analysis of fishing vessel accidents with Bayesian network and Chi-square methods. Ocean Eng. 2020, 198, 106956. [Google Scholar] [CrossRef]
  13. An, K.; Kim, I.C.; Kim, C.S. A Study on Navigational Support Services for Improving Navigational Safety of Non-SOLAS Ships. J. Korean Soc. Mar. Environ. Saf. 2016, 22, 305–310. [Google Scholar] [CrossRef]
  14. Kang, W.S.; Kim, Y.D.; Lee, M.K.; Park, Y.S. The Development of a Collision Warning System for Small-Sized Vessels Using WAVE Communication Technology. J. Korean Soc. Mar. Environ. Saf. 2019, 25, 151–158. [Google Scholar] [CrossRef]
  15. Lee, E.B. A basic study on the development of ultrasonic alert system for preventing collision accident of small ships. J. Res. Inst. Mar. Ind. 2004, 15, 1–7. [Google Scholar]
  16. Kao, S.L.; Lee, M.A. Method for Small-Scale Fishing Boat Equipped with Radar Receiver to Avoid Ship Collision and the Radar Receiver Therefor. U.S. Patent 7,710,309, 4 May 2010. [Google Scholar]
  17. Kao, S.L.; Chang, K.Y. Study on fuzzy GIS for navigation safety of fishing boats. J. Mar. Eng. Technol. 2017, 16, 84–93. [Google Scholar] [CrossRef] [Green Version]
  18. Seo, A.; Hida, T.; Nishiyama, M.; Nagao, K. Comparison and evaluation on user interface of small ship navigation support system. Proc. Jpn. Inst. Navig. 2018, 6, 1–4. [Google Scholar]
  19. Hu, Y.; Park, G.K.; Pham, T.Q.M. A solving algorithm of navigational collision risk through data analysis of fishing vessel activities. J. Data. Inf. Manag. 2020, 2, 25–37. [Google Scholar] [CrossRef] [Green Version]
  20. Park, D.J.; Yim, J.B.; Lee, C.K. Modeling navigator errors in collisions using hidden markov models. J. Mar. Sci. Technol. 2020, 28, 631–639. [Google Scholar]
  21. Lee, C.K.; Kim, S.H.; Lee, J.G.; Lee, S.M.; Kim, M.S. A study on the characteristics of manoeuvrability of fishing vessel. J. Korean Soc. Fish. Ocean Technol. 2018, 54, 239–245. [Google Scholar] [CrossRef]
  22. Lim, S.W. A study about legal effect of navigation’s mistake on fishing vessels collision accident -Focused on the Korea maritime safety tribunal judgement with lights and shapes. J. Korea Mar. Law Assoc. 2020, 42, 81–112. [Google Scholar]
  23. Lee, M.K.; Park, Y.S. Collision prevention algorithm for fishing vessels using mmWAVE communication. J. Mar. Sci. Eng. 2020, 8, 115. [Google Scholar] [CrossRef] [Green Version]
  24. Lee, J.S. A basic study on the collision risk of VTS considering the operational characteristics of small vessels. In Proceedings of the Korean Institute of Navigation and Port Research Conference, Gyoungju, Korea, 8 November 2018; pp. 273–274. [Google Scholar]
  25. Cvach, M. Monitor alarm fatigue: An integrative review. Biomed. Instrum. Technol. 2012, 46, 268–277. [Google Scholar] [CrossRef] [PubMed] [Green Version]
  26. Lim, S.W. Application Scope and Standard of ‘Fishing Vessels Working in Fishery’—Focused on the Correct Interpretation Direction. Justice 2020, 179, 161–181. [Google Scholar] [CrossRef]
  27. Park, Y.; Park, J.; Shin, D.; Lee, M.; Park, S. Application of potential assessment of risk (PARK) model in Korea waterways. J. Int. Marit. Saf. Environ. Aff. Shipp. 2017, 1, 1–10. [Google Scholar] [CrossRef] [Green Version]
  28. Weather Information of Korea Meteorological Administration. Available online: http://www.weather.go.kr/mini/marine/marine_integrate.jsp (accessed on 17 December 2020).
  29. Ministry of Oceans and Fisheries. Statistical Yearbook of Oceans and Fisheries; Ministry of Oceans and Fisheries: Sejong City, Korea, 2020; p. 466. [Google Scholar]
  30. Korea Ministry of Government Legislation. Notification on Installation Standards and Operation of V.-Pass Devices, etc. Available online: https://www.law.go.kr/ (accessed on 12 January 2021).
  31. Korea Ministry of Government Legislation. Fishing Vessels Act Article 5-2 Ship Location Transmitters Equipment for Fishing Vessels. Available online: https://www.law.go.kr/ (accessed on 12 January 2021).
  32. Korea Ministry of Government Legislation. Fishing Vessel Facility Standards Article 191 Ship Location Transmitters Equipment for Fishing Vessels. Available online: https://www.law.go.kr/ (accessed on 12 January 2021).
  33. Inoue, K. Evaluation method of ship-handling difficulty for navigation in restricted and congested waterways. J. Navig. 2000, 53, 167–180. [Google Scholar] [CrossRef]
  34. IALA. IALA Waterway Risk Assessment Programme (IWRAP) Theory; IALA: Saint-Germain-en-Laye, France, 2014; pp. 2–16. [Google Scholar]
  35. Korea Hydrographic and Oceanographic Agency. Oceanmap. Available online: http://www.khoa.go.kr/oceanmap/main.do (accessed on 17 February 2021).
  36. Korea Hydrographic and Oceanographic Agency. Nautical Chart Approaches to Asan Man No. 3437; Korea Hydrographic and Oceanographic Agency: Busan, Korea, 2019. [Google Scholar]
Figure 1. Flowchart of the study.
Applsci 11 04479 g001
Figure 2. Overview of the collision warning algorithm for small fishing vessels.
Applsci 11 04479 g002
Figure 3. Images of the front portion of each ship used in the real ship test and installed antennas: (a) ship A (Gyeonginho), (b) ship B (Yeonjaeho), and (c) ship C (Ara-2 ho).
Applsci 11 04479 g003
Figure 4. (a) Scenario 1: ships A and B sail in parallel at a course of ~045° while ship C sails from the opposite direction at ~225° and (b) scenario 2: ship A sails at the course of ~045°, ship B at ~315°, and ship C at ~180°, approaching a single location.
Applsci 11 04479 g004
Figure 5. (a) Diagrammatic representation of the track of alarms generated from the test results of Scenario 1 and (b) graphical representation of the alarms generated on ship C depending on time (from the top, alarms based only on the DCPA and TCPA criteria, alarms based only on PARK model risk value criterion, and alarms based on the algorithm).
Applsci 11 04479 g005
Figure 6. (a) Diagrammatic representation of the track of alarms generated from the test results of scenario 2 and (b) graphical representation of the alarms generated on ship C depending on the time (from the top, alarms based only on DCPA and TCPA criteria, alarms based only on PARK model risk value criterion, and the alarms based on the algorithm).
Applsci 11 04479 g006
Figure 7. (a) Vpass data plot for 7 days and (b) the plot after the interpolation of Vpass data with 10 s intervals for 7 days.
Applsci 11 04479 g007
Figure 8. (a) Diagrammatic representation of the track of the alarms generated from the results of case 1 and (b) graphical representation of the alarms generated on ship D based on the time (from the top, alarms based only on DCPA and TCPA criteria, alarms based only on PARK model risk value criterion, and alarms based on the algorithm).
Applsci 11 04479 g008
Figure 9. (a) Diagrammatic representation of the track of the alarms generated from the results of case 2 and (b) graphical representation of the alarms generated on ship B depending on the time (from the top, the alarms based only on DCPA and TCPA criteria, alarms based only on the PARK model risk value criterion, and alarms based on the algorithm).
Applsci 11 04479 g009
Figure 10. (a) Heat map of the alarm generation zone, (b) heat map with the PARK model risk value at or above five, (c) heat map with ES value at or over 750, and (d) results of the collision frequency estimation by IWRAP MkII.
Applsci 11 04479 g010
Figure 11. Target waters to which 110 legs were applied according to the traffic flow.
Applsci 11 04479 g011
Figure 12. (a) Graph of the alarm generation ratio depending on the number of legs, (b) graph of the ratio of PARK model risk value at or over five depending on the number of legs, (c) graph of the ratio of ES value at or over 750 depending on the number of legs, and (d) graph of the yearly collision estimation frequency depending on the number of legs.
Applsci 11 04479 g012
Table 1. Internal and external elements considered in the PARK model.
Internal elementsType factor, Length factor, Width factor, Tonnage factor, Career factor, License factor, and Position factor
External elementsCrossing factor, Side factor, In/Out harbor factor, and Speed factor
Table 2. Detailed specifications of target ships for the real ship test.
Ship TypeLength (m)Width (m)Depth (m)Gross Tonnage (G/T)
AFishing10.953.310.834.97
BFishing10.003.270.826.63
CFishing10.064.120.999.77
Table 3. Analysis of the situation when the first alarm was generated on each ship from the test results of Scenario 1.
Time (s)Own ShipTarget ShipDistance (m)DCPA (m)TCPA (s)RiskAlarm
99.3Ship BShip C1689.5621.86148.877.0first Main
99.3Ship CShip B1689.5621.86148.877.0first Main
105.1Ship AShip C1596.5431.17140.827.0first Main
161.1Ship BShip C924.2910.5083.547.0second Main
161.1Ship CShip B924.2910.5083.547.0second Main
211.5Ship AShip B89.4127.55146.347.0second Main
Table 4. Analysis of the situation when the first alarm was generated on each ship from the test results of scenario 2.
Time (s)Own ShipTarget ShipDistance (m)DCPA (m)TCPA (s)RiskAlarm
176.4Ship BShip C1387.236.70149.937.0First Main
176.4Ship CShip B1387.236.70149.937.0First Main
191.6Ship AShip B1049.6312.43149.777.0First Main
210.9Ship AShip B913.8129.53139.567.0Second Main
210.9Ship BShip A913.8129.53139.567.0Second Main
224.5Ship CShip B925.761.08100.517.0Second Main
Table 5. Analysis of the situation of alarm generation on ship D in case 1.
Time (s)Target ShipDistance (m)DCPA (m)TCPA (s)RiskAlarm
9.7Ship C1067.5329.59149.977.0first Main
41.3Ship C815.5434.8383.397.0second Main
113.2Ship C76.8876.880.046.0second Main
247.8Ship B753.3830.4170.357.0second Main
317.2Ship B8.208.120.117.0second Main
Table 6. Analysis of the situation of alarm generation on ship B in case 2.
Time (s)Target ShipDistance (m)DCPA (m)TCPA (s)RiskAlarm
171.6Ship D935.7427.27101.017.0first Main
172.9Ship D923.7627.0999.727.0second Main
266.8Ship D135.12135.100.585.0second Main
318.1Ship D58.7627.6359.937.0second Main
341.2Ship A85.3826.3738.557.0second Main
437.2Ship A26.2517.65566.255.0second Main
452.2Ship A17.3512.95149.647.0second Main
471.4Ship A5.565.407.047.0second Main
Publisher’s Note: MDPI stays neutral with regard to jurisdictional claims in published maps and institutional affiliations.

