1. Introduction
After Fukushima nuclear power plant accident, many efforts have been made to enhance the seismic capacity of nuclear power plants, especially for old nuclear power plants in operation, and to accommodate the beyond design basis earthquakes.
In general, the seismic capacity of the nuclear power plants has been handled at the plant level, but recently the individual seismic capacity of the safety-related facility components such as control cabinet, emergency diesel generator, remote shutdown console, battery pack, spent fuel rack, and so on has become important in determining the seismic capacity of nuclear power plants. Especially enhancing the seismic capacity of the operating nuclear power plants, which have experienced various aging environments for a long service lifetime, is a critical issue in points of safety against potential beyond design basis earthquakes.
There may be many ways to increase the seismic capacity of individual nuclear facility components [
1,
2,
3], but applying the customized seismic isolators to individual nuclear components can be one of the effective approaches [
4,
5].
There are many types of seismic isolators such as friction pendulum system, rigid sliding bearing with damper, elastic sliding bearing with damper, laminated rubber bearing, etc. [
5,
6,
7,
8,
9]. Among them, the laminated rubber bearings (LRB) have been popularly developed in many countries for nuclear applications because they can support very heavyweight and are very flexible in shear deformation against horizontal earthquakes. Due to these characteristics, LRBs have been generally developed for seismic isolation of buildings [
10,
11,
12,
13,
14,
15,
16]. There are many studies on shaking table tests of LRBs for a building structure seismic isolation, but most of them are performed with the reduced scale LRBs [
17,
18,
19,
20]. For this reason, there are very few studies of the shaking table tests for the full-scale LRBs.
In previous studies, the small-sized LRBs with 10 kN vertical design load and 2.3 Hz seismic isolation frequency have been developed for individual nuclear component seismic isolation instead of entire building isolation. The developed LRB uses natural rubber and a lead plug is inserted in the center for damping. The design mechanical properties of LRB have been identified by the quasi-static tests [
21].
In this study, the shaking table tests of the full-scale LRBs developed in previous studies are carried out and their seismic isolation performance and dynamic characteristics are investigated through a well-established test matrix. The test conditions included in the test matrix are established to investigate (1) three levels of the seismic load, i.e., OBE (Operating Basis Earthquake), SSE (Safe Shutdown Earthquake), BDBE (Beyond Design Basis Earthquake), (2) damping function of the lead plugin continuous aftershock conditions, (3) consistent fabrication quality of small-sized LRBs, (4) extreme behavior of LRB, and (5) confirm the LRB design parameters. The used input motions in shaking table tests correspond to the typical floor response spectrum at 137 ft elevation of the nuclear power plant building structure, where the seismic isolation target components are expected to be located. To confirm the seismic isolation performance, three beam structures with different natural frequencies are installed both on the shaking table and the dummy mass supported by the LRBs, and their seismic responses of non-seismic isolation and seismic isolation cases are measured for comparison. Seismic analyses with two kinds of LRB models of the Bi-linear and the equivalent stiffness-damping are performed with the identified mechanical properties in previous studies and their results are compared with those of the tests to confirm the dynamic design characteristics.
2. Review of LRB Design Characteristics
In previous studies, the lead inserted small-sized LRBs have been designed with 100 mm outer diameter and a design vertical inertia load of 10 kN. In this design, the lead plug with a 21.5 mm diameter is inserted into the LRB center position to take the role of energy dissipation. Ultimately this is expected to reduce the maximum shear displacement of LRB during the seismic events.
The total rubber height is 20 mm with appropriate shape factors of S1 = 9.9 and S2 = 5.0, where S1 represents the ratio of the area of the rubber plate where the surface pressure applies and the free surface area where the rubber plate; S2 represents the ratio of the diameter and the total rubber height.
The design shear displacement of LRB is 35 mm corresponding to 175% shear strain of LRB based on the total rubber height of 20 mm. To accommodate the beyond design basis earthquake, the 70 mm corresponding to 350% shear strain of LRB is set to increase the seismic fragility capacity for the peak ground motions.
Table 1 presents the summary of the design parameters of the lead inserted small-sized LRB to be carried out by the shaking table tests to identify its seismic isolation performance characteristics.
The LRB dynamic characteristics corresponding to the design parameters are presented in
Table 2. As shown in the table, the horizontal seismic isolation frequency at the design shear displacement level is 2.3 Hz for a design and the identified frequency by the quasi-static tests is 2.25 Hz [
21]. The critical damping ratio is 25.5% for a design and the identified value by the quasi-static tests is 24.1%. For equivalent bi-linear characteristics of LRB, the designed tangential stiffness and the characteristic strength are 123 kN/m and 3 kN, respectively, and the identified values by the quasi-static tests are 122 kN/m and 2.72 kN, respectively.
3. Seismic Shaking Table Tests
3.1. Performance of Shaking Table Test Facility
Table 3 presents the shaking table information used in this study. As shown in the table, the table size is 4 m × 4 m and the maximum loading capacity is 300 kN. The information related to the control software of the MTS 469D can be found in the MTS, 2021 [
22].
3.2. Description of Seismically Isolated Test Mockup
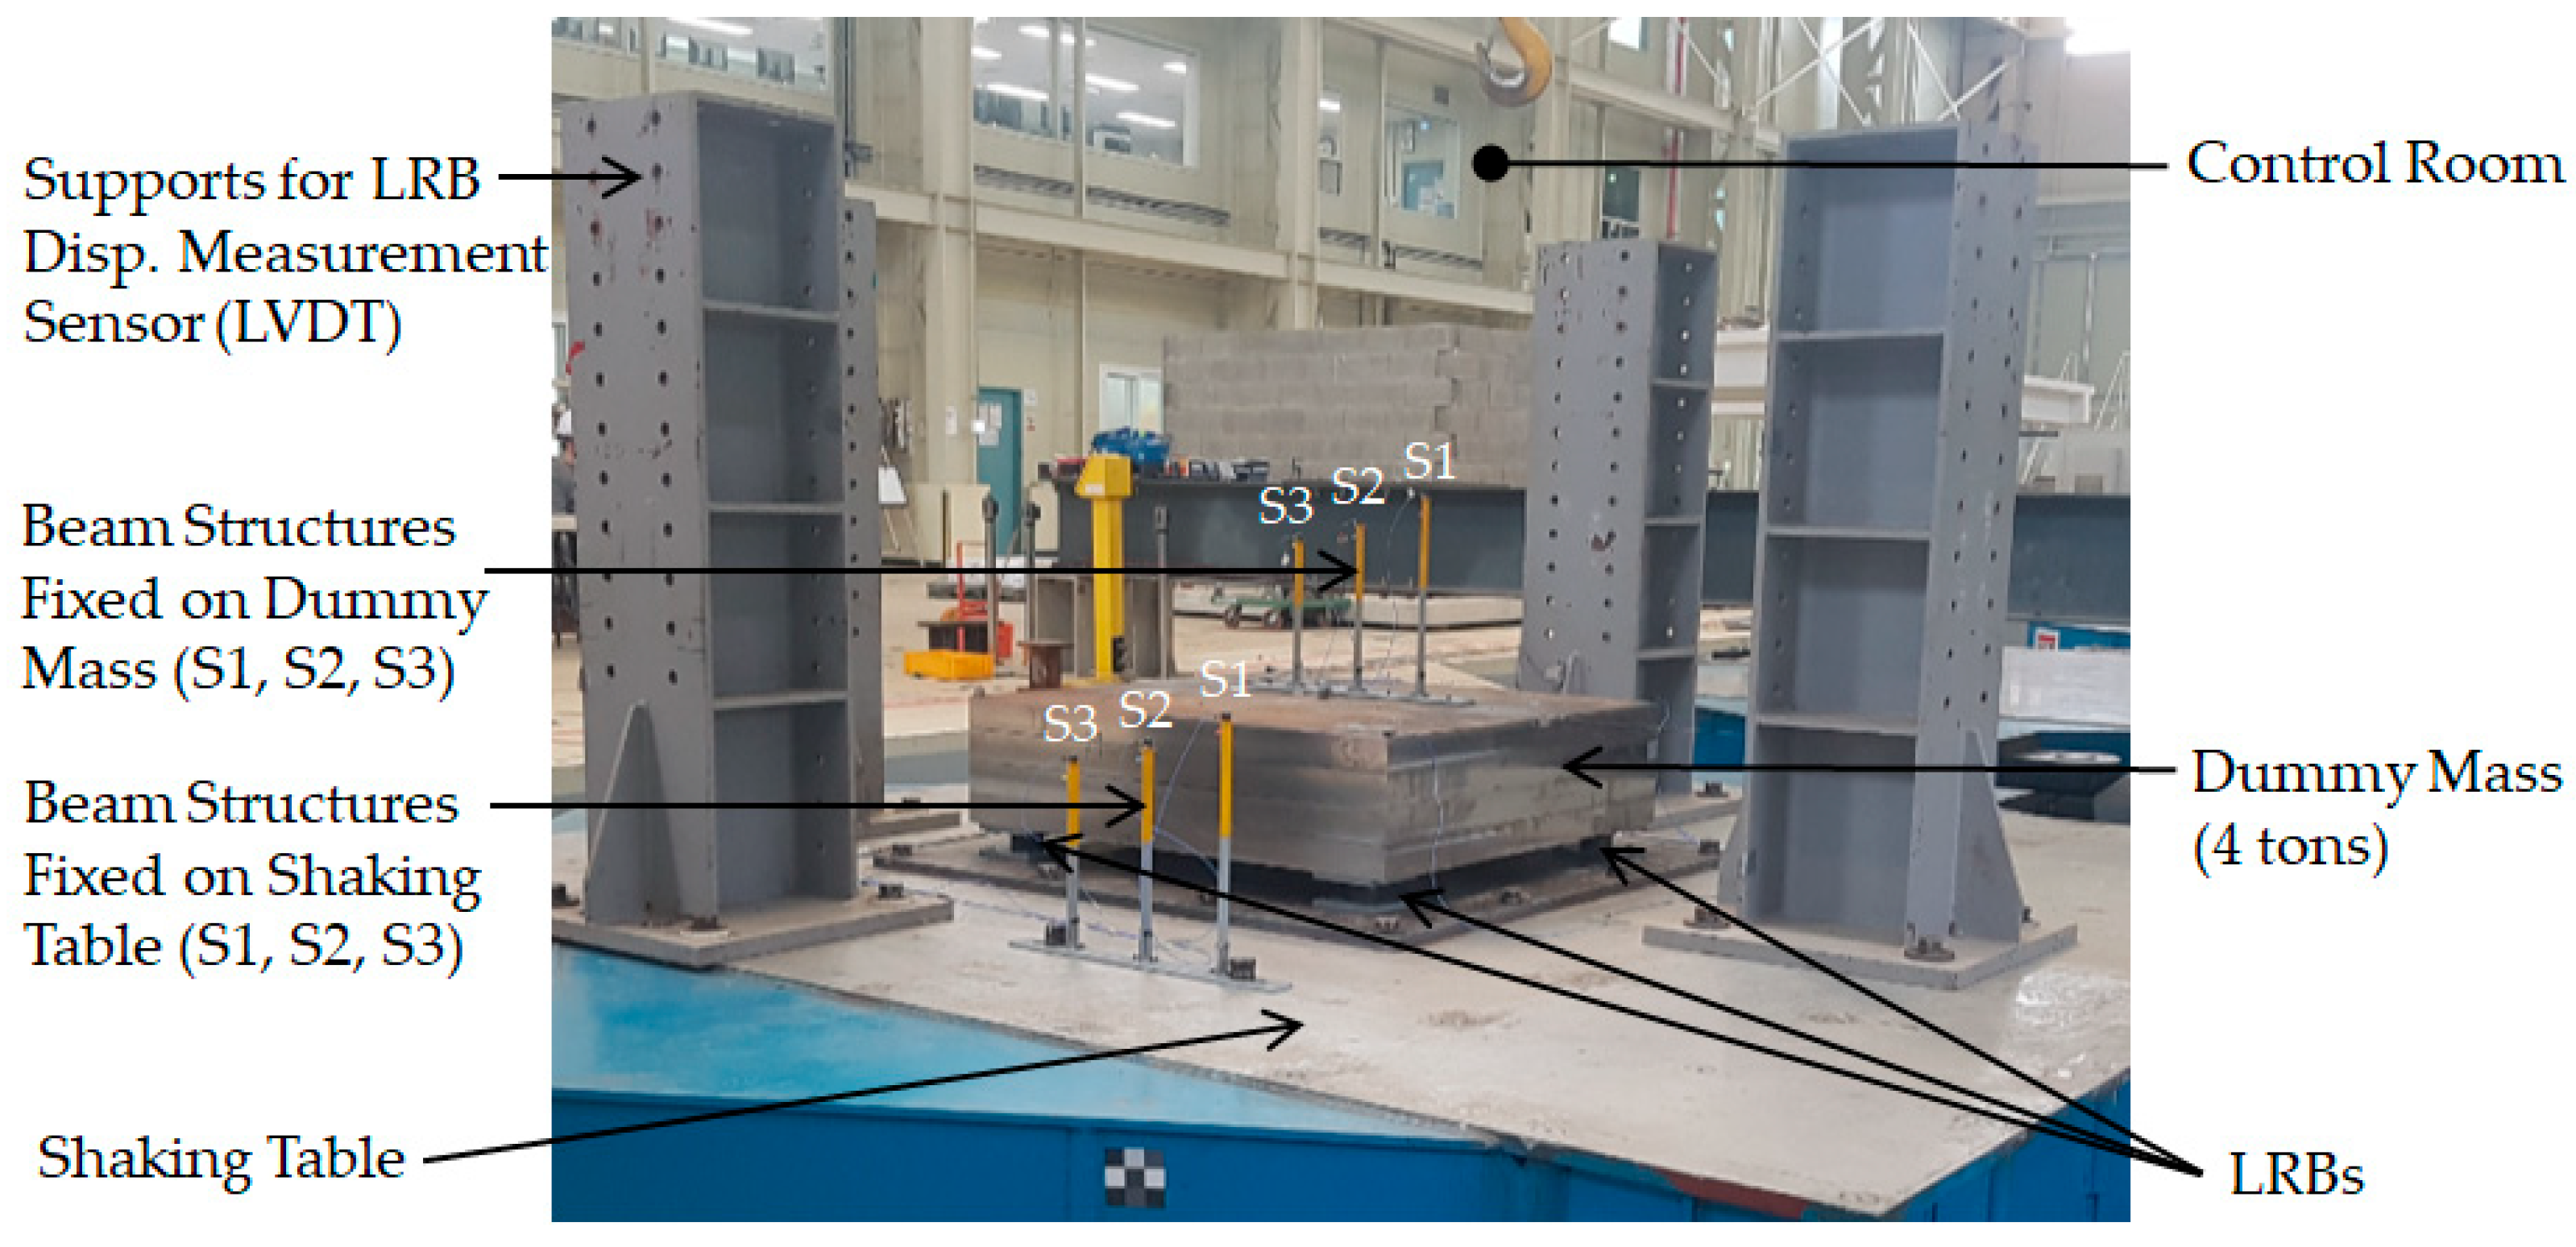
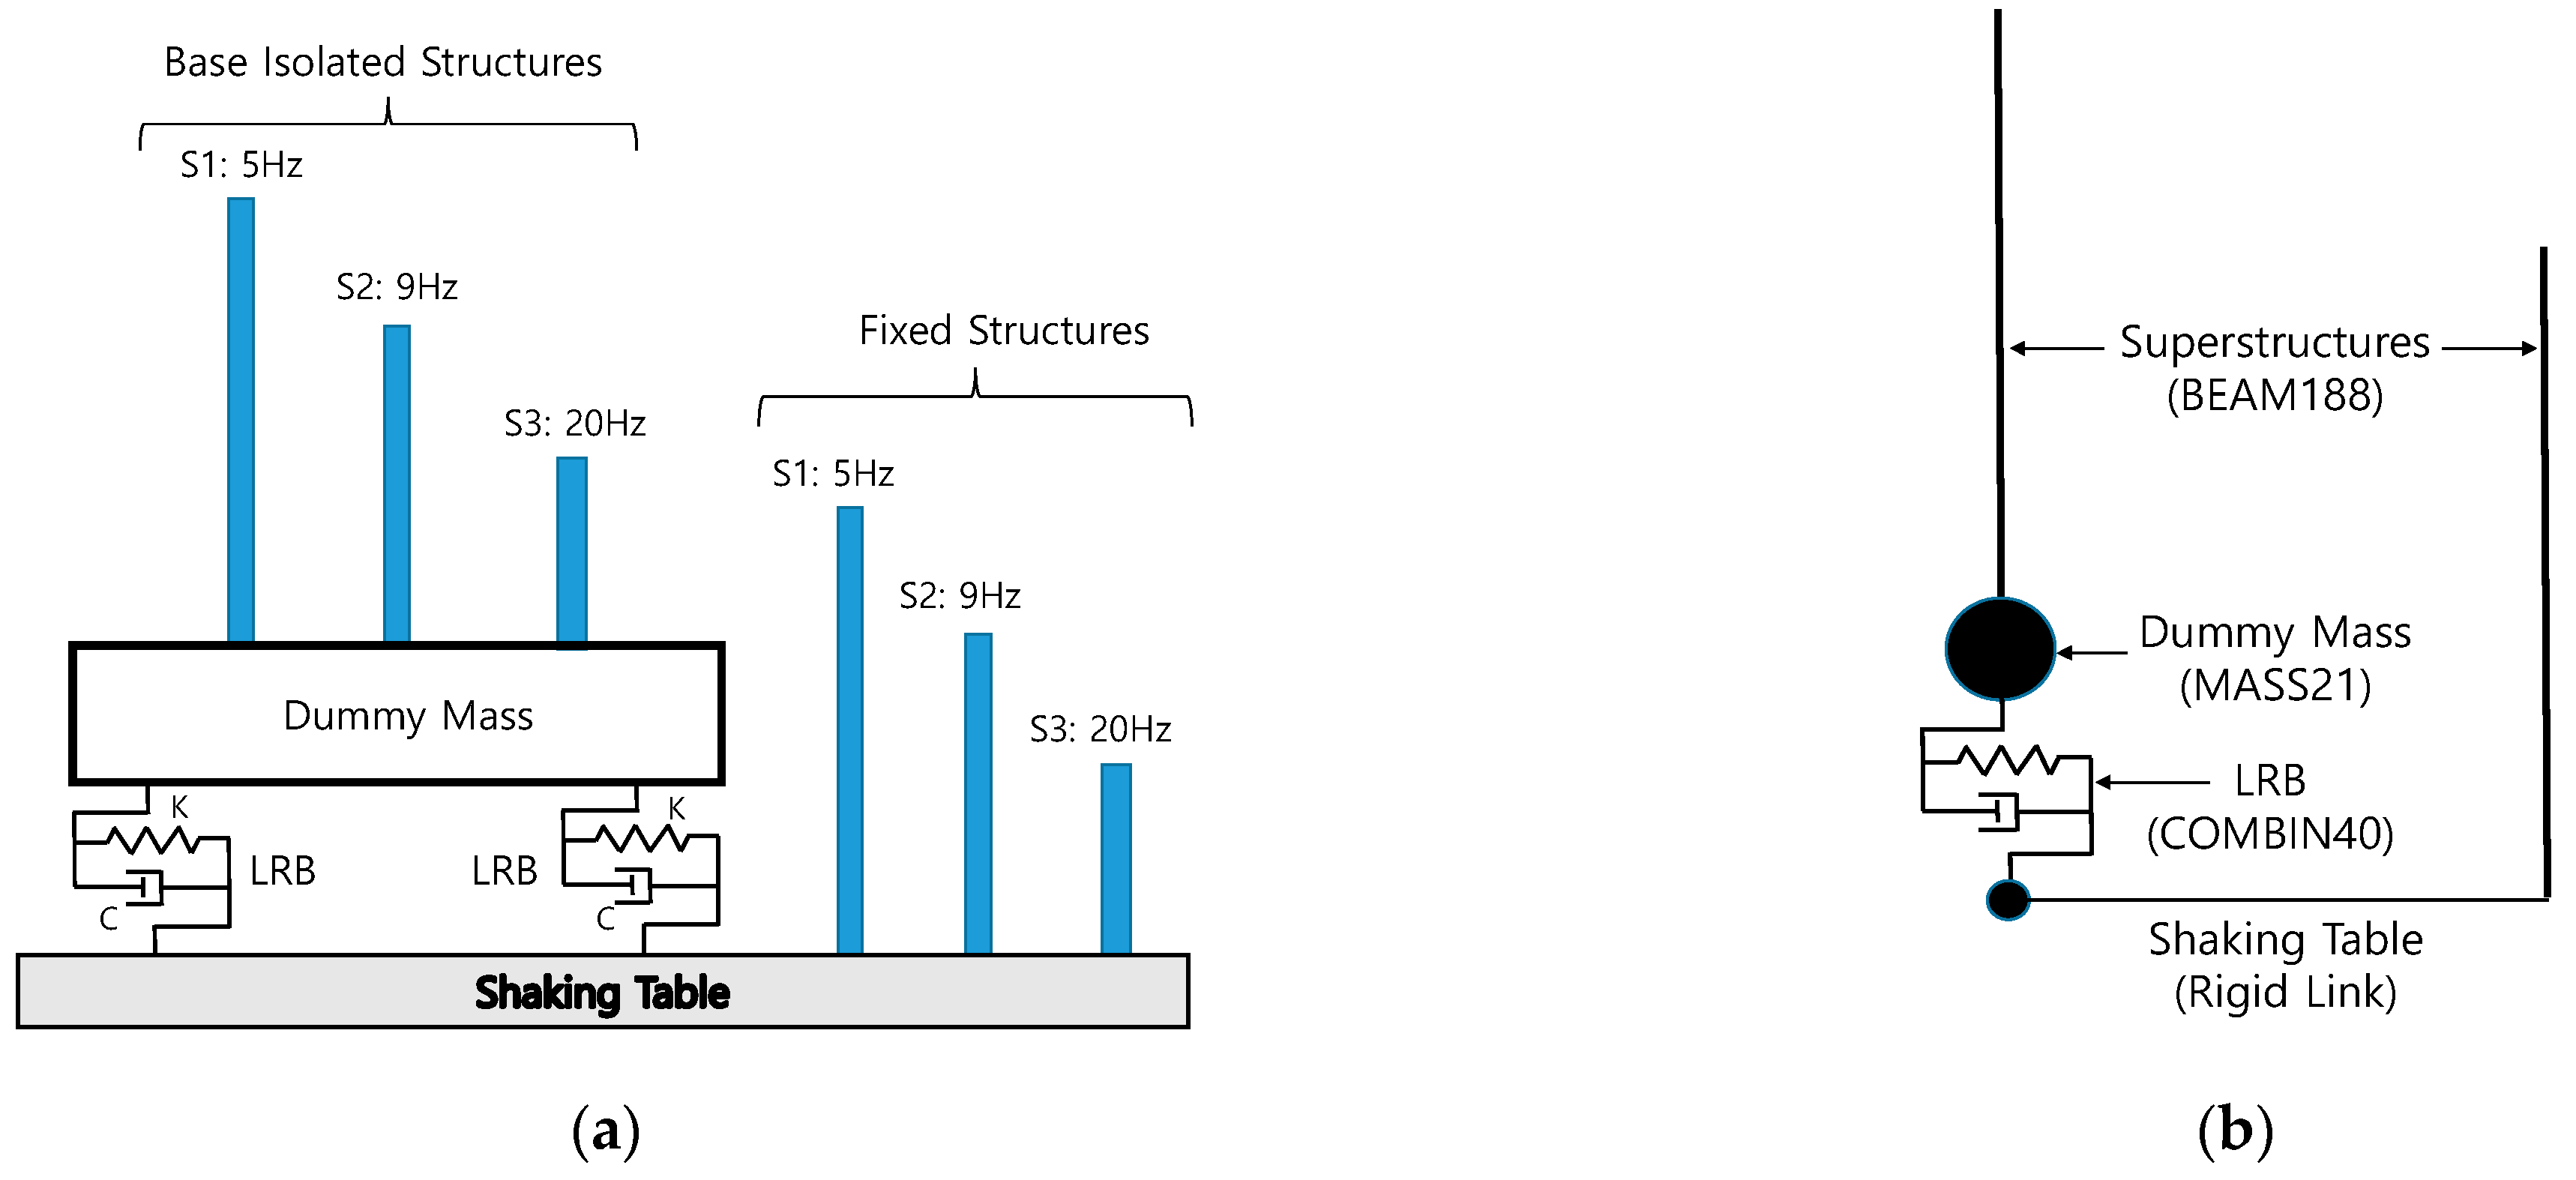
As shown in
Table 1, the designed LRB has a vertical load of 10 kN (≅ 1 ton) to perform the seismic isolation frequency of 2.3 Hz. To validate their seismic isolation characteristics during the actual seismic loading conditions, the total dummy mass of 4 tons is fabricated with a rectangular shape (1300 mm × 1300 mm × 320 mm) and four LRBs are installed between the shaking table and the bottom of the dummy mass at each corner with bolted joint connection, as shown in
Figure 1.
To investigate the seismic isolation performance induced by LRBs, three beam structures (S1–S3) are installed both on the shaking table and on the dummy mass, which will represent the actual superstructures to be seismically isolated. The target natural frequencies for beam structures are 5 Hz for S1, 9 Hz for S2, and 20 Hz for S3. When considering the design seismic isolation frequency of 2.3 Hz, the S1 structure is set to investigate the seismic responses of the structure near the seismic isolation frequency. The S2 structure is aimed to investigate the seismic isolation performance for the strong input motion having a spectral peak around 10 Hz. The S3 structure is prepared to validate the seismic isolation responses of superstructures having high-frequency dynamic characteristics.
For the measurement of seismic responses, the accelerometers are installed on the shaking table for the input seismic motion and on the center of the dummy mass for the seismic isolation response. To obtain the seismic responses of the beam structures both on the shaking table and on the dummy mass, the accelerometers are attached at top of each beam structure. To measure the LRB shear displacement response, which will be the relative displacement between the shaking table and the dummy mass, the LVDT (Linear Variable Differential Transformer) is installed between the sensor supports (
Figure 1) and the dummy mass.
3.3. Seismic Input Motions
The seismic input motion used for the shaking table test is obtained from the typical floor response spectrum at an elevation of 137 ft in nuclear power plant building structure, which is the location where the target facility components can be seismically isolated by using LRBs to increase the seismic capacity or to accommodate the beyond design basis earthquakes.
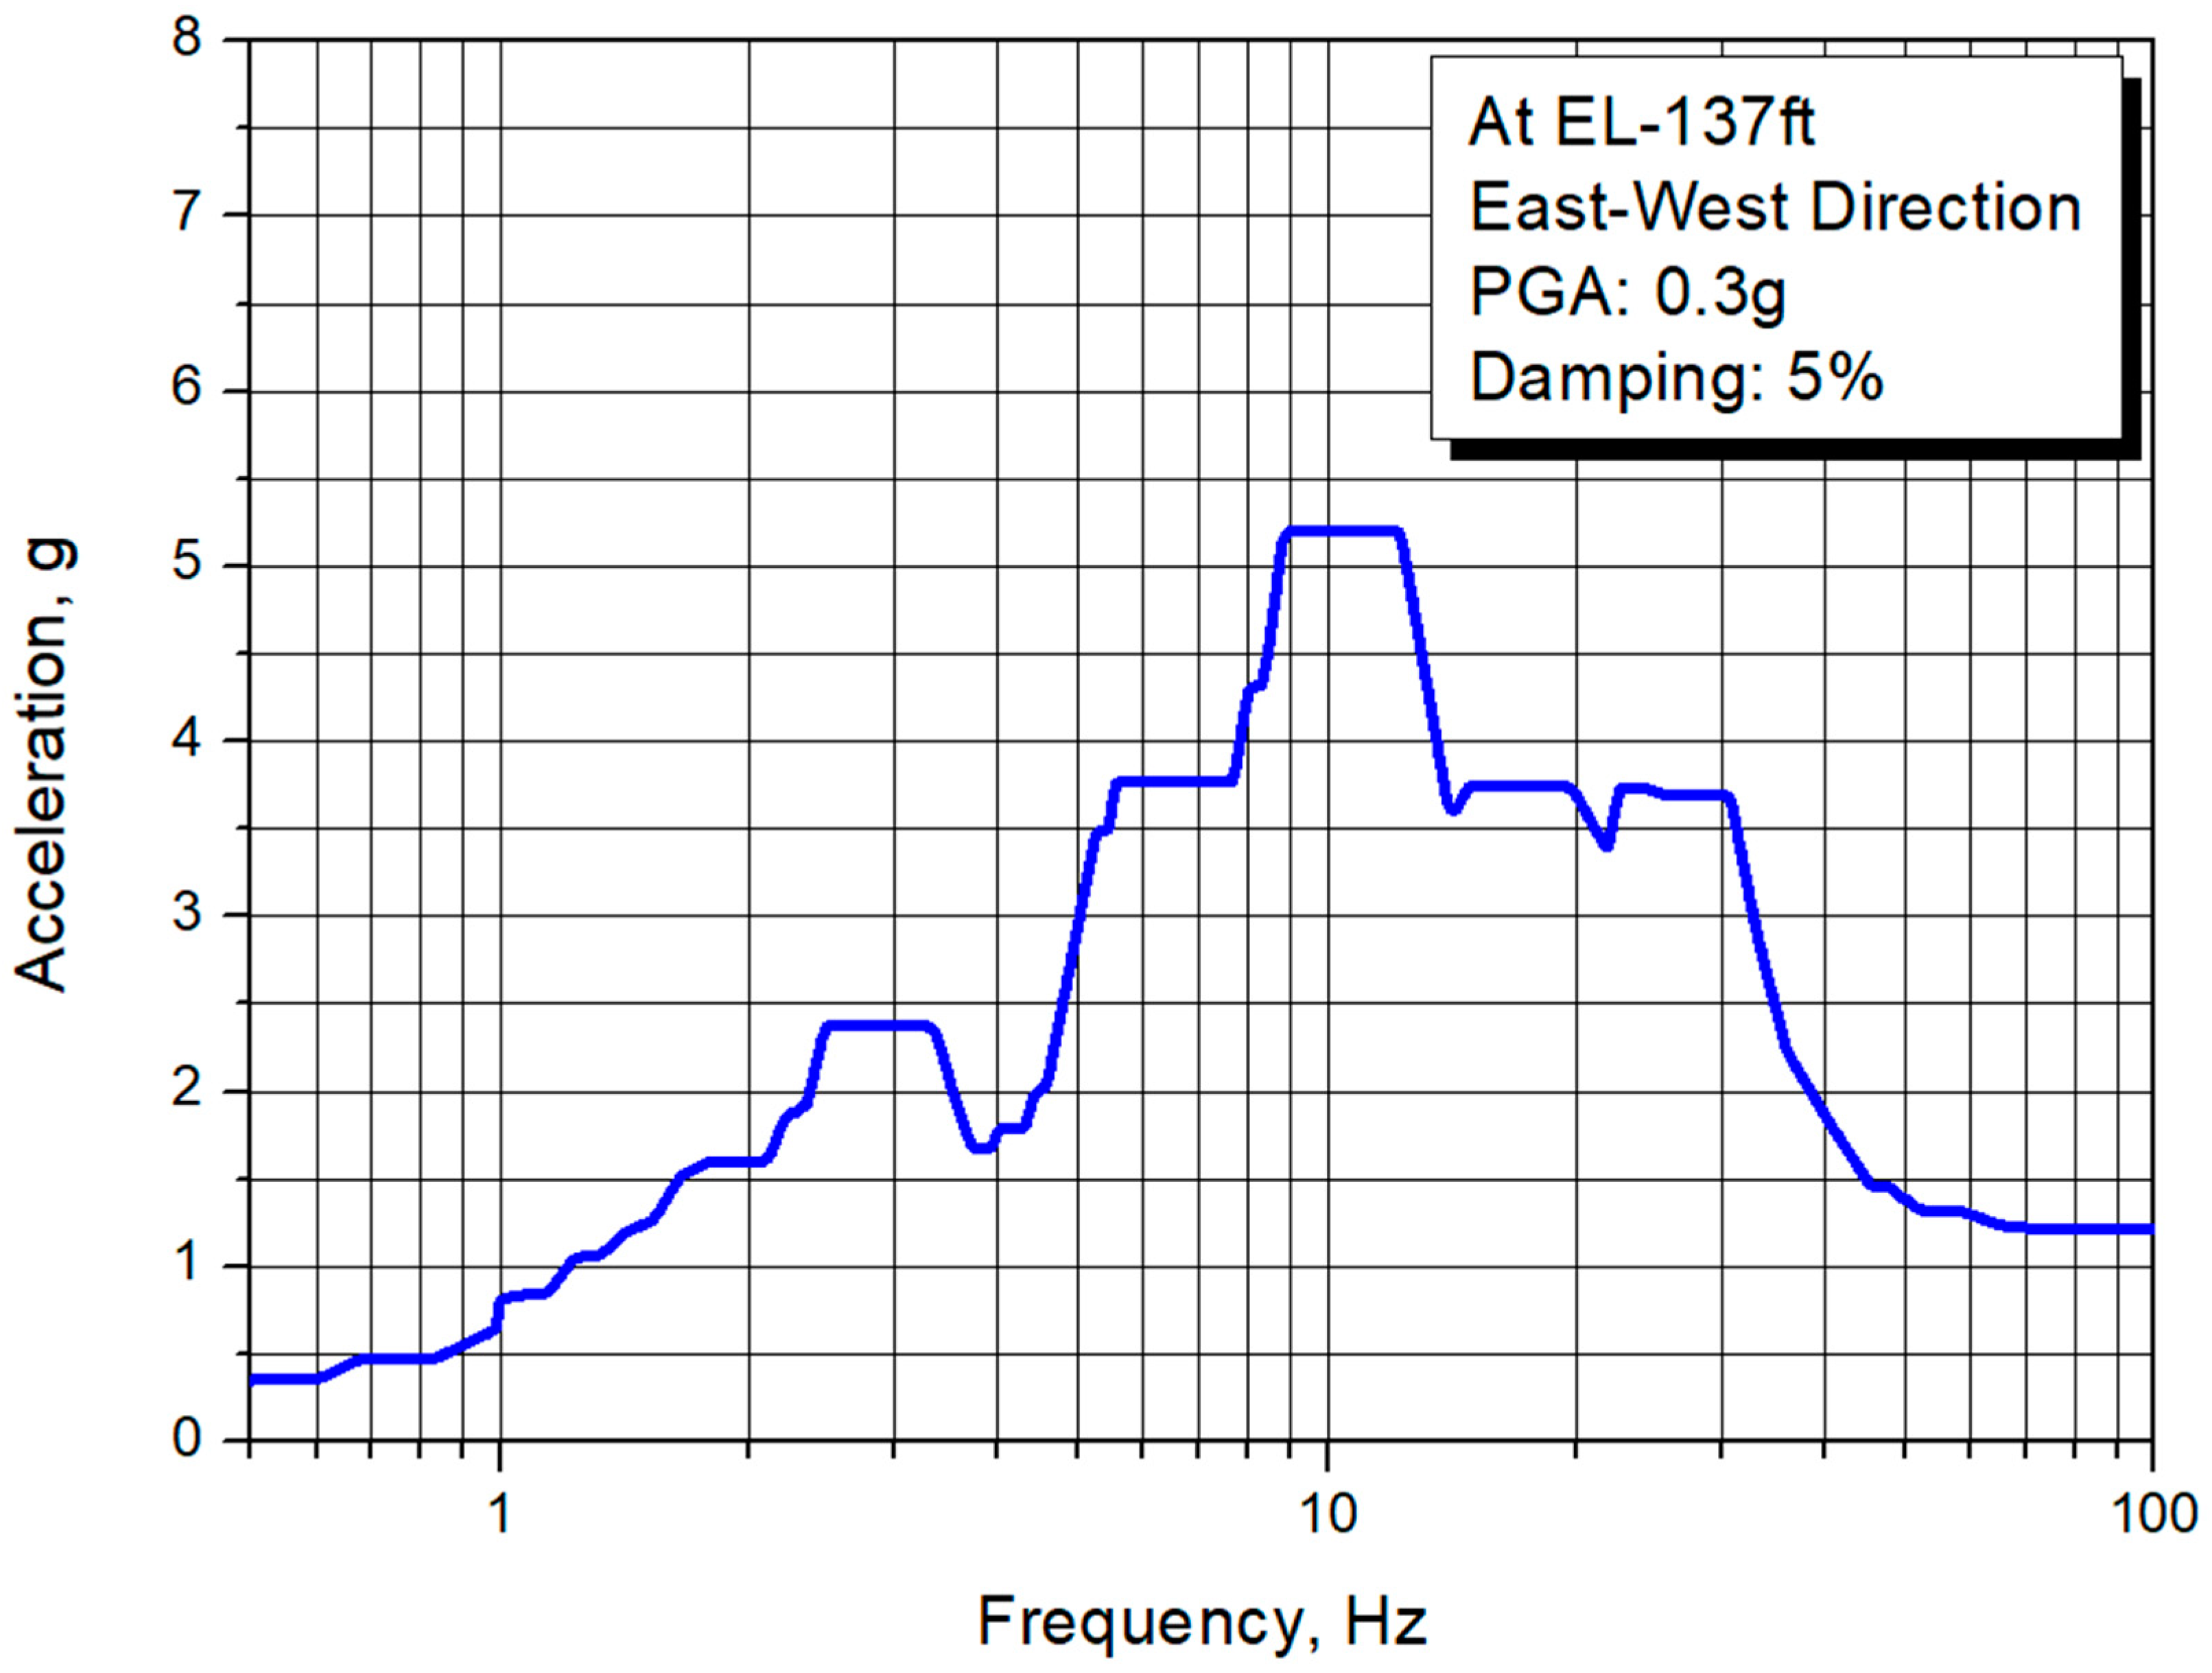
Figure 2 presents the design response spectrum (DRS) considered in this shaking table test. This spectrum is obtained from the system (nuclear building structures) seismic analysis using the seismic time history response analysis method with the design response spectrum conformed to the US NRC RG 1.60 [
23]. As shown in the figure, the zero period acceleration value is 1.22 g, amplified about four times. The broadened spectral peak ranges from 9 Hz to 12 Hz.
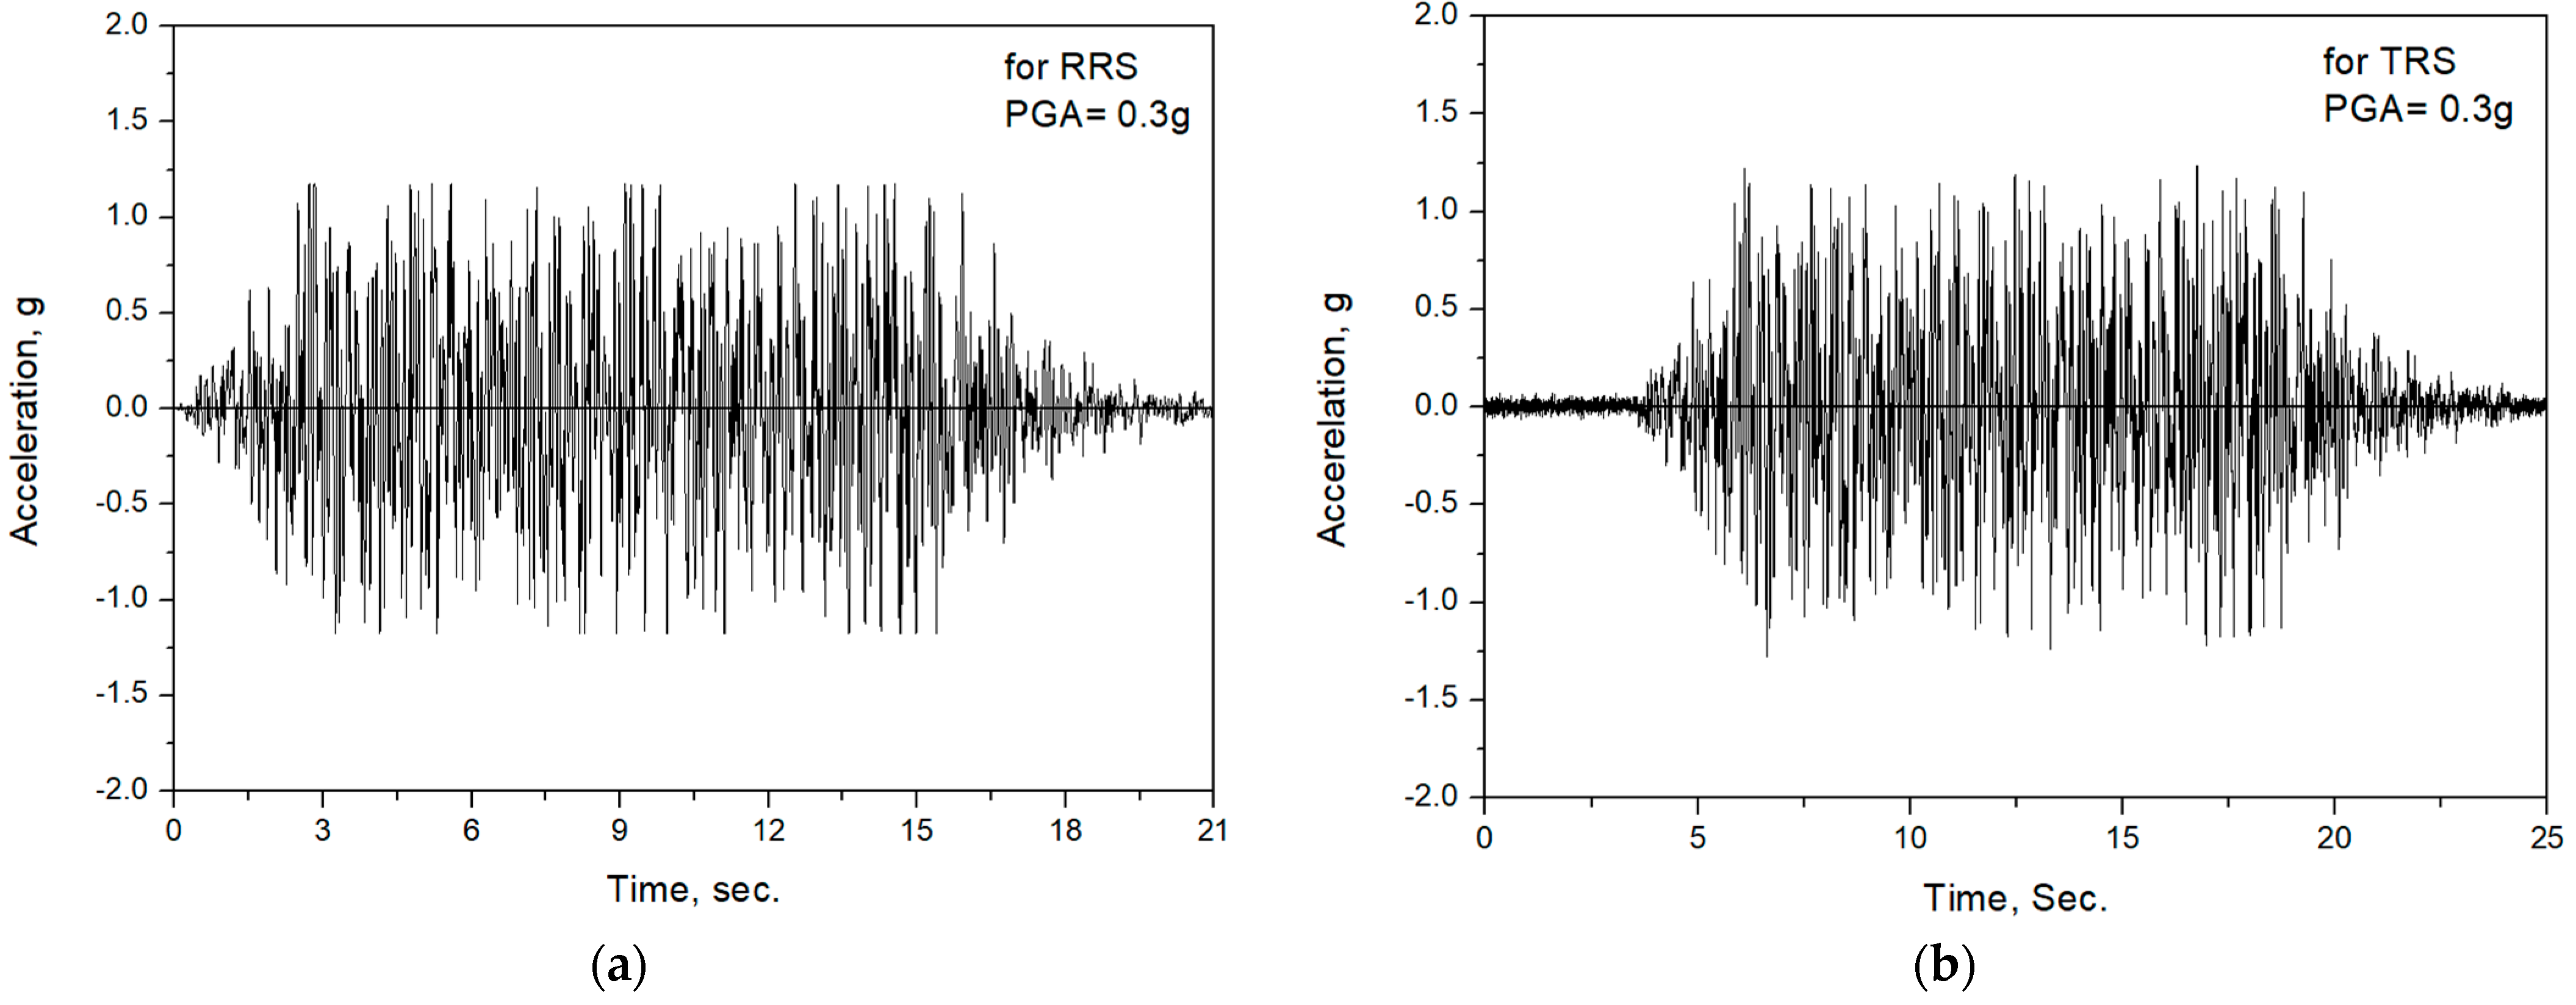
Figure 3a shows the generated artificial acceleration time history enveloped the DRS, which is the required shaking table input motion.
Figure 3b is the actual shaking table motion measured at the shaking table.
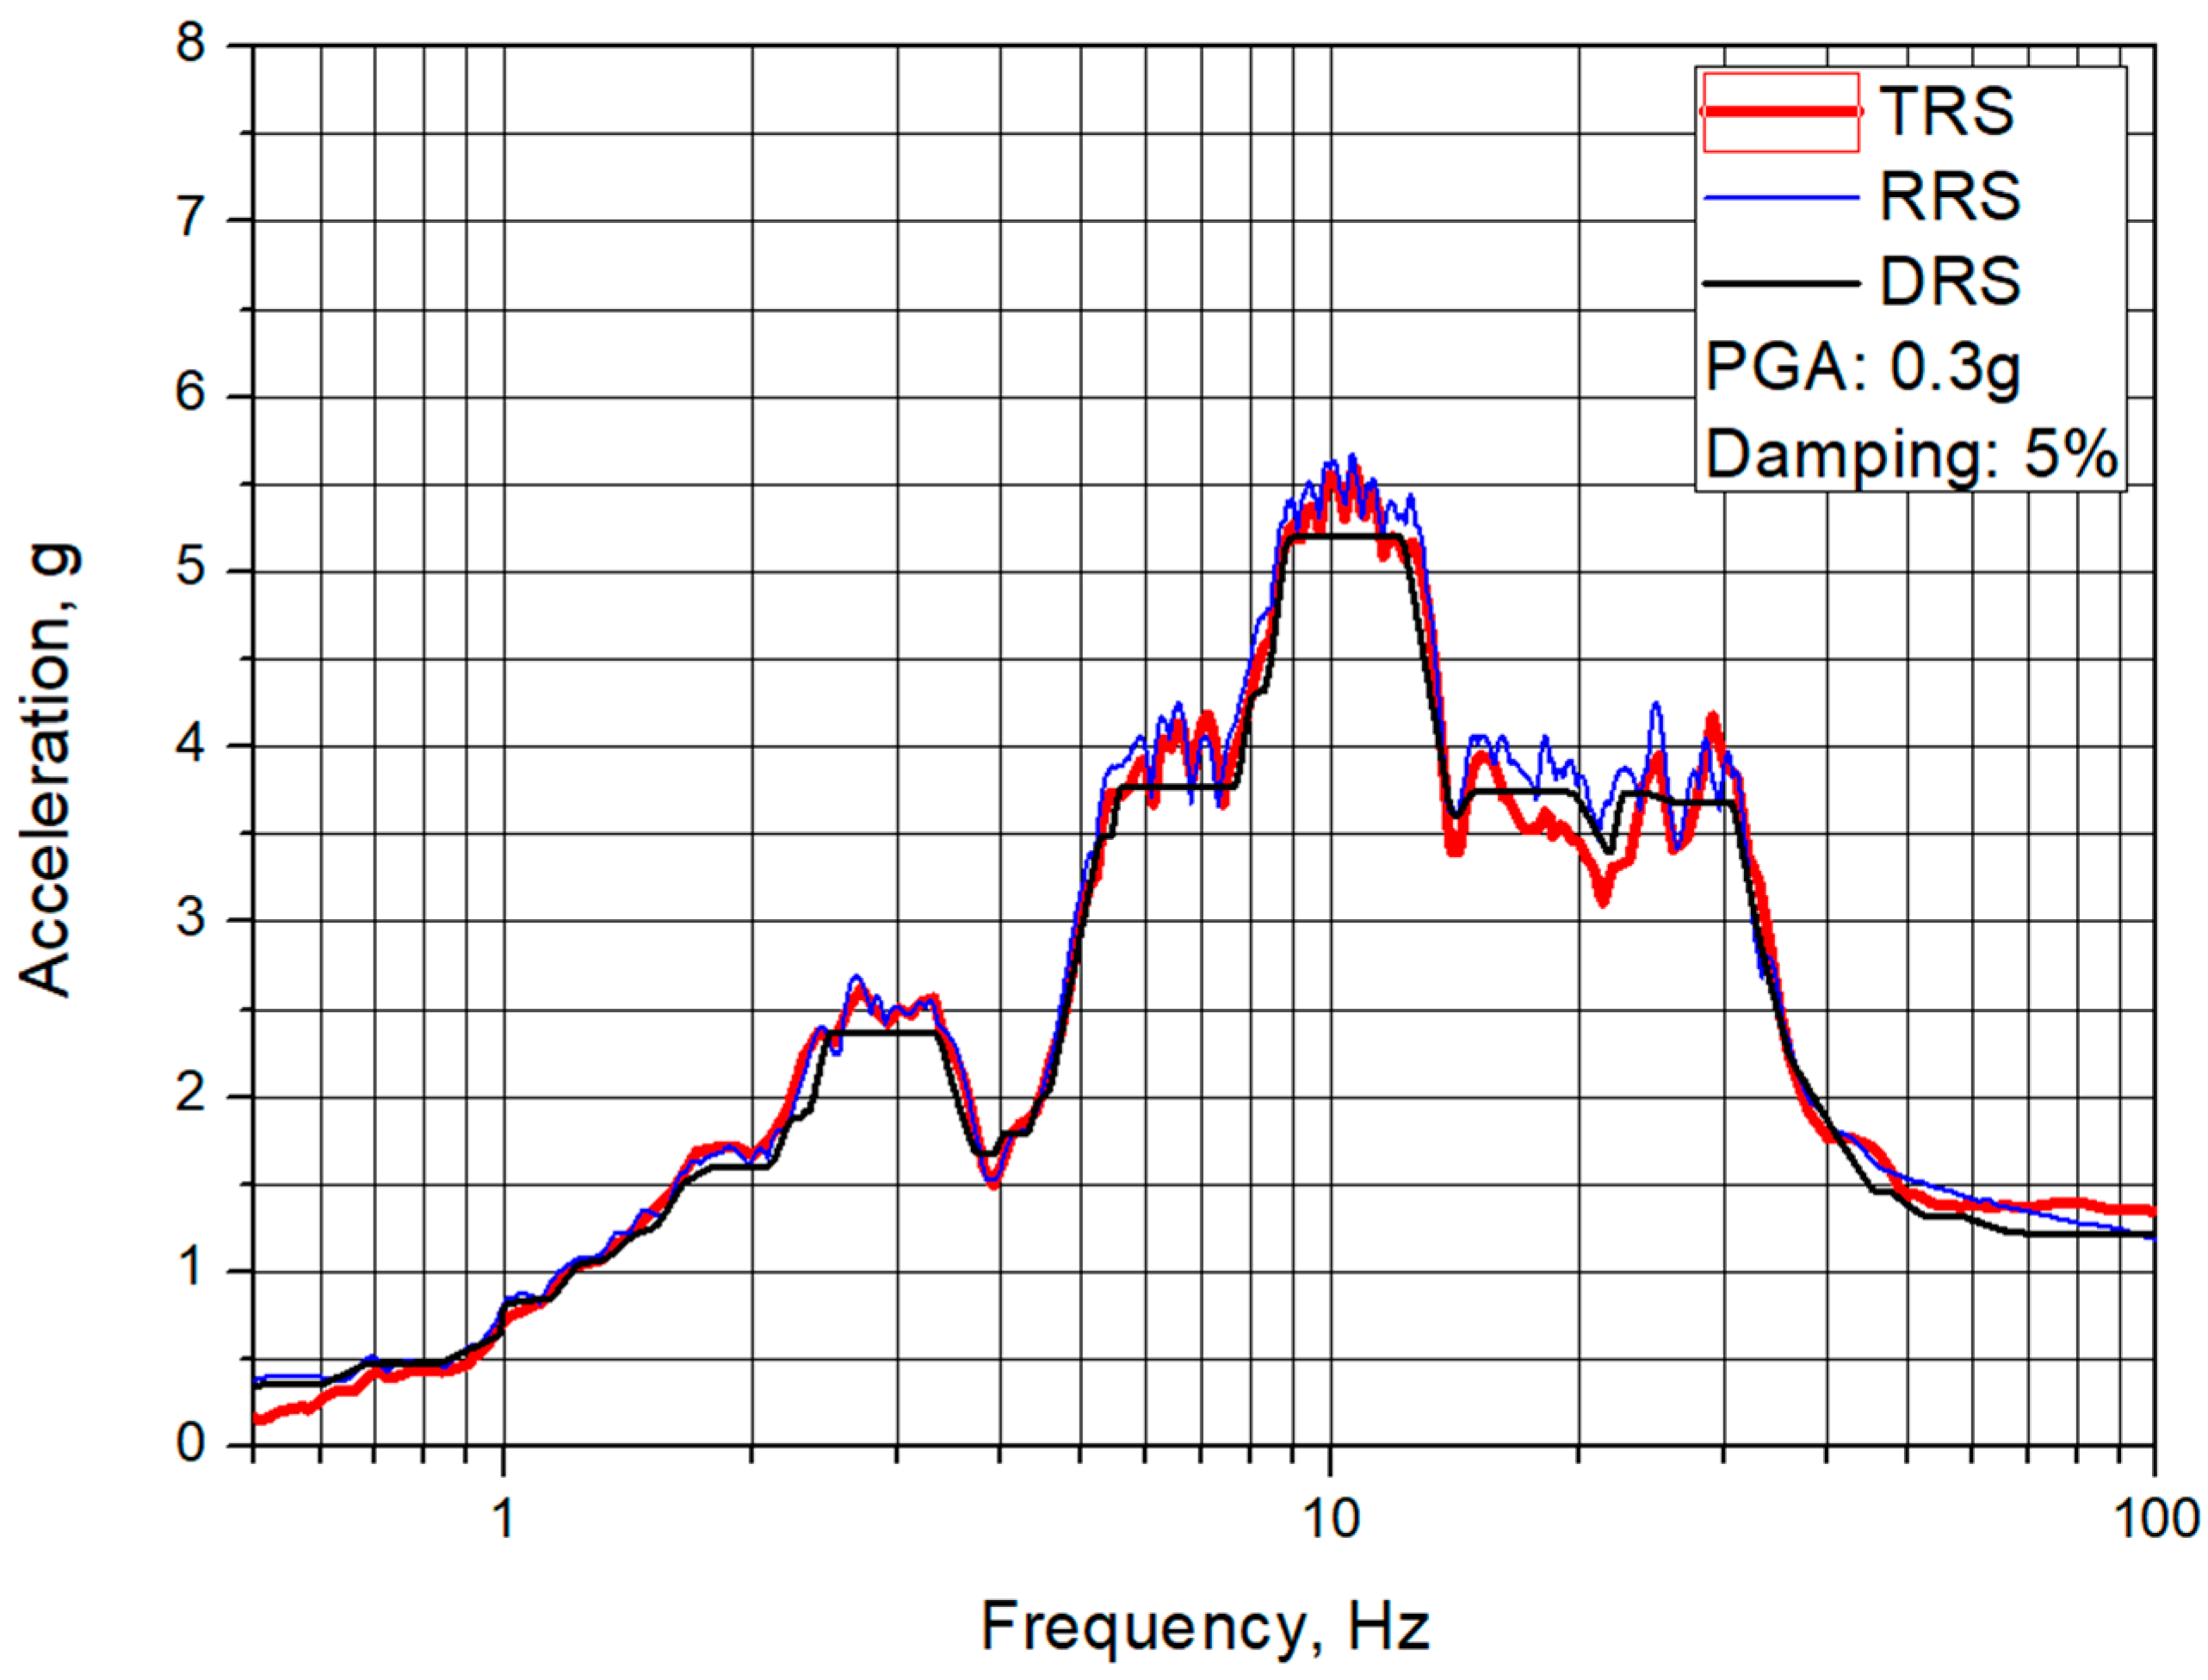
Figure 4 presents the comparison of the DRS, the required response spectrum (RRS) corresponding to
Figure 3, and the test response spectrum (TRS) corresponding to
Figure 4. As shown in the figure, we can see that the RRS and the TRS are almost the same spectral shape and these appropriately envelope the DRS.
The original required sampling rate for the RRS is 200 Hz (0.005 s), which is a typical value used for the nuclear seismic design. In this study, a faster sampling rate of 512 Hz was used for the shaking table tests with consideration of the test facility performance.
3.4. Test Matrix
Table 4 presents the summary of the test matrix carried out in this shaking table test. As shown in the table, three sets of the test mockup (OPT-2A, OPT-2B, and OPT-2C), which can validate the reliability for the consistency of LRB fabrication quality, are prepared to investigate the seismic isolation characteristics and performance. Each set is composed of four LRBs with the same dummy mass.
As shown in the test matrix, four PGA levels of a seismic input motion such as 0.1 g, 0.3 g, 0.5 g, and 0.6 g are considered to be tested. In these load levels, 0.1 g and 0.3 g are the levels of the operating basis earthquake (OBE) and the safe shutdown earthquake (SSE) respectively. Moreover, 0.5 g is the level of the beyond design basis earthquake (BDBE) corresponding to the required seismic fragility capacity for 0.3 g SSE. The level of PGA = 0.6 g is the seismic fragility capacity corresponding to 0.36 g SSE level and is set to investigate the ultimate behavior of LRBs, which may occur in the seismically isolated nuclear facility components located at the 137 ft elevation level of the nuclear building structures.
In the test mockups of OPT-2A and OPT-2B, the shaking table tests are sequentially carried out from 0.5 g level to 0.1 g. The purpose of this test plan is to investigate whether the seismic isolation performance can be achieved even when the smaller earthquakes occur continuously in the deformed state of the inserted lead plug after experiencing a large earthquake history. This test plan is also reasonable when considering that the primary purpose of developing the lead inserted small-sized LRB is to accommodate the beyond design basis earthquakes in the nuclear facility components. The tests for 0.3 g and 0.1 g after the 0.5 g test are set to investigate the LRB performance for aftershocks.
All input motions corresponding to each PGA level were obtained by linearly scaling for the input motion of PGA = 0.3 g presented in
Figure 3. When considering an actual earthquake event, the PGA levels above 0.3 g of SSE in the test matrix will be greater than linearly scaled levels because the design floor response spectrum used for the shaking table tests will be practically reduced due to the plastic behavior of the building structures, which can be represented by the inelastic energy absorption factor (IEAF). When taking the IEAF to be 1.25 as recommended in EPRI/NP-6041-SL [
24], the PGA levels for 0.5 g and 0.6 g can be treated as 0.625 g and 0.75 g levels, respectively.
All tests are carried out with an interim time of about 10 min after each test listed in test ID to minimize the variation of the rubber characteristics due to the temperature increase that may occur in the rubber in the test performed just before.
3.5. Results of Shaking Table Tests
3.5.1. Seismic Isolation Characteristics and Performance
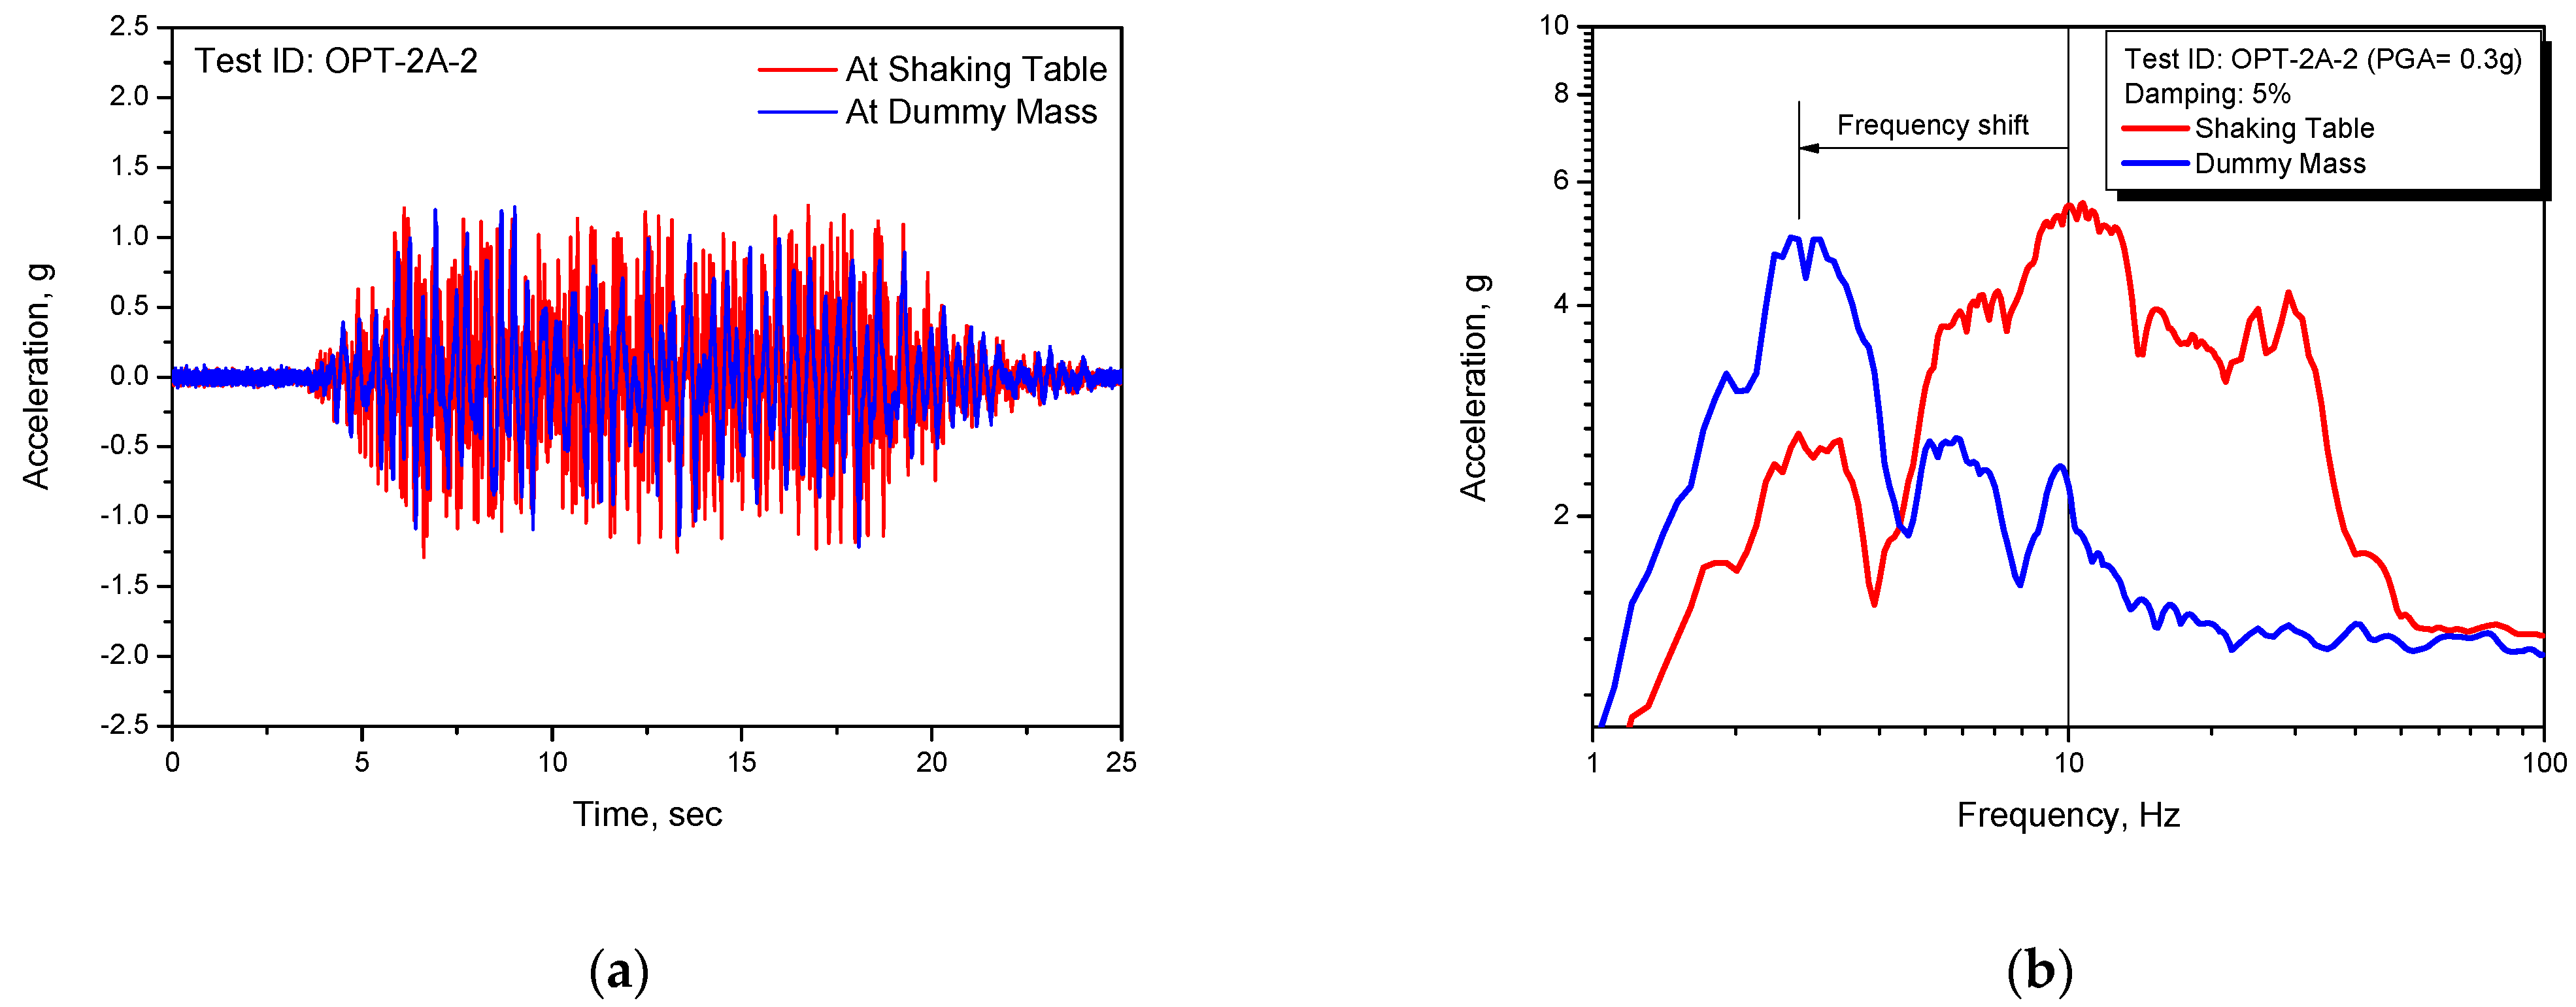
To investigate the seismic isolation characteristics of the lead inserted small-sized LRB developed for an individual nuclear facility component seismic isolation, the test results for the representative design basis earthquake level of PGA = 0.3 g are presented in
Figure 5. From the spectrum responses of
Figure 5b corresponding to the test results of acceleration time history responses shown in
Figure 5a, we can see that the peak spectral frequency band around 10 Hz in the input shaking table motion is significantly shifted to the 2.6 Hz in the dummy mass response, which is slightly higher than the 2.3 Hz of the design seismic isolation frequency in
Table 2. From this result, it can be confirmed that the LRB on development in this study has one of the typical seismic isolation characteristics that can assure the seismic isolation performance for the nuclear facility components generally having around 10 Hz dynamic frequencies.
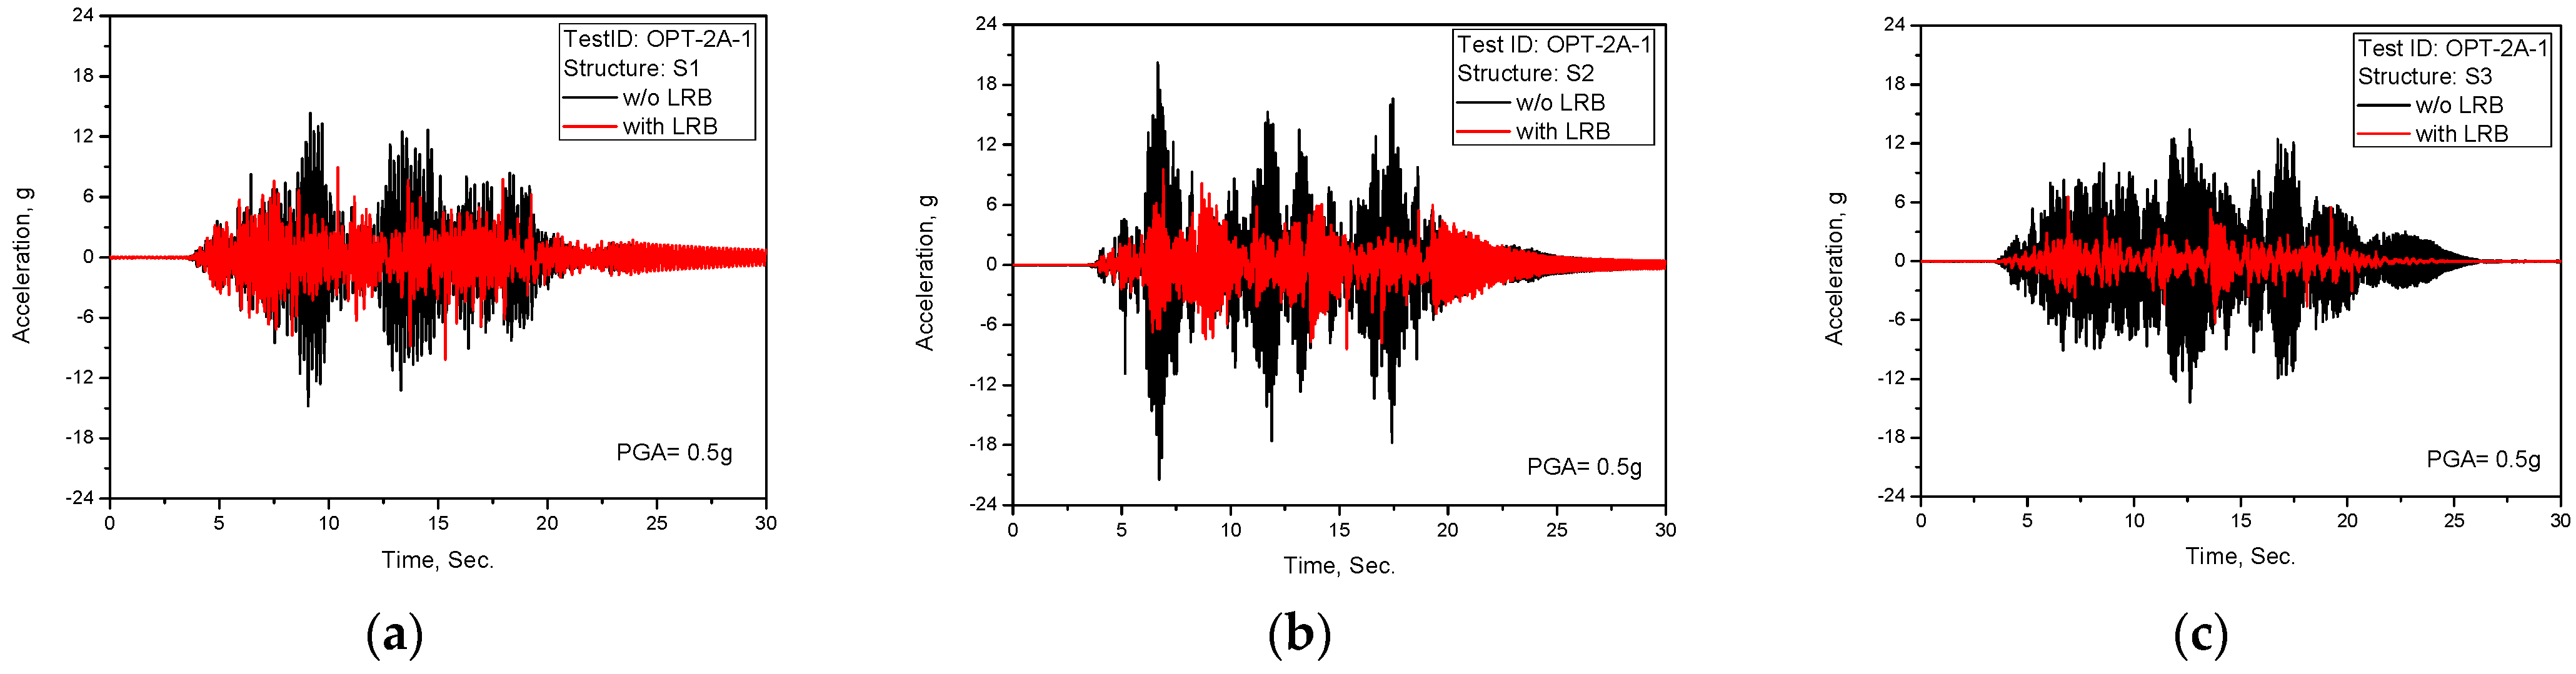
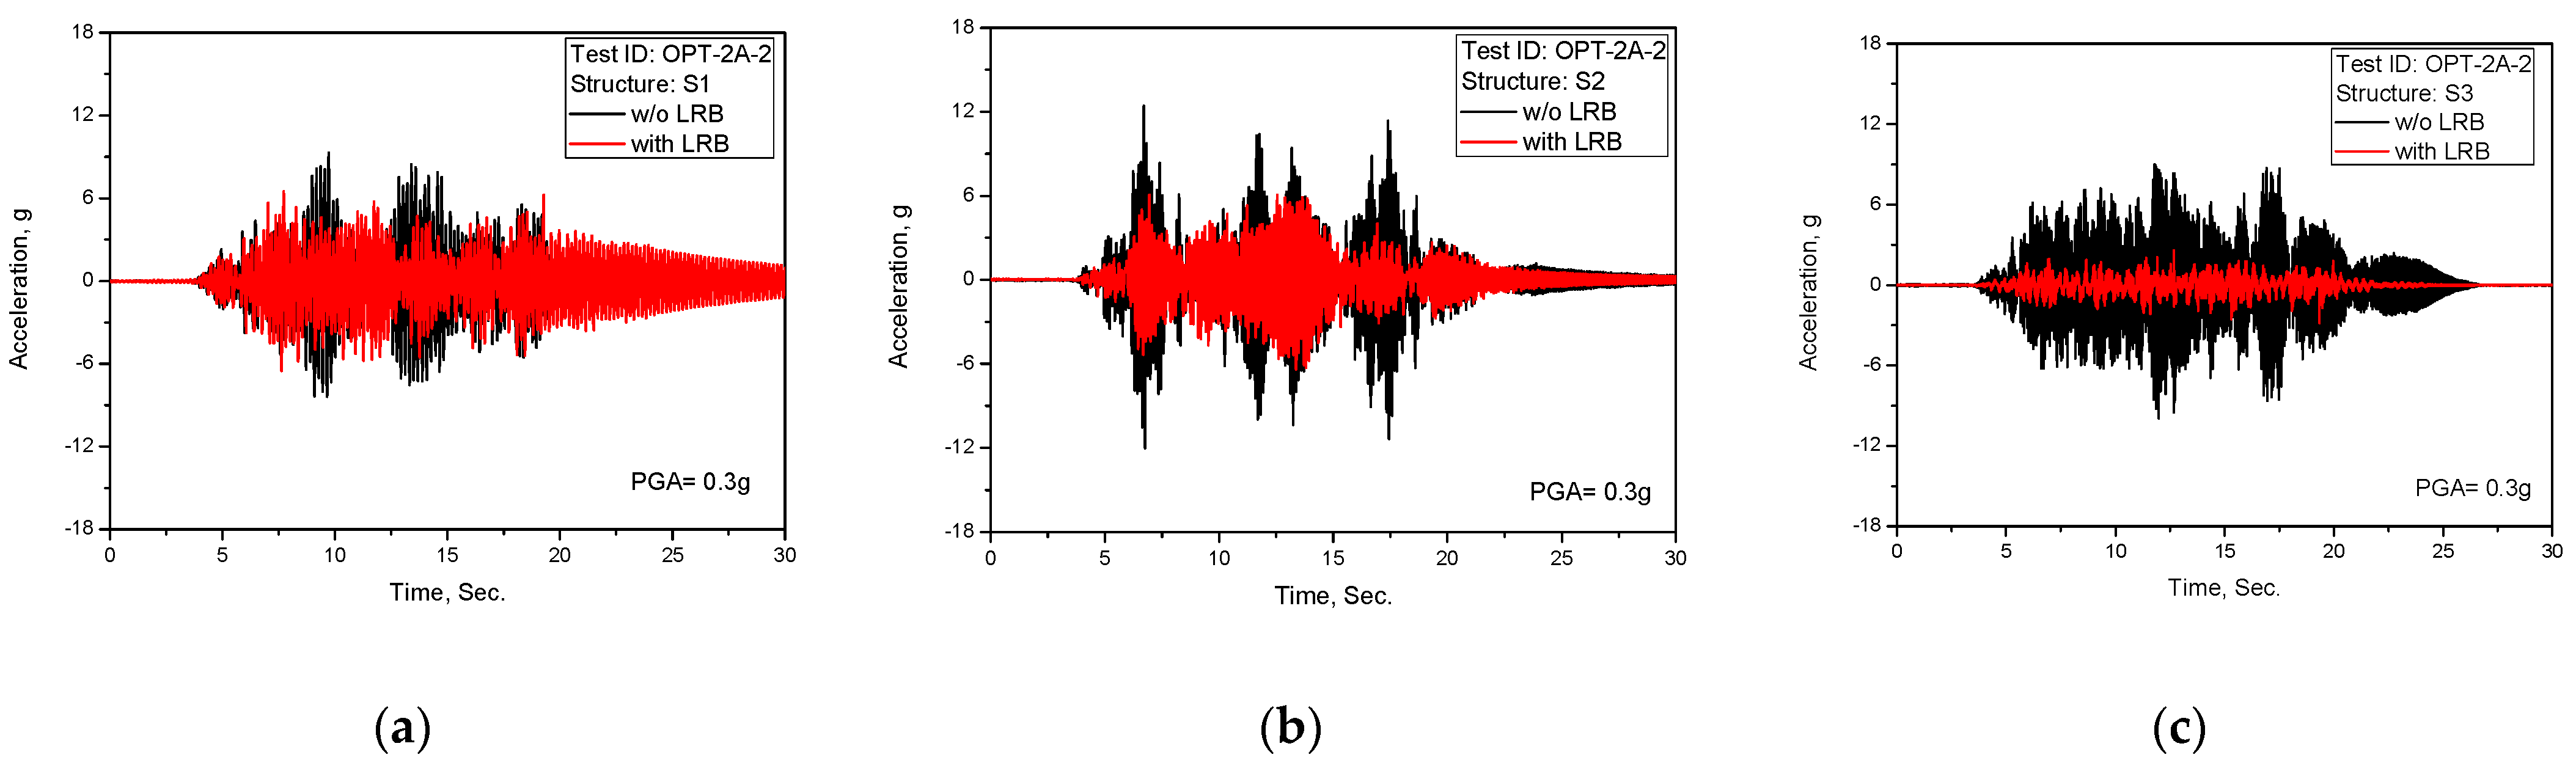
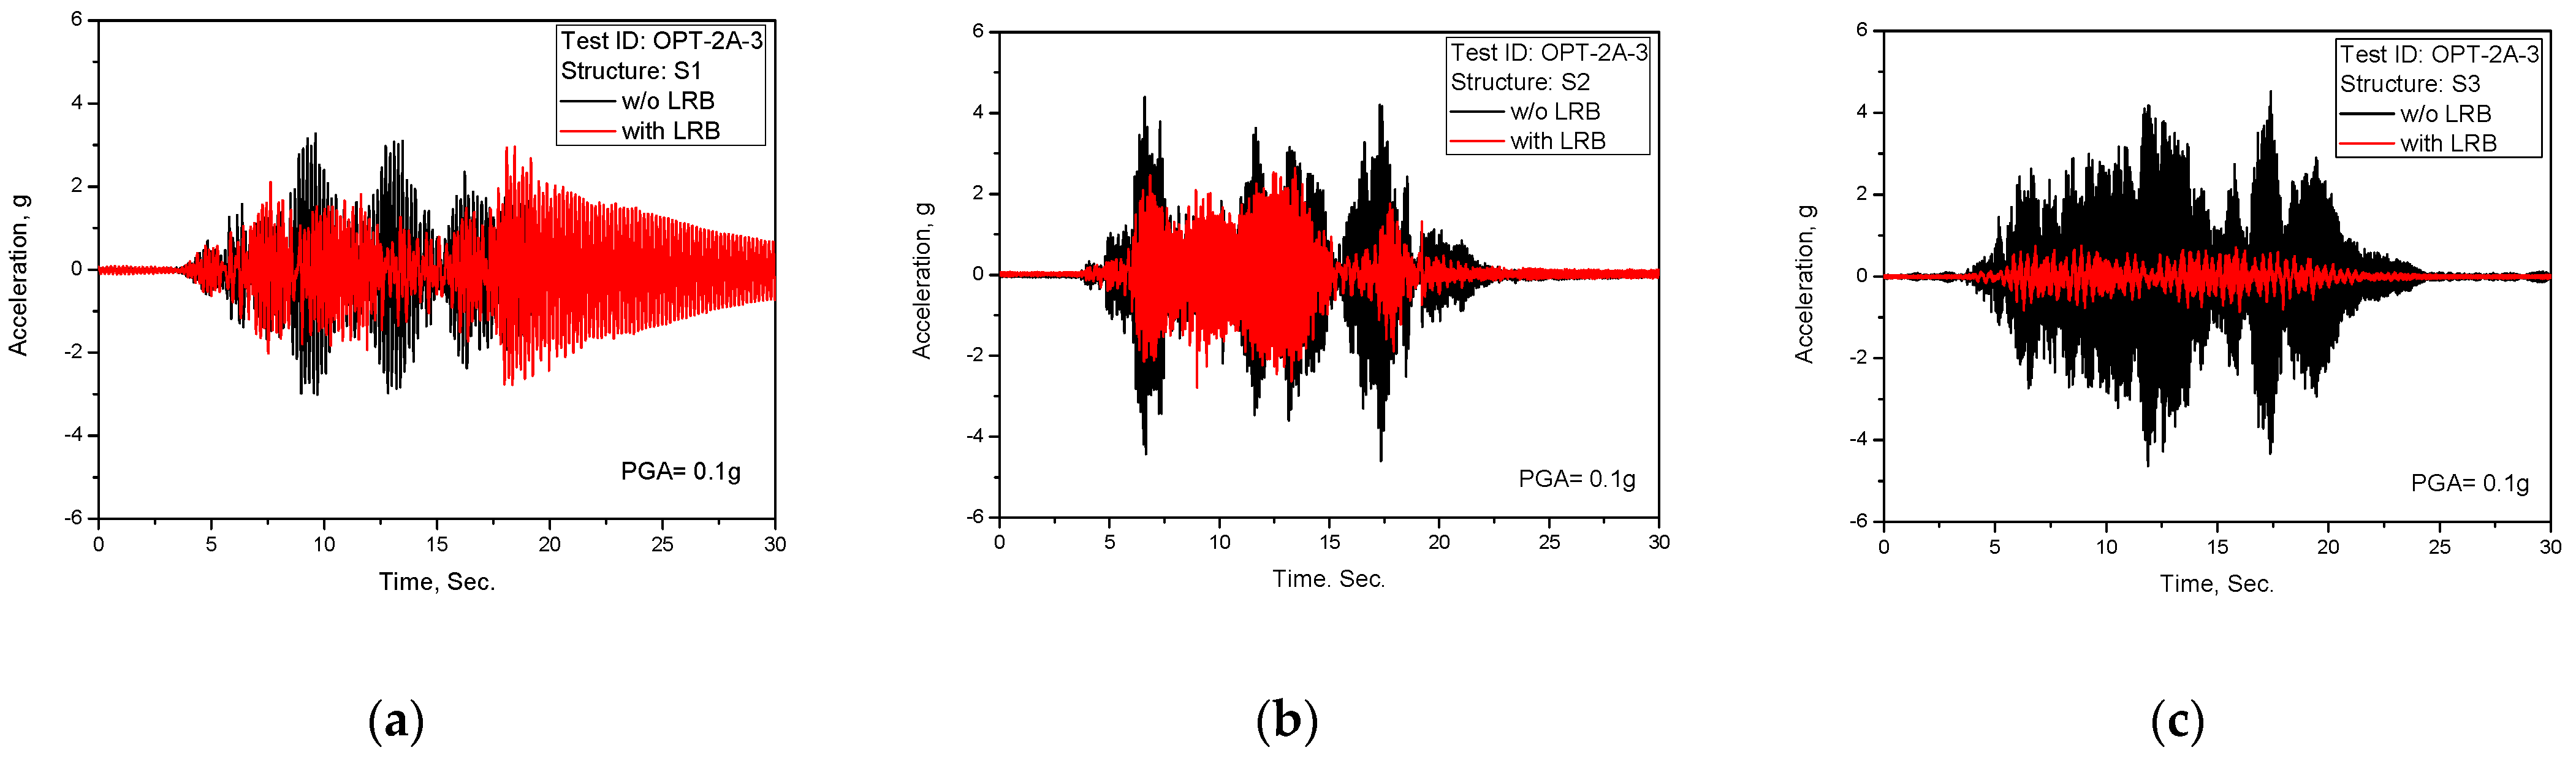
Figure 6,
Figure 7,
Figure 8,
Figure 9,
Figure 10,
Figure 11,
Figure 12 and
Figure 13 show the test results of the acceleration time history responses for the individual test ID with a comparison between the isolated structures, i.e., installed on the dummy mass, and the non-isolated structures, i.e., installed on the shaking table.
As clearly shown in the above test results of the acceleration time history responses, the seismically-isolated structures reveal the seismic isolation performance as expected from the frequency shift effect presented in
Figure 5b of results of the response spectrum, which are for the shaking table and the dummy mass.
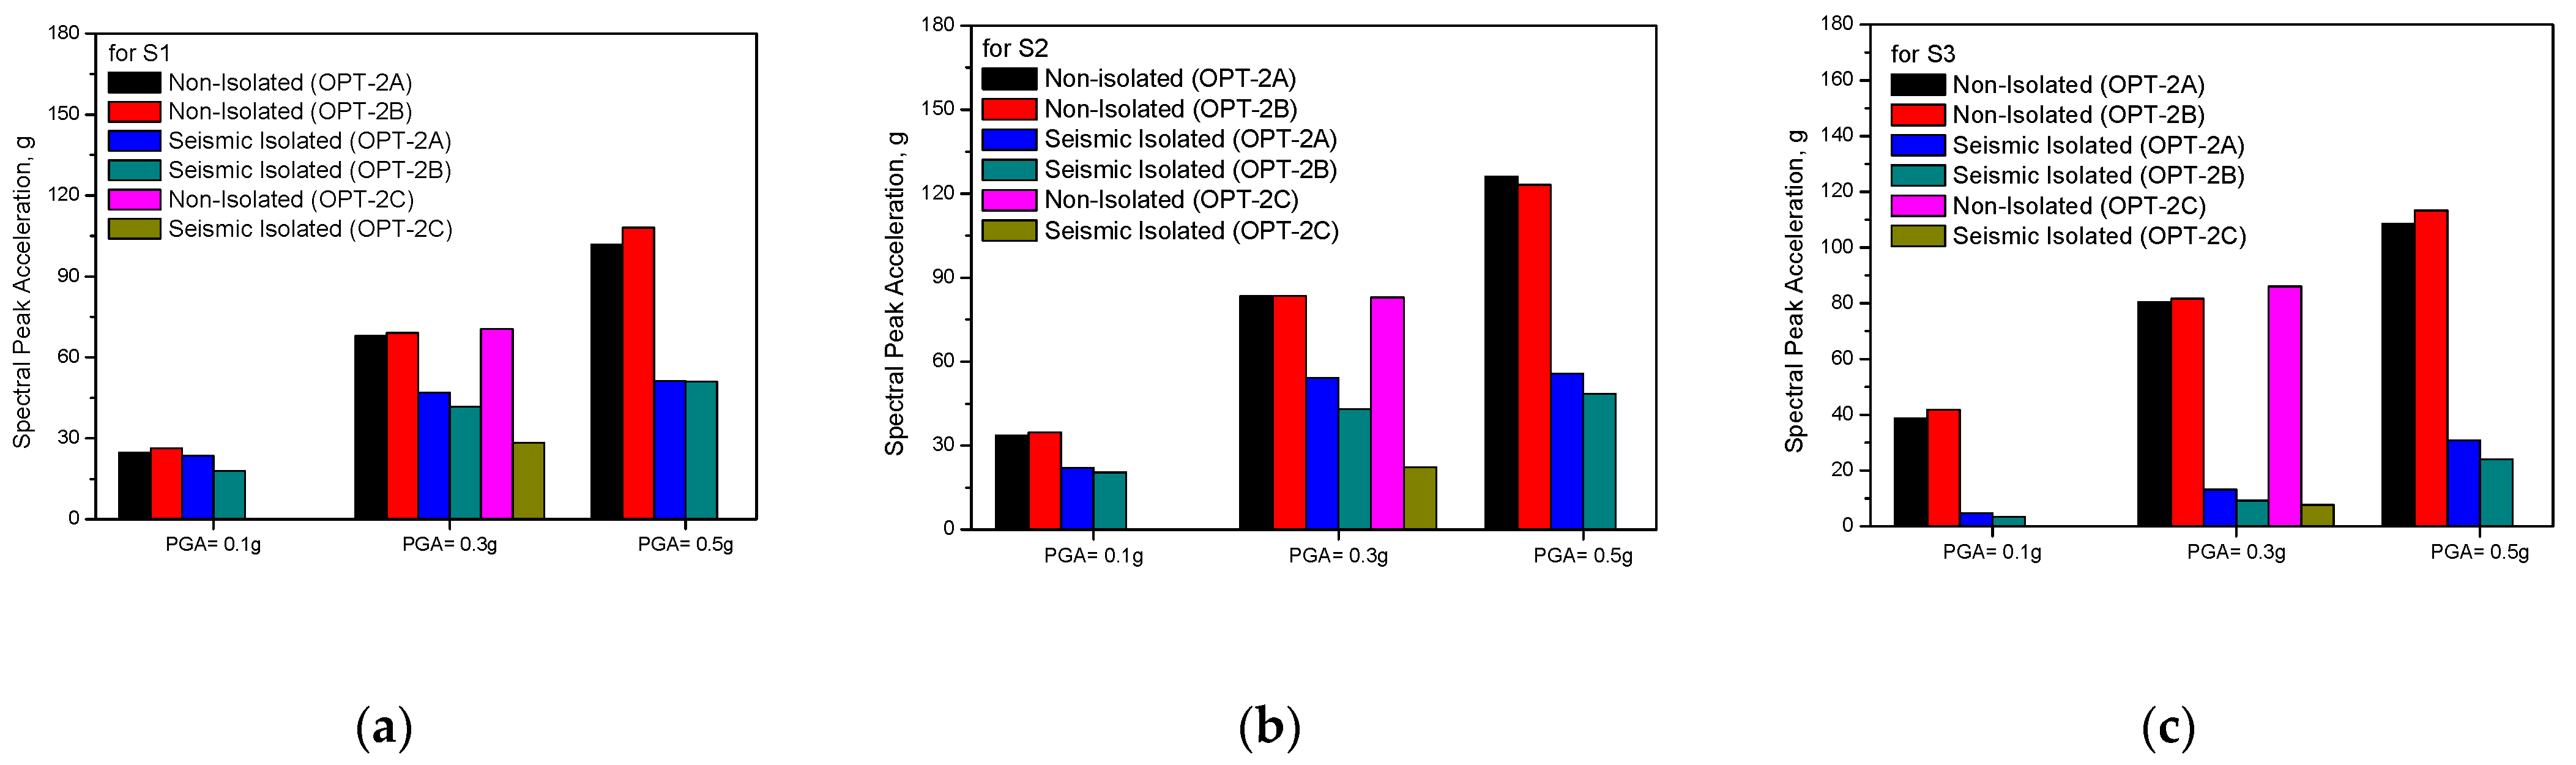
Figure 14 presents the comparison of the spectral peak values between seismically-isolated structures and the non-isolated structures calculated from the above acceleration time history responses. As shown in the figure, we can see that the LRB gives better seismic isolation performance as the input earthquake levels increase.
From the above acceleration seismic responses, the results of the shaking table tests of the lead inserted small-sized LRB are summarized as follows;
It is confirmed that the fabricated lead inserted small-sized LRB gives a consistent seismic isolation performance through the repeated shaking table tests with different sets of the fabricated LRB as intended in the test matrix to check the reproducibility of LRB;
Contrary to concerns about the lead plug after experiencing larger earthquakes, the lead inserted small-sized LRB reveals adequate seismic isolation performance in subsequent shaking table tests;
In particular, the seismic isolation performance in a frequency range of 9 to 20 Hz, which corresponds to the resonance frequency band of most nuclear facility components, is confirmed as expected in the LRB design;
When the input earthquake level is small, such as PGA = 0.1 g, the amplitude of the cyclic shear displacement of LRB occurs is also small and the initial stiffness effects of the lead plug increase the seismic isolation frequency. As a result, the seismic isolation performance is relatively reduced.
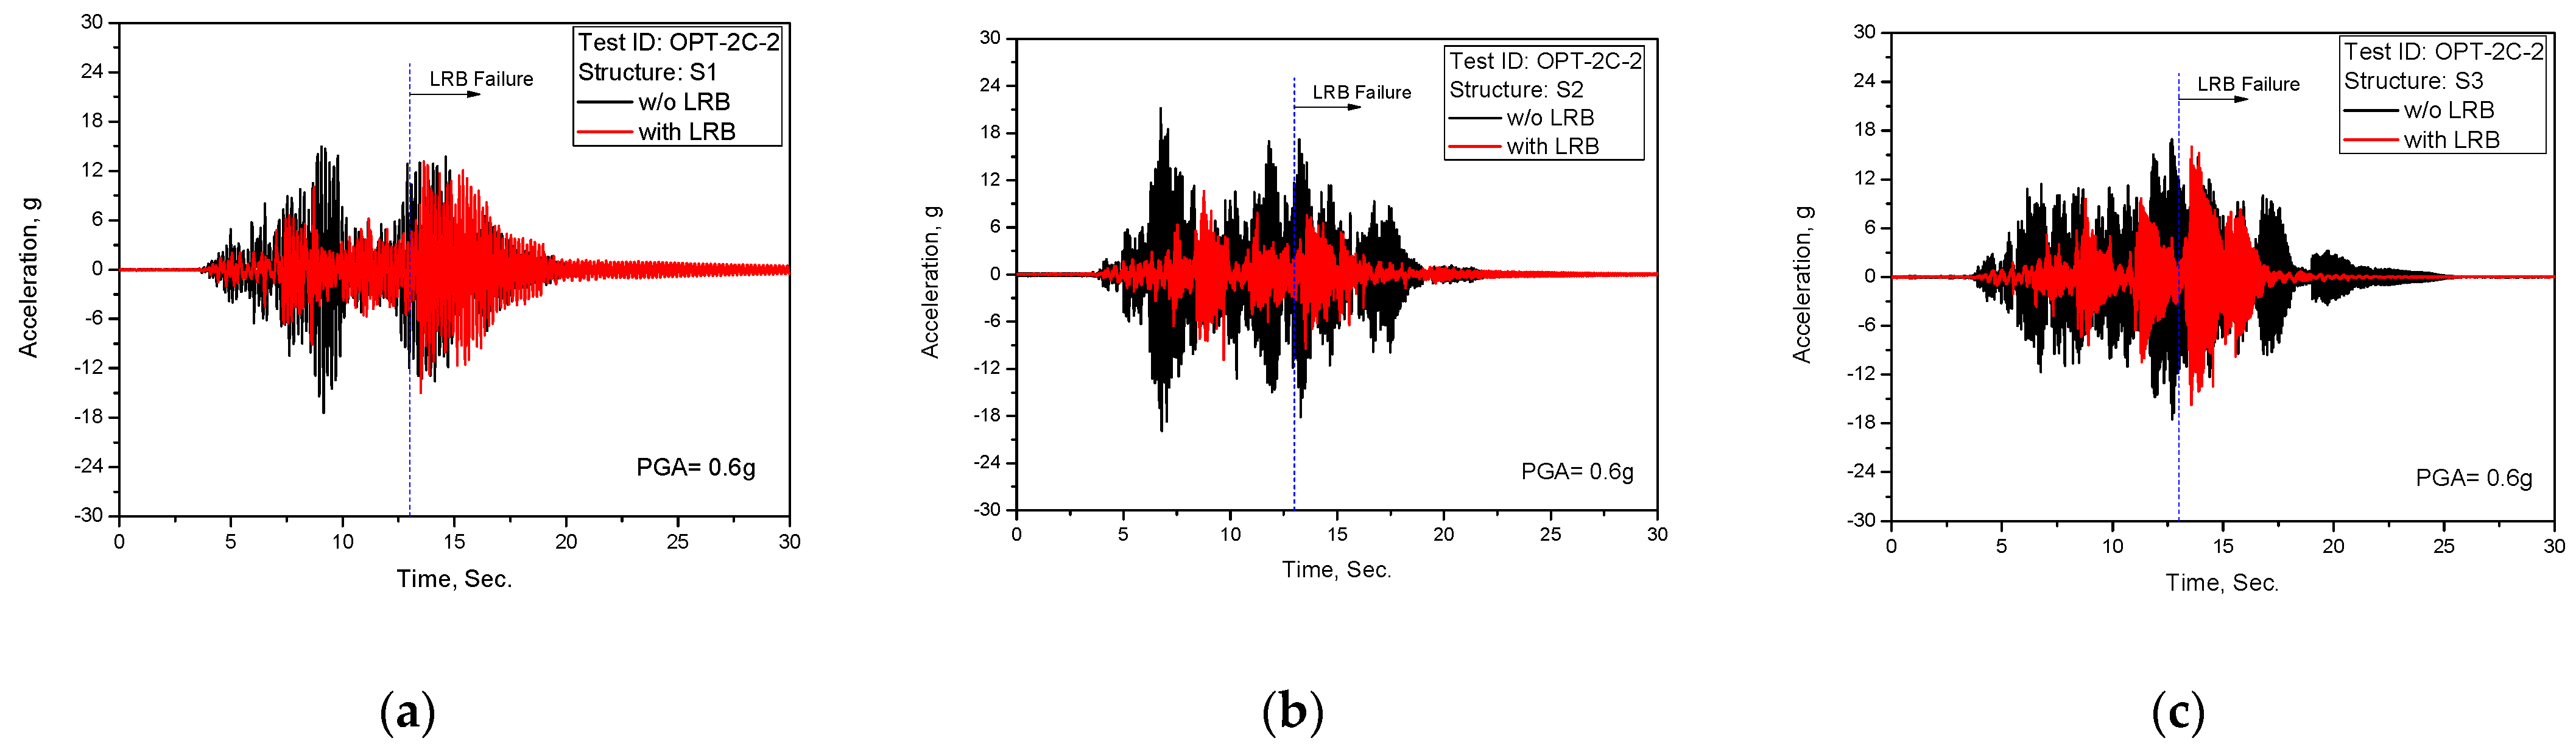
In the test results of the PGA = 0.6 g in
Figure 13, LRB failure occurred after 13 s due to exceeding the LRB shear strain limits of 600% (120 mm), which has been confirmed in previous quasi-static tests [
21].
3.5.2. LRB Shear Displacement Responses
In general, one of the main issues in the seismic isolation design, regardless of isolation device types, is how to control the appropriate relative displacement between the seismic excitation base and the seismically isolated superstructures in point of the interface design.
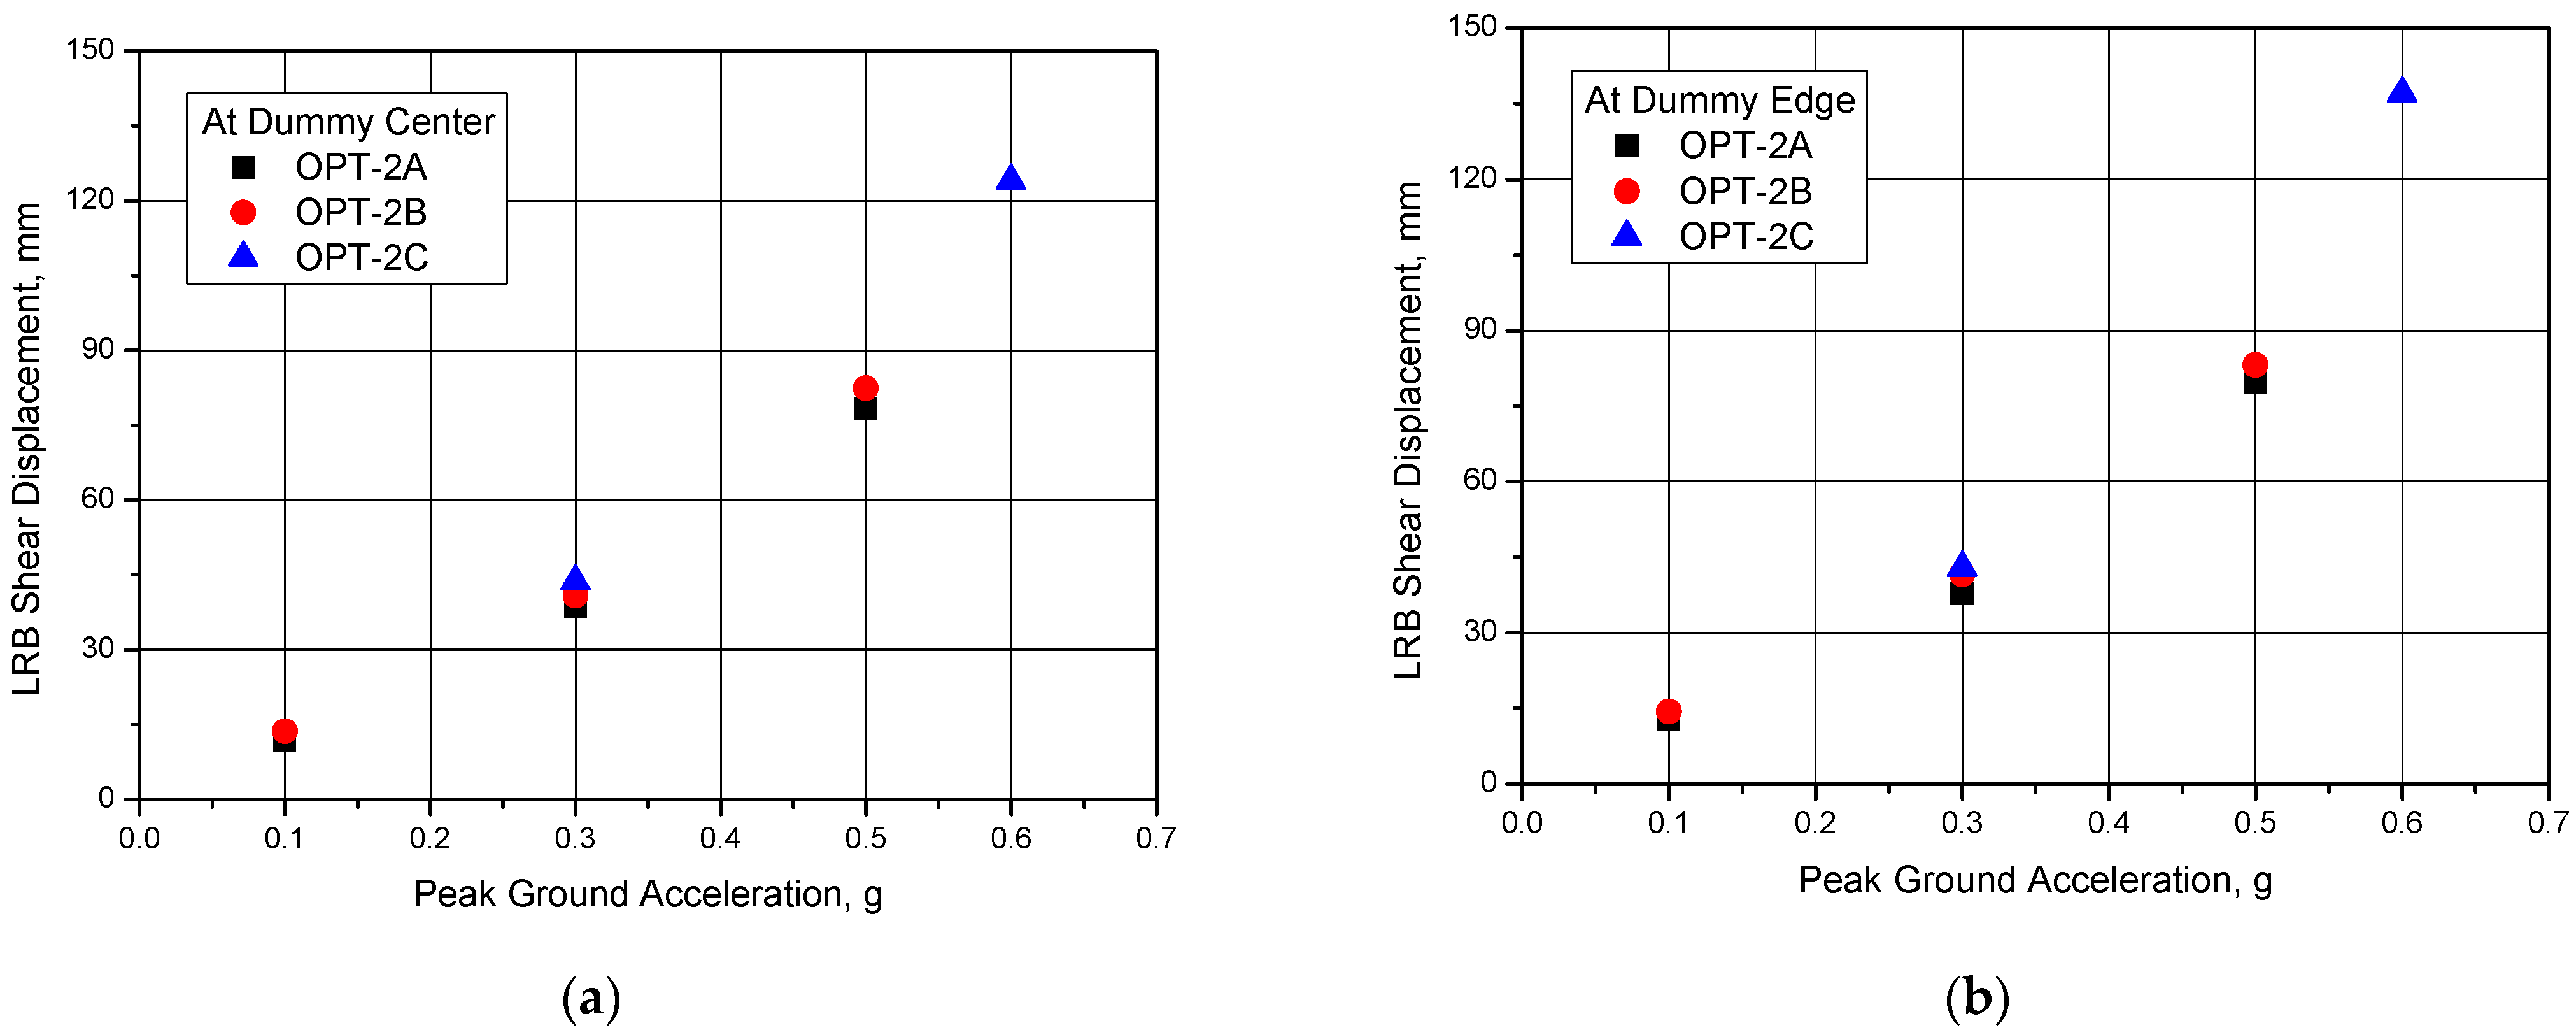
Figure 15 presents the maximum shear displacements of LRB measured at the center and the edge of dummy mass for all test IDs. As shown in the figures, the LRB reveals well-controlled shear displacement behavior up to the beyond design basis earthquake of PGA = 0.5 g, which is 0.625 g in a seismic fragility point of view.
The averaged maximum shear displacements of LRB corresponding to the design basis earthquake of SSE (PGA = 0.3 g) and the beyond design basis earthquake, PGA = 0.5 g were measured to be 41 mm and 80 mm respectively, which were very close to the design target value of 35 mm and 80 mm corresponding to the shear strain of 175% and 400% respectively as presented in
Table 1.
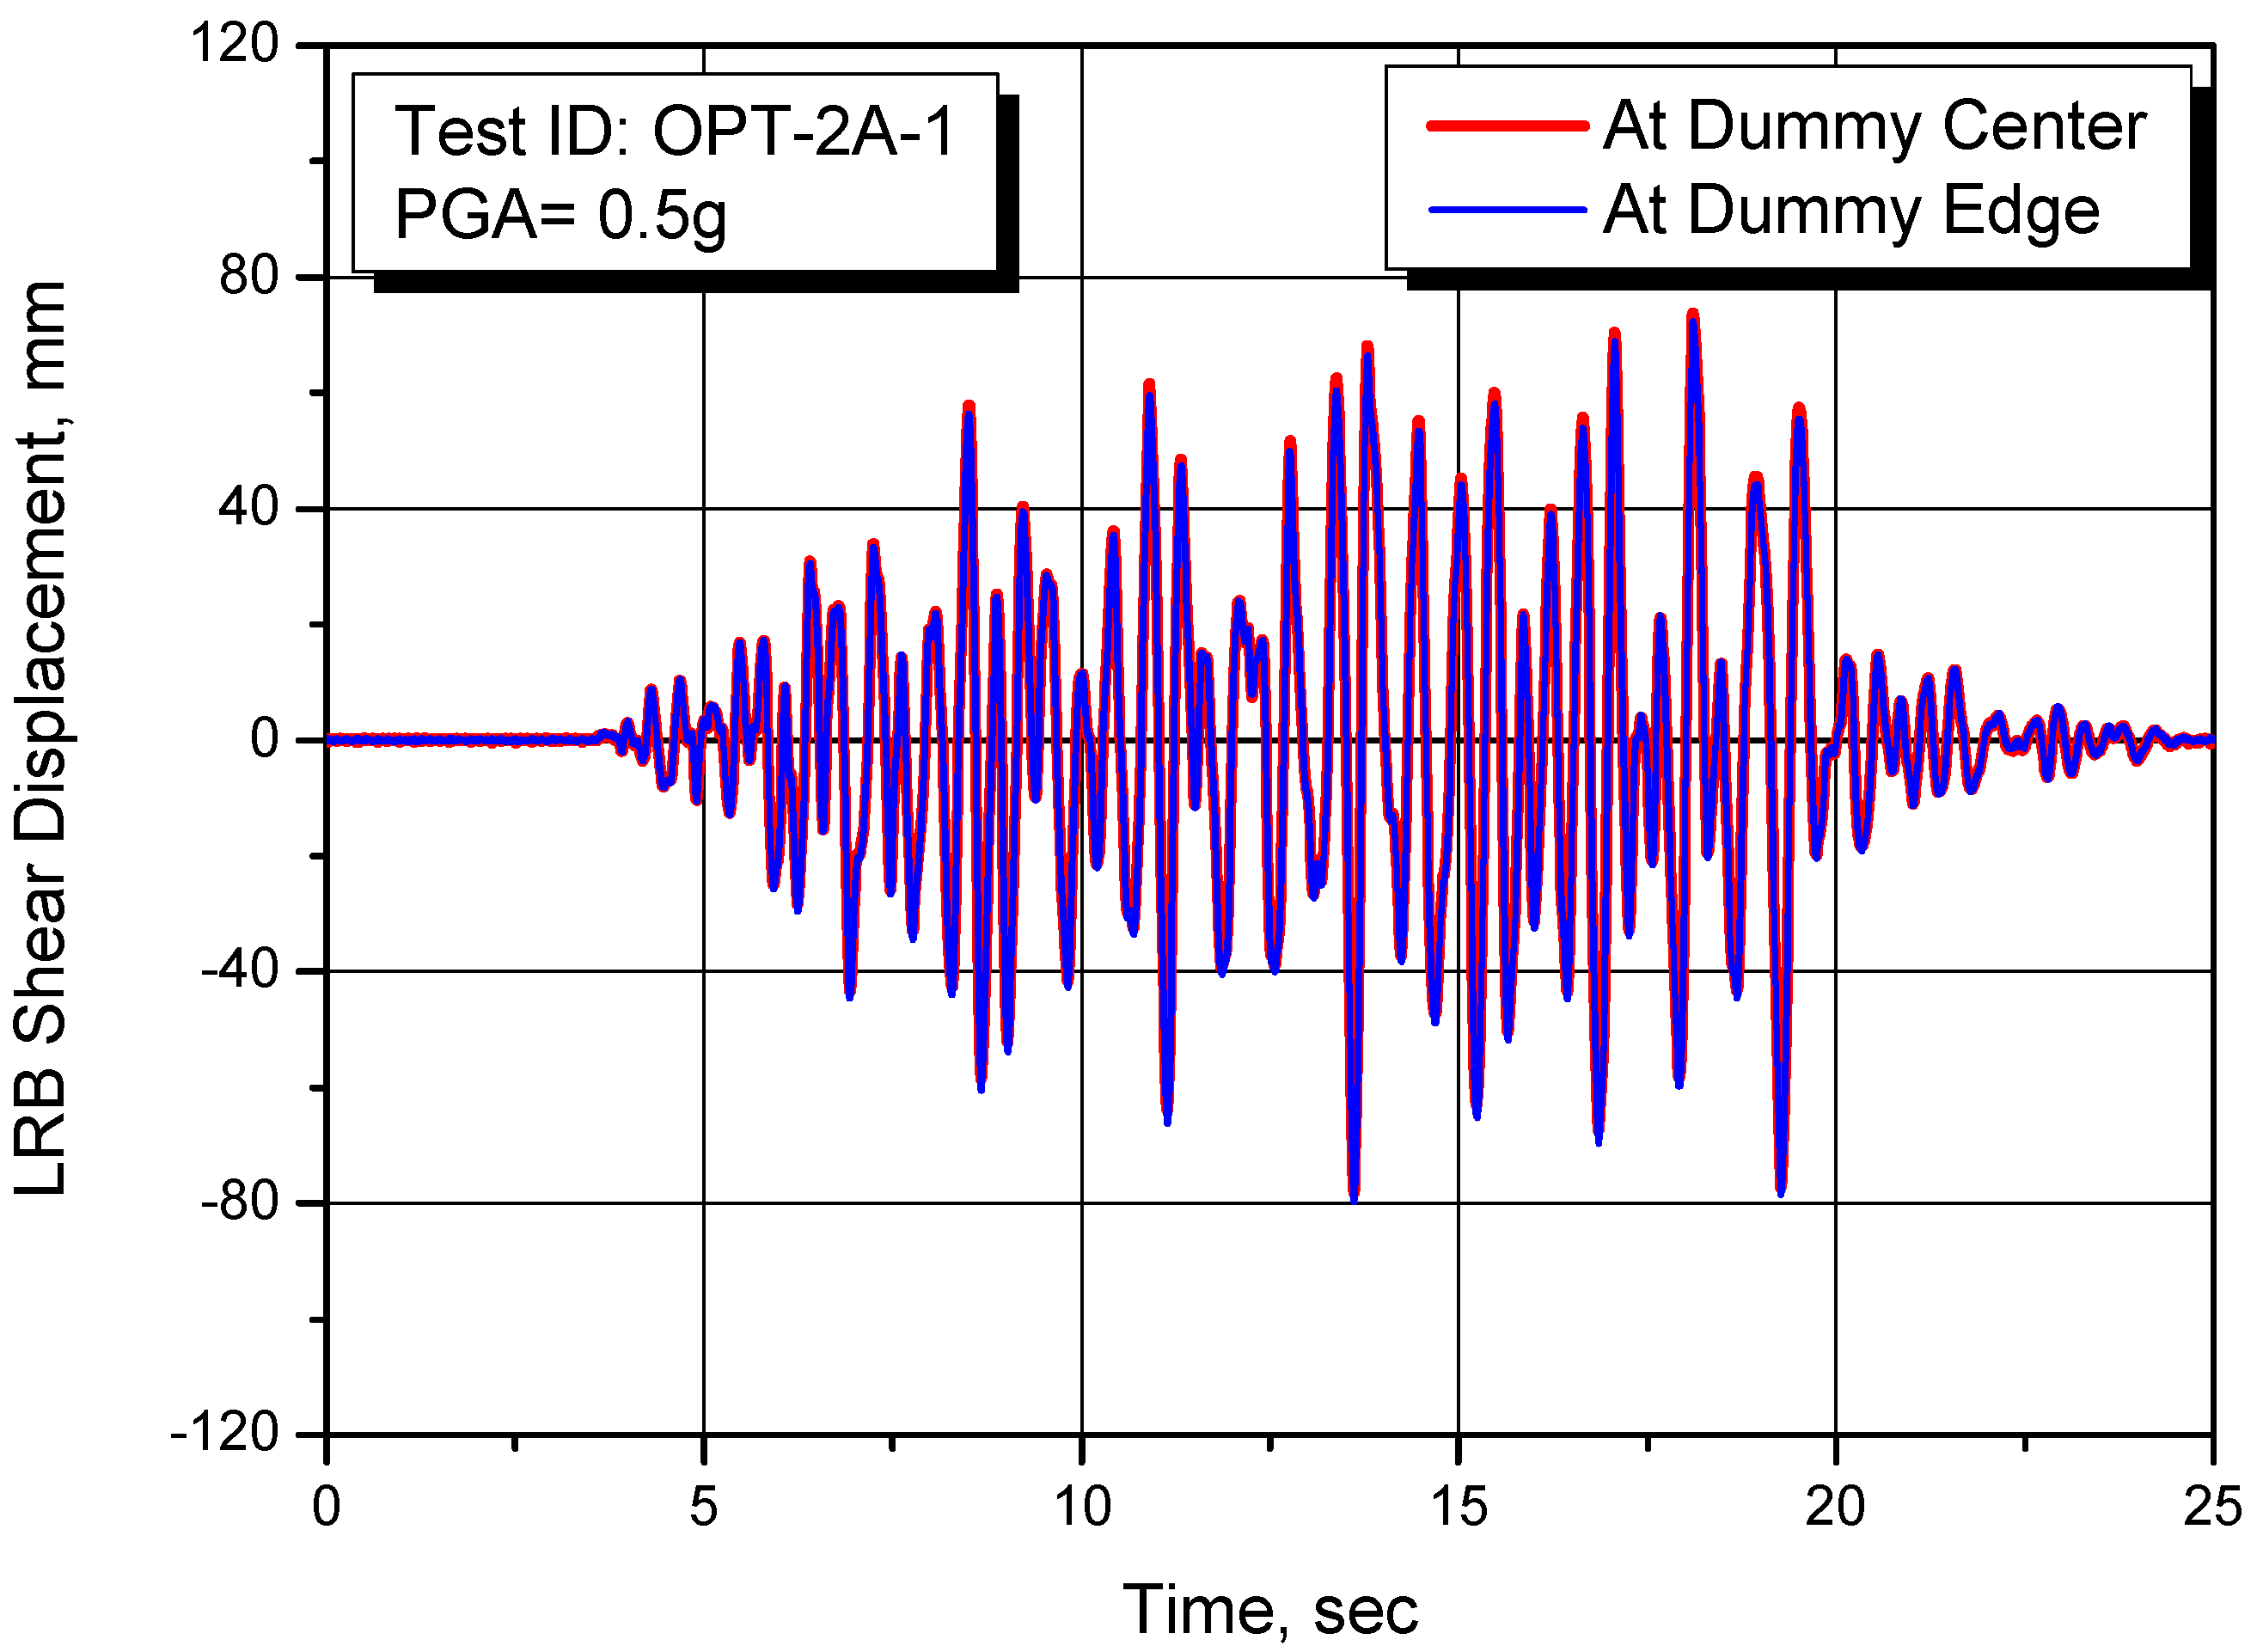
Figure 16 represents the measured shear displacement time history response of LRB for PGA = 0.5 g (Test ID: OPT-2A-1). As shown in the figure, the LRB shear displacement time history responses measured at the center and the edge of the dummy mass is almost the same, with less than the 1.5 mm difference. This result indicated that no rotational behavior occurred in the dummy mass and that all LRBs used in the test had the same mechanical characteristics.
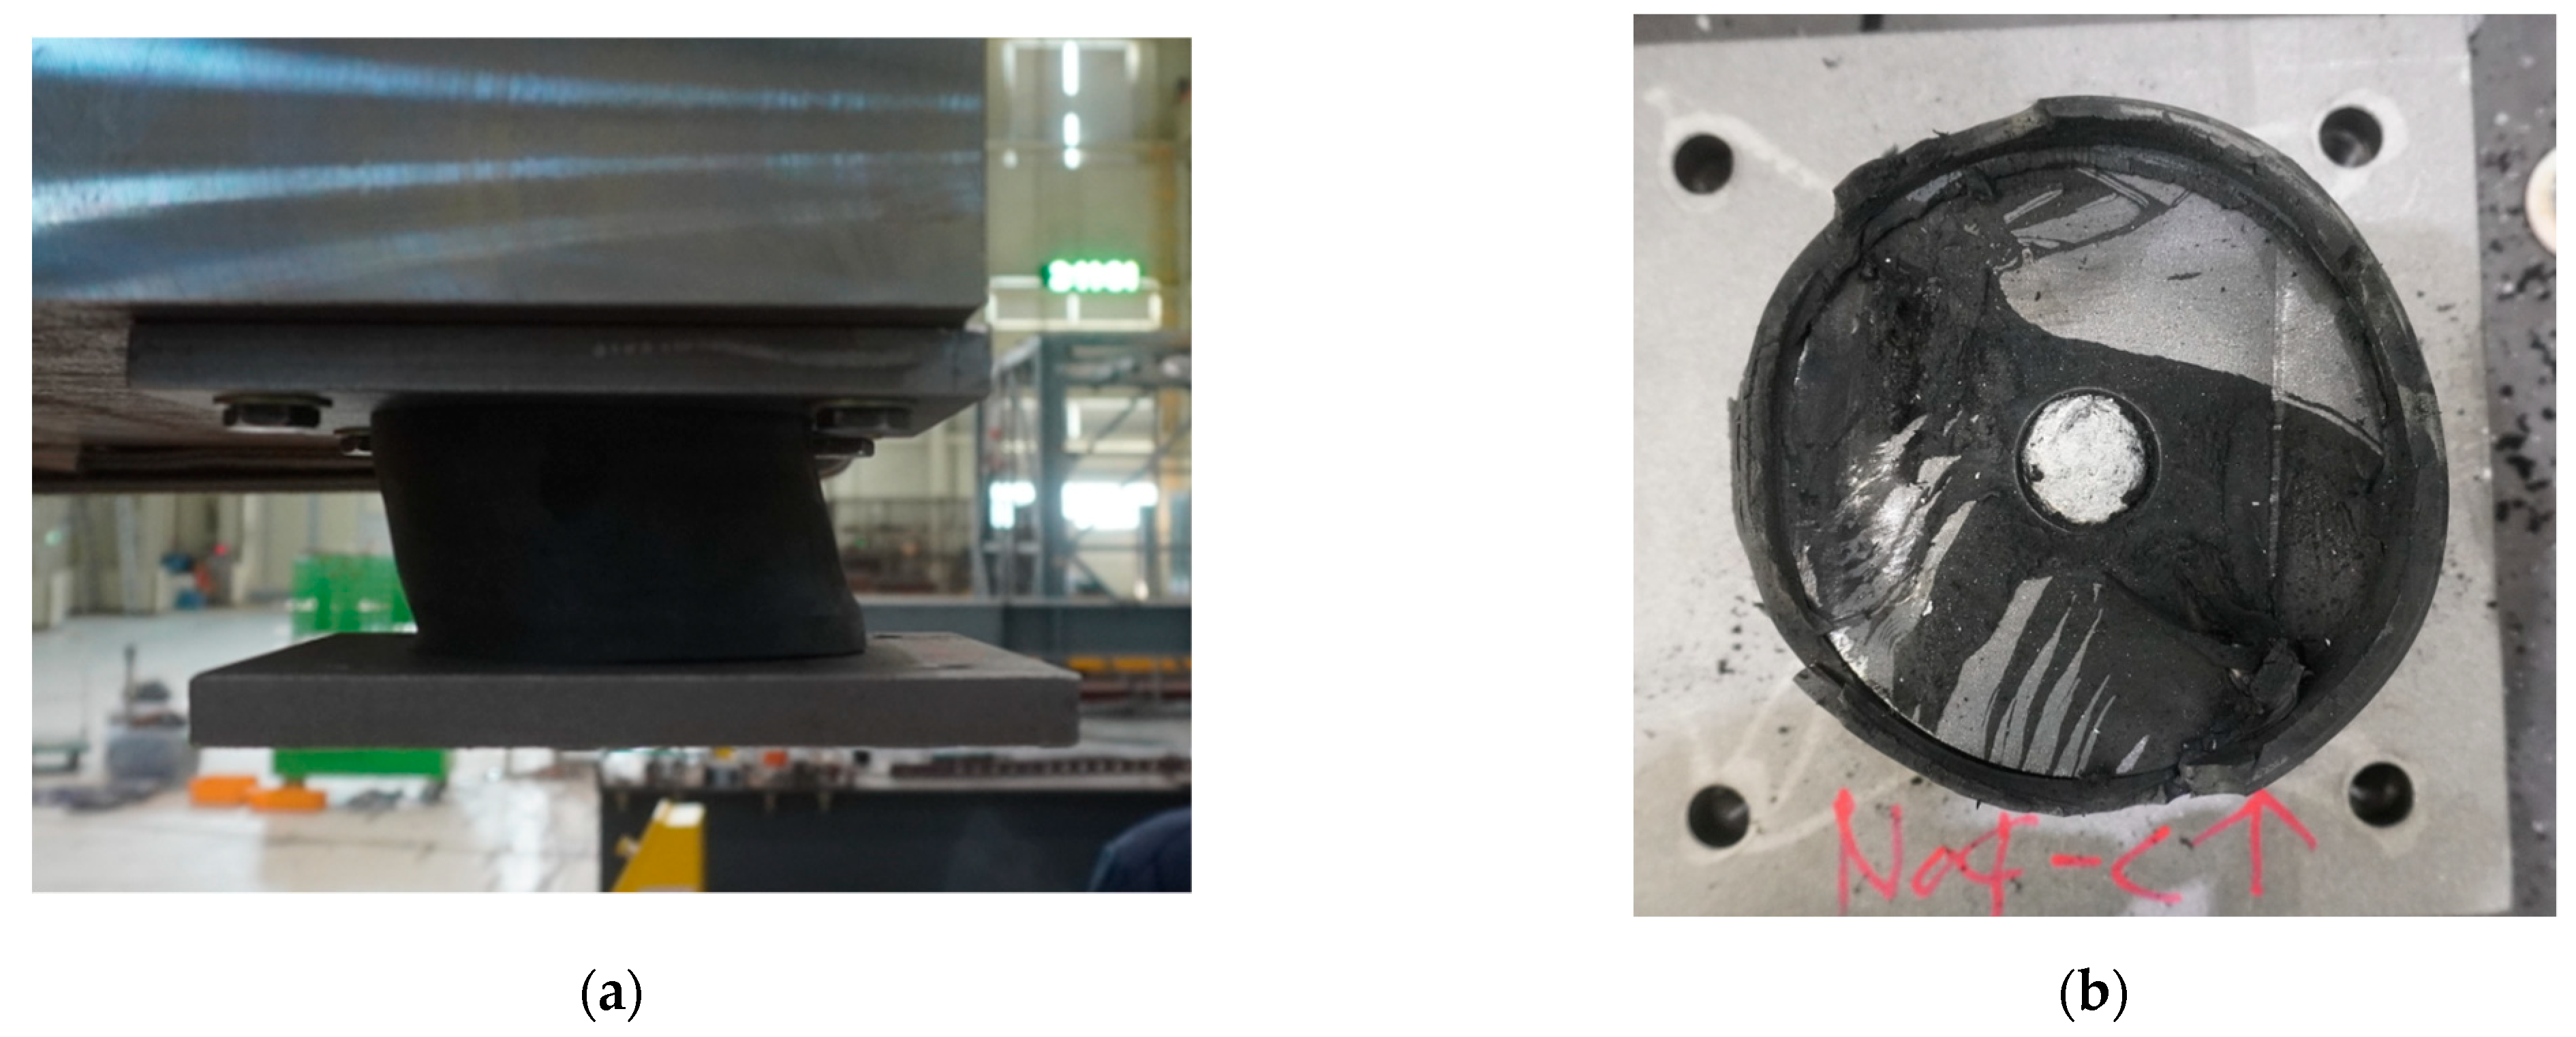
In the case of the ultimate test with PGA = 0.6 g (Test ID: OPT-2C-2), the failure of LRB occurred after 13 s during the test. At this time, the maximum shear displacement was measured to be 137 mm (685%), significantly exceeding the beyond design shear displacement of 80 mm.
Figure 17 presents the photos showing the failed LRB after tests.
4. Numerical Seismic Analysis and Discussions
To confirm the seismic isolation characteristics of LRB, the numerical analyses are carried out for the representative Test ID, OPT-2A-2 (PGA = 0.3 g), which is for the design basis earthquake of SSE (PGA = 0.3 g). The used analysis seismic input motion is shown in
Figure 5a, which is measured at the shaking table.
For the numerical seismic analysis, the ANSYS commercial finite element program [
25] is used.
4.1. Seismic Analysis Modeling
Figure 18 presents the schematic concept of the seismically isolated test mockup performed in this study and the corresponding finite element model used for the seismic analysis. As shown in
Figure 18a, there are three different beam structures both on the shaking table and on the dummy mass, which is intended to express a seismically isolated structure and the non-isolated structure.
Figure 18b is the corresponding seismic analysis model used in this study.
Table 5 presents the input parameters for the finite element modeling used in the seismic analysis. As shown in the table, two types of LRB analysis modes are used: the Bilinear model and equivalent stiffness-damping model. For the LRB model, the element type of COMBIN40 in the ANSYS is used with input parameters of elastic stiffness (
Ke), tangential stiffness (
Kt), and characteristic strength (
Qd) for the bilinear model, and of equivalent stiffness (
Keq) and critical damping ratio (
ξ) for the equivalent spring-damper model. And for the beam structure model, the element type of BEAM188 is used with total height (
L), area moment of inertia (
Izz), and Rayleigh damping parameters of
ALPHA and
BETA.
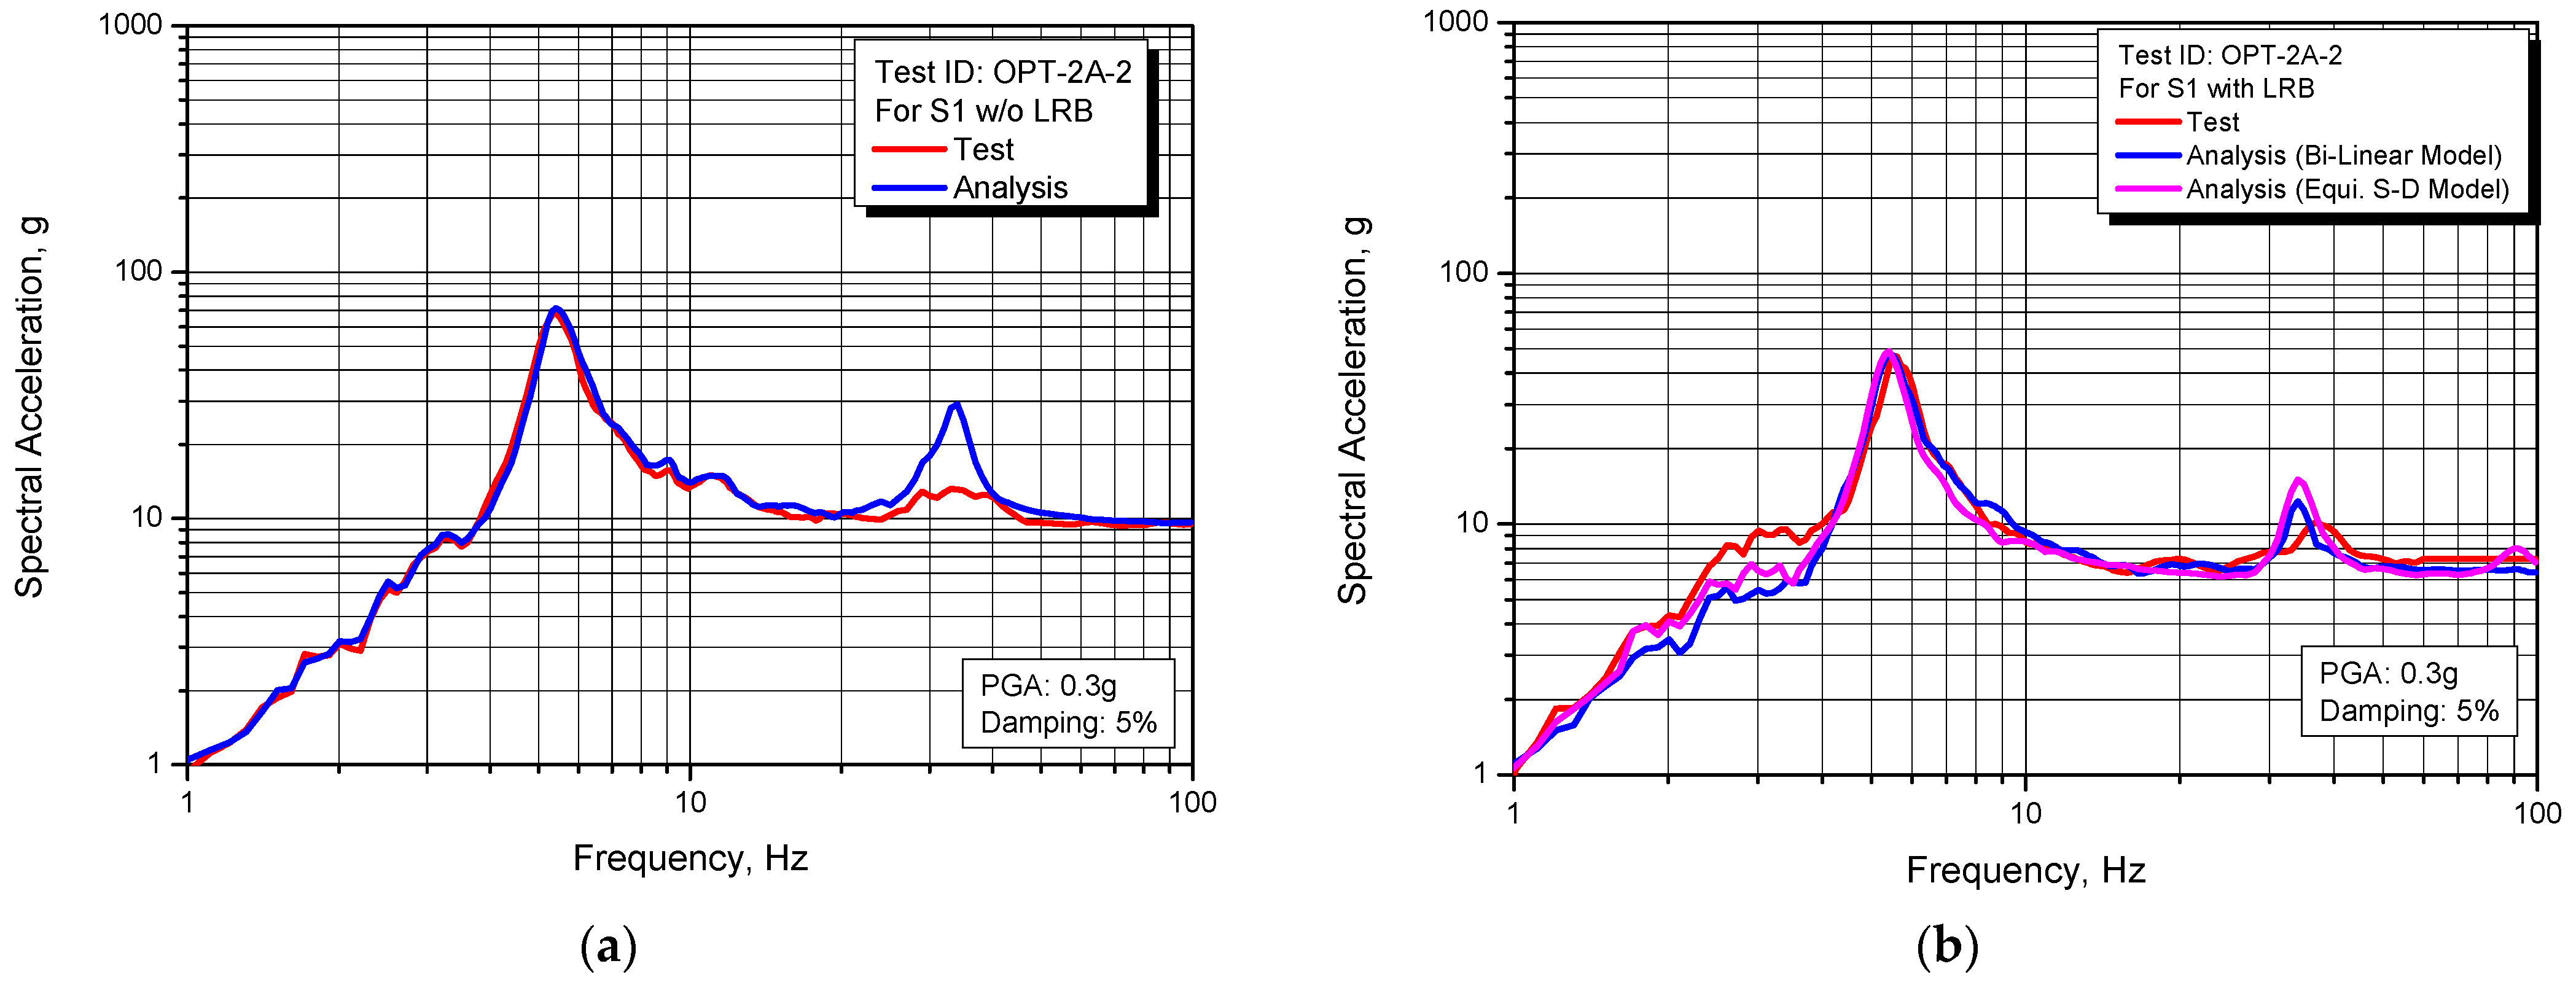
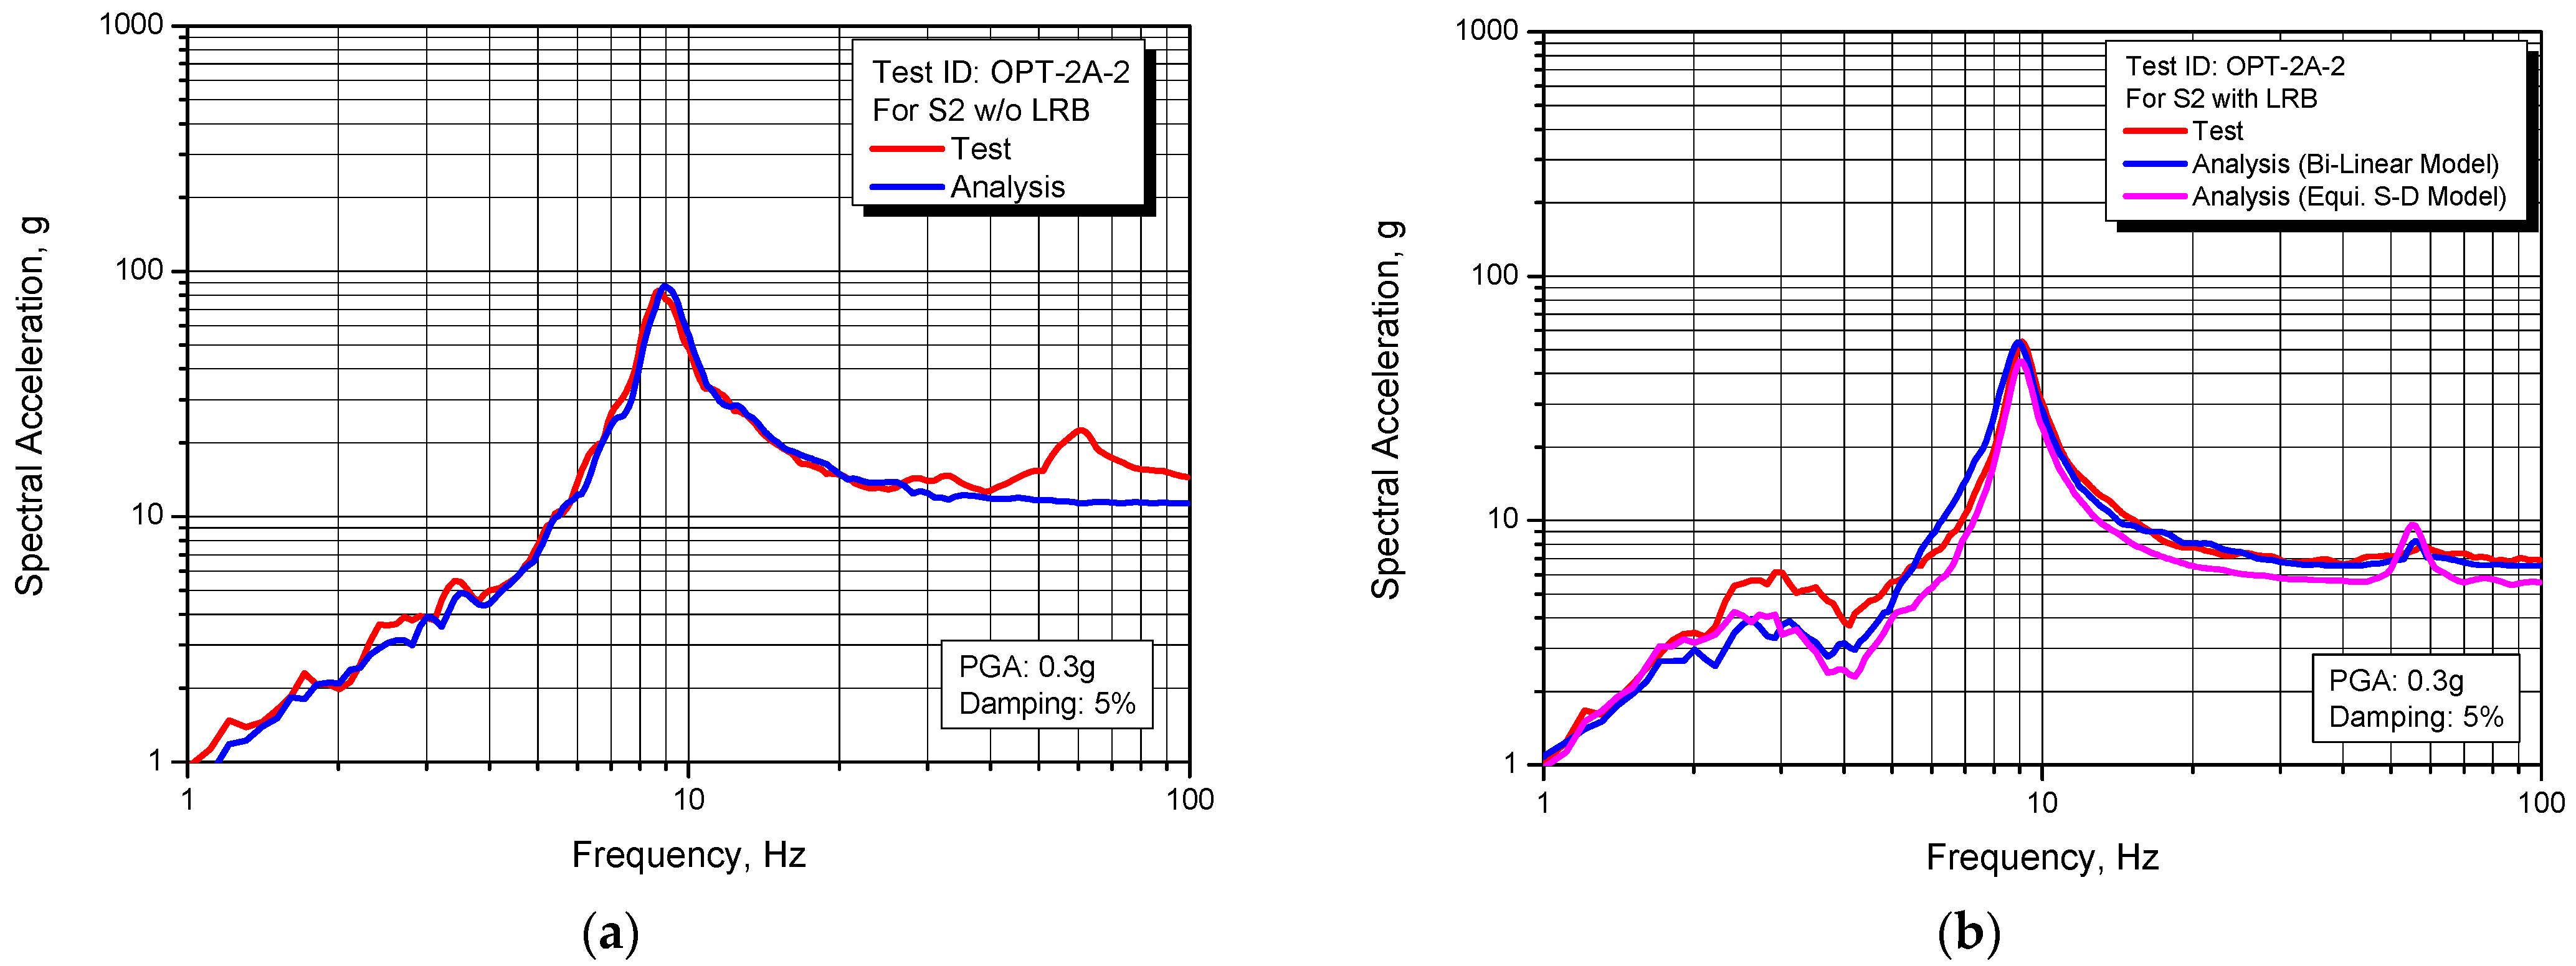
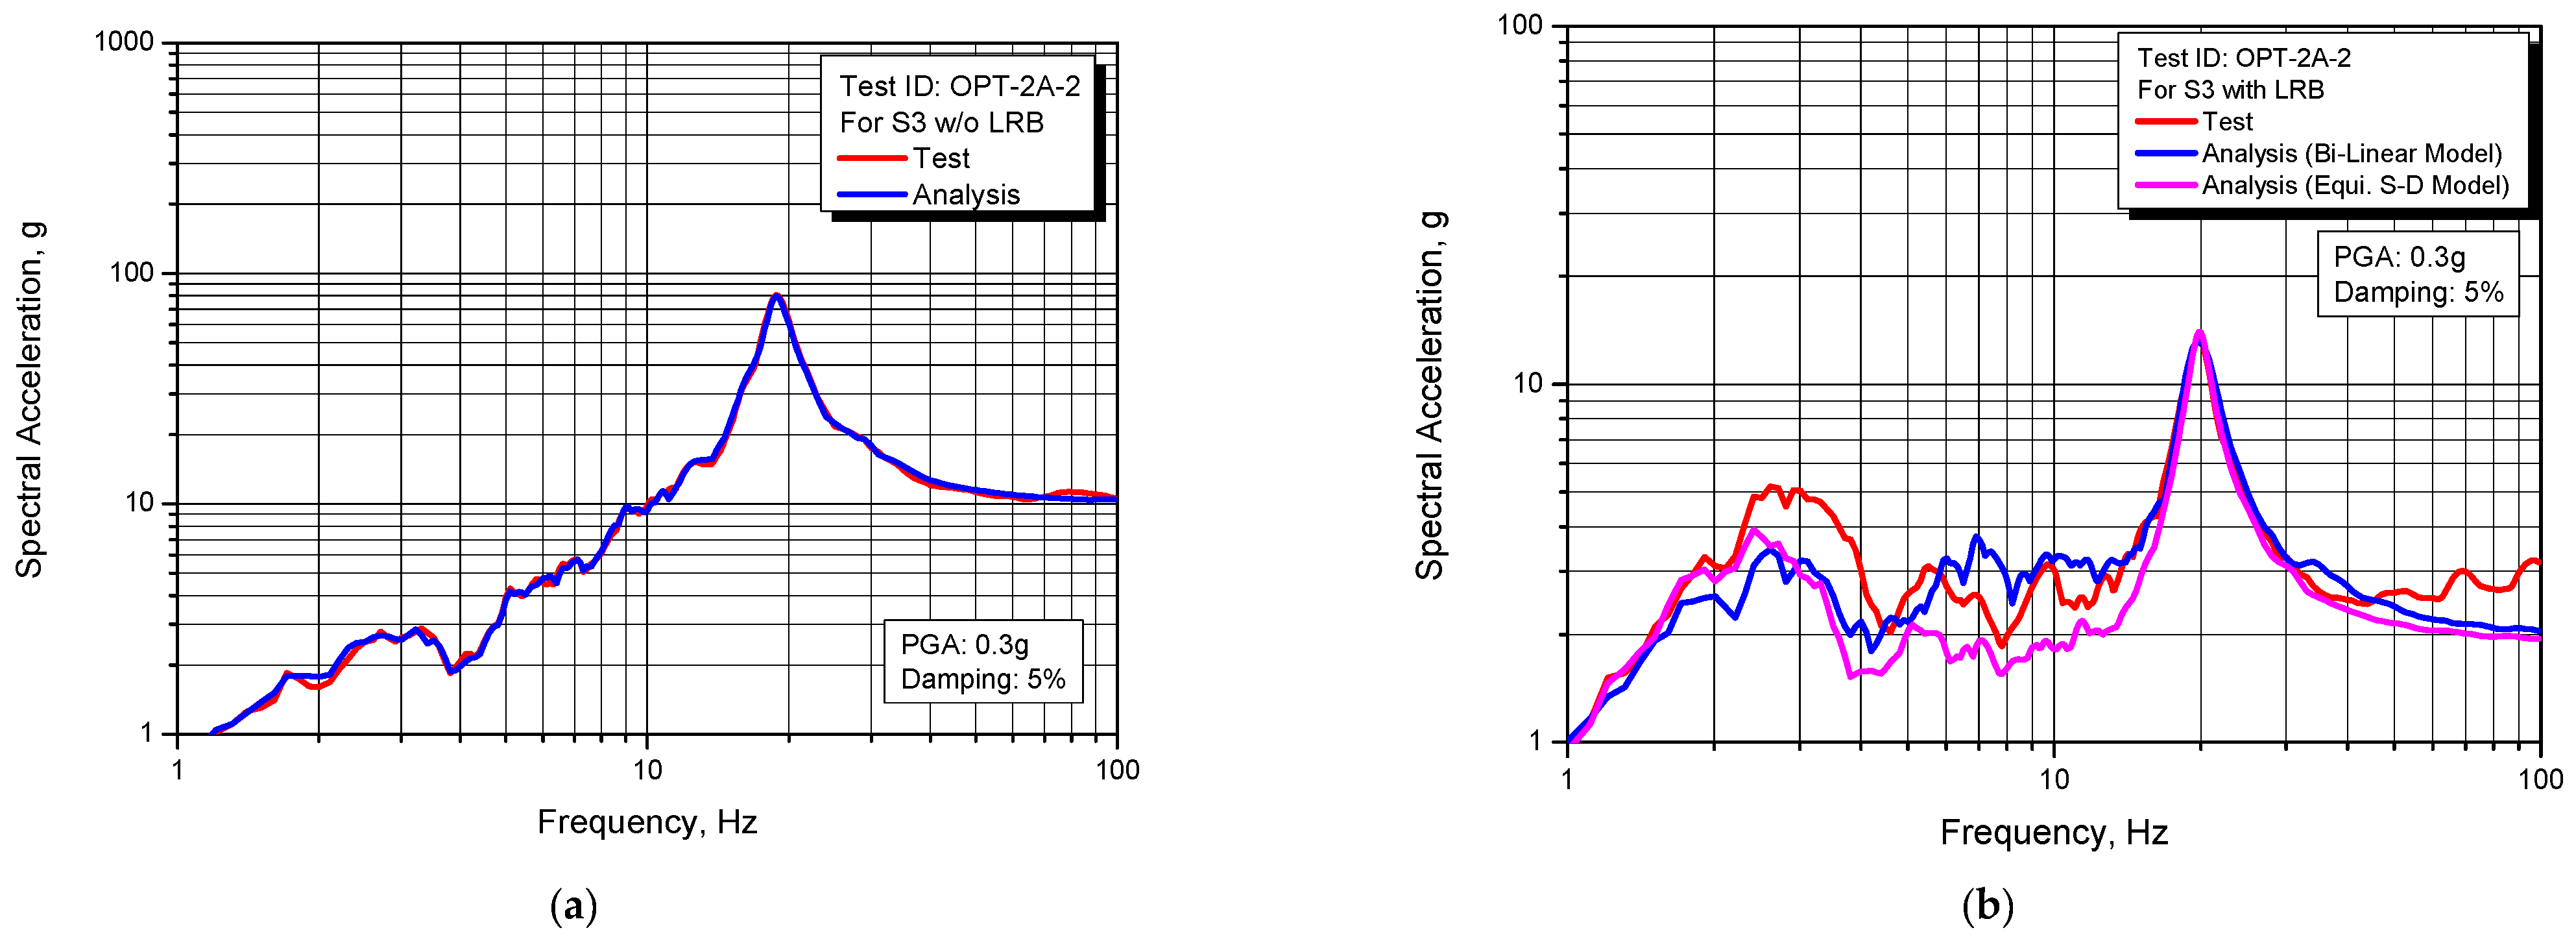
4.2. Comparison with Test Results
Figure 19,
Figure 20 and
Figure 21 present the comparison results of the response spectrum obtained from tests and analyses for individual beam structures on the shaking table and the dummy mass. As shown in the figures, the calculated response spectrum from the seismic analyses is in good agreement with those of the tests. Overall, it can be seen that the used two analysis models of LRB give very similar results but in the case of the equivalent stiffness-damping model, the value of critical damping ratio used in the analysis is 30%, which is slightly higher than the 24.1% obtained from the quasi-static tests in
Table 1.
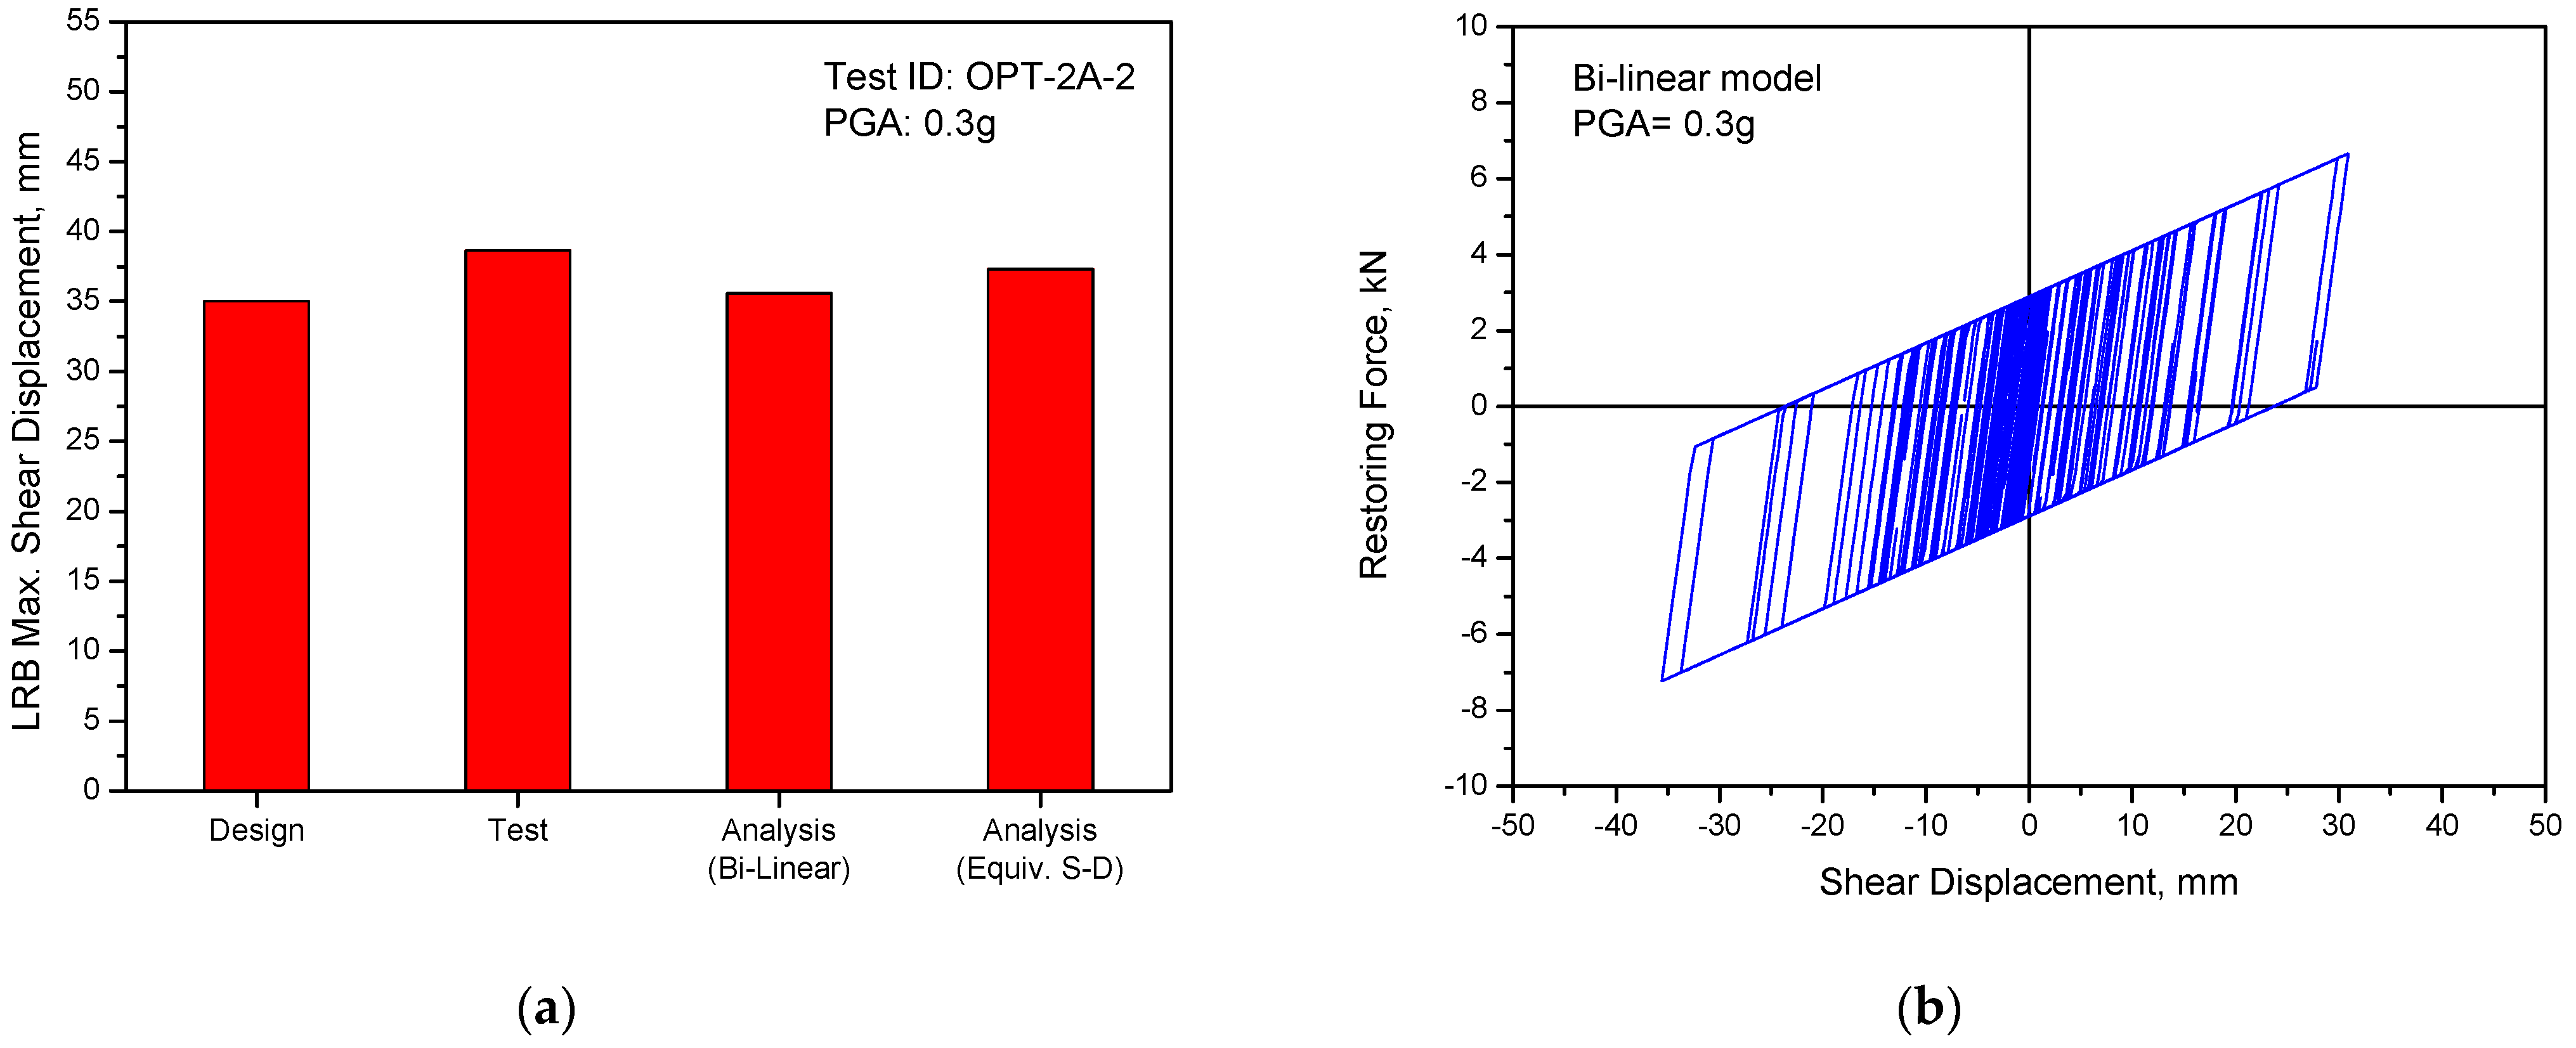
Figure 22 presents the results for the LRB shear displacement responses. In this figure,
Figure 22a shows comparison results of the maximum values between test and analysis. As shown in the figure, the maximum shear displacements of LRB in the analysis are 35.6 mm for the Bi-linear model and 37.3 mm for the equivalent stiffness-damping model. These results were slightly less than the 38.6 mm of the test result but were in good agreement with the 35 mm of the design target value presented in
Table 1.
Figure 22b shows the analysis result of the hysteretic behavior of LRB with the shear displacements vs. restoring forces. From the results, it could be confirmed that the Bi-linear characteristics of LRB identified from previous quasi-static tests can be used for the seismic analysis.
5. Conclusions
In this study, the shaking table tests of the lead inserted small-sized LRBs were performed with the dummy mass system and the applicability of the horizontal seismic isolation to the nuclear facility components was investigated in detail.
Through all shaking table tests specified in the test matrix and the seismic verification analyses, some valuable conclusions are derived as follows;
The tests of full-scaled LRBs can assure the reliability of the seismic isolation performance by removing the uncertainties potentially contained in the reduced-scale tests.
It was confirmed that the mechanical characteristics of LRB identified by the quasi-static tests were very similar to the results of the dynamic seismic shaking table tests.
The lead plug inserted in the center of the LRB reveals a good damping function by adequately restricting the shear displacement as targeted in the LRB design.
As intended in the test matrix starting tests sequentially from large to small level earthquakes, it was confirmed that LRB maintains seismic isolation performance against aftershocks even after experiencing the level of beyond design basis earthquakes.
The smaller the seismic input load level, the less the seismic isolation effect. This is because in the region where the shear displacement of LRB is small, the initial stiffness effect of the lead plug is large, and the frequency shift effect of the seismic isolation system is reduced.
As a result of performing the same repeated shaking table tests for each different LRB set of mockups, almost the same test results were obtained, and from this, the reliability of manufacturing the lead inserted small-sized LRB was confirmed.
It is confirmed that the developed LRB in this study has a seismic capacity accommodating PGA = 0.5 g (seismic fragility capacity, 0.625 g) at the 137 ft elevation of the nuclear power plant building structures.
It is recommended that the allowable seismic shear strain of LRB developed in this study is 400% for application to the nuclear facility components. When applied to input seismic load exceeding this stain level, more additional shaking table tests are required to confirm higher shear strain limit.
From the comparison results between the shaking table tests and the seismic analyses, it is found that the Bi-linear model or the equivalent stiffness-damping model of LRB can be used in the seismic analysis as a simple method when using well-identified stiffness and damping value of LRB.
Author Contributions
Conceptualization, G.-H.K., T.-M.S., and S.-J.M.; methodology, G.-H.K. and T.-M.S.; validation, G.-H.K.; formal analysis, G.-H.K.; investigation, T.-M.S. and S.-J.M.; writing—original draft preparation, G.-H.K.; writing—review and editing, T.-M.S. and S.-J.M.; funding acquisition, G.-H.K., T.-M.S. All authors have read and agreed to the published version of the manuscript.
Funding
This study was funded by the Ministry of Trade, Industry, and Energy through KETEP (Korea Institute of Energy Technology Evaluation Planning) (No. 20181510102380).
Institutional Review Board Statement
The study was conducted according to the guidelines of the Declaration of Helsinki, and approved by the Institutional Review Board.
Informed Consent Statement
Informed consent was obtained from all subjects involved in the study.
Data Availability Statement
Not Applicable.
Acknowledgments
This study was supported by the Ministry of Trade, Industry, and Energy through KETEP (Korea Institute of Energy Technology Evaluation Planning) (No. 20181510102380).
Conflicts of Interest
The authors declare no conflict of interest.
References
- Kwag, S.Y.; Kwag, J.S.; Lee, H.H.; Oh, J.H.; Koo, G.H. Enhancement in the Seismic Performance of a Nuclear Piping System using Multiple Tuned Mass Dampers. Energies 2019, 12, 2077. [Google Scholar] [CrossRef]
- Cho, S.G.; Chang, S.K.; Sung, D.Y. Application of tuned mass damper to mitigation of the seismic responses of electrical equipment in nuclear power plants. Energies 2020, 13, 427. [Google Scholar] [CrossRef]
- Kostarev, V.; Petrenko, A.; Vasilev, P.A. New Method for Essential Reduction of Seismic and External Loads on NPP’s Structures, Systems and Components. In Proceedings of the 17th International Conference on SMiRT, Prague, Czech Republic, 17–22 August 2003; Volume K13-1. [Google Scholar]
- Carlos, M.V.; Tianjian, J. Seismic protection technology for nuclear power plants: A systematic review. J. Nucl. Sci. Technol. 2015, 52, 607–632. [Google Scholar]
- Seismic Isolation Systems for Nuclear Installations; IAEA-TECDOC-1905; IAEA: Vienna, Austria, 2020.
- Qin, C.; Liu, W.; He, W. Seismic Response Analysis of Isolated Nuclear Power Plants with Friction Damper Isolation System. AASRI Procedia 2014, 7, 26–31. [Google Scholar] [CrossRef]
- Seismic Isolation of Nuclear Power Plants Using Sliding Bearing; NUREG/CR-7254; NRC: North Bethesda, MD, USA, 2015.
- Kamrava, A. Seismic isolators and their types. Curr. World Environ. 2015, 10, 27–32. [Google Scholar] [CrossRef]
- Koo, G.H.; Lee, J.H.; Yoo, B.; Ohtori, Y. Evaluation of Laminated Rubber Bearing for Seismic Isolation Using Modified Macro-Model with Parameter Equations of Instantaneous Apparent Shear Modulus. Eng. Struct. 1999, 21, 594–602. [Google Scholar] [CrossRef]
- Eidinger, J.K.; Tajirian, F.F.; Kircher, C.A.; Vaidya, N.; Constantinou, M.; Kelly, J.M.; Ovadia, D.; Seidensticker, R. Base Isolation for Nuclear Power and Nuclear Material Facilities. In Proceedings of the Second DOE Natural Phenomena Hazards Mitigation Conference, Lawrence Livermore National Lab, Knoxville, TN, USA, 3–5 October 1989; pp. 46–57. [Google Scholar]
- Fujita, T.; Fujita, S.; Suzuki, S.; Yoshizawa, T. Experimental Study of Laminated Rubber Bearings for Earthquake Isolation of Buildings. Trans. Jpn. Soc. Mech. Eng. 1987, 53, 71–76. [Google Scholar] [CrossRef]
- Koshida, H.; Yasaka, A. Vibration tests and earthquake observation results of base-isolated building. Seism. Shock Vib. Isol. 1989, 181, 135–140. [Google Scholar]
- Tsai, H.C.; Kelly, J.M. Seismic response of heavily damped base isolation systems. Earthq. Eng. Struct. Dyn. 1993, 22, 633–645. [Google Scholar] [CrossRef]
- Alhan, C.; Oncu, S. Performance limits of seismically isolated buildings under near-field earthquakes. Eng. Struct. 2016, 116, 83–94. [Google Scholar] [CrossRef]
- Kubo, T.; Yamamoto, T.; Saro, K.; Jimbo, M.; Imaoka, T.; Umeki, Y. A Seismic Design of Nuclear Reactor Building Structures Applying Seismic Isolation System in A High Seismicity Region–A Feasibility Case Study In JAPAN. Nucl. Eng. Technol. 2014, 46, 716. [Google Scholar] [CrossRef]
- Zhai, C.; Zheng, Z.; Li, S.; Pan, X. Damage Accumulation of a Base-isolated RCC Building under Main shock-aftershock Seismic Sequences. KSCE J. Civ. Eng. 2017, 21, 364–377. [Google Scholar] [CrossRef]
- Sato, N.; Watanabe, Y.; Kato, A.; Ohba, M.; Fukushima, Y.; Iizuka, M.; Yoshikawa, K.; Umeki, K.; Suhara, J.; Murazumi, Y.; et al. Shaking Table Test and Analysis on Ultimate Characteristics of the Lead Rubber Bearing for Base Isolated FBR Plant. In Proceedings of the 12th World Conference on Earthquake Engineering, Auckland, New Zealand, 30 January–4 February 2000. [Google Scholar]
- Ohtori, Y. Experimental Study on Mechanical Characteristics of High Damping Rubber Bearings of Various Shapes. J. Struct. Eng. (Trans. Archit. Inst. Jpn.) 1997, 43B, 125–133. [Google Scholar]
- Moteki, M.; Kawai, N.; Ishida, K.; Yabana, S.; Nojima, O. Shaking table test on ultimate behavior of seismic isolation system, Part 1: Outline of the test and response of superstructure. In Proceedings of the 10th World Conference on Earthquake Engineering; Madrid, Spain, 19–24 July 1992, pp. 2271–2276.
- Sato, N.; Kato, A.; Fukushima, Y.; Iizuka, M. Shaking table tests on failure characteristics of base isolation system for a DFBR plant. Nucl. Eng. Des. 2002, 212, 293–305. [Google Scholar] [CrossRef]
- Koo, G.H.; Jung, J.Y.; Lee, J.H.; Shin, T.M. Development of Small-Sized Lead Inserted Laminated Rubber Bearing for Nuclear Component Seismic Isolation. Energies 2020, 13, 3193. [Google Scholar] [CrossRef]
- MTS. 2021. Available online: https://www.mts.com/en/forceandmotion/geociviltesting/index.htm (accessed on 14 April 2021).
- Design Response Spectra for Seismic Design of Nuclear Power Plants; Regulatory Guide 1.60; Nuclear Regulatory Commission: Rockville, MD, USA, 1973.
- A Methodology for Assessment of Nuclear Power Plant Seismic Margin (Revision 1); EPRI/NP-6041-SL; Electric Power Research Institute (EPRI): Washington, DC, USA, 1991.
- ANSYS. Mechanical APDL Release 15.0; ANSYS, Inc.: Canonsburg, PA, USA, 2013. [Google Scholar]
Figure 1.
Photos of test mockup with four LRBs and four tons dummy mass system.
Figure 1.
Photos of test mockup with four LRBs and four tons dummy mass system.
Figure 2.
Design response spectrum used in tests (PGA = 0.3 g).
Figure 2.
Design response spectrum used in tests (PGA = 0.3 g).
Figure 3.
Acceleration time histories for shaking table input motion (PGA = 0.3 g): (a) Corresponding to RRS; (b) Corresponding to TRS.
Figure 3.
Acceleration time histories for shaking table input motion (PGA = 0.3 g): (a) Corresponding to RRS; (b) Corresponding to TRS.
Figure 4.
Design response spectrum used in tests (PGA = 0.3 g).
Figure 4.
Design response spectrum used in tests (PGA = 0.3 g).
Figure 5.
Test results for safe shutdown earthquake (PGA = 0.3 g): (a) Acceleration time histories; (b) Corresponding response spectrum.
Figure 5.
Test results for safe shutdown earthquake (PGA = 0.3 g): (a) Acceleration time histories; (b) Corresponding response spectrum.
Figure 6.
Test results of acceleration time history response (TEST ID: OPT-2A-1, PGA = 0.5 g): (a) S1; (b) S2; (c) S3.
Figure 6.
Test results of acceleration time history response (TEST ID: OPT-2A-1, PGA = 0.5 g): (a) S1; (b) S2; (c) S3.
Figure 7.
Test results of acceleration time history response (TEST ID: OPT-2A-2, PGA = 0.3 g): (a) S1; (b) S2; (c) S3.
Figure 7.
Test results of acceleration time history response (TEST ID: OPT-2A-2, PGA = 0.3 g): (a) S1; (b) S2; (c) S3.
Figure 8.
Test results of acceleration time history response (TEST ID: OPT-2A-3, PGA = 0.1 g): (a) S1; (b) S2; (c) S3.
Figure 8.
Test results of acceleration time history response (TEST ID: OPT-2A-3, PGA = 0.1 g): (a) S1; (b) S2; (c) S3.
Figure 9.
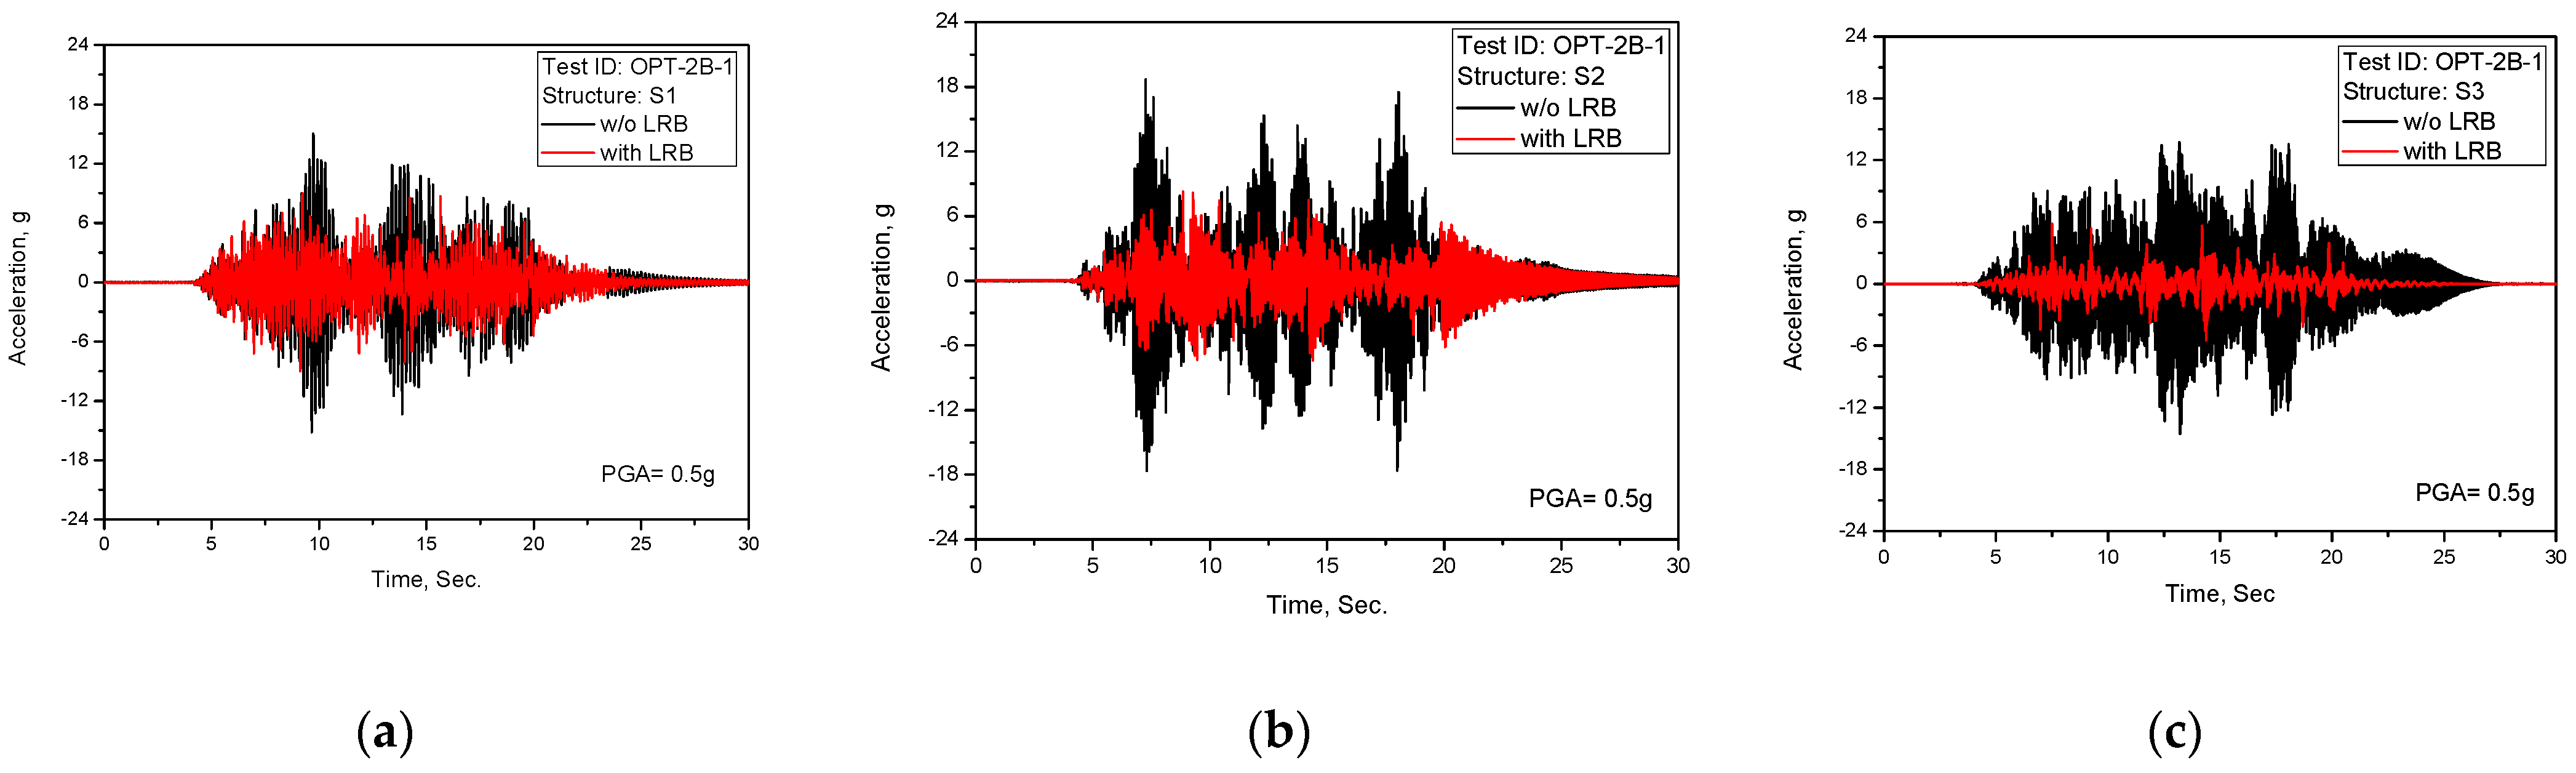
Test results of acceleration time history response (TEST ID: OPT-2B-1, PGA = 0.5 g): (a) S1; (b) S2; (c) S3.
Figure 9.
Test results of acceleration time history response (TEST ID: OPT-2B-1, PGA = 0.5 g): (a) S1; (b) S2; (c) S3.
Figure 10.
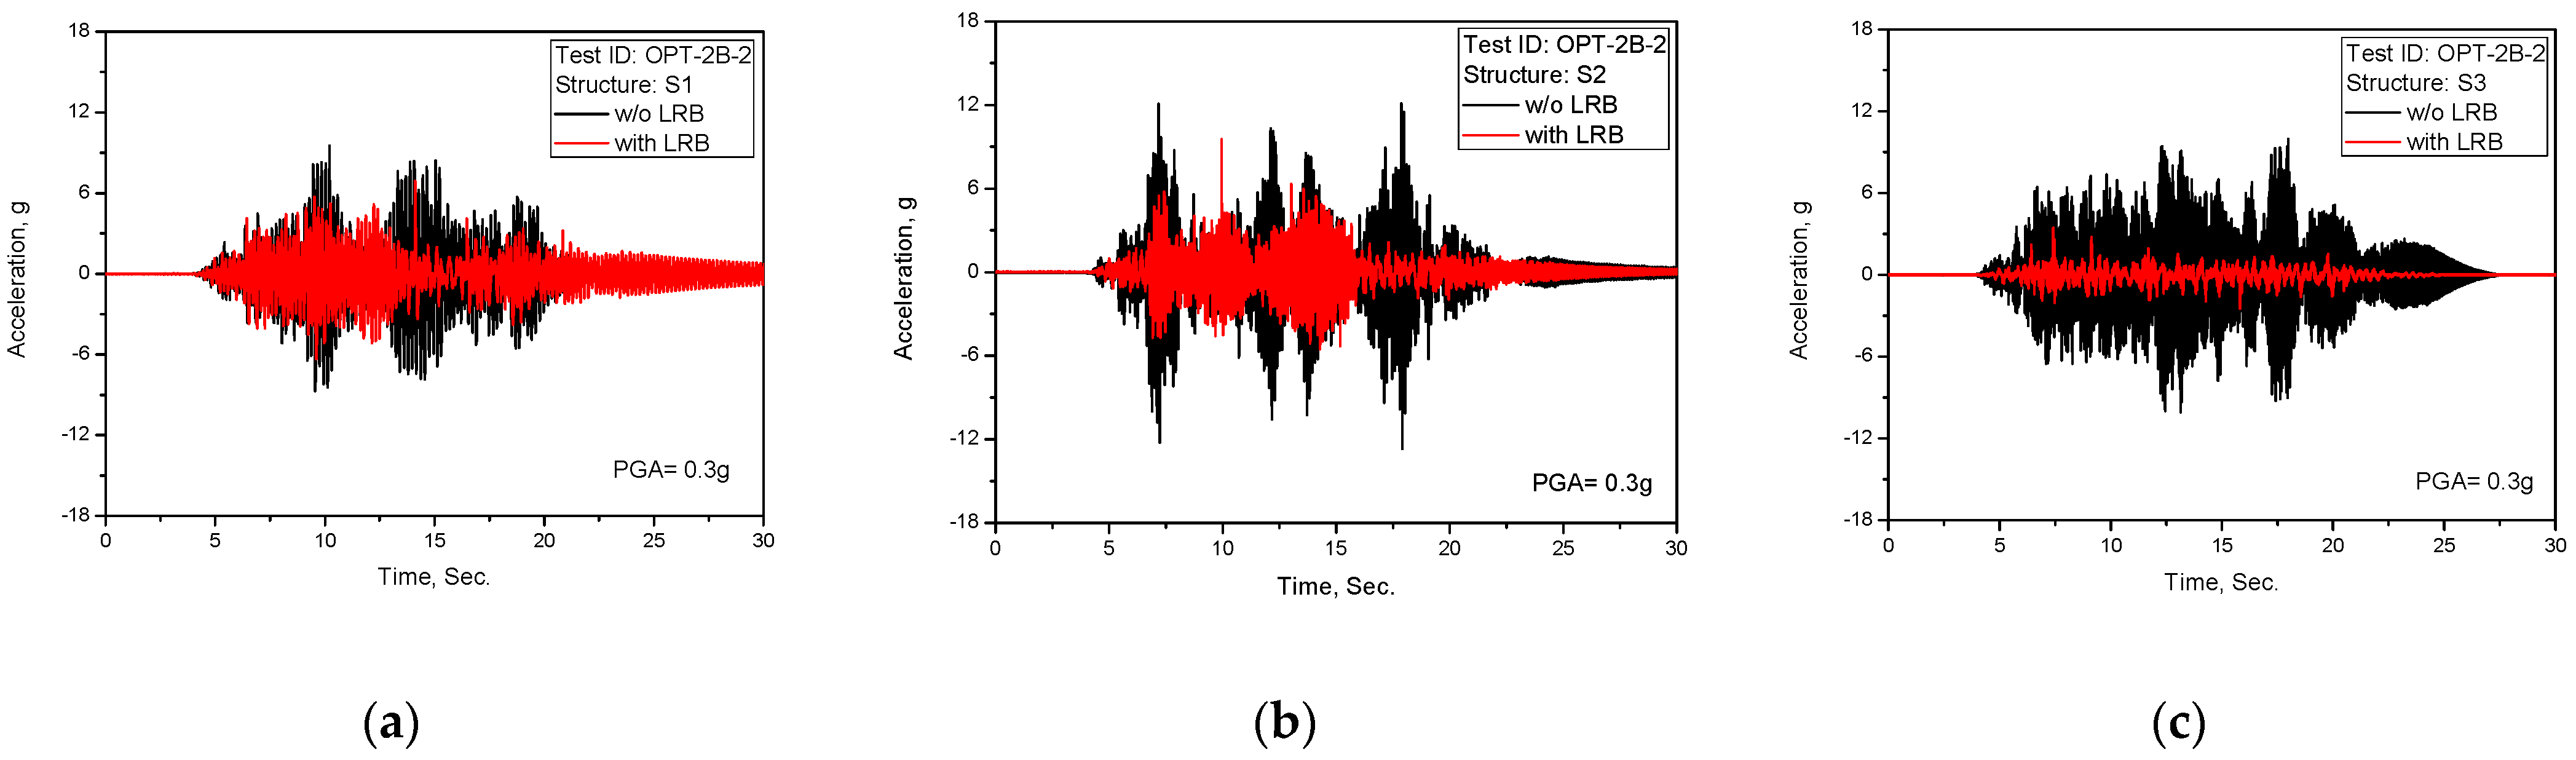
Test results of acceleration time history response (TEST ID: OPT-2B-2, PGA = 0.3 g): (a) S1; (b) S2; (c) S3.
Figure 10.
Test results of acceleration time history response (TEST ID: OPT-2B-2, PGA = 0.3 g): (a) S1; (b) S2; (c) S3.
Figure 11.
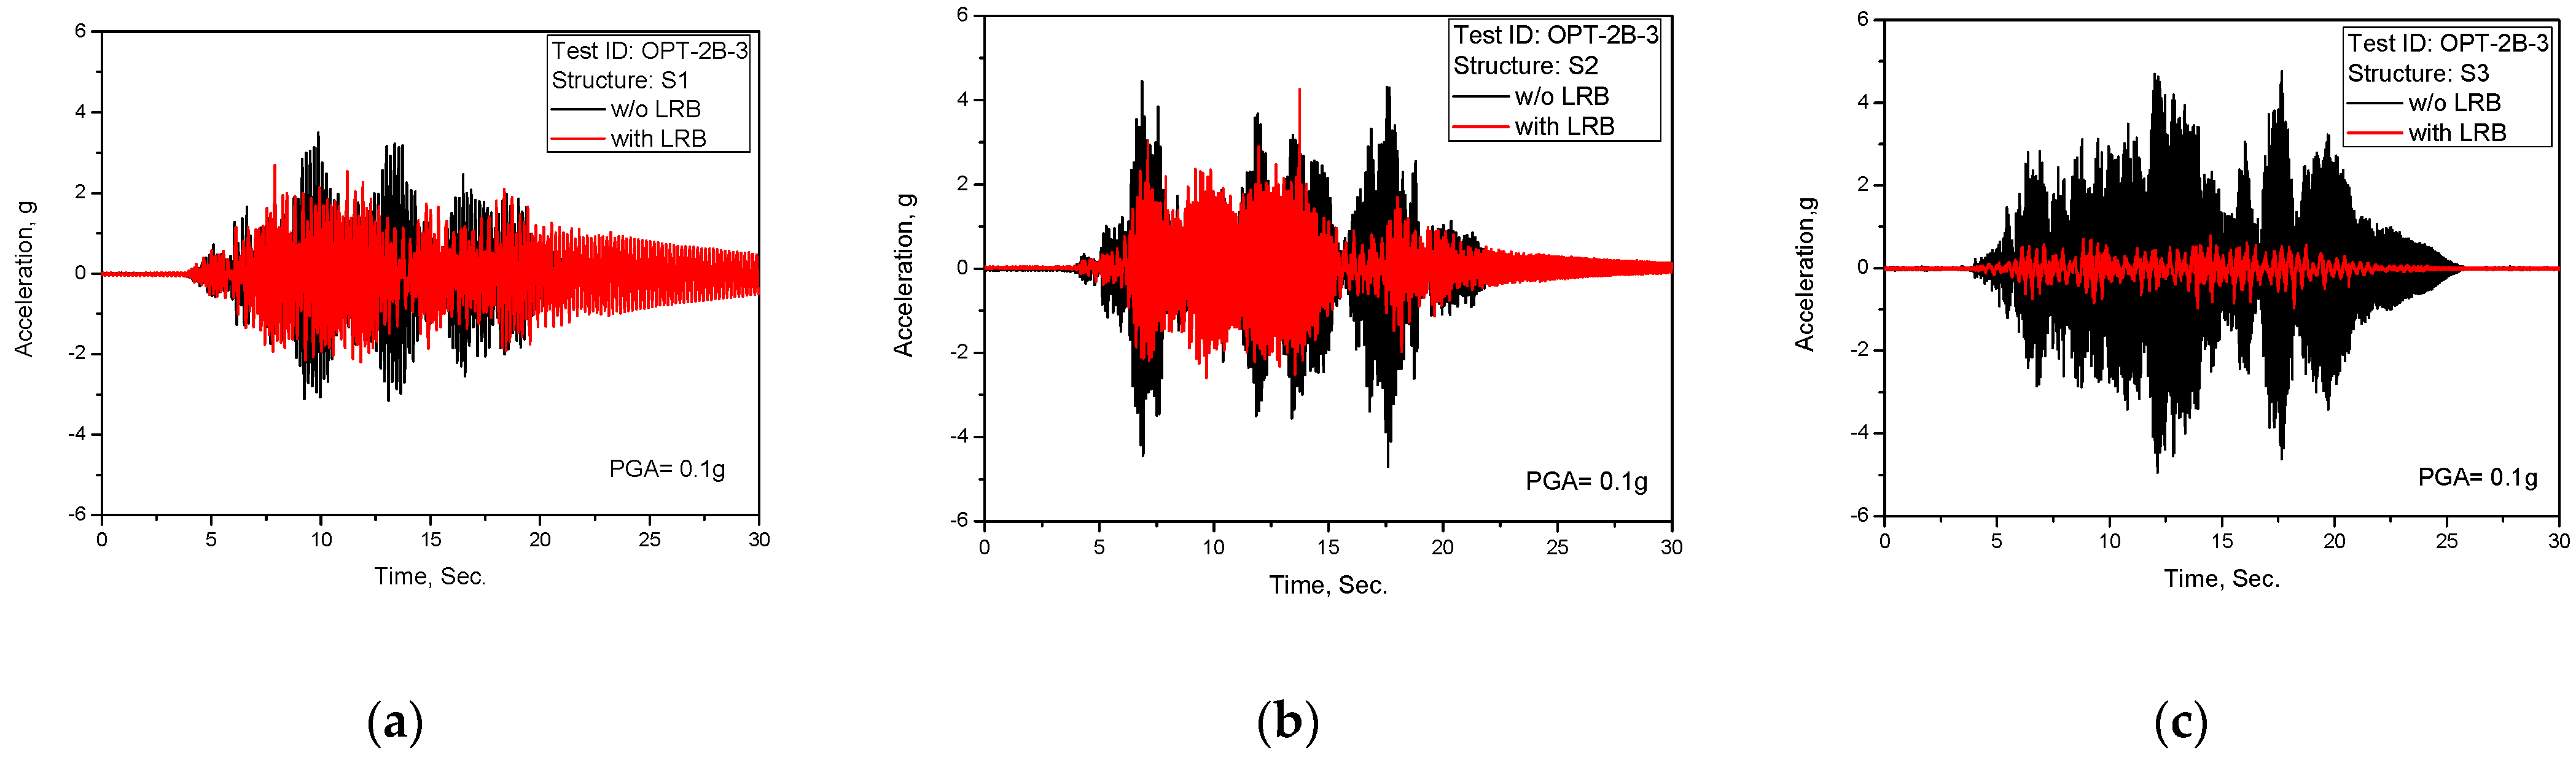
Test results of acceleration time history response (TEST ID: OPT-2B-3, PGA = 0.1 g): (a) S1; (b) S2; (c) S3.
Figure 11.
Test results of acceleration time history response (TEST ID: OPT-2B-3, PGA = 0.1 g): (a) S1; (b) S2; (c) S3.
Figure 12.
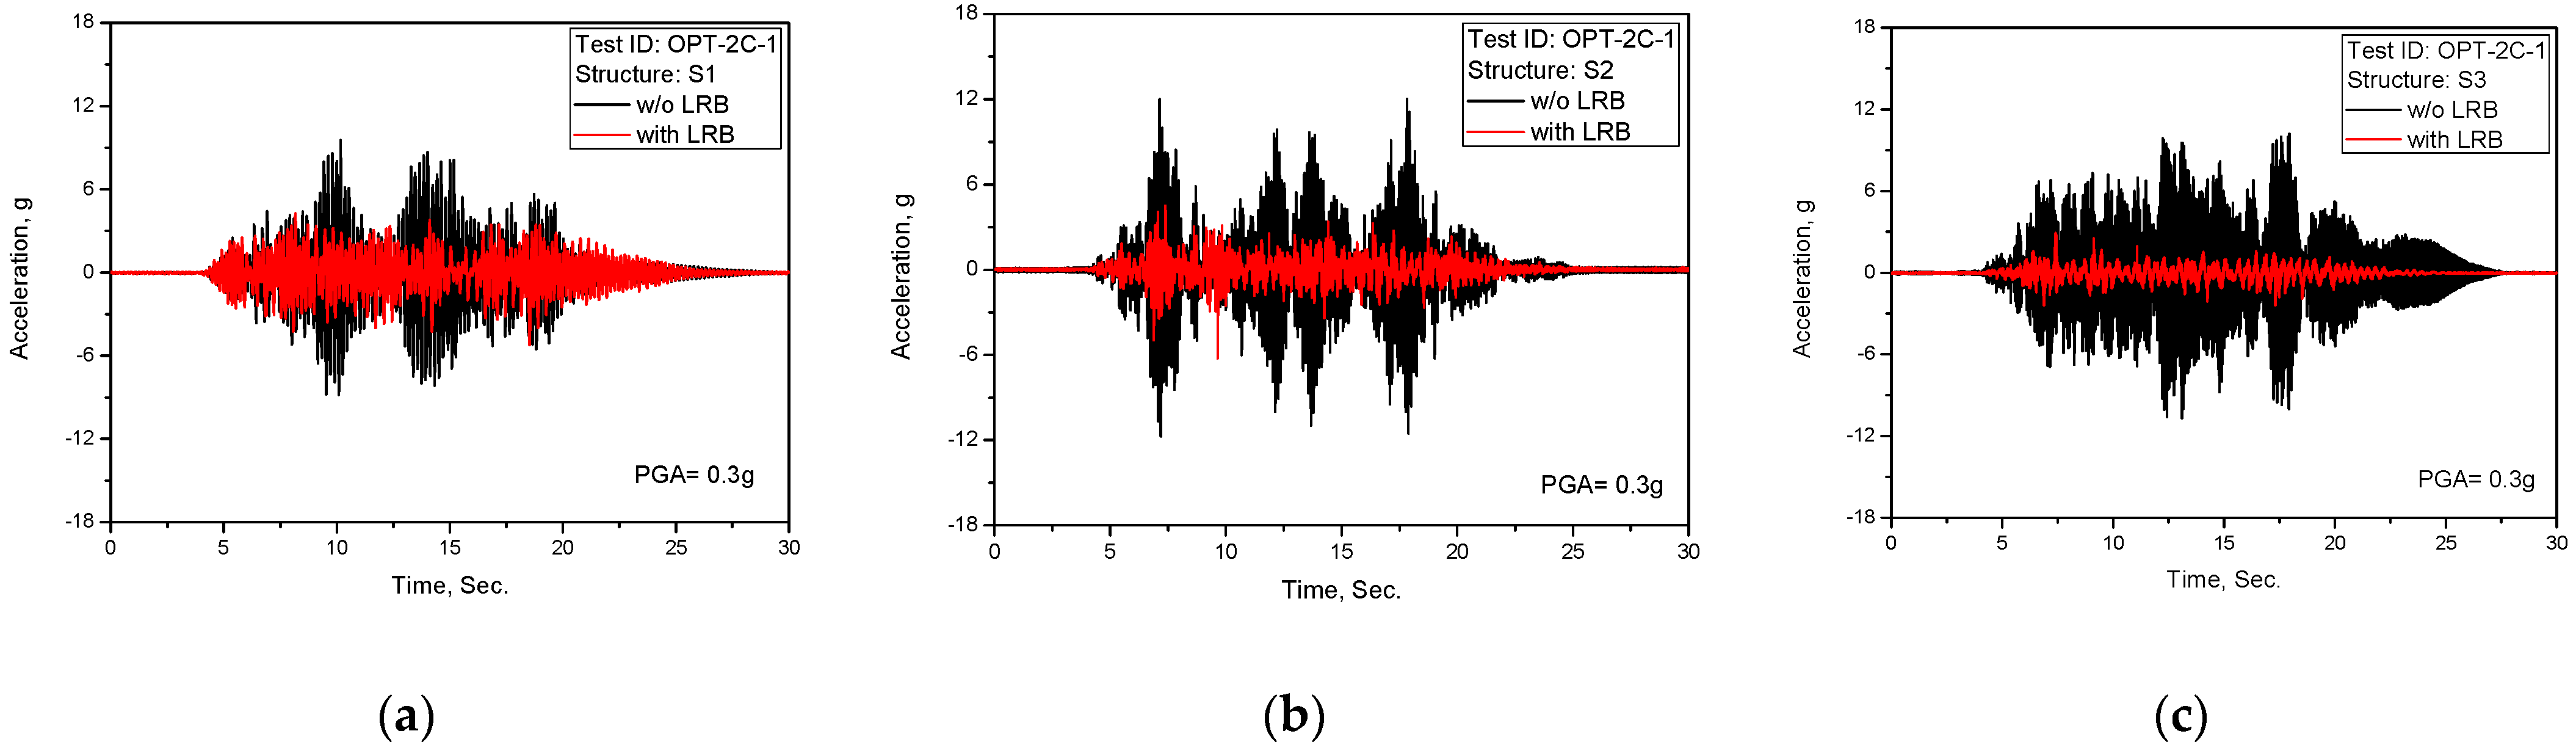
Test results of acceleration time history response (TEST ID: OPT-2C-1, PGA = 0.3 g): (a) S1; (b) S2; (c) S3.
Figure 12.
Test results of acceleration time history response (TEST ID: OPT-2C-1, PGA = 0.3 g): (a) S1; (b) S2; (c) S3.
Figure 13.
Test results of acceleration time history response (TEST ID: OPT-2C-2, PGA = 0.6 g): (a) S1; (b) S2; (c) S3.
Figure 13.
Test results of acceleration time history response (TEST ID: OPT-2C-2, PGA = 0.6 g): (a) S1; (b) S2; (c) S3.
Figure 14.
Comparison of spectral peak values calculated from the test results: (a) S1; (b) S2; (c) S3.
Figure 14.
Comparison of spectral peak values calculated from the test results: (a) S1; (b) S2; (c) S3.
Figure 15.
Measured maximum shear displacement of LRB: (a) At the center of dummy mass; (b) At the edge of dummy mass.
Figure 15.
Measured maximum shear displacement of LRB: (a) At the center of dummy mass; (b) At the edge of dummy mass.
Figure 16.
Measured LRB shear displacement time history response for Test ID: OPT-2A-1, PGA = 0.5 g.
Figure 16.
Measured LRB shear displacement time history response for Test ID: OPT-2A-1, PGA = 0.5 g.
Figure 17.
Photos of failed LRB after ultimate test with PGA = 0.6 g (Test ID, OPT-2C-2): (a) Front view with permanent deformation; (b) Top view with failed section.
Figure 17.
Photos of failed LRB after ultimate test with PGA = 0.6 g (Test ID, OPT-2C-2): (a) Front view with permanent deformation; (b) Top view with failed section.
Figure 18.
Seismic analysis model: (a) Schematics of the test mockup; (b) Finite element model.
Figure 18.
Seismic analysis model: (a) Schematics of the test mockup; (b) Finite element model.
Figure 19.
Comparison of response spectrum between test and analysis for S1 structure: (a) Non-isolated; (b) Seismically isolated.
Figure 19.
Comparison of response spectrum between test and analysis for S1 structure: (a) Non-isolated; (b) Seismically isolated.
Figure 20.
Comparison of response spectrum between test and analysis for S2 structure: (a) Non-isolated; (b) Seismically isolated.
Figure 20.
Comparison of response spectrum between test and analysis for S2 structure: (a) Non-isolated; (b) Seismically isolated.
Figure 21.
Comparison of response spectrum between test and analysis for S3 structure: (a) Non-Isolated; (b) Seismically Isolated.
Figure 21.
Comparison of response spectrum between test and analysis for S3 structure: (a) Non-Isolated; (b) Seismically Isolated.
Figure 22.
LRB shear displacement responses: (a) Comparison of maximum values; (b) Hysteretic response with Bi-linear model.
Figure 22.
LRB shear displacement responses: (a) Comparison of maximum values; (b) Hysteretic response with Bi-linear model.
Table 1.
Summary of LRB design parameters [
21].
Table 1.
Summary of LRB design parameters [
21].
| Design Parameters | Design Value |
|---|
| Outer Diameter (Do) | 100 mm |
| Lead Plug Diameter (d) | 21.5 mm |
| Total Rubber Height (tR) | 20 mm |
| Total LRB Height (t) | 34 mm |
| Shape Factor (S1) | 9.9 |
| Shape Factor (S2) | 5.0 |
| Design Vertical Load (Pd) | 10 kN |
| Design Shear Displacement (Dd) | 35 mm (175%) |
| Beyond Design Shear Displacement (Db) | 80 mm (400%) |
Table 2.
LRB dynamic characteristics at design level [
21].
Table 2.
LRB dynamic characteristics at design level [
21].
| Parameters | Design | Quasi-Static Tests |
|---|
| Horizontal Isolation Frequency (Fiso) | 2.3 Hz | 2.25 Hz |
| Equivalent Horizontal Stiffness (Keff) | 209 kN/m | 199.3 kN/m |
| Critical Damping Ratio (ξ) | 25.4% | 24.1% |
| Tangential Stiffness (Kt) | 123 kN/m | 122 kN/m |
| Characteristic Strength (Qd) | 3 kN | 2.72 kN |
Table 3.
Shaking table performance.
Table 3.
Shaking table performance.
| Item | Performance |
|---|
| Max. Loading (kN) | 300 |
| Table Size (m) | 4 × 4 |
| Control Axes | 6 DOF (Translation 3 axes, Rotational 3 Axes) |
| Max. Displacement (mm) | Hor. (X, Y) = ±300, Ver. (Z) = ±150 |
| Max. Velocity (m/s) | Hor. (X, Y) = 1.5, Ver.(Z) = 1.0 |
| Max. Acceleration (g) | Hor. (X, Y) = 3.0, Ver.(Z) = 5.0 |
| Frequency Range (Hz) | 0.1 ~ 60 |
| Excitation Mechanism | Electro-hydraulic Servo, 3 Variable Control |
| Control Software | MTS 469D |
| Feedback Data Acquisition | 63 Channels (Sampling Rate = 512 Hz) |
Table 4.
Test Matrix.
| Test Mockup ID | Test ID | PGA (g) | PGA with
IEAF (Fµ) 1 (g) | Remarks |
|---|
| OPT-2A | OPT-2A-1 | 0.5 | 0.625 | Seismic Fragility Capacity |
| OPT-2A-2 | 0.3 | 0.3 | SSE |
| OPT-2A-3 | 0.1 | 0.1 | OBE |
| OPT-2B | OPT-2B-1 | 0.5 | 0.625 | Seismic Fragility Capacity |
| OPT-2B-2 | 0.3 | 0.3 | SSE |
| OPT-2B-3 | 0.1 | 0.1 | OBE |
| OBT-2C | OPT-2C-1 | 0.3 | 0.3 | SSE |
| OPT-2C-2 | 0.6 | 0.75 | For Ultimate Behavior |
Table 5.
Analysis input parameters for finite element modeling.
Table 5.
Analysis input parameters for finite element modeling.
| Structure ID | Beam Model | LRB Models |
|---|
| Bi-Linear | Equiv. Stiffness-Damping |
|---|
| L (mm) | Izz (m4) | ALPHA | BETA | Ke (kN/m) | Kt (kN/m) | Qd (kN) | Keq (kN/m) | ξ (%) |
|---|
| S1 | 47.0 | 0.84E-11 | 0.863 | 1.349E-4 | 187.6 | 122 | 2.7 | 199.3 | 30 |
| S2 | 42.2 | 2.00E-11 | 3.247 | 4.569E-5 | 187.6 | 122 | 2.7 | 199.3 | 30 |
| S3 | 34.6 | 6.75E-11 | 1.626 | 2.059E-4 | 187.8 | 122 | 2.7 | 199.3 | 30 |
| Publisher’s Note: MDPI stays neutral with regard to jurisdictional claims in published maps and institutional affiliations. |
© 2021 by the authors. Licensee MDPI, Basel, Switzerland. This article is an open access article distributed under the terms and conditions of the Creative Commons Attribution (CC BY) license (https://creativecommons.org/licenses/by/4.0/).


