
Seismic Design and Performance Assessment of Frame Buildings Reinforced by Dual-Phase Steel


Faculty of Civil and Geodetic Engineering, University of Ljubljana, 1000 Ljubljana, Slovenia
*
Author to whom correspondence should be addressed.
Appl. Sci. 2021, 11(11), 4998; https://doi.org/10.3390/app11114998
Submission received: 12 May 2021
/
Revised: 24 May 2021
/
Accepted: 25 May 2021
/
Published: 28 May 2021
(This article belongs to the Special Issue Seismic Assessment and Design of Structures)
Abstract
:To improve the durability and serviceability of reinforced concrete structures, different variants of dual-phase reinforcing steel were developed within the research project NEWREBAR. The investigated variant of the new material, termed DPD2 steel, has a specific microstructure that increases the corrosion resistance, but its yielding strength is less than that of Tempcore steel B500B. DPD2 steel has no yielding plateau, which is characteristic of conventional reinforcing steel. Thus, it was investigated whether the current building codes can be used to design earthquake-resistant concrete structures reinforced by DPD2 steel bars. For this reason, three multi-story reinforced concrete frame buildings were designed according to Eurocode by considering DPD2 steel and, for comparison reasons, Tempcore steel B500B. Based on the nonlinear model, which was validated by cyclic test of columns, the seismic performance of DPD2 buildings was found to be improved compared to those designed with conventional B500B reinforcing steel. This can mainly be attributed to the substantial strain hardening of the DPD2 steel, which increases the overstrength factor of the structure by about 10%. However, for the improved seismic performance, the amount of steel in DPD2 buildings had to be increased in the design by approximately 20–25% due to the smaller yield strength of DPD2 steel. Nevertheless, it was demonstrated that Eurocode 8 could be used to design earthquake-resistant frame building reinforced with dual-phase reinforcing steel DPD2.
1. Introduction
The exposure of reinforced concrete structures to aggressive environmental conditions causes corrosion of steel reinforcing bars and deterioration of structural performance against gravity and seismic loads (e.g., [1,2,3,4]). The corrosion rate, however, also depends on the typology of the reinforcing steel. At present, the majority of new reinforced concrete structures in Europe are reinforced with Tempcore reinforcing bars. Tempcore steel is characterised by its highly suitable mechanical properties, excellent weldability, ductility, bendability and manageable production costs. Nevertheless, several authors [5,6,7] observed that the deformation and energy dissipation capacity of structural elements reinforced by Tempcore steel bars rapidly deteriorates if they are exposed to aggressive environmental conditions. Corrosion affects the bending and shear capacity of structural elements. Thus, the seismic performance of the structure can be reduced significantly during its lifetime (e.g., [8,9,10]). Celarec et al. [8] showed that the corrosion of stirrups could trigger the shear failure of structural elements, although the frame was designed and constructed according to the capacity design principles. Lavorato et al. [10], among others, reported that the corrosion might induce longitudinal bar buckling in sections that were originally designed to prevent such phenomena.
Therefore, it is sensible to investigate and improve the durability (i.e., resistance against corrosion) of reinforced concrete structures. The degradation of concrete structures is often improved by the utilisation of modified concrete mixture [11,12]. The most convenient approach is to increase the thickness of the concrete cover and improve the quality of concrete [13]. However, in recent years, it has become possible to enhance the properties of steel bars. For example, Lollini et al. [14] and Gu and Meng [15] presented the applications of stainless steel in construction. Maffei et al. [16] and Salvatore et al. [17] analysed the possibility of adopting dual-phase (DP) steels for civil construction. DP steels are widely used in the automotive sector due to their excellent ductile properties and improved durability performance. However, the use of DP steel in construction is limited because the technology for mass production of reinforcing bars has yet to be fully developed. One attempt was made by Lorusso et al. [18], who presented the application of DP steels in wires for the reinforcement of concrete structures. Authors found that the DP steels had a greater capacity for energy absorption, ultimate elongation and hardening exponent than ATR500N, although they showed a slight decrease in resistance. However, their product did not reach the levels of elongation at maximum strength or at rupture which are typical for traditional Tempcore steel.
The production of dual-phase reinforcing steel, which has similar characteristics in terms of strength and deformation capacity to traditional Tempcore steel (e.g., B500B, B450C), was addressed within the European research project ‘NEW dual-phase steel REinforcing BARs for enhancing capacity and durability of antiseismic moment-resisting frames’ (NEWREBAR). The project was funded by the Research Fund for Coal and Steel (RFCS). The technology for producing DP reinforcing bars is one of the results of this project. In particular, two DP steel grades (i.e., DPD2 and DPF2) were developed and tested [19], and the industrial feasibility of DP rebars using existing plants was also evaluated [20]. It was shown that the existing plants have to be upgraded in order to allow for industrial production of the new steel.
The two grades of DP steel (i.e., DPD2 and DPF2) were produced using the same production process, but they have different chemical compositions of produced coils. Consequently, grade DPD2 has higher strength but a lower deformation capacity in comparison to DPF2. Howeve, details about the production of steels are beyond the scope of this paper because it focuses on the usability of DP steel for the construction of reinforced concrete buildings in seismic prone areas [19,21]. The corrosion resistance of innovative DP reinforcing steels is improved against Tempcore steel [21] as a consequence of their specific microstructure, characterised by the direct embedment of martensite into the ferrite matrix. In the case of Tempcore steel, the martensite is formed on the outer surface of the bars, which increases their hardness, while the remaining ferritic–perlitic core maintains the typical ductility of hot-rolled bars [22].
Besides the corrosion resistance, the stress–strain curve of DP steel is different from that of conventional Tempcore steel. The stress–strain curve of DP steel does not indicate a typical yielding plateau, and it has a different hardening ratio and ultimate stress in comparison to conventional reinforcing steels. As a consequence, the use of DP steel bars in reinforced concrete (RC) structures can alter the maximum strain demand in reinforcing bars. Additionally, the use of DP steel bars affects the ductility of the structural element and the global ductility of the structure, both of which are essential for achieving the life safety requirements of the current codes for earthquake-resistant structure design. As DP steel is a new type of reinforcing steel, it is not yet understood whether the current building codes [13,23] can be used for the earthquake-resistant design and the seismic performance assessment of concrete structures reinforced by DP steel bars. For this purpose, this research was conceived and performed in order to provide an insight into the seismic performance of concrete structures reinforced by DP steel. The research involved the earthquake-resistant design and seismic performance assessment of three multi-storey frame buildings reinforced with B500B and DPD2 bars. The impact of new DP steel on design and seismic performance results is commented on and evaluated.
In the first part of the paper, the mechanical properties of the traditional Tempcore B500B reinforcing steel and dual-phase DPD2 reinforcing steel are presented and compared. Then, the simplified nonlinear models are described, and the cyclic response of a column reinforced by B500B or DPD2 steel bars is validated by the results of the cyclic tests [24,25]. Finally, the findings of the earthquake-resistant design of the frame buildings are presented, and the difference between the seismic performance of frame buildings reinforced with DPD2 and B500B reinforcing bars are discussed.
2. Mechanical Properties of Tempcore Steel and Dual-Phase Steel DPD2
Tempcore steel grade B500B and innovative DP steel grade D2 (i.e., DPD2 steel grade), which was developed within the European research project NEWREBAR [19], are produced using different procedures. Reinforcing steel B500B is produced using the Tempcore process, which is characterised by a quenching phase following the self-tempering phase. This process provides good strength and ductility and moderate production costs. However, several researchers [6,26] have recently observed various durability problems associated with Tempcore steel that reduce both the deformation and energy dissipation capacities of structural elements if exposed to aggressive environmental conditions. However, the resistance of DP reinforcing steel against corrosion is better, due to its specific microstructure, which causes also differences in the stress–strain relationship in comparison to that of the frequently used Tempcore steel (Figure 1). The stress–strain relationship of DP steel corresponds to DPD2 steel grade manufactured within the European research project NEWREBAR [21], whereas the stress–strain curve of Tempcore B500B was obtained from the results of tensile tests performed within a research project that focused on the effects of corrosion on the mechanical behaviour of steel reinforcing bars [27] and a research project sponsored by the Slovenian Research Agency [24]. From Figure 1, it can be observed that the stress–strain relationship of B500B has a yielding plateau, which is typical for heat-treated steel. This phenomenon is not seen in the case of the DPD2 steel grade, which is characterised by a continuous yielding, similar to that presented in the literature for DP steel grades [28]. Therefore, the yield strength of reinforcing steel DPD2 has to be determined based on a permanent offset of 0.2% of the gage length under load.
The mechanical properties of the steel grades presented in Figure 1 are elaborated in Table 1, where fy,k is the characteristic yield strength (i.e., fifth percentile of the measured yield strengths), fy,m is the mean yield strength, fu is the mean value of the maximum tensile strength, Agt is the deformation at maximum strength, A5 is the deformation of rupture of the bar, and k is the hardening ratio. It can be concluded that the DPD2 steel grade has a higher value of ultimate deformation (A5; 26.2% vs. 25.0%) and higher hardening ratio (k; 1.28 vs. 1.19). On the other hand, the B500B steel grade has a higher yield and tensile strength. The characteristic yield strength of B500B is higher than that of DPD2 by a factor of 1.25.
The results of low-cycle fatigue tests [29] also revealed that DPD2 reinforcing steel has almost the same energy dissipation capacity as traditional Tempcore steel if the energy dissipation capacity was measured in terms of the maximum cycle numbers at the designated imposed deformation and the total dissipative energy.
3. Mathematical Modelling of Cyclic Response of Columns Reinforced with B500B and DPD2
3.1. Description of Code-Based Mathematical Modelling of Seismic Response of RC Columns
The code-based mathematical model of an RC column comprises an elastic element with nonlinear flexural hinges at both ends of the column. If the model is used for simulation of the cyclic test of a column, then the nonlinear flexural hinge is used only at the base of the column (see Figure 2a). Such a model is presented in the following and is used to simulate the cyclic response of columns reinforced with both B500B and DPD2 steel bars. All simulations were performed using OpenSees [30]; therefore, some features of the modelling refer to the OpenSees command language.
The linear elastic element was modelled using the ‘elasticBeamColumn’ element available in OpenSees. The element is defined based on the height of column used in experiments and has the characteristics of a concrete cross-section (i.e., elastic modulus of concrete, and area and moments of inertia of cross-section).
The four-linear moment–rotation relationship of the nonlinear flexural hinge, similar to that proposed by Ferreira et al. [31], was defined. The cracking of the concrete cross-section is represented by the first characteristic point (CR) from the moment–rotation relationship, whereas other points are related to the reinforcement yielding (Y), the maximum moment (M) and the near-collapse limit (NC) state (see Figure 2b). Note also that an additional point (see a red dot in Figure 2b) is presented on the moment–rotation relationship. This point was added to improve the presentation of the damage of the structural elements.
The data required for the calculation of the moment–rotation relationship (see Figure 2b) are elastic proprieties of structural elements, the geometry of cross-section of the structural element, longitudinal reinforcement, transverse reinforcement, the material strength, level of normalised axial force and assumed ratio rCM (see below). The cracking MCR, yielding MY, and the maximum MM moments were calculated by performing a moment–curvature analysis of the cross-section, which was divided into many fibres. Each fibre was defined with an appropriate uniaxial material, available in OpenSees. The confined and unconfined concrete were modelled using ‘Popovics Concrete Material’ (or ‘Concrete04 Material’) [32]. In the case of unconfined cover concrete, the parameters of ‘Popovics Concrete Material’ were assessed according to the requirements of Eurocode 2 [13], whereas the concrete compressive strength was obtained from the compressive test performed on cubes taken from the concrete used to cast the column. The parameters of the confined concrete were estimated according to the draft of the new Eurocode 8-3 [33]. In this case, the confined concrete maximum compressive strength fcc and the corresponding strain εc0,c can be determined using the following expressions
where fc is the concrete compressive strength of unconfined concrete, whereas εc0 is the compressive strain in the concrete at maximum strength, which is assumed to be 0.002. The parameter K is calculated with the following equation
where fyw is the mean yield strength of transverse steel, α is the confinement effectiveness factor, and ρsw is the ratio of transverse reinforcement. From Equation (3), it can be seen that the response of the confined concrete does not only depend on the amount of transverse reinforcement but also on the strength of the steel used for reinforcement, as was also found by Wang et al. [34]. For rectangular sections, the ρsw is defined as
where Asw is the area of the transverse reinforcement bars of the cross-section, bw is the width of cross-section, and sw is the spacing of the stirrups measured from the centreline. The confinement effectiveness factor α is defined as follows
where bo and ho are the dimensions of the rectangular of the confined concrete measured to the centreline of the perimeter bar, bi is the i-th centreline spacing between longitudinal bars, laterally restrained by a stirrup corner or hook, and n is the number of longitudinal bars, laterally restrained along the perimeter of the cross-section.
The reinforcing steels B500B and DPD2 were modelled using ‘MultiLinear uniaxialMaterial’ [35], which can take the softening branch after the maximum strength into account. ‘MultiLinear uniaxialMaterial’ is defined by specifying points of the stress–strain (force-displacement) curve.
The cracking moment, MCR, of the moment–rotation relationship of the nonlinear flexural hinge corresponded to the cracking of concrete in the first fibre in tension. The yielding moment MY was reached when the strain in the first reinforcing bar was equal to the yield strain of the steel εsy. The maximum moment MM was determined from the results of the moment–curvature analysis of the cross-section of the column. The moment corresponding to near-collapse limit state MNC was defined at 80% of the maximum moment in the softening branch of the moment–rotation relationship.
The rotation in the nonlinear flexural hinge at the occurrence of concrete cracking (MCR) was determined by assuming a linear curvature along the distance LV
where EI is the product of elastic modulus of concrete and moment of inertia of the cross-section, and LV = M/V is the length from the plastic hinge to the point of zero moment, which, in this case, is equal to the height of the column. The yield rotation θY was calculated following the draft of the new Eurocode 8-3 [33]
where h is the depth of the rectangular column in the direction of loading, fy is the yield strength of the steel, fc is the compressive strength of concrete, dbl is the (mean) diameter of the tension reinforcement, aVz is the tension shift of the bending moment diagram, which was calculated according to Eurocode 2 [13] 9.2.1.3(2), and φy is the yield curvature of a cross-section, which was obtained by performing moment–curvature analyses in OpenSees.
The rotation at the near-collapse limit state was also estimated in accordance with the draft of the new Eurocode 8-3 [33]
where φu is the ultimate curvature of a cross-section and was obtained by performing moment–curvature analyses in OpenSees. The Lpl is the length of the plastic hinge, whereas Δθu,slip is the post-yield fixed-end rotation due to yield penetration in the anchorage zone beyond the yielding end of the element, and should be taken as
where db is the bar diameter. The ultimate curvature of the cross-section was also calculated with consideration of the draft of the new Eurocode 8-3, which prescribes that the ultimate curvature φu in a critical zone can occur before (condition a) or after (condition b) spalling of the concrete cover. Both ultimate curvature models foresee attainment of the ultimate curvature when the tension strain in the bar equals the ultimate tension strain (εsu) or the compressive strain in the concrete equals the ultimate compressive strain of unconfined (εcu) or confined (εcu,c) concrete. However, the criteria for the ultimate tension strain of the steel and ultimate compressive strain of the concrete differ for conditions (a) and (b). The ultimate strains in steel and concrete for condition (a) are as follows:
- For the steel bar in tension
- For the (unconfined) concrete
- For the steel bar in tension
- For the confined concrete core inside the steel ties
According to Eurocode 8-3, condition (b) applies when the calculated flexural resistance of the confined concrete section exceeds 80% of the resistance of the full unspalled concrete section at the instant when the strain, either in steel or in the concrete, becomes equal to the ultimate strain. In all other cases, the ultimate curvature of the section is defined by condition (a).
The length of the plastic hinge has an important influence on the near-collapse limit-state rotation. According to the draft of the new Eurocode 8-3, it is determined as follows
where bw is the width of the section parallel to the shear force, and ν = N/Acfc is the normalised axial force, where Ac is the cross-sectional area, and the axial force N is considered positive for compression.
Based on the definitions from the Eurocode and the adopted four-linear moment-rotation relationship (see Figure 2b), it is possible to calculate the rotation at maximum moment θM using rules of similar triangles (i.e., the ratio between the “distances” MM-MC and θM-θC is equal to the ratio between the “distances” MNC-MC and θNC-θC (see Figure 2b))
where rotation at the near-collapse limit state θNC is estimated according to Equation (8), the moments at the characteristic points C and M are calculated as discussed above, and rCM is the ratio between the rotation at zero moment θC and the rotation at maximum moment θM. Note that, in the derivation, it was also taken into account that the moment corresponding to near-collapse limit state MNC was defined at 80% of the maximum moment in the softening branch of the moment–rotation relationship. As the four-linear moment–rotation relationship of the plastic hinge of the column is simplistic, the rotation at zero moment θC is not realistic. Thus, it makes sense to define the rCM based on experimental results in order to calibrate the moment–rotation relationship at least to the near-collapse limit state. The rCM is not prescribed by the codes (e.g., [36]). However, in the example of the simulation of the seismic response of the four-storey reinforced-concrete frame building [37], it was shown that the match between the results of numerical simulation and the experimental test was quite good if rCM = 3.5 was used for both columns and beams.
The moments at characteristic points of the four-linear moment–rotation relationship of the plastic hinge of the column have a rigorous physics background, whereas the formulas for corresponding rotations are based on empirical regression models. Therefore, it is expected that the characteristic rotations obtained from the particular experiment may differ from the values for the yield or near-collapse rotation from the empirically based regression models (Equations (7) and (8)). In this study, it was observed that the yield rotation, estimated according to Equation (7), was notably different from the yield rotation from the cyclic test of examined specimens. To calibrate the mathematical model with the results of the particular cyclic tests of the columns reinforced by B500B and DPD2 steel bars, the yield rotation according to Equation (7) was multiplied by a factor γ, as discussed in Section 3.2 and Section 3.3.
The described mathematical model of the plastic hinge of the RC column was realised in OpenSees by two zero-length elements, connected in parallel. The three-linear moment-rotation relationship (i.e., uniaxial material ‘Hysteretic’) was assigned to each zero-length element, aiming to at simulate flexural behaviour, whereas the axial, shear and torsional characteristics were defined using ‘Elastic uniaxialMaterial’. The characteristics of each three-linear moment–rotation relationship were defined in such a manner that the moment–rotation relationship of the coupled zero-length elements was equal to the four-linear moment–rotation relationship described above. The rules for determining the parameters of each of the two zero-length elements with the three-linear moment–rotation relationship are schematically presented in Figure 3. Note that the rotations θCR and θY define the rotation at the first characteristic point (CP1) of the three-linear backbone 1 and 2, respectively. The rotations of the second (CP2) and third (CP3) characteristic points are equal to θM and θC and are the same for both backbones. The moment corresponding to the third characteristic point (CP3) is equal to zero for both backbones. In contrast, the moments of the first two points (CP1 and CP2) of backbones are assessed based on the assumption that the increase in the moment of the moment–rotation relationship between rotations corresponding to θY and θM is the same for both backbones.
For the reader who is not familiar with OpenSees, it may be interesting to describe the uniaxial material ‘Hysteretic’. The moment–rotation envelope of this material is defined by three characteristic points in a positive direction and three characteristic points in a negative direction. The cyclic behaviour is then controlled by two parameters defining pinching, the energy-dependant damage parameter, the ductility-dependant damage parameter and the ductility-dependant parameter β, which affects the unloading stiffness. As the ductilities of ‘Hysteretic uniaxialMaterial’ materials at a certain rotation are not the same, the ductility-dependant damage parameter and β have to be appropriately calibrated in order to achieve a similar hysteretic response of ‘Hysteretic uniaxialMaterial’ materials. For reinforced concrete elements, the values of parameter β are typically set to approximately 0.75 for a three-linear backbone with smaller initial stiffens (i.e., backbone 2) and 0.69 for another three-linear backbone (i.e., backbone 1). Note also that the damage and pinching parameters are usually set to zero in the simulation of a complex multi-degree-of-freedom structure, because non-zero values can produce convergence problems.
3.2. Numerical Simulation of Cyclic Test of Column Reinforced with B500B
The proposed model was used to simulate the cyclic response of a column reinforced with reinforcing steel B500B and tested within a research project sponsored by the Slovenian Research Agency [24]. The specimen height was 1.70 m with a cross-section b/h = 30/30 cm. The square column was reinforced with 8 bars of diameter ϕ 16 mm in the longitudinal direction and ϕ8 mm/7.5 cm n = 2 + in the transverse direction (see Figure 4). The mean compressive strength of concrete was obtained from the experimental test on the cylinder, and it was equal to 41.2 MPa, whereas for the reinforcing steel, the nominal strength of the B500B was assumed. The column was loaded with an axial force that corresponded to the normalised axial force 0.15. The distance between the column base and the centre of the horizontal hydraulic jack, which was used to impose the displacements to the column, was 1.50 m.
The simulation of the response of the column was performed by imposing on the model the displacements that were used during the cyclic test. The model of the column was developed according to the rules defined in Section 3.1. The elastic part of the model was based on the concrete cross-section dimensions and the elastic modulus of concrete (Ec = 36,000 MPa, see Table 2). The moment–rotation relationship was assessed using the characteristics of the reinforced concrete cross-section at the base of the column. For the reinforcing steel, the stress–strain curve for B500B, presented in Figure 1, was used. The material properties of confined and unconfined concrete are presented in Table 2. Note that the axial force (N) was not applied to the columns, but its effect was taken into account in the calculation of the moment–rotation relationship (see Section 3.1).
The characteristic points of the moment–rotation relationship were calculated as defined in Section 3.1 by assuming rCM = 3.5. The parameter β was considered, as defined in Section 3.1 (i.e., 0.75 and 0.69 for, respectively, uniaxial material Hysteretic corresponding to zero-length element with smaller and higher initial stiffness (see zero-length element 2 in Figure 3)). The pinching and damage parameters were set as 0.
The model for the moment–rotation envelope of the column was further calibrated to improve the match between the simulated and measured cyclic response of the column. For this purpose, only the yielding rotation from Equation (7) was multiplied by the correction factor γ = 0.60, and the rCM was set to 7. The parameter β and the damage parameter (damage1) of the column were also estimated based on the experimental results. For the zero-length element with smaller initial stiffness, the parameter β was set to 0.75, and damage1 was taken to equal 0.009, whereas, for another zero-length element (Figure 3), the corresponding values were considered to equal 0.55 and 0.001.
The cyclic test results and the corresponding simulations using the basic and the calibrated model are presented in Figure 5. From Figure 5a, it can be observed that the basic model overestimates the yield rotation and rotation at the maximum moment. In addition, it underestimates the amount of dissipated hysteretic energy. The results of the simulation with the calibrated model are significantly improved. Note also that the near-collapse rotation of the plastic hinge, calculated according to Equation (8), is sufficiently accurate for both models.
3.3. Numerical Simulation of Cyclic Test of Column Reinforced with DPD2
The proposed model was also used to simulate the cyclic response of the column, which was tested within the NEWREBAR research project [25]. The column height was 1.75 m, with a cross-section b/h = 35/35 cm. In this case, the column was reinforced with DPD2 steel bars. Eight bars of diameter ϕ16 mm were placed in the longitudinal direction and ϕ 10/7.5 cm n = 2 + in the transverse direction (see Figure 6). The mean compressive strength of concrete, which was obtained from the experimental test on the cylinder, was relatively low, and amounted to 21.1 MPa. The axial force corresponded to the normalised axial force 0.30. The distance between the column base and the centre of the horizontal hydraulic jack was 1.53 m.
The response of the column was simulated by imposing the displacements that were measured during the cyclic test. The basic model was developed according to the rules defined in Section 3.1. The elastic part of the numerical model was modelled based on the dimensions of the concrete cross-section and the elastic modulus of concrete (Ec = 30,000 MPa, see Table 3). The moment–rotation relationship was assessed using the characteristics of the reinforced concrete cross-section and the results of moment–curvature analysis. For such an analysis, the confined and unconfined concrete, the mechanical properties of which are shown in Table 3, were used to define the properties of the uniaxial material ‘Concrete04’. The stress–strain relationship of the DPD2 reinforcing steel, which is presented in Figure 1, was used to determine the properties of the uniaxial material ‘MultiLinear’.
The basic model was defined as described in Section 3.1. The values of rCM, β, the pinching and damage parameters, were assumed to be equal to those used in the case of the basic model of a column reinforced with B500B. The basic model was then calibrated to improve the simulation of the envelope of the force–displacement relationship. In this case, the yielding rotation based on Equation (7) was multiplied with the correction factor γ = 0.75. The ratio between the rotation at zero moment θC and the rotation at maximum moment θM (rCM) was set to 7, which is equal to the value used in the case-calibrated model of the B500B column. The ductility-dependant parameters β and damage1 of the zero-length element with smaller initial stiffness were assumed to be equal to 0.60 and 0.011, respectively. For another zero-length element (Figure 3), the corresponding values were considered equal to 0.64 and 0.0005, respectively.
The results of the simulations of the cyclic test of the column using the basic and the calibrated model are presented in Figure 7. The conclusions are similar to those given for column reinforced with B500B. In this case, the basic model also overestimates the yield rotation and rotation at the maximum moment. The amount of dissipated hysteretic energy is also significantly underestimated. From the results of the cyclic test, it can also be observed that the strength was different in the positive and negative direction. This phenomenon, which cannot be modelled by simplified nonlinear models, is partly a consequence of the issues during the cyclic test, as explained in [25]. The results of the numerical simulation match particularly well with the experimental results for a positive direction of displacement, even in the near-collapse range. This match indicates that the near-collapse rotation, calculated according to Equation (8), is sufficiently accurate, at least for this particular column, reinforced with DPD2 steel bars. However, in another direction, the strength and the near-collapse rotation capacity seem to be slightly overestimated by the numerical simulation.
4. Design and Seismic Performance Assessment of DPD2 and B500B Buildings
The parametric study was conceived and performed, aiming to investigate the usability of the current earthquake-resistant design procedures for concrete frames reinforced by DPD2 steel. Three multi-storey RC frame buildings were designed according to Eurocode 8-1 and assessed using pushover and response history analyses. The seismic design parameters and the investigated buildings are first introduced. This is followed by a description of the mathematical model of the RC frame building, which is based on the model of the calibrated columns. The results of the seismic performance of DPD2 RC frame buildings are presented in Section 4.3, along with the results obtained for B500B buildings. For these cases, B500B and DPD2 steel were taken into account in the design and the seismic performance assessment. The second variant of DPD2 buildings was also defined to investigate the impact of the lower strength of DPD2 steel. In this case, the reinforcement in the B500B building was replaced by the same amount of DPD2 reinforcement. These buildings are termed DPD2 buildings, designed as B500B.
4.1. Description of Analysed Buildings
The 4-, 8- and 11-storey reinforced-concrete frame buildings (Figure 8) were designed and analysed. The building structures were designed for the gravity and seismic load combinations prescribed by Eurocode 0 [29]. The design peak ground accelerations amounted to 1.2∙0.30 g = 0.36 g (soil type B), 1.15∙0.25 g = 0.29 g (soil type C) and 1.2∙0.25 g = 0.30 g (soil type B), respectively, for the 4-, 8- and 11-storey buildings. The behaviour factor was assumed to equal 3.9, which is defined in Eurocode 8 for multi-storey multi-bay frames designed for ductility class medium (DCM). Concrete C30/37 was prescribed in the design of the 4- and 8-storey buildings, whereas C35/45 was selected in the case of the 11-storey building. Selected properties of the structures and their design parameters are presented in Table 4. The largest design base shear–weight ratio was observed for the 4-storey building (15.5%), whereas the smallest Fb/W ratio was observed for the 11-storey building (5.2%).
The average longitudinal reinforcing ratios of columns and beams in the critical zone (zone of the plastic hinge) of each storey are shown in Figure 9. As the design yield strength of the DPD2 reinforcing steel (fyd,DPD2 = 348 MPa) is lower than that of the B500B reinforcing steel (fyd,B500B = 435 MPa), the required amount of DPD2 reinforcement is significantly increased for most of the structural elements. The highest longitudinal reinforcing ratios of the columns can be observed for 4-storey buildings, followed by the 8- and 11- storey buildings. The longitudinal reinforcing ratios of the columns of the 4-storey building varied between 1.5% and 2.0%, and were equal to approximately 1% in the case of the 11-storey building. In the critical zones of the columns of the 4-storey building, the amount of longitudinal reinforcement of DPD2 building is, on average, higher by a factor of 1.24 than the amount of longitudinal reinforcement of the B500B building. This result is practically equal to the ratio between the design yield strengths of the two types of steel (i.e., fyd,B500B/fyd,DPD2 = 435 MPa/348 MPa = 1.25). For an 8-storey building, the factor is slightly smaller and amounts to 1.20. On the other hand, the longitudinal reinforcement of the columns of the 11-storey DPD2 and B500B building are practically the same, which is a consequence of the fact that the reinforcement in the columns of both variants of buildings is governed by the minimum requirements of Eurocode 8 [23] (i.e., the amount of longitudinal reinforcement should be higher than 1% of the area of the concrete cross-section).
The highest longitudinal reinforcing ratios of beams can be observed for the 11-storey building, followed by the 4- and 8- storey buildings. By comparing the amount of longitudinal reinforcement of the beams, it can be concluded that, for the 4-storey DPD2 building, the top and bottom longitudinal reinforcement of the beams are, on average, higher, respectively, by a factor of 1.21 and 1.14, compared to the reinforcement in the B500B building. In the case of 8- and 11-storey buildings, these factors are slightly increased, and amount to between 1.23 and 1.28.
4.2. Description of Mathematical Model for Nonlinear Seismic Analysis of RC Frame Building
Simplified nonlinear three-dimensional frame models with concentrated plasticity were developed for nonlinear static and dynamic analyses of RC frame buildings (Figure 10). The model of the building structure includes the calibrated model of the column (Section 3). Other modelling features are consistent with Eurocode 8 [23,36] requirements. Thus, the beam and column flexural behaviour were based on one-component lumped plasticity elements, comprising an elastic element and two inelastic rotational hinges (defined by a moment–rotation relationship) on each side of the elastic element. The element formulation assumed an inflexion point at the midpoint of the element. For beams, the plastic hinge was used for major axis bending only. For columns, two independent plastic hinges for bending about the two principal axes were taken into account. The floor diaphragms were assumed to be rigid in their own planes, and the masses and moments of inertia of each floor were lumped at the corresponding centre of gravity. Beams were modelled using an effective beam width defined according to Eurocode 2 [13]. The moment–rotation relationship was modelled by a four-linear relationship (see Figure 2b in Section 3.1).
The moment–rotation envelope of plastic hinges was calculated based on the procedure used in the case of the calibrated models of the columns, as presented in Section 3. However, for elements reinforced with traditional Tempcore steel, it may be interesting to use a different procedure (e.g., [38]) for the definition of the moment–rotation relationship. Nevertheless, the moment–curvature analysis was performed for each beam and column by taking the geometry of the section, confined and unconfined concrete and longitudinal reinforcement into account. However, the moment–rotation relationship of the plastic hinge of columns was calculated based on rectangular cross-sections and actual reinforcement, whereas the properties of plastic hinges in beams were calculated based on a T-shaped beam cross-section and three layers of longitudinal reinforcement (i.e., the reinforcement layer at the top and bottom reinforcement of the T cross-section, and reinforcement layer at the bottom level of the flange). Zero axial force and the axial load due to gravity loads were taken into account when determining the moment–rotation relationship for beams and columns, respectively. The distance from the element end to the point of zero moment LV was assumed to be to a half-length of the element. For determination of the ratio rCM, a model which is dependent on the axial force was proposed. The model was developed based on the results of the calibration of the numerical simulation of cyclic response of the columns (see Section 3.2 and Section 3.3) and the results of the various experimental tests (e.g., [39]). For the cross-sections with a normalised axial force higher than 0.15, the rCM was assumed to equal 7 (Section 3), but for normalised axial forces between 0 and 0.15, a linear function with a value rCM between 2.5 and 7 was taken into account. Note that the rCM was introduced based on the results of the simulation of cyclic response of the columns (see Section 3.2) and the results of the various experimental tests (e.g., [39]). The parameter β, which controls unloading stiffness, was defined as in the case of calibrated models of the columns (Section 3), whereas the damage1 parameter was set to 0 to avoid convergence issues. However, in the process of calibration of the models of columns, it was found that the final results were not significantly affected by adopting a damage1 close to 0.
The moment–rotation relationships in the plastic hinges of beams and columns were calculated using the mean values of material characteristics, as prescribed in Eurocode 8-3 [36]. Therefore, the mean concrete compressive strength was assumed to be 8 MPa higher than the characteristic value of compressive cylinder strength (i.e., 38 MPa and 43 MPa for C30/37 and C35/45, respectively) [13], whereas the stress–strain relationships for the B500B and DPD2 were the same as those presented in Figure 1.
Gravity load was represented by the uniformly distributed load on the beams and/or by concentrated loads at the top of the columns. A total of 5% critical damping was considered proportional to the mass. Models of all building variants were generated by the modified version of the PBEE toolbox [37], whereas the analyses were performed with OpenSees [30]. The PBEE toolbox is a simple yet effective tool for the seismic performance assessment of reinforced concrete frames, using simplified nonlinear models. This includes different functions for calculation of the moment–rotation relationship of the plastic hinges in the columns and beams, functions for the generation of the Tcl input code for OpenSees, functions for the post-processing of the analysis results and functions for structural performance assessment.
The lumped plasticity models are simplistic. Therefore, some phenomena observed in reinforced concrete structures (e.g., buckling of rebar bars in compression, bond-slip [40]) cannot be directly simulated. These phenomena are taken into account only indirectly through the empirical-based regression equations for the estimation of the limit-state deformation capacity, which is usual practice in the assessment. The model does not account for simultaneous nonlinear effects due to biaxial bending. The nonlinear element’s flexural behaviour is modelled independently in two perpendicular directions. Furthermore, the moment–rotation relationship of plastic hinges is based on the constant value of the axial force during the analysis. The potential shear failure is also not simulated by the model used in this study because the shear failure is not critical [41] for code-compliant (i.e., [23]) structures that are not subjected to aggressive environmental conditions. However, although the lumped plasticity models are simplistic, it was found several times that they can produce sufficiently good results (e.g., [37,42]). As they are not computationally demanding, they are attractive for use in the simulation of the seismic response of entire structures. The fibre elements model is a possible alternative to the seismic analysis of building structures [40,43]. Such models provide more information on the local level, can simulate biaxial bending and can consider the axial-flexure load. However, it may be too complex for multi-storey structures in terms of computational cost, especially in the case of an iterative earthquake-resistant design based on nonlinear models [44]. The detailed finite element models could be an alternative, but they are not yet used for the calculation of the global seismic response of a structure because they are not computationally robust and are extremely computationally demanding (e.g., [45]).
4.3. Pushover Analyses
The capacity of the buildings was investigated using pushover analyses, which were performed by utilising the modal pattern of lateral forces. The resulting pushover curves are presented in Figure 11. The pushover curves are provided for the X direction only because the pushover curves for the Y direction are similar. Thus, the presentation of more results does not affect the conclusion of the study. The maximum strength of DPD2 buildings is higher than that of the B500B buildings, and it is observed at a higher roof displacement. The DPD2 buildings become more flexible at the initiation of the nonlinear behaviour, which begins with the cracking of concrete. After the yielding of columns at the base, the pushover curves of B500B buildings are practically horizontal, whereas hardening is more pronounced in the case of DPD2 buildings. All these differences in the pushover curves of DPD2 and B500B buildings are primarily the consequences of variations in the stress–strain relationship of the two types of steel. DPD2 steel bars are more deformable than the B500B bars, but they are not characterised by the yielding plateau, which is typical of the conventional reinforcing steel (i.e., for Tempcore steel B500B). However, to achieve the appropriate strength of DPD2 buildings, the quantity of steel had to be increased in the design. If the amount of steel in DPD2 buildings was equal to that designed for B500B buildings, then the strength would be significantly lower (see the pushover curve of DPD2 buildings designed as B500B buildings in Figure 11).
The maximum base shear (Fmax) and the roof displacement at the near-collapse (NC) limit state (dNC) are listed in Table 5 and serve as a precise analysis of the described observations. The maximum strength of DPD2 buildings is from 6 to 10% higher than that of B500B buildings. On the other hand, the maximum strength of B500B buildings is from 9 to 14% higher than that observed for DPD2 buildings designed as B500B buildings.
The near-collapse roof displacements dNC were estimated by assuming that the near-collapse limit state at the structural level is attained when the near-collapse is observed in the first column. From Table 5, it is clear that the dNC increases with the number of stories (Table 5). However, the trend regarding the difference in the dNC of DPD2 and B500B buildings is not clear. A significantly and slightly higher dNC can be observed, respectively, for 4- (45.7 cm) and 8-storey (65.0 cm) DPD2 buildings, whereas in the case of the 11-storey building, the dNC was observed to be slightly higher for the B500B building. Note that the latter observation is not the consequence of the mechanical characteristics (i.e., stress-strain curve) of the DPD2 bars. The increase in the deformation capacity of the 11-storey B500B building was triggered by the higher column-to-beam strength ratio value, which was observed because the required quantity of longitudinal reinforcement in the columns of the B500B building was less than that of the DPD2 building. However, in both cases, the required quantity of longitudinal reinforcement was less than 1%, which is the minimum requirement according to Eurocode 8.
The only noticeable trend in deformation capacity is that the deformation capacity of the DPD2—designed as B500B buildings is always approximately 4% higher than that of B500B buildings. However, DPD2 buildings designed as B500B buildings are only addressed here for comparative reasons.
By analysing the capacity of the DPD2 buildings, it can be concluded that Eurocode standards can be used for the design of DPD2 buildings. In most cases, the lateral strength and deformation capacity were increased in comparison to those observed in buildings reinforced with B500B bars. As the design procedure of DPD2 buildings and B500B buildings were the same, the increase in the lateral strength of DPD2 structures can be attributed to the substantial hardening of DPD2 steel after yielding, which increases the overstrength factor of the DPD2 buildings by about 10%. However, special attention should be paid when the minimum requirements of the standard dictate the column reinforcements. In these cases, the new, stricter minimum requirement should be defined if the same capacity as the buildings designed with conventional B500B reinforcing steel is required.
4.4. Results of Seismic Performance Assessment
The observations from the pushover analyses were verified by means of nonlinear response history analyses. For this purpose, incremental dynamic analysis (IDA) [46] was performed, aiming to estimate the spectral acceleration causing the near-collapse limit state, which was attained when a near-collapse rotation was observed in the first column, as defined in the previous section.
The spectral acceleration at the first vibration period was adopted for the intensity measure. The ground motions for IDA were selected based on a conditional spectrum approach [47], using a SHARE seismic hazard model [48]. The mean magnitude and mean distance were obtained from seismic hazard disaggregation for Ljubljana and for spectral acceleration, which corresponded to a return period of 2475 years (Se,2475) and the first vibration period of the structure. Consequently, the selected sets of ground motion are building-specific. For each building, 30 ground motions (see Figure 12) were selected from the combined NGA [49] and RESORCE [50] strong ground motion databases, which contain 9188 ground motions. All of 30 ground motions correspond to events with magnitudes between 4.5 and 7, and source-to-site distances between 5 and 50 km. For the analysis of the 4- and 11- storey buildings, the ground motions were recorded on soil with a shear-wave velocity vs,30 between 360 and 800 m/s, whereas, in the case of an 8-storey building, the vs,30 was between 180–360 m/s.
The resulting median spectral accelerations causing the near-collapse limit state Se,NC are presented in Table 5, whereas the median IDA curves are shown in Figure 13. The median IDA curves of DPD2 and B500B buildings are highly similar. Slight differences can be observed in a range close to dynamic instability. The median spectral acceleration causing the near-collapse limit state Se,NC of the 4-storey DPD2 building was observed to be higher than that of the DPD2 building, whereas the opposite can be observed for the 11-storey building. This trend was expected because, in the case of frame buildings, the deformation capacity controls the ground motion intensity, causing the near-collapse limit state. Therefore, the IDA curves of 8-storey DPD2 and B500B buildings are practically equal, because this was also the case for the near-collapse roof displacement of buildings observed in the pushover analysis. It is interesting to note that the seismic performance, in terms of the median IDA curves of DPD2 designed as B500B buildings, is not significantly reduced, although the maximum strength of these buildings is significantly smaller than for the other buildings. Namely, the seismic performance of the medium-to-long period building is controlled by the deformation capacity, which was quite similar for variants of the investigated buildings (Figure 11).
To determine whether the life safety objective was fulfilled, the Se,NC were compared to the risk-targeted spectral acceleration causing the NC of structure Se,NC,a, which was calculated according to [51], and represents the target median value of spectral acceleration causing the NC limit state. To calculate Se,NC,a the target (acceptable) annual probability of collapse PC,a was set to 10−4 (0.5%/50 years). This is a rather high value, but it is close to the values adopted in some other codes [52]. The seismic hazard curves for spectral acceleration at the first vibration period of the building, which are also required to calculate Se,NC,a, were obtained utilising the SHARE seismic hazard model [48]. The dispersion of the spectral acceleration causing the collapse βSe,C was assumed to be 0.40 [53], and the limit-state reduction factor γls, which transforms Se,C to Se,NC, was assumed to equal 1.15 [53]. Based on these definitions and assumptions, the target values of Se,NC,a amounted to 0.95 g, 0.80 g and 0.35 g, respectively, for 4-, 8- and 11-storey buildings (see grey dashed lines in Figure 13). From Figure 13, it can be observed that the actual median values of spectral acceleration which caused the NC limit state are significantly higher than Se,NC,a. Therefore, it can be claimed that all buildings are overdesigned if the life safety objective is defined by a high value of the annual probability of collapse, PC,a = 10−4.
The results of the analyses showed that the seismic performance of DPD2 buildings designed by Eurocode 8 are improved in comparison to the seismic performance of B500B buildings. The advantage of DPD2 building is in their higher resistance to corrosion [21]. However, the amount of reinforcement is increased.
5. Conclusions
The seismic performance of frame buildings designed by Eurocode 8 and reinforced by recently developed dual-phase reinforcing steel DPD2 and by conventional Tempcore-reinforcing steel B500B was investigated. The seismic performance of buildings was assessed using the improved numerical model of columns with concentrated plasticity. The developed model of columns, which account for four linear moment–rotation relationships, was validated by the results of the cyclic test. The conclusions are as follows:
- Only the yield rotation of Eurocode empirical regression models had to be calibrated to adequately simulate the moment–rotation relationship from the cyclic tests of particular columns. However, it is suggested that the modelling uncertainty is investigated further at the level of DPD2 buildings, for example, by performing a pseudo-dynamic test using the full-scale building;
- For the majority of DPD2 buildings, the maximum lateral strength (6–10%), deformation capacity (up to 15%) and seismic intensity causing a near-collapse limit state (up to 13%) were observed to be improved in comparison to B500B buildings;
- Because the seismic performance of DPD2 buildings is better than that of B500B buildings if they are designed by Eurocode 8, it can be concluded that the DPD2 reinforcing steel can be used for the construction of DPD2 buildings designed by Eurocode 8;
- The reinforcement quantity of DPD2 buildings is increased in the design primarily because of the smaller yield strength of DPD2 steel. However, this is not a prevailing source of the improved lateral strength of DPD2 buildings;
- The improved performance of the DPD2 building in terms of strength is attributed to substantial strain hardening of the DPD2 steel after the yielding point, which is not the case for the Tempcore steel with a typical yielding plateau;
- DPD2 reinforcing steel improves seismic resistance and resistance against corrosion, but also increases the amount of reinforcement required. However, some modifications to the existing design rules may also be introduced in the future, aiming to decrease the required amount of reinforcement and to modify the minimum required amount of reinforcement.
Author Contributions
Conceptualization, J.Ž. and M.D.; methodology, J.Ž.; software, J.Ž. and M.D.; formal analysis, J.Ž.; investigation, J.Ž.; writing—original draft preparation, J.Ž. and M.D.; writing—review and editing, J.Ž. and M.D.; supervision, M.D.; project administration, J.Ž. and M.D.; funding acquisition, M.D. Both authors have read and agreed to the published version of the manuscript.
Funding
This research was funded by Research Fund for Coal and Steel, grant number RFSR-CT-2015-00023 and by the research program Earthquake Engineering (P2-0185), funded by the Slovenian Research Agency”. The APC was funded by the research program Earthquake Engineering, funded by the Slovenian Research Agency.
Institutional Review Board Statement
Not applicable.
Informed Consent Statement
Not applicable.
Data Availability Statement
Not applicable.
Conflicts of Interest
The authors declare no conflict of interest.
Nomenclature
| B500B | Tempcore reinforcing steel with B500B characteristics |
| DPD2 | Dual phase reinforcing steel type D2 |
| DPF2 | Dual phase reinforcing steel type F2 |
| DPD2 | Dual phase reinforcing steel type D2 |
| CP1-CP3 | three characteristic points of three-linear backbone |
| CR | characteristic point of the moment-rotation relationship associated with cracking of cross-section |
| M | characteristic point of the moment-rotation relationship associated with a maximum moment of cross-section |
| NC | near collapse limit state/characteristic point of the moment-rotation relationship associated with the near-collapse limit state of an element |
| RC | reinforced concrete |
| Y | characteristic point of the moment-rotation relationship associated with yielding of cross-section |
| Ac | cross-sectional area |
| Agt | deformation at a maximum strength of reinforcing steel |
| Asw | area of the transverse reinforcement bars of cross-section |
| A5 | deformation of rupture of the bar |
| Ec | elastic modulus of concrete |
| EI | product of elastic modulus of concrete and moment of inertia of the cross-section |
| Fb | design base shear |
| Fmax | maximum base shear |
| K | confinement factor |
| Lpl | length of the plastic hinge |
| LV | length between the plastic hinge and the point of zero moment |
| MCR | moment at cracking of cross-section |
| MM | maximum moment of cross-section |
| MNC | moment corresponding to near-collapse limit state, which was defined at 80% of MM |
| MY | moment at yielding od cross-section |
| N | axial force, which is considered to be positive for compression |
| Nb,compr | number of bars near the extreme compression fibres |
| PC,a | target (acceptable) annual probability of collapse |
| Se,D(T1) | spectral acceleration corresponding to first vibration mode from the elastic spectrum |
| Se,C | median spectral accelerations at the first vibration period causing the collapse of the structure |
| Se,NC | median spectral accelerations at first vibration period causing a near-collapse limit state |
| Se,NC,a | risk-targeted spectral acceleration causing NC of structure |
| Se,2475 | spectral acceleration for a return period of 2475 years |
| T1 | first fundamental period |
| W | weight of the structure |
| agD,R | design peak ground acceleration |
| aVz | tension shift of the bending moment diagram |
| db | bar diameter |
| dbl | (mean) diameter of the tension reinforcement |
| bi | i-th centreline spacing between longitudinal bars laterally restrained by a stirrup corner or hook |
| bw | width of the cross-section |
| bo | width of the rectangular of the confined concrete measured to the centreline of the perimeter bar |
| dNC | roof displacement at near-collapse limit state |
| fc | concrete compressive strength of (unconfined) concrete |
| fcc | confined concrete maximum compressive strength |
| fct | axial tensile strength of concrete |
| fu | mean value of the maximum tensile strength of reinforcing steel |
| fyd,DPD2 | design yield strength of the DPD2 reinforcing steel |
| fyd,B500B | design yield strength of the B500B reinforcing steel |
| fy,k | characteristic yield strength of reinforcing steel |
| fy,m | mean yield strength |
| fy | yield strength of the steel |
| fyw | mean yield strength of transverse steel |
| h | depth of the rectangular cross-section/the depth of the unspalled section |
| ho | depth of the rectangular of the confined concrete measured to the centreline of the perimeter bar |
| k | hardening ratio of reinforcing steel |
| n | number of longitudinal bars laterally restrained along the perimeter of the cross-section |
| rCM | ratio between θC and θM |
| sw | spacing of the stirrups measured from the centreline. |
| vs,30 | shear-wave velocity at last 30 m |
| Δθu,slip | post-yield fixed-end rotation due to yield penetration |
| θC | rotation at zero moment |
| θM | rotation at maximum moment |
| θNC | rotation at near-collapse limit state |
| θY | yield rotation |
| ϕ | diameter of bar |
| α | confinement effectiveness factor |
| βSe,C | dispersion of the spectral acceleration causing collapse |
| γls | limit-state reduction factor |
| εcu | ultimate compressive strain of unconfined concrete. |
| εcu,c | ultimate compressive strain of confined concrete |
| εc0 | compressive strain in the concrete at maximum strength |
| εc0,c | strain at the confined concrete maximum compressive strength |
| εsu | ultimate tension strain of bar |
| εsu,nom | uniform elongation at tensile strength in a standard steel coupon test |
| εsy | yield strain of the steel |
| εt | tensile strain at fct |
| ν | normalised axial force |
| ρsv | volumetric ratio of transverse reinforcement defined as the volume of confining hoops over the volume of a concrete core |
| ρsw | ratio of transverse reinforcement |
| φy | yield curvature of a cross-section |
| φu | ultimate curvature of a cross-section |
References
- Berto, L.; Caprili, S.; Saetta, A.; Salvatore, W.; Talledo, D. Corrosion effects on the seismic response of existing rc frames designed according to different building codes. Eng. Struct. 2020, 216, 110397. [Google Scholar] [CrossRef]
- Val, D.V.; Stewart, M.G. Reliability Assessment of ageing reinforced concrete structures–Current situation and future challenges. Struct. Eng. Int. 2009, 19, 211–219. [Google Scholar] [CrossRef]
- Anoop, M.B.; Rao, K.B. Seismic damage estimation of reinforced concrete framed structures affected by chloride-induced corrosion. Earthq. Struct. 2015, 9, 851–873. [Google Scholar] [CrossRef]
- Yuksel, I.; Coskan, S. Earthquake response of reinforced concrete frame structures subjected to rebar corrosion. Earthq. Struct. 2013, 5, 321–341. [Google Scholar] [CrossRef]
- Apostolopoulos, C.A. Mechanical behavior of corroded reinforcing steel bars S500s tempcore under low cycle fatigue. Constr. Build. Mater. 2007, 21, 1447–1456. [Google Scholar] [CrossRef]
- Caprili, S.; Salvatore, W. Cyclic behaviour of uncorroded and corroded steel reinforcing bars. Constr. Build. Mater. 2015, 76, 168–186. [Google Scholar] [CrossRef]
- Meda, A.; Mostosi, S.; Rinaldi, Z.; Riva, P. Experimental evaluation of the corrosion influence on the cyclic behaviour of RC columns. Eng. Struct. 2014, 76, 112–123. [Google Scholar] [CrossRef]
- Celarec, D.; Vamvatsikos, D.; Dolšek, M. Simplified estimation of seismic risk for reinforced concrete buildings with consideration of corrosion over time. Bull. Earthq. Eng. 2011, 9, 1137–1155. [Google Scholar] [CrossRef]
- Xiong, C.; Deng, X.; Liang, Y.; Li, Q.; Huang, J.; Lin, X.; Li, D. Regional seismic damage simulation of corroded RC frame structures: A case study of Shenzhen City. Appl. Sci. 2020, 10, 4818. [Google Scholar] [CrossRef]
- Lavorato, D.; Fiorentino, G.; Pelle, A.; Rasulo, A.; Bergami, A.V.; Briseghella, B.; Nuti, C. A corrosion model for the interpretation of cyclic behavior of reinforced concrete sections. Struct. Concr. 2020, 21, 1732–1746. [Google Scholar] [CrossRef]
- Maraveas, C. Durability issues and corrosion of structural materials and systems in farm environment. Appl. Sci. 2020, 10, 990. [Google Scholar] [CrossRef] [Green Version]
- Al-Obaidi, S.; Bamonte, P.; Ferrara, L.; Luchini, M.; Mazzantini, I. Durability-based design of structures made with ultra-high-performance/ultra-high-durability concrete in extremely aggressive scenarios: Application to a geothermal water basin case study. Infrastructures 2020, 5, 102. [Google Scholar] [CrossRef]
- CEN. EN1992-1-1, Eurocode 2: Design of Concrete Structures–Part 1-1: General Rules and Rules for Buildings; European Committee for Standardisation: Brussels, Belgium, 2004. [Google Scholar]
- Lollini, F.; Carsana, M.; Gastaldi, M.; Redaelli, E. Corrosion behaviour of stainless steel reinforcement in concrete. Corros. Rev. 2019, 37, 3–19. [Google Scholar] [CrossRef] [Green Version]
- Gu, L.; Meng, X.H. Review on research and application of stainless steel reinforced concrete. In Proceedings of the International Conference on Mechatronics, Manufacturing and Materials Engineering (MMME 2016), Hong Kong, China, 11–12 June 2016. [Google Scholar]
- Maffei, B.; Salvatore, W.; Valentini, R. Dual-phase steel rebars for high-ductile r.c. structures, Part 1: Microstructural and mechanical characterization of steel rebars. Eng. Struct. 2007, 29, 3325–3332. [Google Scholar] [CrossRef]
- Salvatore, W.; Buratti, G.; Maffei, B.; Valentini, R. Dual-phase steel re-bars for high-ductile r.c. structures, Part 2: Rotational capacity of beams. Eng. Struct. 2007, 29, 3333–3341. [Google Scholar] [CrossRef]
- Lorusso, H.; Burgueño, A.; Egidi, D.; Svoboda, H. Application of dual phase steels in wires for reinforcement of concrete structures. Procedia Mater. Sci. 2012, 1, 118–125. [Google Scholar] [CrossRef] [Green Version]
- Caprili, S.; Salvatore, W.; Valentini, R.; Ascanio, C.; Luvarà, G. A new generation of high-ductile dual-phase steel reinforcing bars. Constr. Build. Mater. 2018, 179, 66–79. [Google Scholar] [CrossRef]
- Caprili, S.; Mattei, F.; Salvatore, W.; Ascanio, C.; Luvarà, G. Industrial and techno-economic feasibility of concrete structures reinforced with DP rebars. Constr. Build. Mater. 2021, 283, 122793. [Google Scholar] [CrossRef]
- Caprili, S.; Salvatore, W.; Valentini, R.; Ascanio, C.; Luvarà, G. Dual-phase steel reinforcing bars in uncorroded and corroded conditions. Constr. Build. Mater. 2019, 218, 162–175. [Google Scholar] [CrossRef]
- Bautista, A.; Pomares, J.C.; González, M.N.; Velasco, F. Influence of the microstructure of TMT reinforcing bars on their corrosion behavior in concrete with chlorides. Constr. Build. Mater. 2019, 229, 116899. [Google Scholar] [CrossRef] [Green Version]
- CEN. EN1998-1, Eurocode 8: Design of Structures for Earthquake Resistance–Part 1: General Rules, Seismic Actions and Rules for Buildings; European Committee for Standardisation: Brussels, Belgium, 2004. [Google Scholar]
- Dolšek, M.; Kramar, M.; Gams, M.; Bohinc, U.; Anžlin, A.; Lajkovič, G.; Mihelčič, F.; Požonec, V. Poročilo o preizkusih armiranobetonskih stebrov za ARRS projekt J2-5461; Slovenian National Building and Civil Engineering Institute: Ljubljana, Slovenija, 2016. (In Slovenian) [Google Scholar]
- Caprili, S.; Chellini, G.; Mattei, F.; Romis, F.; Salvatore, W. NEWREBAR Research Project: Deliverable, D.4.1: Report on Design, Execution and Results of Tests on Full-Scale Prototypes; University of Pisa, Department of Civil and Industrial Engineering: Pisa, Italy, 2019. [Google Scholar]
- Apostolopoulos, C.A.; Papadakis, V.G. Consequences of steel corrosion on the ductility properties of reinforcement bar. Constr. Build. Mater. 2008, 22, 2316–2324. [Google Scholar] [CrossRef]
- Salvatore, W.; Caprili, S.; Braconi, A.; Finetto, M.; Bianco, L.; Ascanio, C.; Moersch, J.; Apostolopoulos, C.; Ferreira Pimenta, G. Effects of Corrosion on Low-Cycle Fatigue (Seismic) Behaviour of High-Strength Steel Reinforcing Bars (RUSTEEL); Publications Office of the European Union: Luxembourg, 2014. [Google Scholar]
- Colla, V.; De Sanctis, M.; Dimatteo, A.; Lovicu, G.; Solina, A.; Valentini, R. Strain hardening behavior of dual-phase steels. Metall. Mater. Trans. A Phys. Metall. Mater. Sci. 2009, 40, 2557–2567. [Google Scholar] [CrossRef]
- Caprili, S.; Salvatore, W.; Valentini, R.; Apostolopoulos, C.; Drakakaki, I.; Cabral, A.M.; Reis, S. NEWREBAR research project: Deliverable, D.2.1: Report on Mechanical, Micro-Structural and Corrosion Properties of Reinforcing Selected DP Steel Rebars; University of Pisa, Department of Civil and Industrial Engineering: Pisa, Italy, 2019. [Google Scholar]
- McKenna, F.; Fenves, G.L. Open System for Earthquake Engineering Simulation (OpenSees). Available online: http://opensees.berkeley.edu (accessed on 14 March 2018).
- Ferreira, T.M.; Costa, A.A.; Vicente, R.; Varum, H. A simplified four-branch model for the analytical study of the out-of-plane performance of regular stone URM walls. Eng. Struct. 2015, 83, 140–153. [Google Scholar] [CrossRef]
- OpenSees Concrete04 Material. Available online: http://opensees.berkeley.edu/OpenSees/manuals/usermanual/1626.htm (accessed on 20 January 2021).
- CEN. wdEN1998-3 NEN SC8 PT3, Eurocode 8: Design of Structures for Earthquake Resistance–Part 3: Assessment and Retrofitting of Buildings and Bridges; CEN European Committee for Standardisation: Brussels, Belgium, 2018. [Google Scholar]
- Wang, P.; Shi, Q.; Wang, F.; Wang, Q. Seismic behaviour of concrete columns with high-strength stirrups. Earthq. Struct. 2020, 18, 15–25. [Google Scholar] [CrossRef]
- OpenSees MultiLinear Material. Available online: http://opensees.berkeley.edu/wiki/index.php/MultiLinear_Material (accessed on 20 January 2021).
- CEN. EN1998-3, Eurocode 8: Design of Structures for Earthquake Resistance–Part 3: Assessment and Retrofitting of Buildings; European Committee for Standardisation: Brussels, Belgium, 2005. [Google Scholar]
- Dolsek, M. Development of computing environment for the seismic performance assessment of reinforced concrete frames by using simplified nonlinear models. Bull. Earthq. Eng. 2010, 8, 1309–1329. [Google Scholar] [CrossRef]
- Liu, Z.; Li, S. Development of an ANN-based lumped plasticity model of RC columns using historical pseudo-static cyclic test data. Appl. Sci. 2019, 9, 4263. [Google Scholar] [CrossRef] [Green Version]
- Taylor, A.W.; Kuo, C.; Wellenius, K.; Chung, D. A Summary of Cyclic Lateral Load Tests on Rectangular Reinforced Concrete Columns; Building and Fire Research Laboratory, National Institute of Standards and Technology: Gaithersburg, MA, USA, 1997. [Google Scholar]
- Rasulo, A.; Pelle, A.; Lavorato, D.; Fiorentino, G.; Nuti, C.; Briseghella, B. Finite element analysis of reinforced concrete bridge piers including a flexure-shear interaction model. Appl. Sci. 2020, 10, 2209. [Google Scholar] [CrossRef] [Green Version]
- Žižmond, J.; Dolšek, M. Evaluation of factors influencing the earthquake-resistant design of reinforced concrete frames according to Eurocode 8. Struct. Infrastruct. Eng. 2016, 12, 1323–1341. [Google Scholar] [CrossRef]
- Žižmond, J.; Dolšek, M. Modeliranje efektivne širine pasnice grede za nelinearno analizo armiranobetonske okvirne stavbe (Modelling of effective flange width of beam for nonlinear analysis of reinforced concrete frame building). Gradb. Vestn. 2014, 63, 26–39. (In Slovenian) [Google Scholar]
- Rasulo, A.; Pelle, A.; Lavorato, D.; Fiorentino, G.; Nuti, C.; Briseghella, B. Seismic assessment of reinforced concrete frames: Influence of shear-flexure interaction and rebar corrosion. In International Conference on Computational Science and Its Applications; Gervasi, O., Murgante, B., Misra, S., Garau, C., Blečić, I., Taniar, D., Apduhan, B.O., Rocha, A.M.A.C., Tarantino, E., Torre, C.M., et al., Eds.; Springer: Cham, Switzerland, 2020; pp. 463–478. [Google Scholar]
- Lazar Sinković, N.; Brozovič, M.; Dolšek, M. Risk-based seismic design for collapse safety. Earthq. Eng. Struct. Dyn. 2016, 45, 1451–1471. [Google Scholar] [CrossRef]
- Zoubek, B.; Isakovic, T.; Fahjan, Y.; Fischinger, M. Cyclic failure analysis of the beam-to-column dowel connections in precast industrial buildings. Eng. Struct. 2013, 52, 179–191. [Google Scholar] [CrossRef]
- Vamvatsikos, D.; Cornell, C.A. Incremental dynamic analysis. Earthq. Eng. Struct. Dyn. 2002, 31, 491–514. [Google Scholar] [CrossRef]
- Baker, J.W. Conditional mean spectrum: Tool for ground-motion selection. J. Struct. Eng. 2011, 137, 322–331. [Google Scholar] [CrossRef]
- Woessner, J.; Laurentiu, D.; Giardini, D.; Crowley, H.; Cotton, F.; Grünthal, G.; Valensise, G.; Arvidsson, R.; Basili, R.; Demircioglu, M.B.; et al. The 2013 European seismic hazard model: Key components and results. Bull. Earthq. Eng. 2015, 13, 3553–3596. [Google Scholar] [CrossRef] [Green Version]
- Chiou, B.; Darragh, R.; Gregor, N.; Silva, W. NGA project strong-motion database. Earthq. Spectra 2008, 24, 23–44. [Google Scholar] [CrossRef] [Green Version]
- Akkar, S.; Sandikkaya, M.A.; Şenyurt, M.; Azari Sisi, A.; Ay, B.O.; Traversa, P.; Douglas, J.; Cotton, F.; Luzi, L.; Hernandez, B.; et al. Reference database for seismic ground-motion in Europe (RESORCE). Bull. Earthq. Eng. 2014, 12, 311–339. [Google Scholar] [CrossRef] [Green Version]
- Žižmond, J.; Dolšek, M. Formulation of risk-targeted seismic action for the force-based seismic design of structures. Earthq. Eng. Struct. Dyn. 2019, 48, 1406–1428. [Google Scholar] [CrossRef]
- ATC. FEMA P695, Quantification of Building Seismic Performance Factors; Federal Emergency Management Agency: Washington, DC, USA, 2009. [Google Scholar]
- Dolšek, M.; Lazar Sinković, N.; Žižmond, J. IM-based and EDP-based decision models for the verification of the seismic collapse safety of buildings. Earthq. Eng. Struct. Dyn. 2017, 46, 1–18. [Google Scholar] [CrossRef]
Figure 1.
Stress-strain relationships of B500B and DPD2 steel grades.
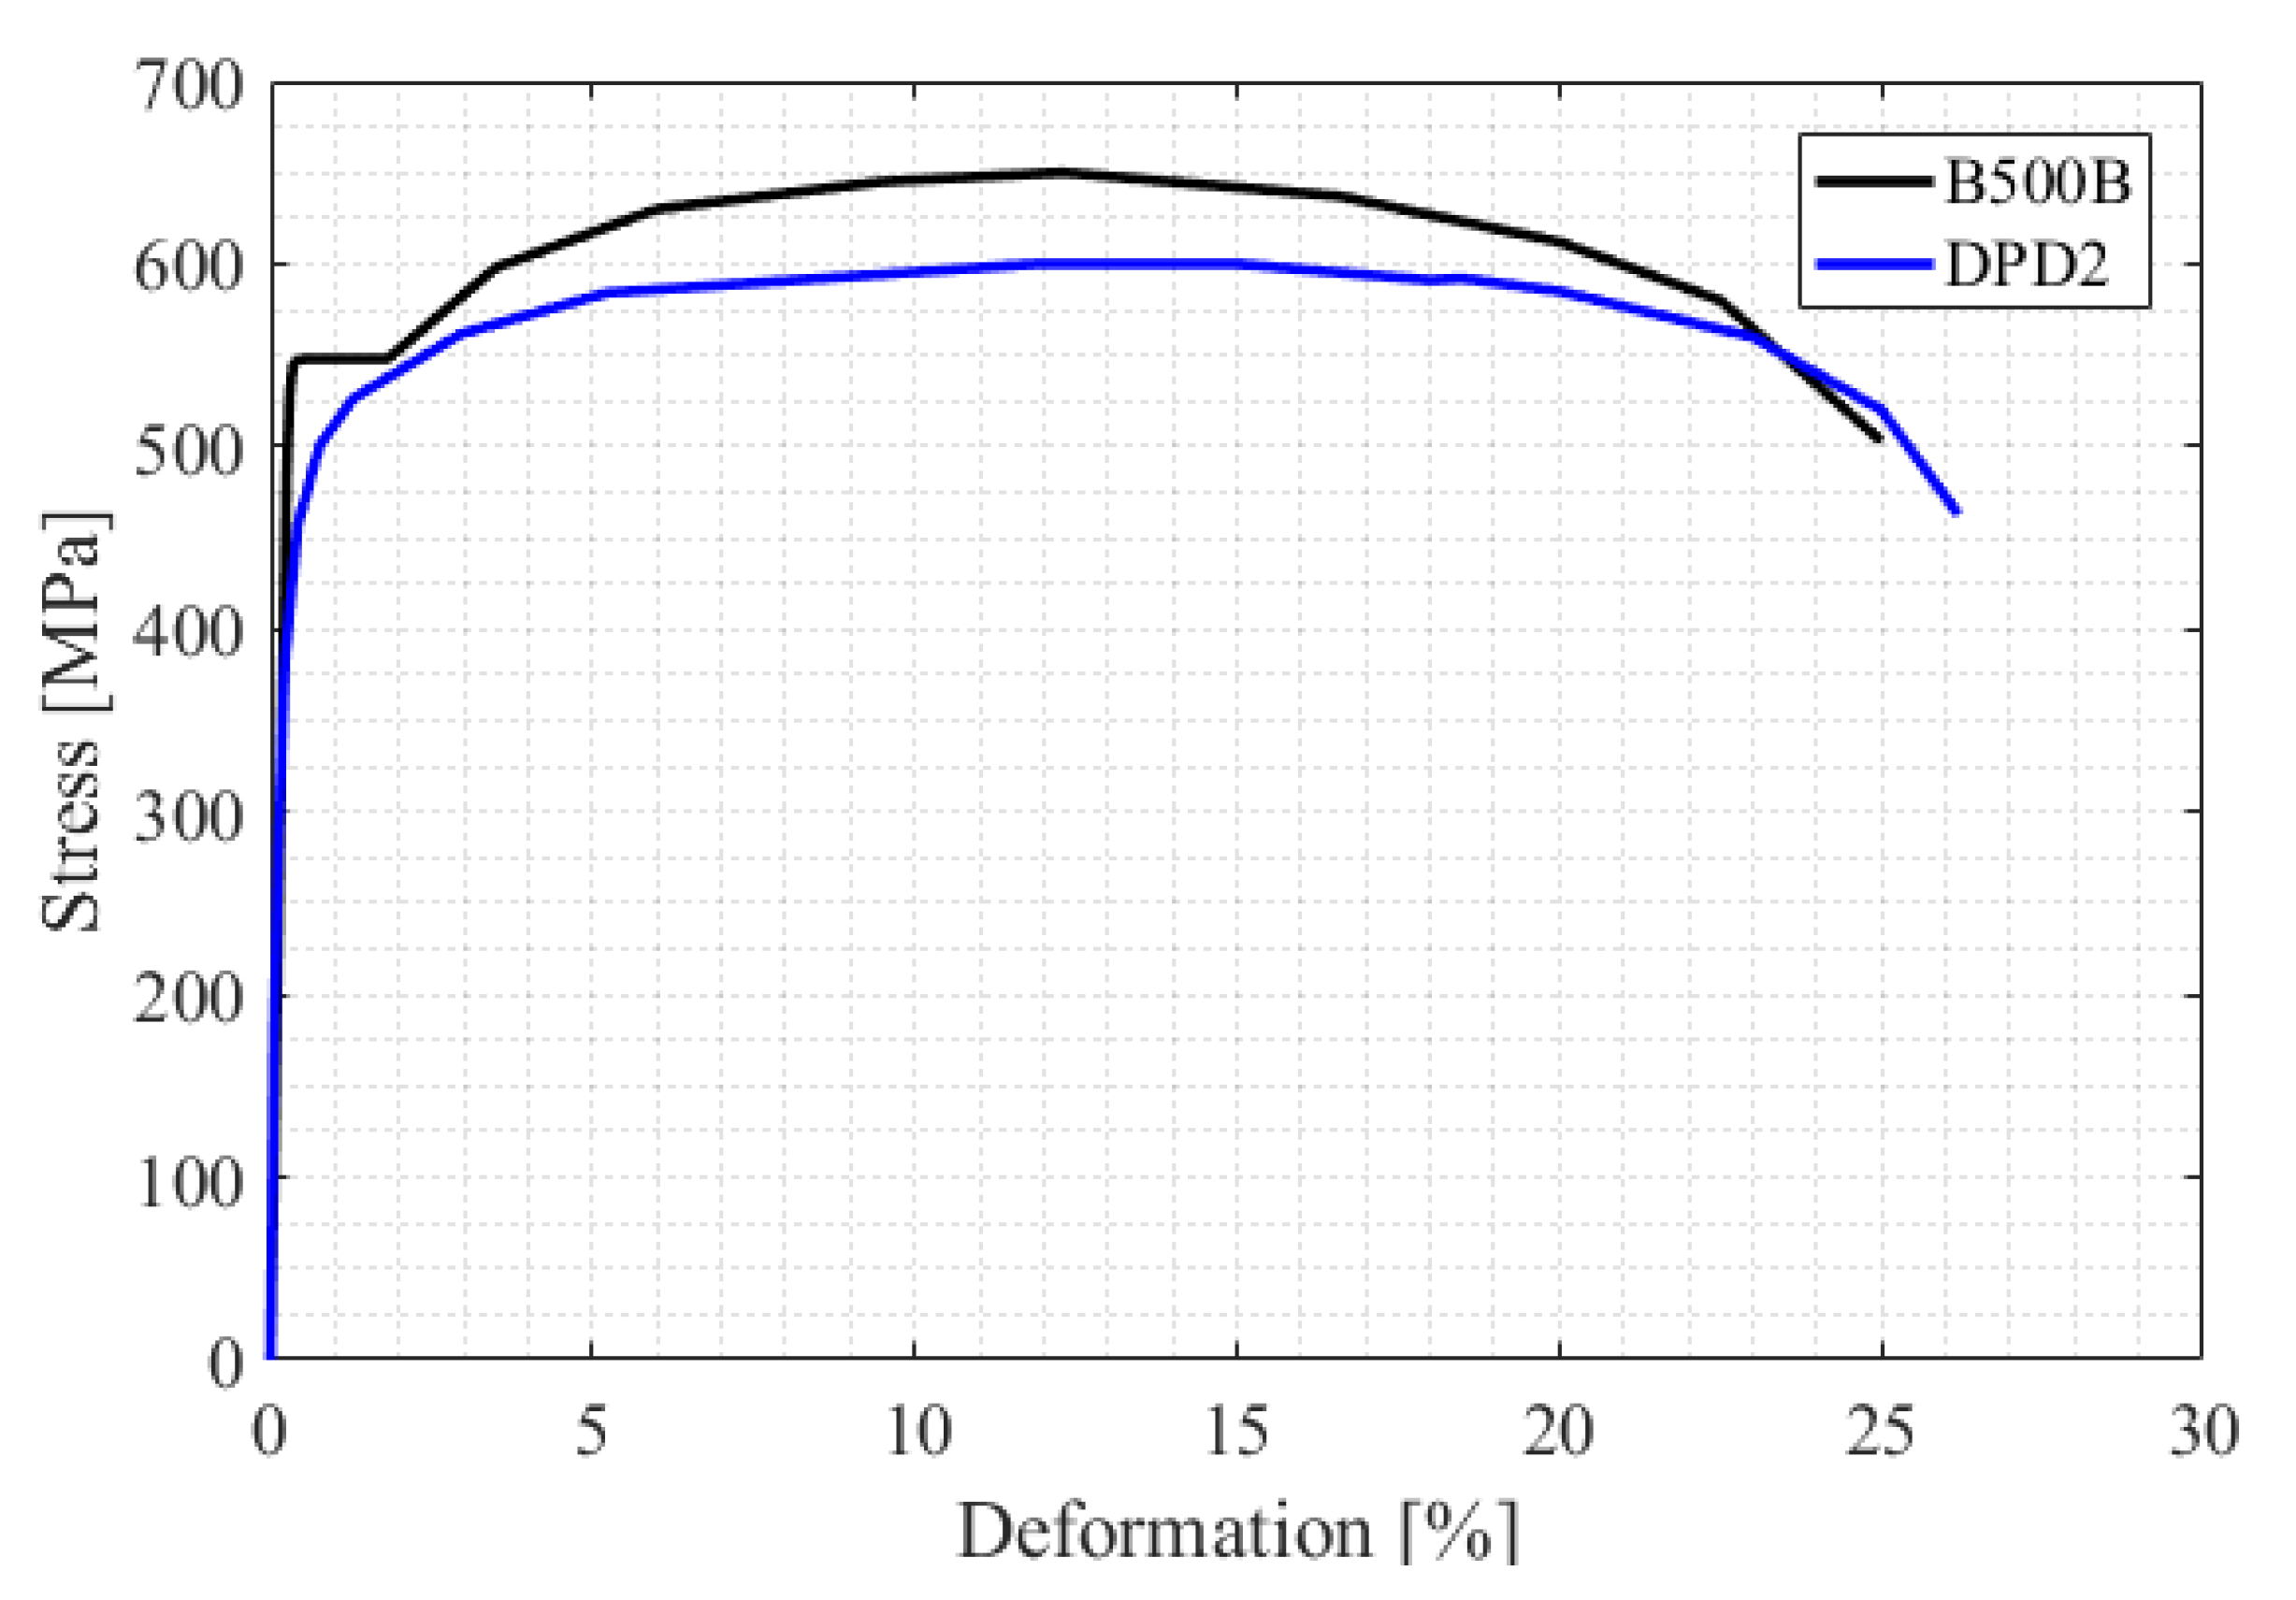
Figure 2.
(a) mathematical model of column for simulation of cyclic response and (b) four-linear moment-rotation relationship of plastic hinge.
Figure 2.
(a) mathematical model of column for simulation of cyclic response and (b) four-linear moment-rotation relationship of plastic hinge.

Figure 3.
Schematic presentation of coupling two three-linear moment–rotation relationships in parallel in order to obtain a four-linear moment–rotation relationship in a flexural plastic hinge.
Figure 3.
Schematic presentation of coupling two three-linear moment–rotation relationships in parallel in order to obtain a four-linear moment–rotation relationship in a flexural plastic hinge.
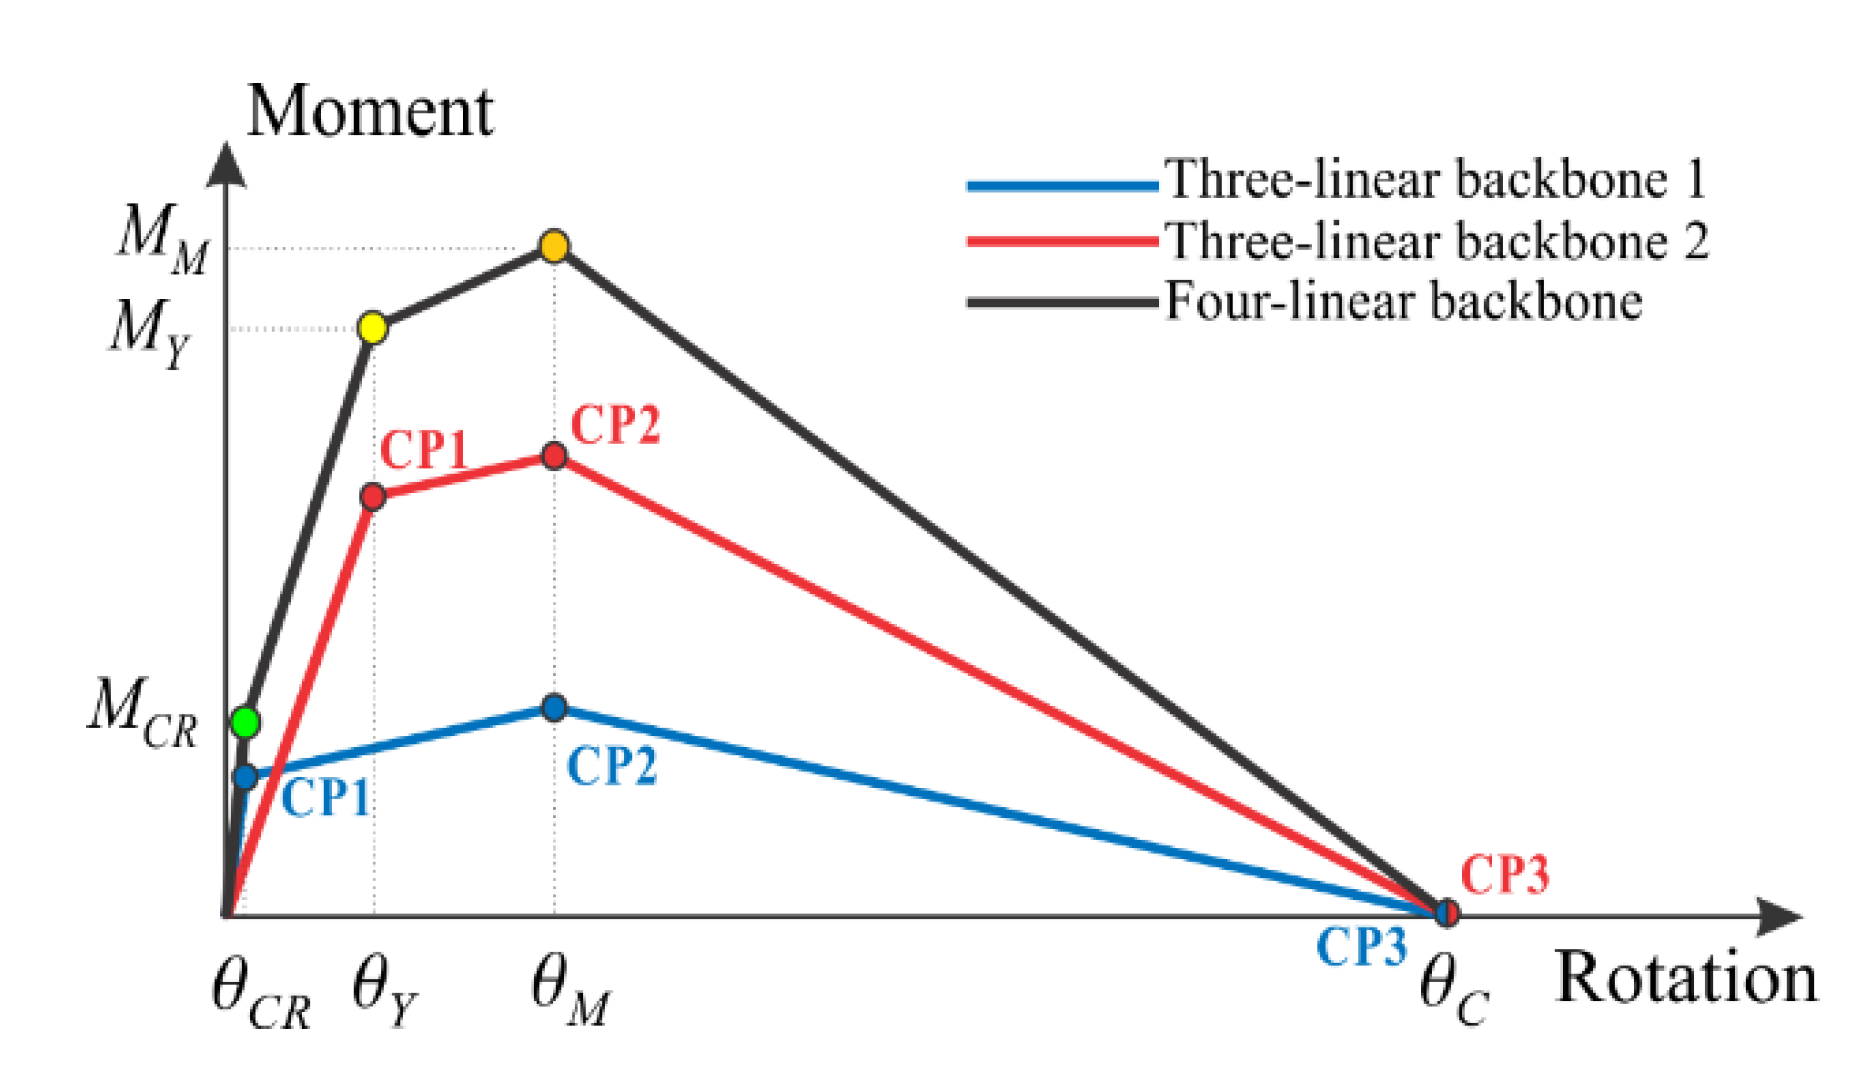
Figure 4.
Elevation view of specimen with reinforcement, and cross-sections of column of specimen reinforced with B500B.
Figure 4.
Elevation view of specimen with reinforcement, and cross-sections of column of specimen reinforced with B500B.
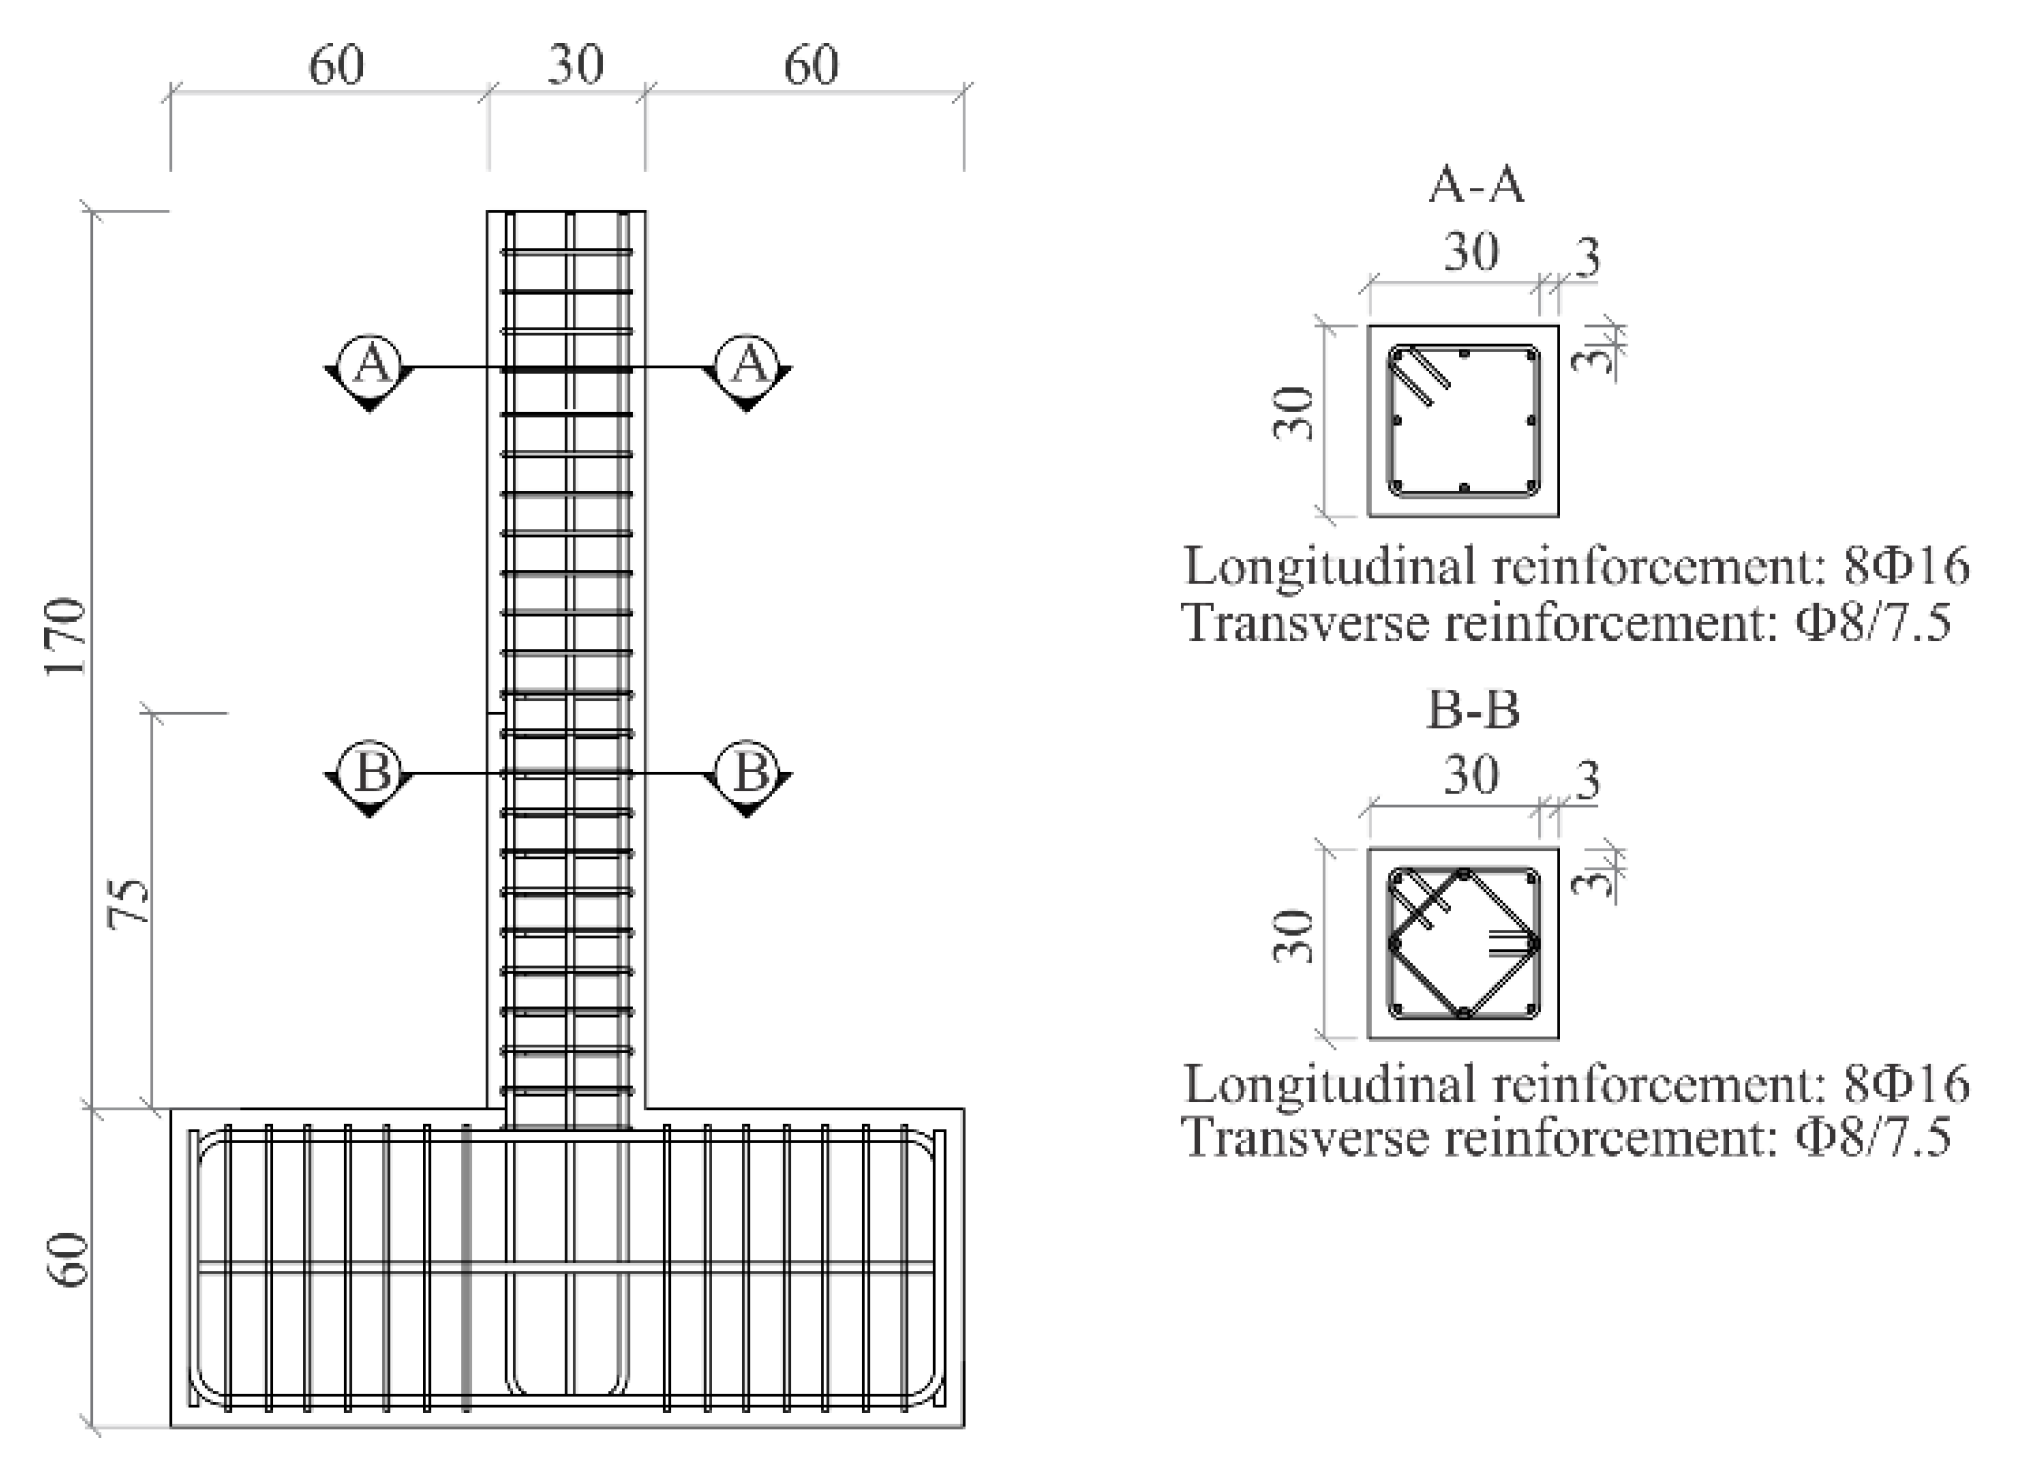
Figure 5.
Base shear—displacement at height 1.50 m relationship observed during cyclic test and that obtained from simulation of cyclic response of a column reinforced with B500B using (a) basic and (b) calibrated model.
Figure 5.
Base shear—displacement at height 1.50 m relationship observed during cyclic test and that obtained from simulation of cyclic response of a column reinforced with B500B using (a) basic and (b) calibrated model.
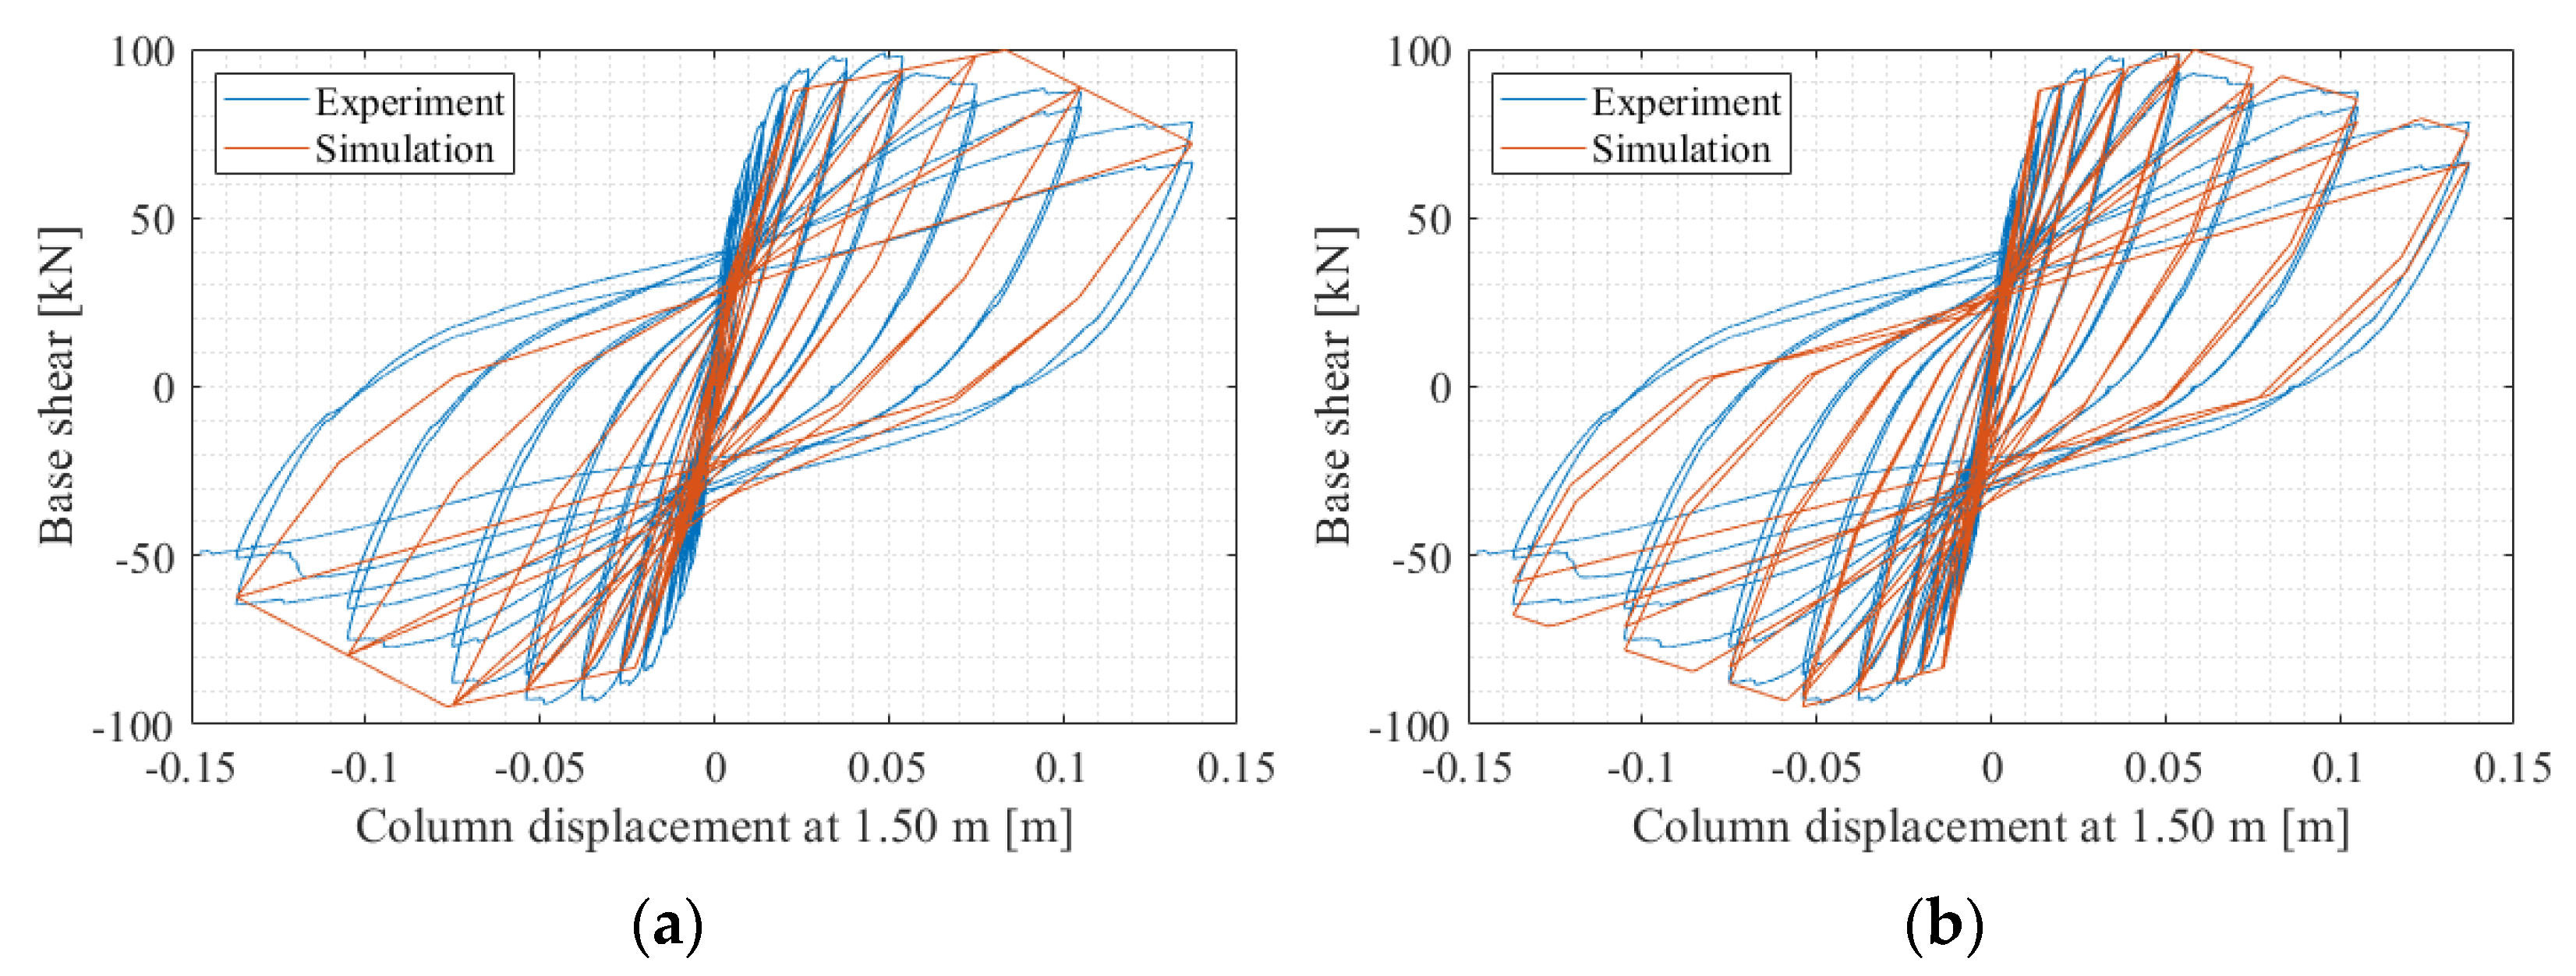
Figure 6.
Elevation view of specimen with reinforcement and cross-section of column of specimen reinforced with DPD2.
Figure 6.
Elevation view of specimen with reinforcement and cross-section of column of specimen reinforced with DPD2.
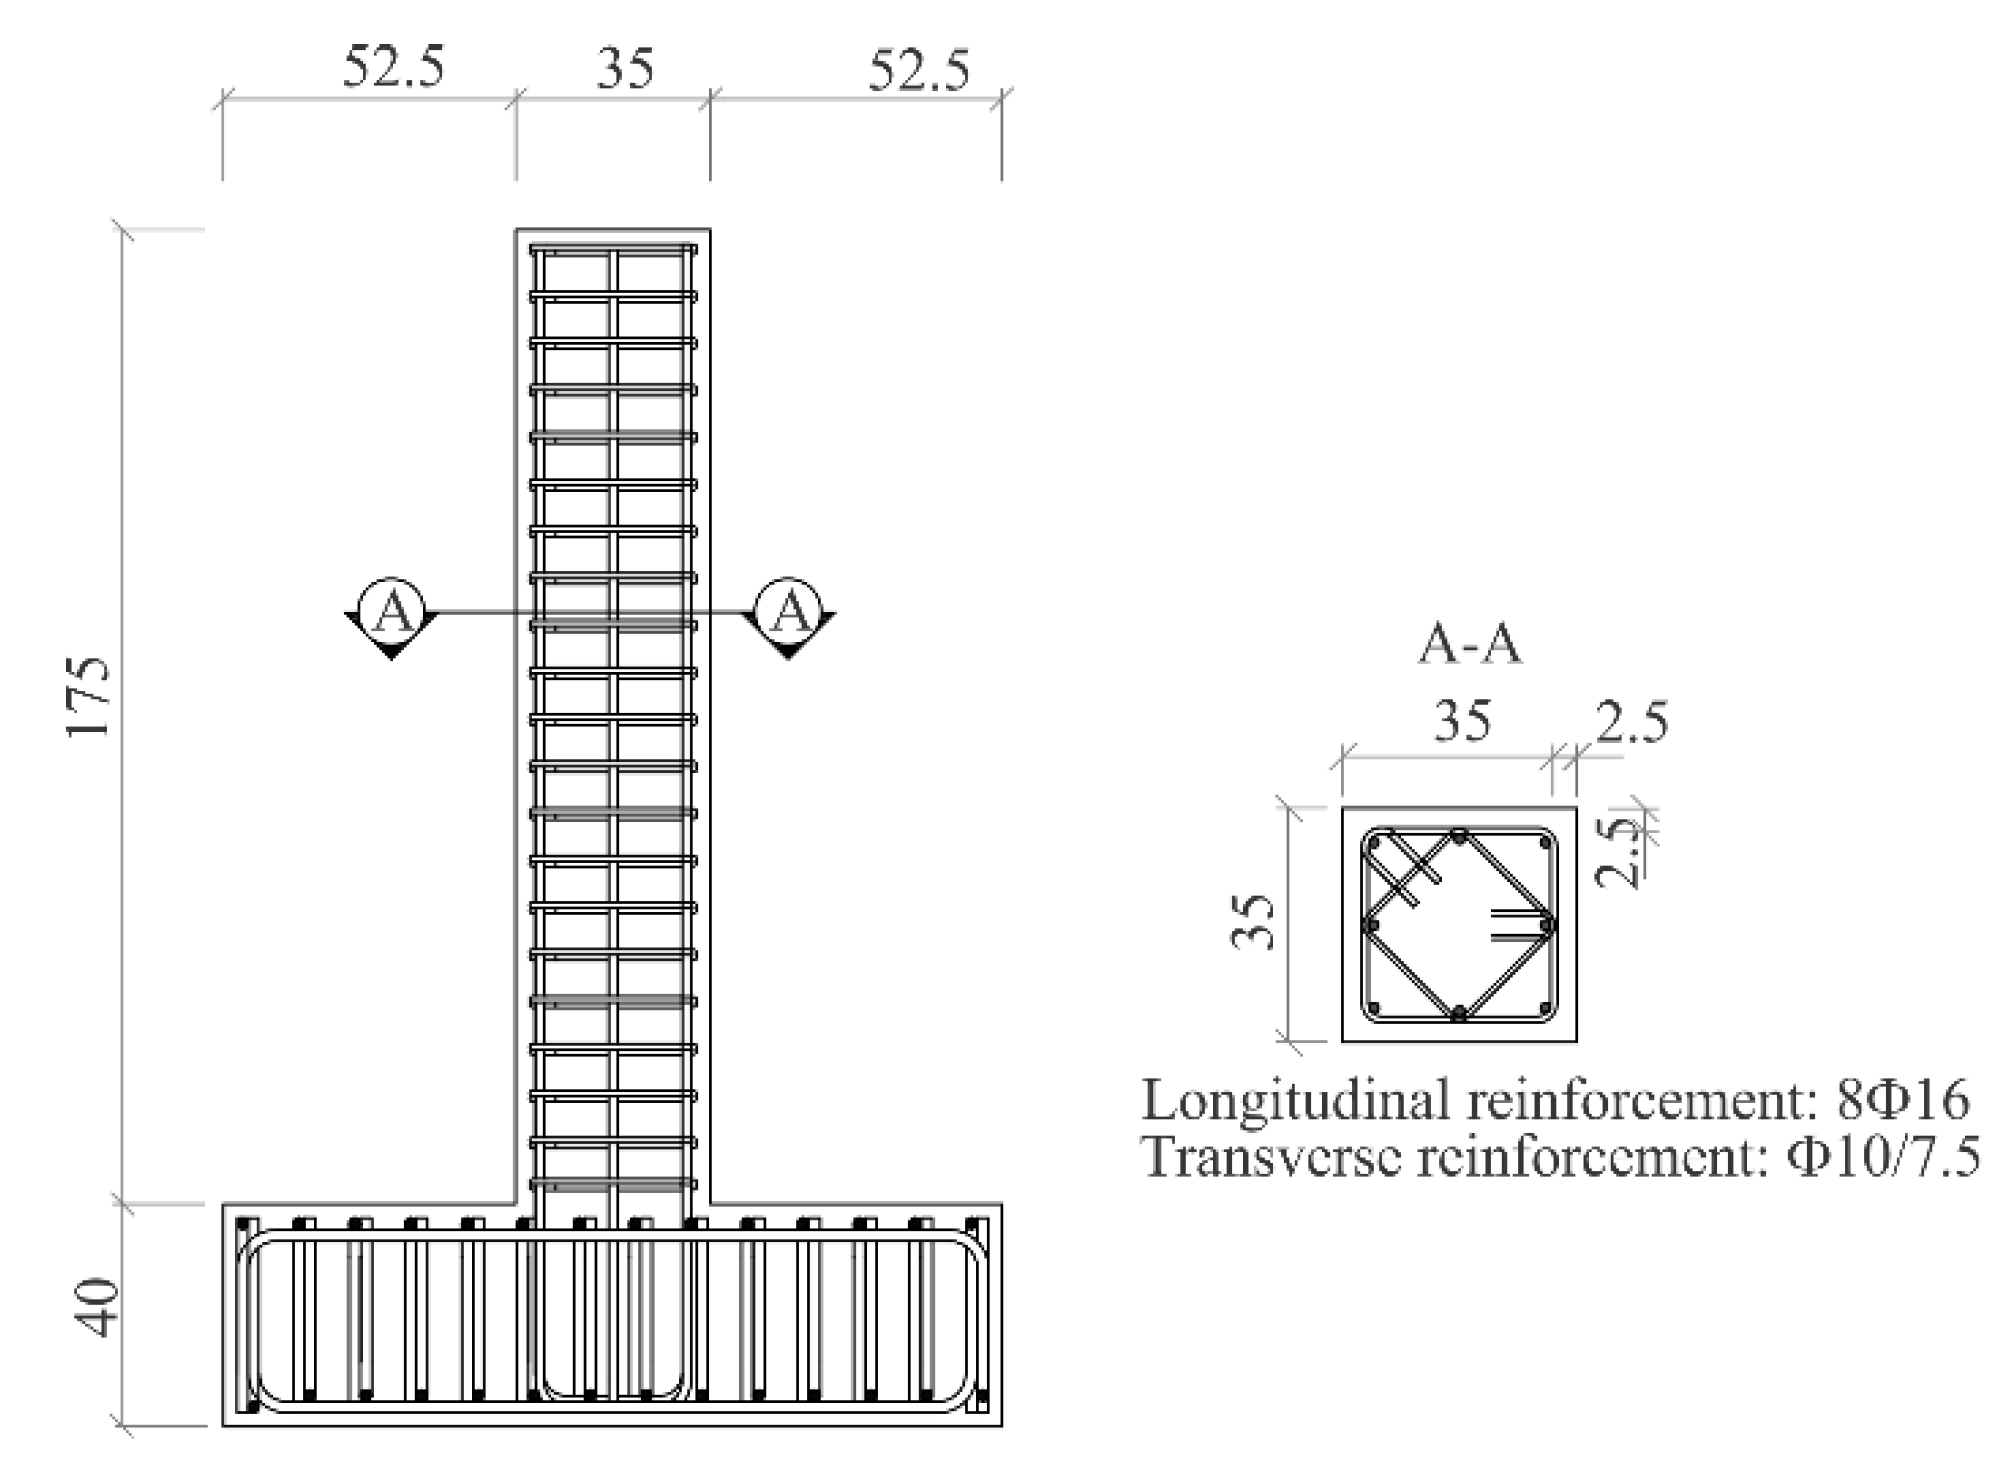
Figure 7.
Base shear—displacement at height 1.53 m relationship observed during cyclic test and that obtained from simulation of cyclic response of a column reinforced with DPD2 using (a) basic and (b) calibrated model.
Figure 7.
Base shear—displacement at height 1.53 m relationship observed during cyclic test and that obtained from simulation of cyclic response of a column reinforced with DPD2 using (a) basic and (b) calibrated model.

Figure 8.
Elevations, plan views and reinforcement in typical columns and beams of (a) 4-, (b) 8- and (c) 11-storey buildings.
Figure 8.
Elevations, plan views and reinforcement in typical columns and beams of (a) 4-, (b) 8- and (c) 11-storey buildings.
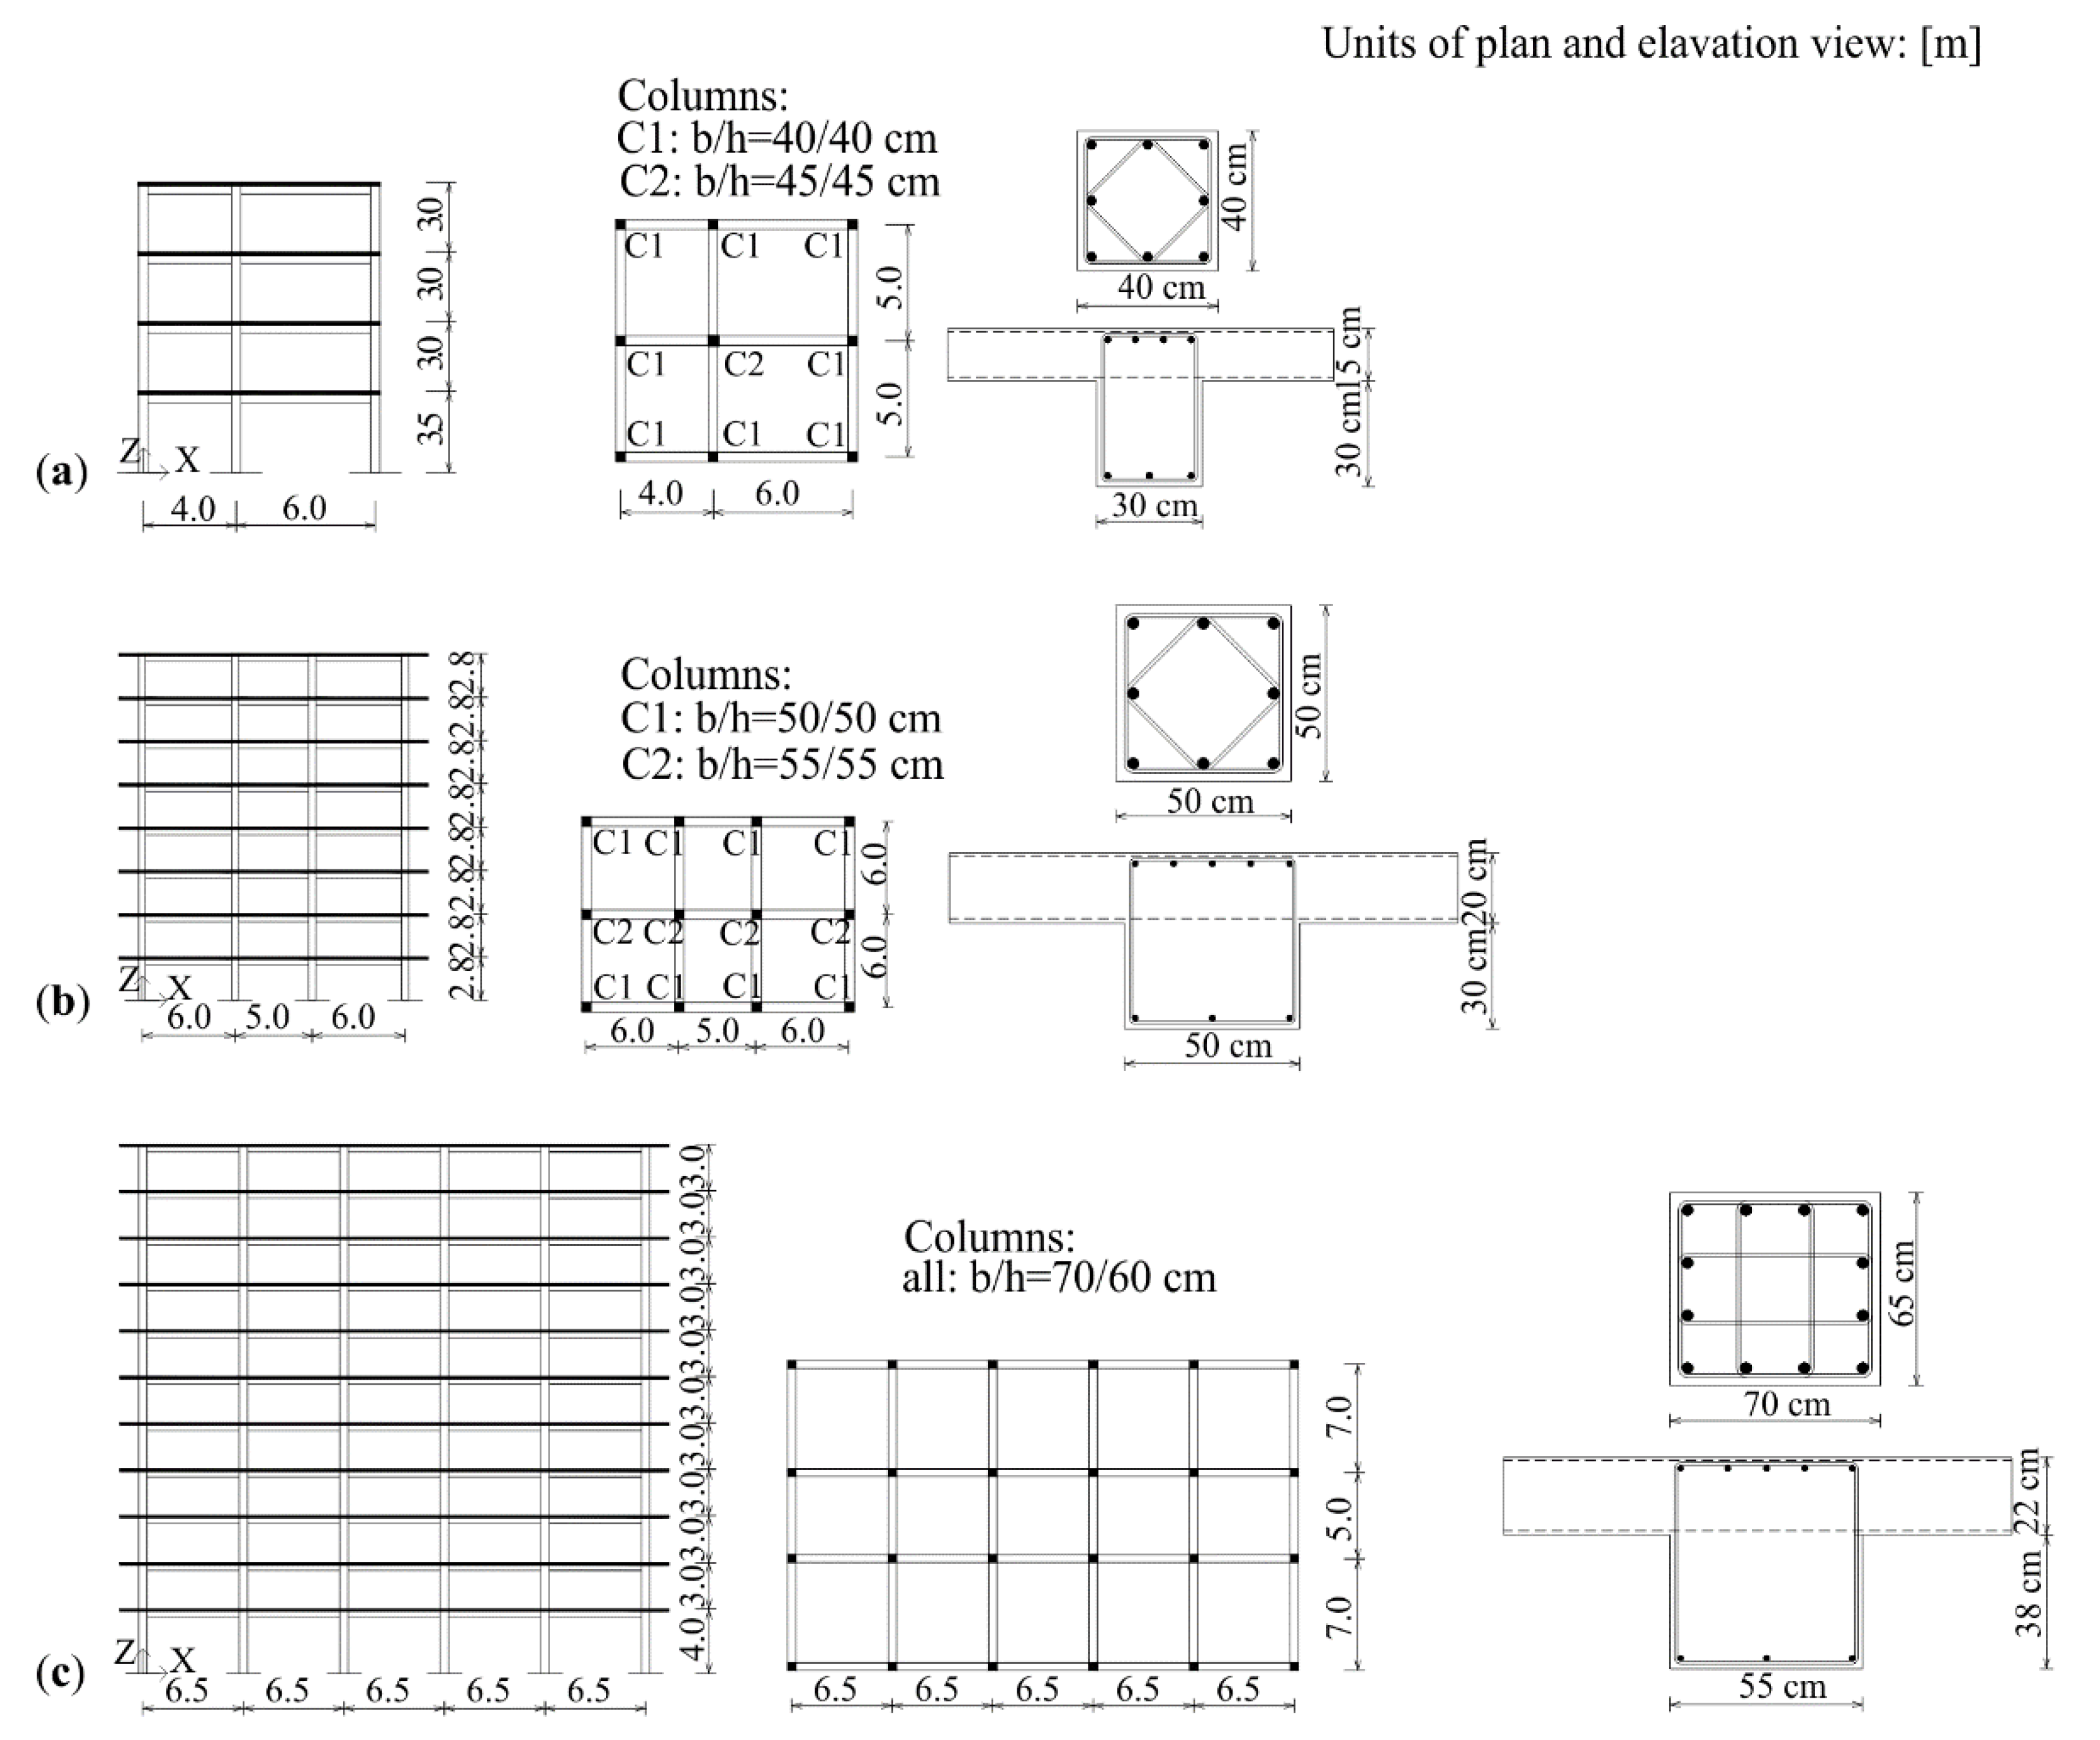
Figure 9.
Average longitudinal reinforcing ratios in critical regions of (a) columns and (b) and (c) beams at storey level of 4-, 8- and 11-storey building.
Figure 9.
Average longitudinal reinforcing ratios in critical regions of (a) columns and (b) and (c) beams at storey level of 4-, 8- and 11-storey building.
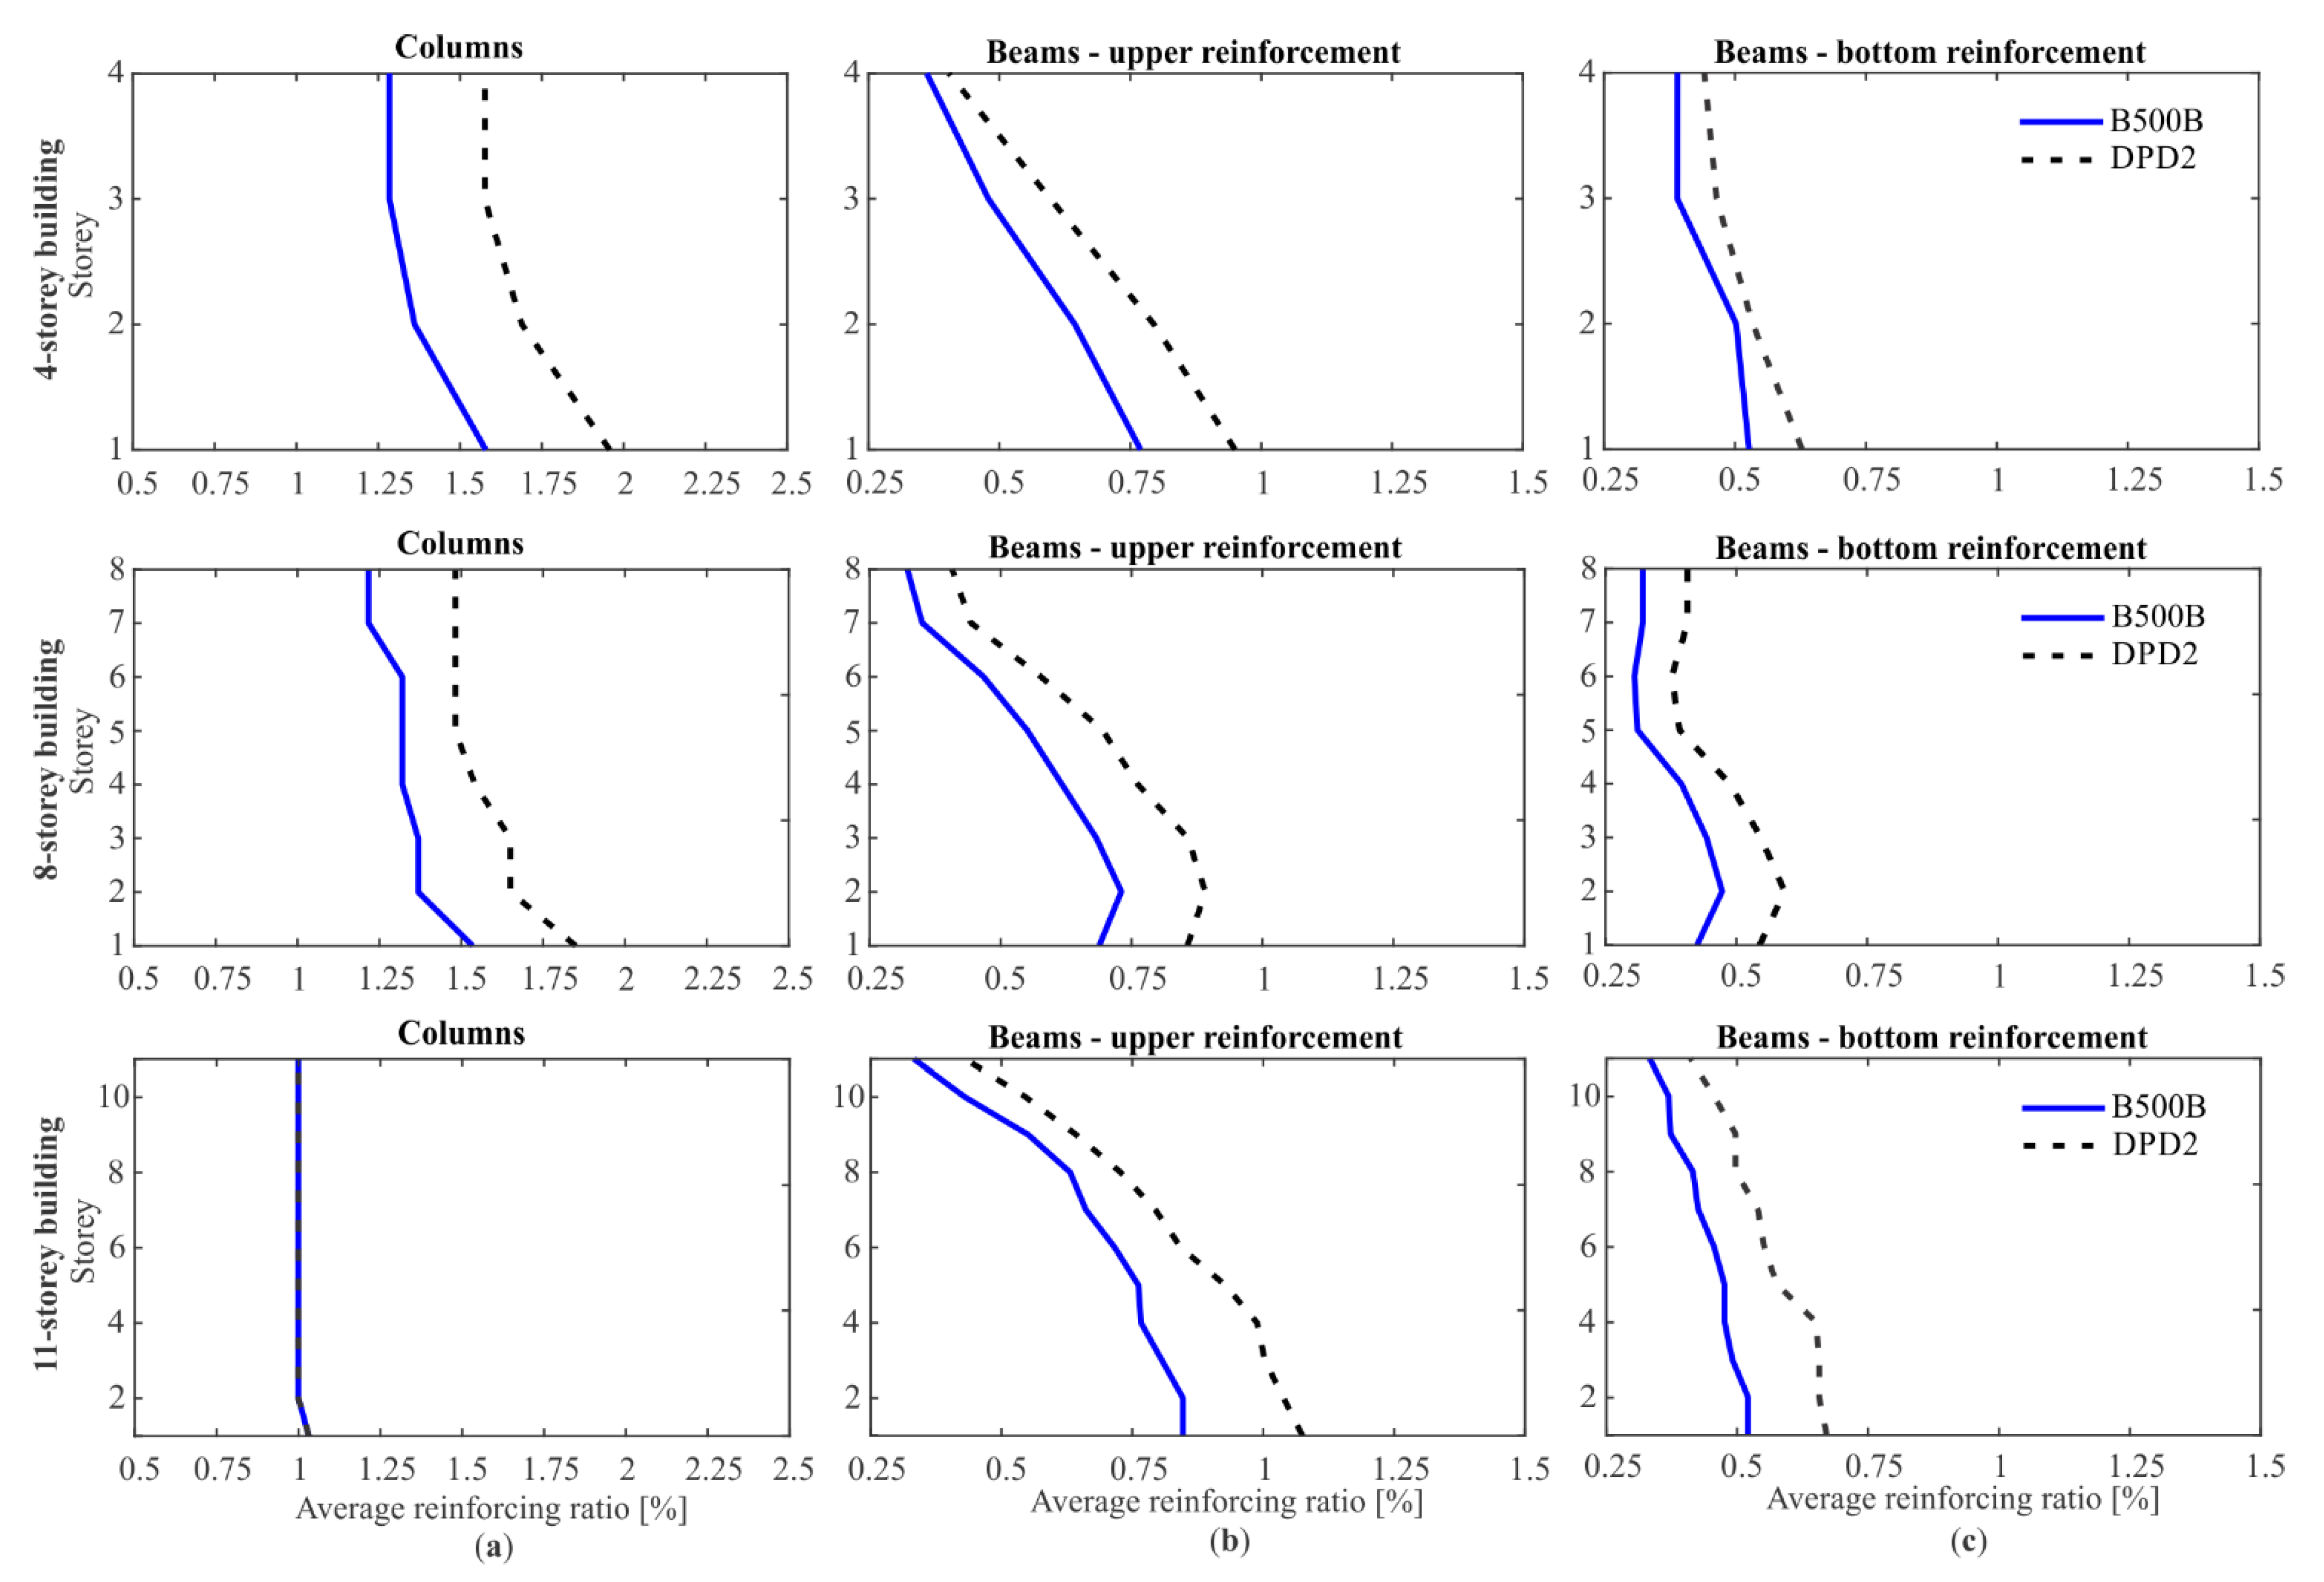
Figure 10.
Simplified nonlinear model for seismic performance assessment of frame buildings.
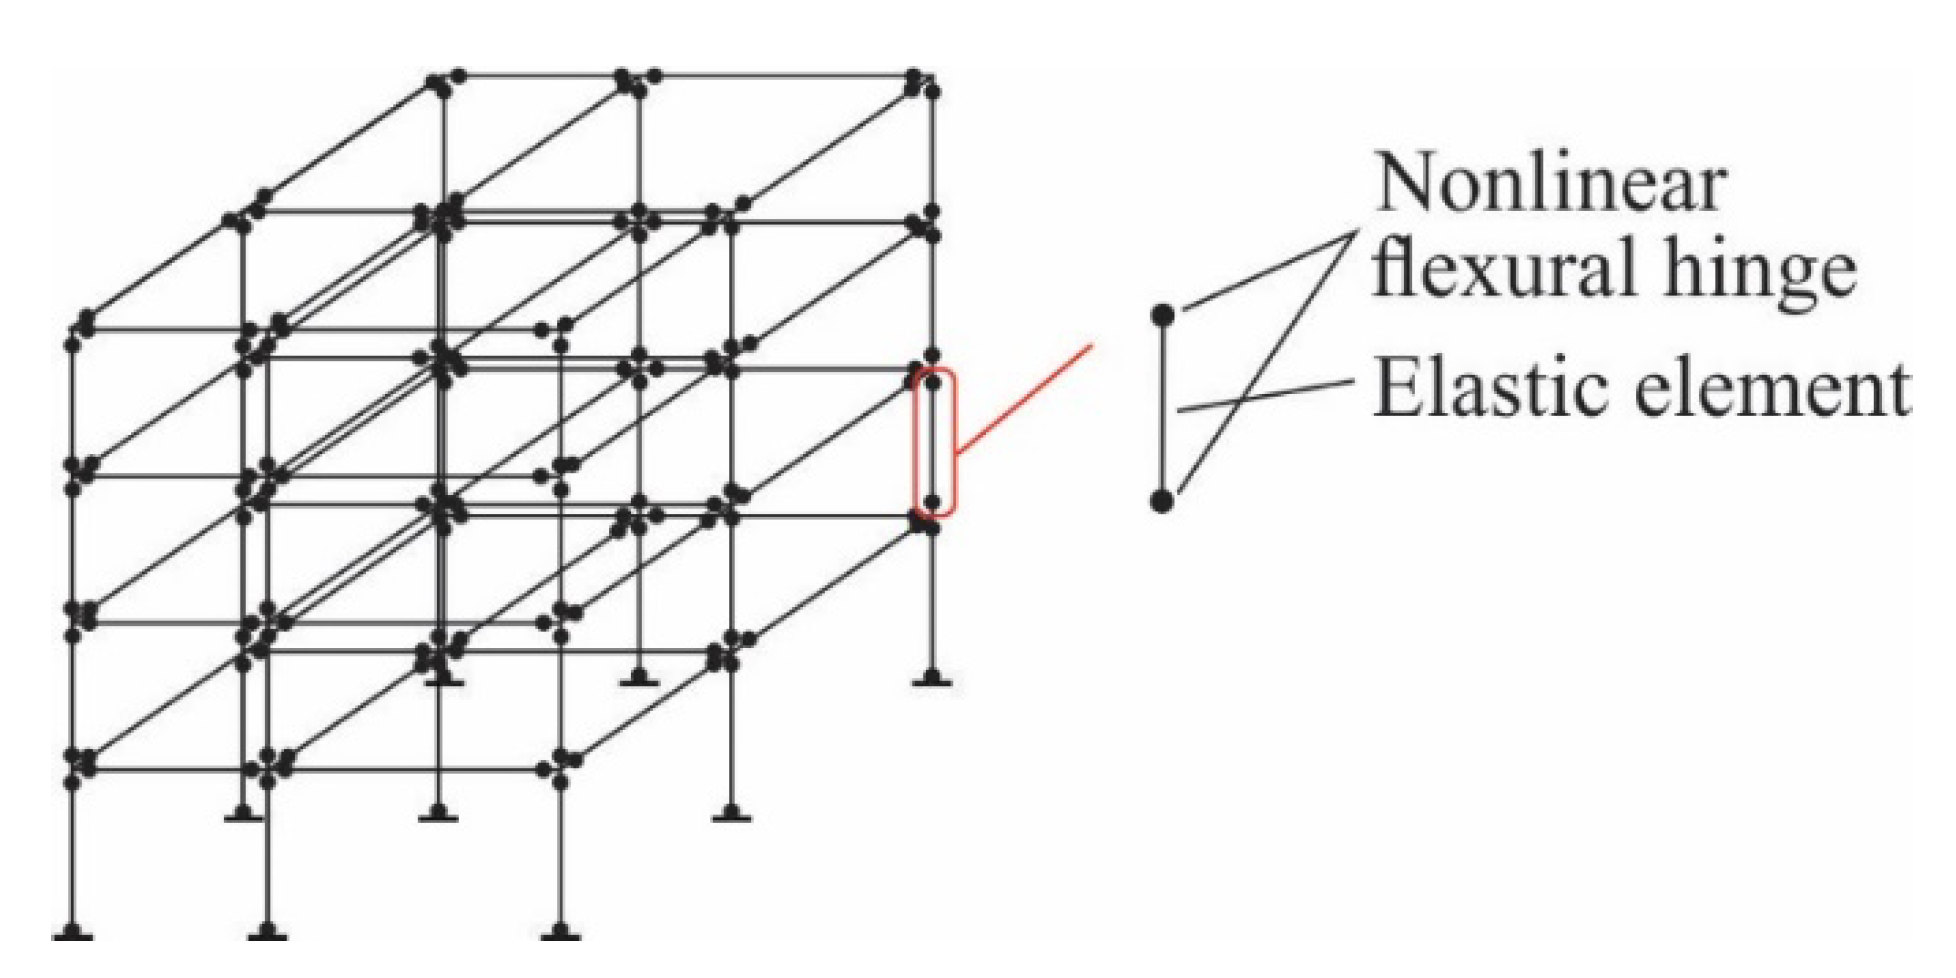
Figure 11.
Pushover curves of variants of (a) 4-, (b) 8- and (c) 11-storey buildings. Diamond-shaped points on each of the pushover curves correspond to near-collapse displacement.
Figure 11.
Pushover curves of variants of (a) 4-, (b) 8- and (c) 11-storey buildings. Diamond-shaped points on each of the pushover curves correspond to near-collapse displacement.
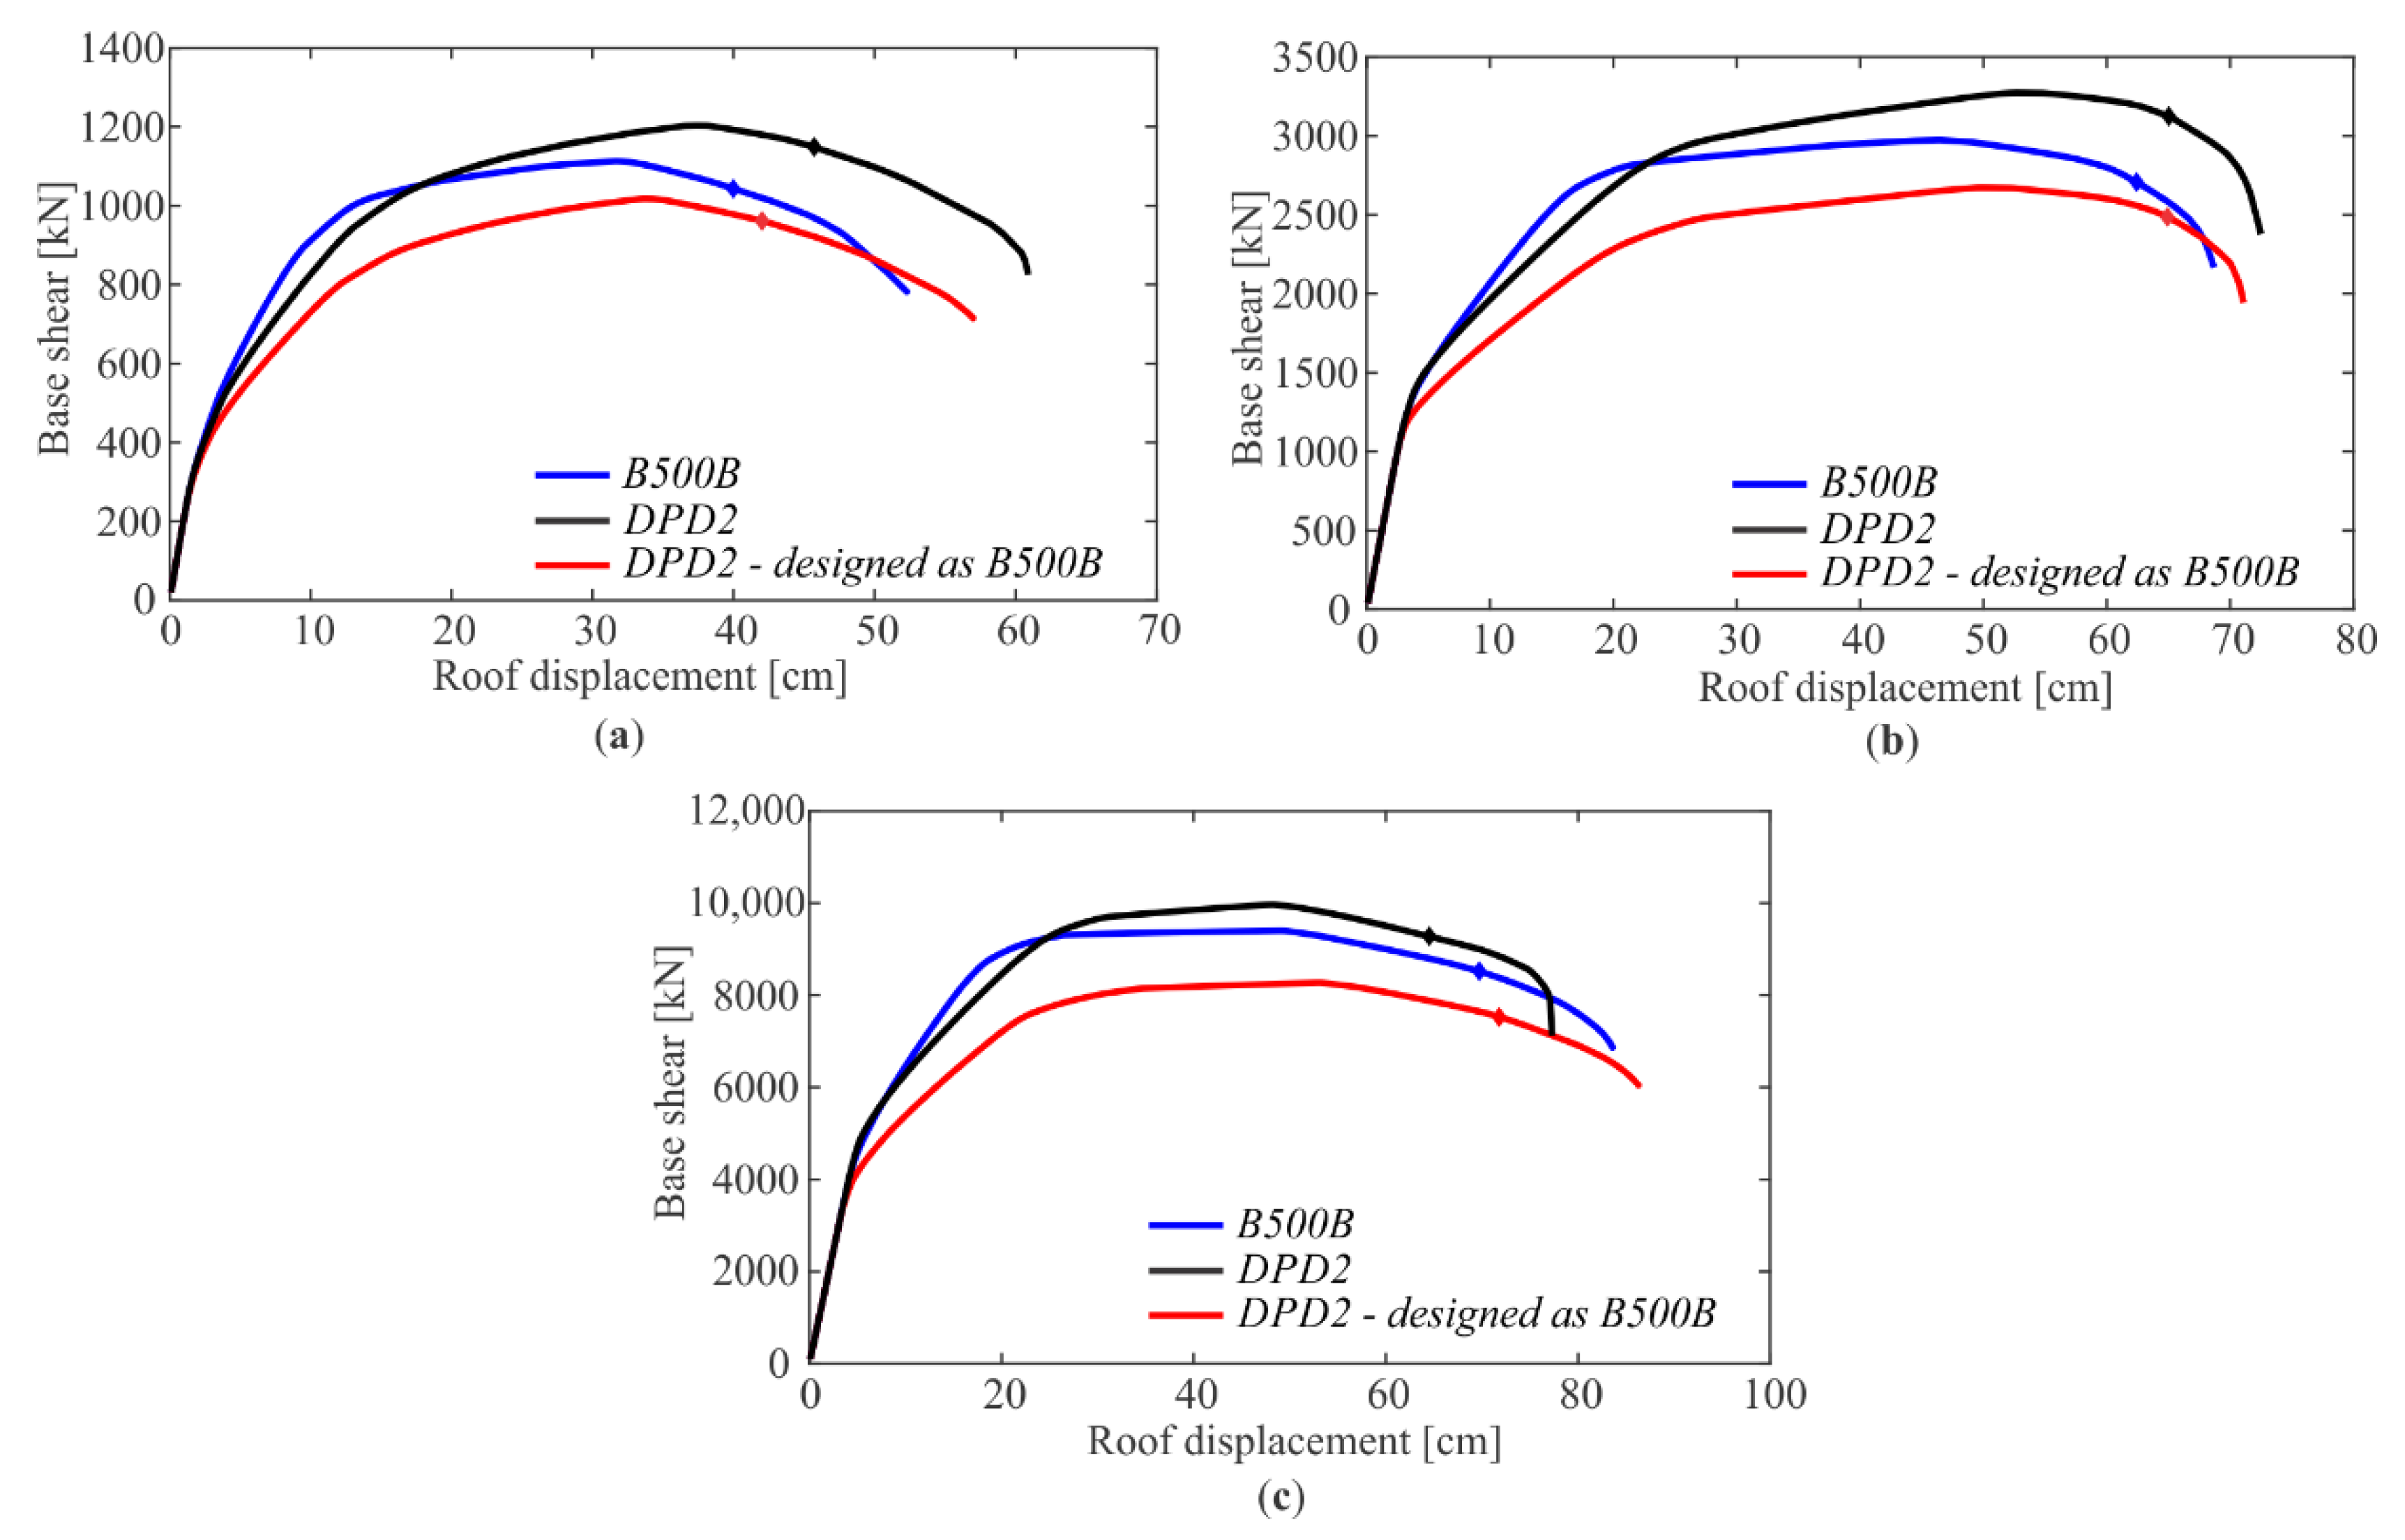
Figure 12.
Target conditional acceleration spectra (median, 16th and 84th percentile), corresponding spectra of selected ground motions for an earthquake scenario based on Se,2475, and acceleration spectra of each ground motion used for assessment of (a) 4-, (b) 8- and (c) 11-storey buildings.
Figure 12.
Target conditional acceleration spectra (median, 16th and 84th percentile), corresponding spectra of selected ground motions for an earthquake scenario based on Se,2475, and acceleration spectra of each ground motion used for assessment of (a) 4-, (b) 8- and (c) 11-storey buildings.
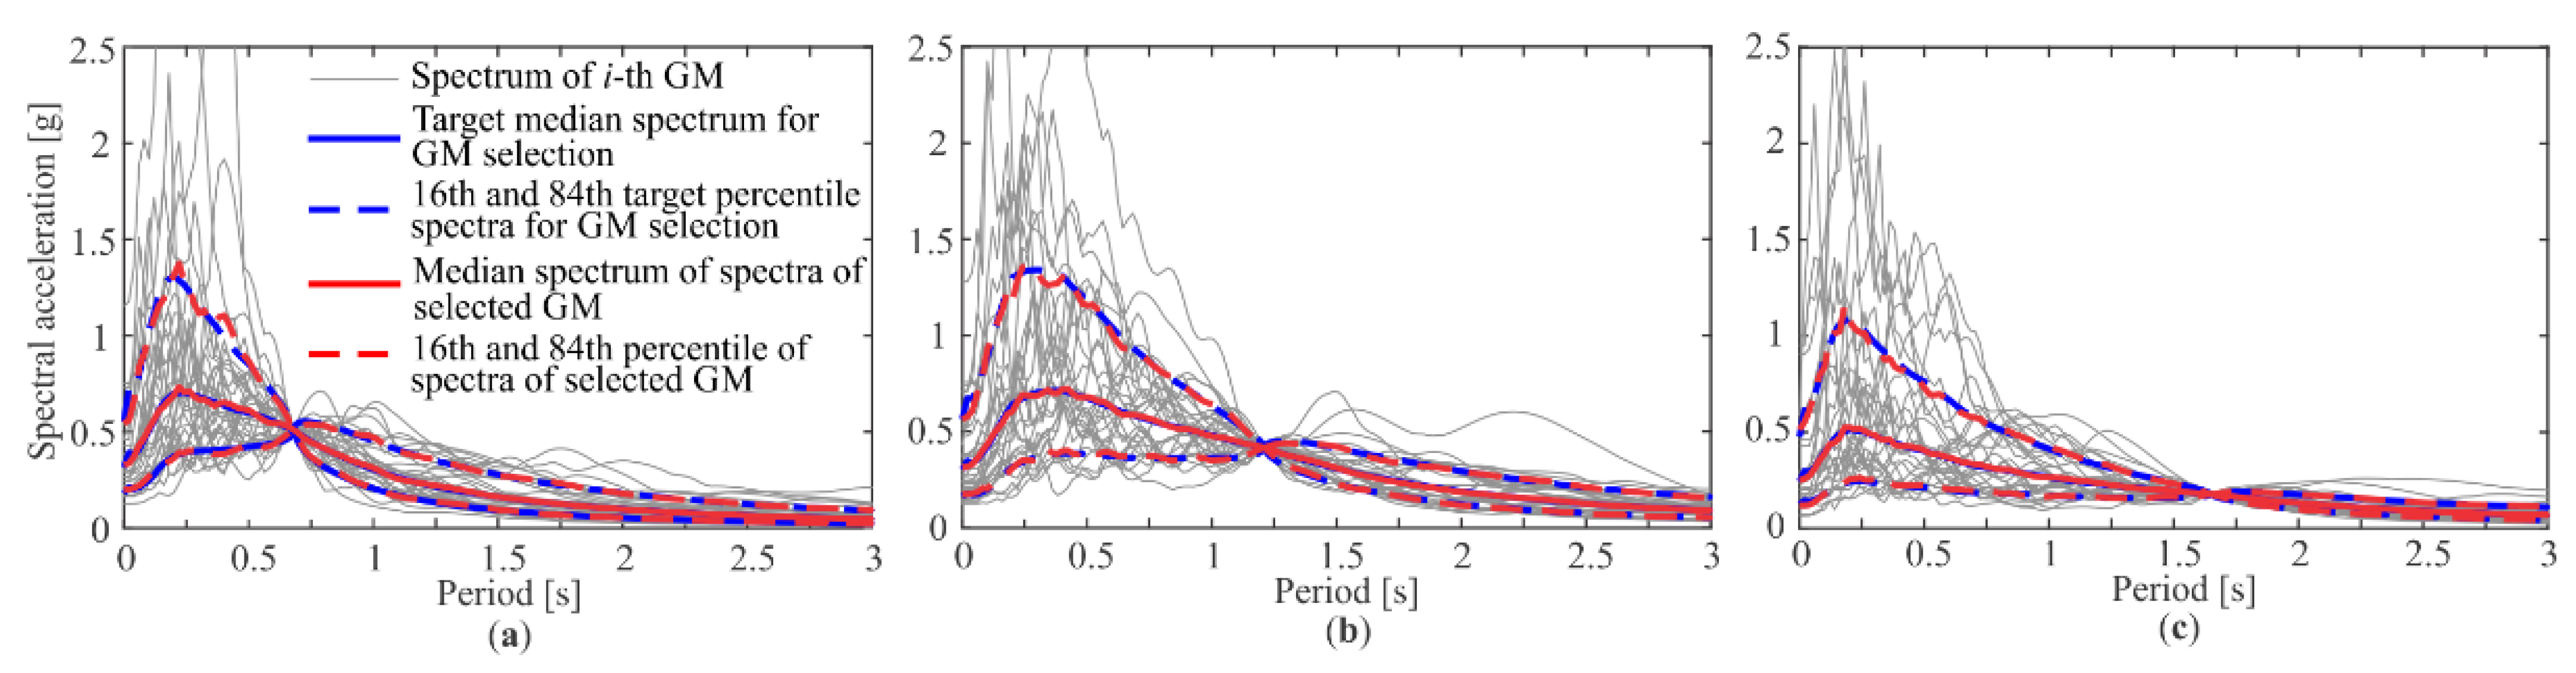
Figure 13.
Median IDA curve of (a) 4-, (b) 8- and (c) 11-storey buildings.


Table 1.
Mechanical properties of B500B and DPD2 steel grades taken from the experimental results [21,24,27].
| Steel Grade | fy,k [MPa] | fy,m [MPa] | fu [MPa] | Agt | A5 | k |
|---|---|---|---|---|---|---|
| B500B | 500 | 548 | 650 | 12.3% | 25.0% | 1.19 |
| DPD2 | 400 | 461 | 590 | 11.9% | 26.2% | 1.28 |
Table 2.
Compressive strength (fc), corresponding compressive strain at fc (εc0), ultimate strain (εcu), axial tensile strength (fct), tensile strain at fct (εt) and elastic modulus (Ec) of confined and unconfined concrete.
Table 2.
Compressive strength (fc), corresponding compressive strain at fc (εc0), ultimate strain (εcu), axial tensile strength (fct), tensile strain at fct (εt) and elastic modulus (Ec) of confined and unconfined concrete.
| Unconfined Concrete | Confined Concrete | |
|---|---|---|
| fc [MPa] | 41.2 | 56.8 |
| εc0 [‰] | 2.22 | 6.41 |
| εcu [‰] | 3.50 | 19.66 |
| fct [MPa] | 3.1 | 3.1 |
| εt [‰] | 0.086 | 0.086 |
| Ec [MPa] | 3.6·104 | 3.6·104 |
Table 3.
Compressive strength (fc), corresponding compressive strain at fc (εc0), ultimate strain (εcu), axial tensile strength (fct), tensile strain at fct (εt) and elastic modulus (Ec) of confined and unconfined concrete.
Table 3.
Compressive strength (fc), corresponding compressive strain at fc (εc0), ultimate strain (εcu), axial tensile strength (fct), tensile strain at fct (εt) and elastic modulus (Ec) of confined and unconfined concrete.
| Unconfined Concrete | Confined Concrete | |
|---|---|---|
| fc [MPa] | 21.1 | 35.7 |
| εc0 [‰] | 1.80 | 8.04 |
| εcu [‰] | 3.50 | 23.28 |
| fct [MPa] | 1.7 | 3.1 |
| εt [‰] | 0.056 | 0.086 |
| Ec [MPa] | 3.0·104 | 3.0·104 |
Table 4.
Total mass, first vibration period, reference peak ground acceleration, soil factor, spectral acceleration corresponding to first vibration mode from the elastic spectrum and design base shear–weight ratio of 4-, 8- and 11-storey buildings.
Table 4.
Total mass, first vibration period, reference peak ground acceleration, soil factor, spectral acceleration corresponding to first vibration mode from the elastic spectrum and design base shear–weight ratio of 4-, 8- and 11-storey buildings.
| Building | Total Mass (t) | Period T1 [s] | agD,R [g] | Soil Factor | Se,D(T1) [g] | Fb/W |
|---|---|---|---|---|---|---|
| 4-storey | 339 | 0.68 | 0.30 | 1.2 | 0.66 | 15.5% |
| 8-storey | 2338 | 1.21 | 0.25 | 1.15 | 0.36 | 7.7% |
| 11-storey | 10,221 | 1.67 | 0.25 | 1.2 | 0.23 | 5.2% |
Table 5.
Maximum base shear (Fmax), near-collapse roof displacement (dNC) and median spectral accelerations at first vibration period, causing a near-collapse limit state (Se,NC).
Table 5.
Maximum base shear (Fmax), near-collapse roof displacement (dNC) and median spectral accelerations at first vibration period, causing a near-collapse limit state (Se,NC).
| Building | Designed According to | Fmax [kN] | dNC [cm] | Se,NC [g] |
|---|---|---|---|---|
| 4-storey | B500B | 1113 | 40.0 | 2.84 |
| DPD2 | 1203 | 45.7 | 3.20 | |
| DPD2—designed as B500B | 1018 | 42.0 | 2.89 | |
| 8-storey | B500B | 2974 | 62.4 | 1.48 |
| DPD2 | 3273 | 65.0 | 1.49 | |
| DPD2—designed as B500B | 2672 | 64.9 | 1.42 | |
| 11-storey | B500B | 9402 | 69.7 | 0.91 |
| DPD2 | 9968 | 64.5 | 0.83 | |
| DPD2—designed as B500B | 8272 | 71.8 | 0.87 |
Publisher’s Note: MDPI stays neutral with regard to jurisdictional claims in published maps and institutional affiliations. |
© 2021 by the authors. Licensee MDPI, Basel, Switzerland. This article is an open access article distributed under the terms and conditions of the Creative Commons Attribution (CC BY) license (https://creativecommons.org/licenses/by/4.0/).
Share and Cite
MDPI and ACS Style
Žižmond, J.; Dolšek, M. Seismic Design and Performance Assessment of Frame Buildings Reinforced by Dual-Phase Steel. Appl. Sci. 2021, 11, 4998. https://doi.org/10.3390/app11114998
AMA Style
Žižmond J, Dolšek M. Seismic Design and Performance Assessment of Frame Buildings Reinforced by Dual-Phase Steel. Applied Sciences. 2021; 11(11):4998. https://doi.org/10.3390/app11114998
Chicago/Turabian StyleŽižmond, Jure, and Matjaž Dolšek. 2021. "Seismic Design and Performance Assessment of Frame Buildings Reinforced by Dual-Phase Steel" Applied Sciences 11, no. 11: 4998. https://doi.org/10.3390/app11114998
Note that from the first issue of 2016, this journal uses article numbers instead of page numbers. See further details here.