Abstract
In this study, we propose a computational fluid dynamics (CFD)-based method to study the lubrication and temperature characteristics of an intermediate gearbox with splash lubrication. A volume of fluid (VOF) multiphase model was used to track the interface between oil and air. A multiple reference frame (MRF) model was adopted to accurately simulate the movement characteristics of the gears, bearings, and the surrounding flow field. The thermal-fluid coupling computational model of an intermediate gearbox with splash lubrication was then established. Combined with experimental results, we verified that the lubricating oil temperature was below the limit requirement (<110 °C). The numerical results revealed that large amounts of lubricating oil were splashed onto the tooth surfaces near the gear meshing area. A large convective heat transfer coefficient corresponds to a low gear tooth surface temperature. The tooth surface temperature of the driving gear is higher than that of the driven gear. The distribution law of oil volume fraction of the bearing roller was jointly affected by the roller rotation direction and gravity. The convective heat transfer coefficient of the roller wall was largely related to the lubrication environment of the roller, including the oil distribution inside the bearing cavity and the flow rate.
1. Introduction
The transmission system, engine, and rotor system are the three critical dynamic components of a helicopter. The former is the only path of power transmission in a helicopter, and its performance can directly determine the service life of the helicopter [1]. One of the most important parts in a helicopter transmission system is the intermediate gearbox.
Splash lubrication [2,3,4] is widely used in intermediate gearboxes on account of its simplicity and reliability. Significant energy losses occur in the intermediate gearbox during operation, most of which are dissipated as heat. Predicting the temperature distribution of an intermediate gearbox is challenging, because the heat convection inside the gearbox is determined by the intermittent splashing behavior of the lubricating oil, which is relatively unknown. The splashing behavior can only be determined by experiments [5,6,7] or simulations that do not consider the effect of the flow field [5,6,8,9], which inevitably leads to design errors. Therefore, studying the lubrication and temperature characteristics of an intermediate gearbox under splash lubrication remains a significant challenge.
Over the past few decades, several scholars have studied the lubrication and temperature characteristics of gears and bearings. Li et al. [5,6] obtained the temperature field distribution of spur/helical gears due to frictional heat using a finite element parametric model. The simulation results were consistent with the experimental results. Jiang et al. [7] studied the flow characteristics around a ball bearing experimentally. They observed that the temperature of the bearing increased with the increase in the rotational speed of the bearing. Casanova et al. [8] performed a thermal contact analysis on plastic spur gears using a finite element model. However, they calculated the temperature distribution of the gears without considering the lubrication effect. Wang et al. [9] calculated the heat transfer coefficient of different spur gears surfaces using computational fluid dynamic (CFD) models. Subsequently, they predicted the temperature distribution of the spur gears using a finite element model. However, they did not consider the oil properties and friction state of the gears. Based on CFD, Hu et al. [10] established a numerical calculation model of spiral bevel gears with splash lubrication. They predicted the gear churning power loss and demonstrated the oil distribution inside the casing when the driving gear rotated 0.6 times. Li et al. [11] established a two-dimensional (2D) calculation model of splash lubrication for spur gearboxes, and analyzed the influence of the oil content, oil characteristics, and rotational speed on oil distribution using a dynamic mesh model. Arisawa et al. [12,13] studied the oil flow state of aero-engine bevel gearboxes with oil injection lubrication and calculated the churning power loss and windage power loss of the bevel gear. Deshpande et al. [14] predicted the temperature distribution of gears with oil jet lubrication using CFD. They observed that the lubrication effect was better when the oil was jetted outside the engagement. Yan et al. [15] clarified the internal fluid flow laws of high-speed ball bearings through simulations and experiments, and discussed the effects of three air supply modes and different rotational speeds on the air distribution, flow velocity, and heat dissipation inside the bearing. However, they did not consider the influence of the oil phase. Hu et al. [16] studied the air–oil two-phase flow inside an oil-injected lubricated ball bearing using CFD and measured the temperature of the outer ring. The air–oil two-phase flow distribution inside the bearing was uneven, and the lowest oil fraction appeared upstream, near the nozzle. Thus, the uneven distribution of air and oil must be considered when analyzing the heat transfer in oil-injected lubricated ball bearings. Wu et al. [17,18] investigated the flow and heat transfer characteristics of ball bearings with oil jet lubrication using CFD. They concluded that the bearing temperature was lower in areas with more oil.
Currently, CFD-based methods are widely used to predict the oil distribution in a gearbox/bearing. However, the existing research has limitations, such as the consideration of only oil injection lubrication, or the consideration of only a pair of gears or a single bearing, rather than the entire gearbox. Furthermore, due to the complex structure of an intermediate gearbox, time-consuming CFD calculations, and the uncertain convection heat transfer law associated with the intermittent behavior of lubricating oil, analyses on the temperature characteristics of an intermediate gearbox with splash lubrication are few. Therefore, detailed studies are required to improve our understanding.
In this study, we establish a CFD thermal-fluid coupling model of a helicopter intermediate gearbox with splash lubrication. Subsequently, a multiple reference frame (MRF) model is used to describe the rotational characteristics of the gears and bearings. The lubricating oil temperature and the lubrication and temperature characteristics of an intermediate gearbox with splash lubrication are obtained and discussed in detail.
2. Cooling Mechanism
Figure 1 shows the schematic diagram of an intermediate gearbox. It is mainly composed of spiral bevel gears, double row conical roller bearings, end covers, an air vent, and the casing. The oil is distributed at the bottom of the casing. Gears splash the oil onto the meshing location, the casing, and other solid surfaces. The air vent balances the atmospheric pressure inside and outside the casing. The bearings generate substantial heat and the gears cannot precisely transport oil to the bearing, therefore two oil guide pipes are present along the left and right end covers. The lubricating oil enters the bearing through the oil guide pipes, ensuring the proper lubrication of the bearing.
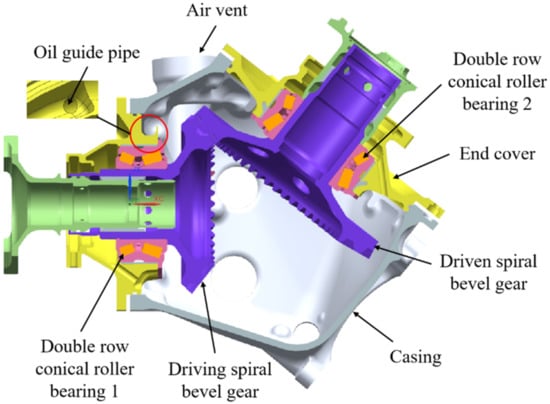
Figure 1.
Schematic diagram of an intermediate gearbox.
At the high rotational speeds of the spiral bevel gear, oil mixes with air, forming a complex oil–air flow inside the intermediate gearbox. The flow state of the oil and air varies with time, meaning that the convective heat transfer mechanism between the lubricating oil and the solid surface is extremely complicated. Primarily, three heat dissipation mechanisms occur in the intermediate gearbox—conduction, convection, and radiation—as shown in Figure 2. The effect of heat radiation is weak, so it is ignored. Conduction primarily occurs inside the solid and is not affected by the lubrication method. The lubrication and cooling mechanism of the various parts inside the casing using the splash lubrication method is not clear, i.e., the law of convective heat transfer is not clear. To address this shortcoming, this study analyzes the lubrication and temperature characteristics of gears and bearings with splash lubrication.
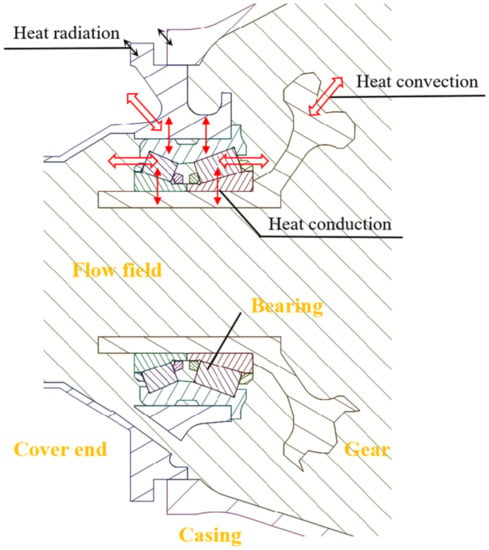
Figure 2.
Heat dissipation mechanisms.
3. Experimental Setup
Temperature experiments were performed to obtain the temperature distribution across the casing and the end covers of the intermediate gearbox, and the oil temperature in the oil pool was measured as well. The experimental setup consisted of a motor, couplings, torque speed sensors, a test intermediate gearbox, an eddy current loader, and an electric cabinet, as shown in Figure 3. The fundamental parameters of the spiral bevel gears and the double row conical roller bearings in the test intermediate gearbox are presented in Table 1 and Table 2, respectively.
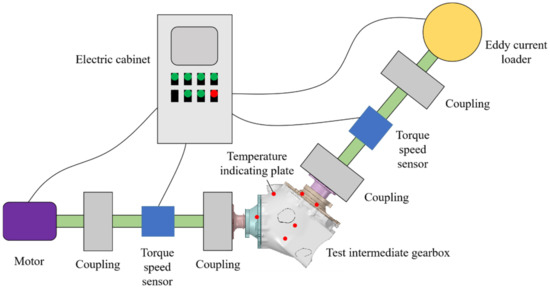
Figure 3.
Schematic of experimental setup.

Table 1.
Fundamental parameters of spiral bevel gears.

Table 2.
Fundamental parameters of double row conical roller bearings.
Splash lubrication was used in the intermediate gearbox. Before the experiment, lubricating oil was added to the casing through the oil filler until it reached the scale line. The sealing condition of each sealing part of the intermediate gearbox was checked to ensure that there was no leakage of the lubricant. The motor was started, and the speed value of the input sensor was allowed to stabilize at 5000 r/min, after which, the test was carried out until the oil temperature stabilized (i.e., the oil temperature did not change by more than 1 °C over 10–15 min). The experimental parameters are shown in Table 3. The wall temperatures of the casing and end covers were measured using a temperature indicating plate, and the oil temperature in the oil pool was measured using a thermocouple.

Table 3.
Experimental parameters.
The arrangement of the measuring points to measure the wall temperature of the casing and end covers using the temperature indicating plate are shown in Figure 4. A total of 12 measuring points were used: 1 and 2 are the measuring points on the end cover near the input bearing; 3, 4, 5, and 6 are the measuring points on the end cover near the output bearing; and 7, 8, 9, 10, 11, and 12 are the measuring points on the wall of the casing. The arrangement principle was to distribute them as evenly as possible, and the measuring points on the end covers were placed as close to the bearings as possible. The measured temperature was the surface temperature outside the casing and end covers. The experimental temperatures of the measured points are shown in Table 4.
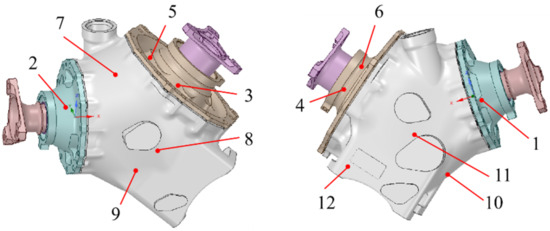
Figure 4.
Arrangement of measuring points. 1 and 2—measuring points on the end cover near the input bearing; 3, 4, 5, and 6—measuring points on the end cover near the output bearing; 7, 8, 9, 10, 11, and 12—measuring points on the wall of the casing.

Table 4.
Experimental temperatures of the measured points.
4. Numerical Setup
4.1. Volume of Fluid (VOF) Multiphase Model and Governing Equations
To track the interface between two immiscible fluids (oil and air), the VOF multiphase model presented by Hirt and Nichols [19] was applied herein. Several scholars [10,11,12,13,16,17,18] have used the VOF model to study the coexistence of oil and air phases. This is accomplished by solving the continuity equation of the volume fraction of the oil phase:
where αoil is the volume fraction of oil, ρoil is the oil density, and u is the velocity vector.
In the VOF model, the properties of the oil–air fluid, such as density, dynamic viscosity, and thermal conductivity, were calculated by averaging the volume fraction.
where φ is the property of the oil–air fluid, φoil is the property of oil, φair is the property of air, and αair is the volume fraction of air.
The continuity, momentum, fluid energy, and solid energy equations are [20]:
where ρf is the fluid density, μ is the fluid dynamic viscosity, kf is the thermal conductivity of the fluid, u is the velocity vector, p is the pressure, F is the external force, T is the temperature, E is the energy, and ks is the thermal conductivity of the solid.
The movements of the spiral bevel gears and double row conical roller bearings are extremely complicated, resulting in a complex two-phase flow and forming a turbulent phenomenon in the intermediate gearbox. The k–ε renormalization group (RNG) turbulence model can better replicate the high strain rate and large deformation flow and is suitable for rotating flow [21]. Many scholars [10,11,15,16,17,18,22] have adopted the RNG k–ε model to study the fluid flow characteristics in a gearbox or in a bearing cavity, and the simulation results are credible. Consequently, the RNG k–ε model developed by Orzag and Yakhot [23] was employed herein to simulate the turbulence. For near-wall treatment, standard wall functions were used.
4.2. Multiple Reference Frames (MRF) Model
The lubricating oil interacts with the high-speed gears, bearings, and surrounding flow field. Both dynamic and static areas exist inside the casing. To accurately simulate the movement characteristics of the gears, bearings, and the surrounding flow field, the MRF model [24] was used. The basic principle of the MRF model is for coordinate transformation. The MRF model converts the flow equation of motion into a rotating coordinate system, and provides a numerical solution in a relatively stationary rotating coordinate system.
The model of the intermediate gearbox is simplified as follows: (1) the assumed clearance between the rollers and raceway is 0.5 mm; (2) the distance between the driving gear and the driven gear is enlarged until each gear can be surrounded by the reference frame; (3) the cage is ignored and only the revolution of the bearing is considered. The rotating coordinate system is used to simulate the movement of the gears and bearings. As shown in Figure 5a, the fluid around the gears is relatively static within the reference frames 1 and 2. The rotational speed of the rotating coordinate system is equal to the rotational speed of the gear (driving gear is 5000 r/min and driven gear is 3804 r/min). In addition, because the bearing inner ring rotates at the same speed as the gear, the bearing inner ring is included in the reference frames 1 and 2. As shown in Figure 5b, the fluid around the small rollers and big rollers is relatively static within the reference frames 3 and 4. It should be noted that the rotation of the roller about its own axis was ignored. The rotational speed of the roller was regarded as the motion boundary of the reference frames 3 and 4, and is given by [25]:
where nw is the rotational speed of the roller, n is the rotational speed of the inner ring, Dw is the mean diameter of the roller, α is the bearing contact angle, and d is the pitch diameter of the bearing.
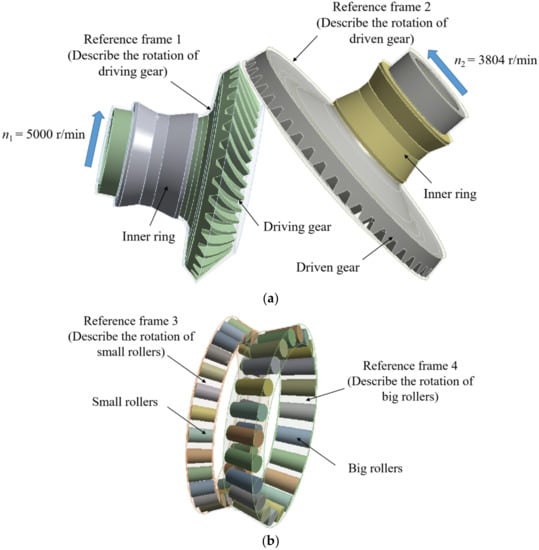
Figure 5.
Moving reference frames of the computational model: (a) moving reference frame for gears; (b) moving reference frame for bearings.
Kerdouss et al. [26] used the MRF model to simulate the motion characteristics of an impeller. Chen and Liu [27] used a multi-reference coordinate system to simulate the movement of gears with oil-injected lubrication and obtained the heat transfer law of an accessory gearbox. Numerous other studies have also used the MRF model [15,17,18]. However, these studies have primarily focused on oil-injected lubrication, and the MRF method has not yet been applied to splash lubrication, especially for complex models such as an intermediate gearbox. In this study, the VOF and MRF models were combined to study the lubrication and temperature characteristics of an intermediate gearbox with splash lubrication.
4.3. Computational Model and Mesh
The thermal-fluid coupling numerical computational model that includes both fluids and solids, and is shown in Figure 6. Its fundamental parameters are the same as those of the test intermediate gearbox (Table 1 and Table 2). The model was divided into a tetrahedral unstructured mesh using the ANSYS meshing software, as shown in Figure 7. The bearings and gears are the key heat-generating regions; therefore, the mesh was refined locally. Analyzing the mesh independence, as shown in Table 5, we concluded that the air flow rate change of the air vent could be controlled to within 2% when the number of mesh elements was between 10,589,597 and 15,206,765. A mesh density of 10,589,597 mesh elements was selected, because this satisfied the required calculation accuracy without wasting calculation resources. The final number of mesh elements in the computational model was 10,589,597, and the number of mesh nodes was 1,787,247.
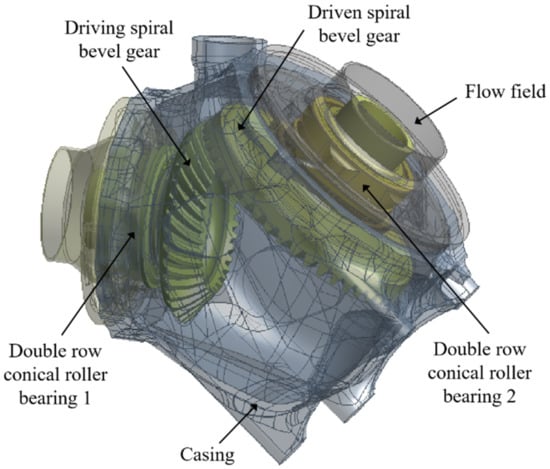
Figure 6.
Computational model.
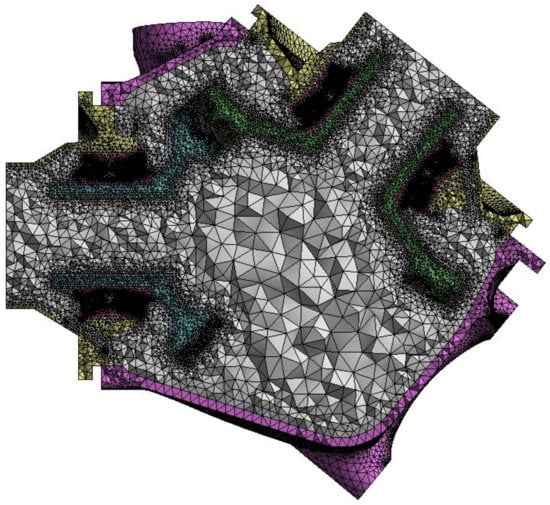
Figure 7.
Mesh diagram for thermal-fluid coupling computational model.

Table 5.
Mesh independence analysis.
4.4. Boundary Conditions
Gears generate significant amounts of frictional heat due to the relative sliding and rolling during the meshing process, including the sliding power loss and the rolling power loss. The formula proposed by Anderson–Loewenthal [28] was used to calculate the gear frictional heat in the intermediate gearbox.
The sliding power loss is:
where Ps is the sliding power loss, f is the friction coefficient, Fn is the average normal load, and vs is the average sliding speed.
The rolling power loss is:
where Pr is the rolling power loss, vr is the average rolling speed, h is the thickness of the elastohydrodynamic lubrication (EHL) oil film, b is the tooth width, εα is the gear end face coincidence degree, and βb is the helix angle of the gear base circle.
Gear churning power loss cannot be ignored for the splash lubrication method. The calculation formula for gear churning power loss proposed in the British Standard ISO/TR14179-1-2001 [29] was used herein. The influence factors considered in the formula are the lubricating oil viscosity, component diameter, gear wetting coefficient, and arrangement coefficient. The calculation accuracy is relatively high.
where Pch is the churning power loss, fg is the gear infiltration factor, υ is the kinematic viscosity of the lubricating oil at the operating temperature, ns is the gear rotational speed, D is the component diameter, b is the tooth width, Rf is the tooth surface roughness factor, β is the spiral angle, and Ag is the arrangement coefficient.
The overall heat source Q is:
Considering the differences in the material characteristics and the tangential speed at the meshing points of the driving and driven gears, the heat source input to the two gears is different. Consequently, the heat distribution coefficient γ [30] is introduced:
where λ is the gear thermal conductivity, ρ is the gear density, c is the specific heat capacity, ν is the tangential velocity at the meshing point, and the subscripts 1 and 2 represent the driving gear and driven gear, respectively.
The heat source inputs to the driving gear and driven gear, Q1 and Q2, respectively, are:
Palmgren’s method [31] was used to calculate the heat source of the bearing. Palmgren divided the friction torque of the bearing into the friction torque generated by the load and the friction torque generated by the viscosity of the lubricating oil. To simplify the calculation, this paper applies the bearing heat source calculated by Palmgren’s method to the inner ring raceway, the roller wall surface, and the outer ring raceway, according to the ratio of 1:2:1. In this study, all heat sources were applied to the corresponding contact zones in the form of volumetric heat sources, as boundary conditions [13]. The coupled thermal condition was adopted at the fluid–solid interface to simultaneously calculate heat convection and heat conduction. For the thermal boundary conditions outside the calculation domain, the convective heat transfer coefficient between the casing wall and the ambient air was set to 50 W/(m2·K).
The calculations were performed using commercial CFD software—FLUENT. The governing equations were discretized using the finite volume method. The main transport equations were discretized using the second-order upwind scheme. The PREssure STaggering Option (PRESTO!) discretization format was adopted for pressure interpolation under the high-speed vortex. The coupled method was used to couple the pressure and velocity fields. Figure 8 depicts the initial oil distribution of the intermediate gearbox. The initial oil immersion depth of the simulation was set as the same as that of the test intermediate gearbox using the patching oil level operation in FLUENT. The mixed oil–-air two-phase flow was formed inside the gearbox after the gear rotates. NATO O-155 oil was used herein. The oil properties at different temperatures, as shown in Table 6, were considered in the simulation. The calculation time with 48 CPU cores was about 2.5 days.
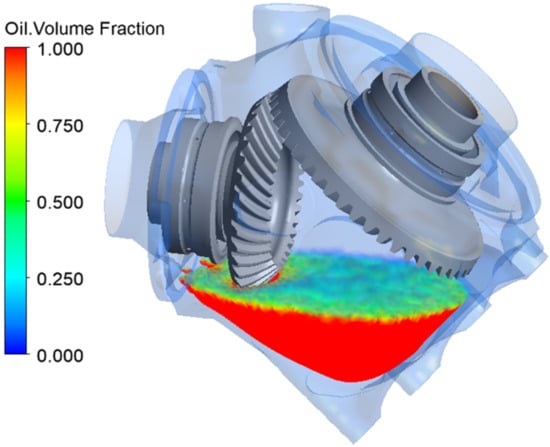
Figure 8.
Initial oil distribution.

Table 6.
Oil properties at different temperatures.
Figure 9 shows the flow chart of the coupled thermal-fluid approach. The fluid analysis calculation domain only includes the fluid domain. Considering the boundary conditions, such as the boundary velocity and the initial oil distribution, the continuity equation, momentum equation, and VOF continuity equation were solved to obtain the flow field of the splash lubrication, including the velocity and oil distribution. The results were transferred to the thermal analysis as the input, which affected the temperature distribution. The thermal analysis calculation domain included both the fluid domain and the solid domain. Considering the thermal boundary conditions, such as the heat generated by the gears and bearings and the convection heat transfer coefficient outside the calculation domain, the fluid/solid energy equations were solved to obtain the fluid and solid temperatures of splash lubrication. The changes in temperature affected the physical parameters of the fluid, which affected the flow field, and the results of the thermal analysis were transferred to the flow field analysis. The above process was repeated until convergence, and the flow field and temperature distribution of the intermediate gearbox with splash lubrication were obtained.
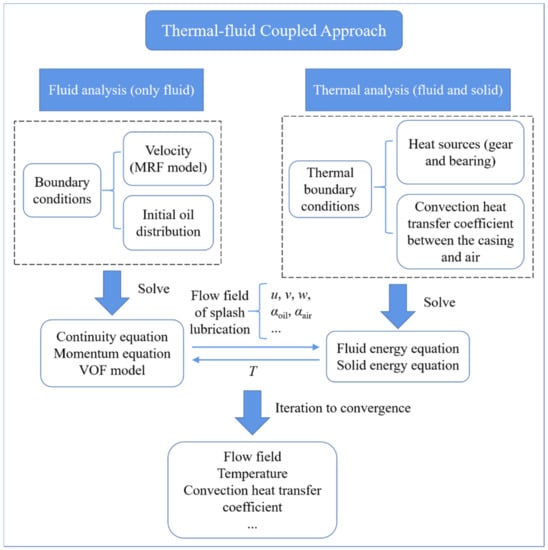
Figure 9.
Flow chart of the coupled thermal-fluid approach. (MRF model refers to multiple reference frames (MRF) model, and VOF model refers to volume of fluid (VOF) multiphase model.)
5. Results and Discussion
5.1. Experimental Results
Figure 10 shows the temperature distribution of the casing and end covers obtained from the CFD simulation calculations. The heat generated by the input bearing was high, therefore the end covers near the input bearing appeared as local high-temperature areas. The temperature gradually decreased from the top to the bottom of the casing. In the temperature experiment, the wall temperatures of the casing and the end covers of the intermediate gearbox were recorded using the temperature indicating plate. The 1~12 numbers in Figure 10 represent the measured points at the same position as the experimental temperature measured points (Figure 4). Figure 11 compares the CFD and experimental data. The maximum relative error was 10.636%, which occurred at measuring point 2, and the minimum relative error was 0.837%, which occurred at measuring point 12.
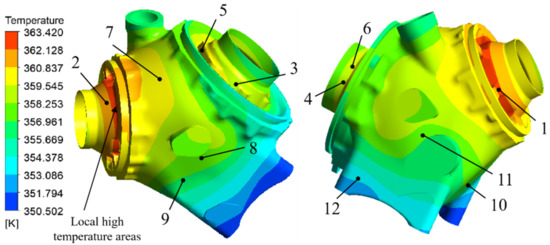
Figure 10.
Temperature distribution of casing and end covers.
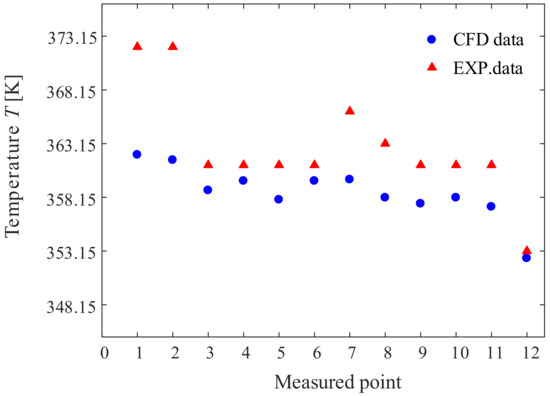
Figure 11.
Comparison of computational fluid dynamics (CFD) and experimental (EXP) data.
The oil temperature in the oil pool recorded during the experiment was 96.1 °C. The oil temperature at the corresponding position calculated by the FLUENT software was 99.156 °C. This represented a relative error of only 3.18%. Furthermore, the oil temperature satisfied the limit requirement (<110 °C) and the content of oil met the engineering application standard. These comparisons between the CFD and experimental data showed that the CFD simulation can well predict the temperature distribution of the intermediate gearbox with splash lubrication.
5.2. Flow Field
Figure 12 shows some of the flow field distribution characteristics of the intermediate gearbox with splash lubrication. As shown in Figure 12a, there are obvious low-speed and high-speed areas in the fluid inside the intermediate gearbox. The fluid velocity near the driving gear reached a maximum of 55.932 m/s, while the fluid velocity in the gear meshing region was also large. The green region in Figure 12b is the vortex core, which was the dense area of vorticity (the vorticity of the velocity field) inside the vortex. A large-scale vortex existed near the gears and a small-scale vortex existed near the bearings. The violent fluid flow can cause forced convection between the gears and bearings, extracting most of the heat away from the surface.
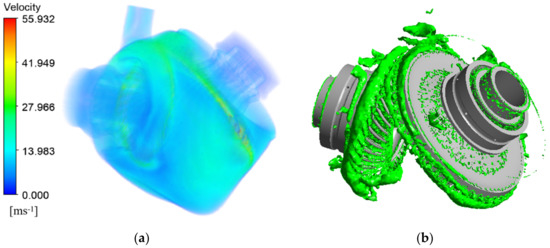
Figure 12.
Flow field distribution characteristics: (a) fluid velocity volume rendering; (b) vortex core region.
5.3. Lubrication and Temperature Characteristics of Gears
In splash lubrication, the lubrication and temperature characteristics of the gears are affected by the volume fraction of the lubricating oil attached to the tooth surface. However, it is difficult to quantitatively measure the lubrication condition of the tooth surface through experiments, and consequently, the influence law has not been studied thoroughly. To better understand the effect of splash lubrication on the lubrication and temperature characteristics of a tooth surface, nine tooth surfaces (0°, 45°, 90°, …, 360°) were selected along the direction of rotation of the gear with the meshing surface as the starting point for quantitative analysis, as shown in Figure 13.
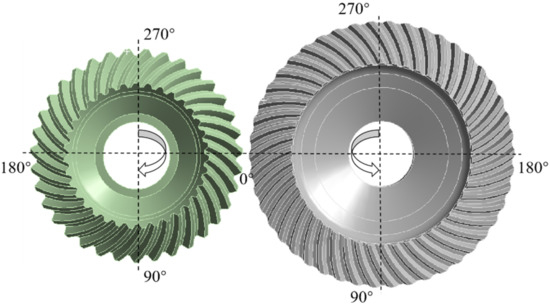
Figure 13.
Azimuth angle of gears.
5.3.1. Lubrication Characteristics of Gears
Figure 14 illustrates the oil volume fraction of the gear tooth surfaces. As shown, at an azimuth angle of 90°, the oil volume fraction of the tooth surface is large; at an azimuth angle of 225–270°, the oil volume fraction of the tooth surface is small. In splash lubrication, large amounts of lubricating oil are splashed onto the tooth surface near the gear meshing area, thereby lubricating and cooling the gear meshing area where the highest amount of frictional heat is generated.
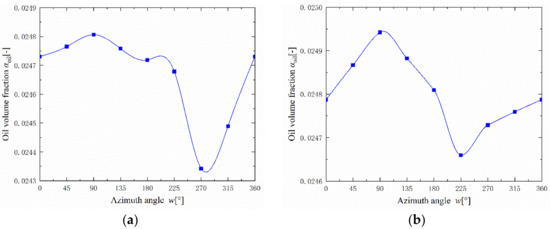
Figure 14.
Oil volume fraction of gear tooth surfaces: (a) driving gear; (b) driven gear.
5.3.2. Temperature Characteristics of Gears
Figure 15 shows the temperature characteristics of the driving and driven gears. Figure 15a,b show the driving gear with an azimuth angle of 270–360°. As shown in Figure 15a, compared to the smaller end, the convective heat transfer coefficient of the larger end of the tooth surface is higher. This is because the linear velocity of the larger end is higher than that of the smaller end, resulting in a high fluid velocity near the larger end. As shown in Figure 15b, the temperature distribution across the tooth surface is uneven, and the temperature of the tooth surface near the larger end is high. This is because the tooth surface of the driving gear at the smaller end and the spoke is at an obtuse angle θ1, while that at the larger end and the spoke is at an acute angle θ2. The heat at the acute angle concentrates easily, and the heat dissipation effect at the acute angle is worse than that at the obtuse angle. As shown in Figure 15c,d, a large convective heat transfer coefficient corresponds to a low gear tooth surface temperature. The average temperature of the tooth surface at an azimuth angle of 0–90° or 270–360°, which is close to the gear meshing area, is high, while that at an azimuth angle of 180–225° is low. The tooth surface temperature of the driving gear is higher than that of the driven gear because the heat output per unit area of the driving gear is larger.
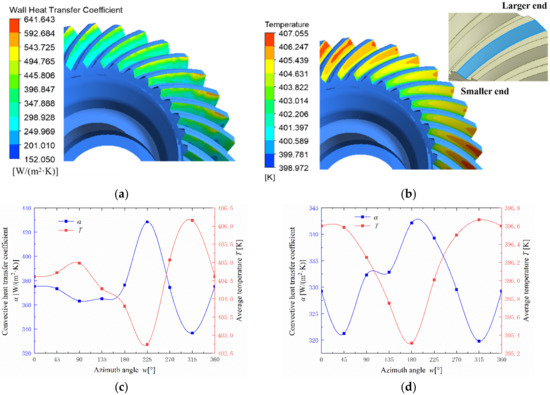
Figure 15.
Temperature characteristics of gears: (a) convective heat transfer coefficient of driving gear tooth surface; (b) temperature of driving gear tooth surface; (c) temperature characteristics of driving gear tooth surface; (d) temperature characteristics of driven gear tooth surface.
5.4. Lubrication and Temperature Characteristics of Bearings
In splash lubrication, some of the lubricating oil splashed on to the gear flows into the oil guide pipe to lubricate and cool the bearings. The temperature characteristics of the bearing are largely related to the lubrication effect, and the lubrication and cooling laws of the bearing are different for different lubrication modes. Most existing research on the lubrication and temperature characteristics of bearings are focused on oil injection lubrication [16,17,18] and under-race lubrication [22]. In this study, we used bearing 1 as an example to clarify the lubrication and temperature characteristics of bearings with splash lubrication.
5.4.1. Lubrication Characteristics of Bearings
Figure 16 illustrates the lubrication characteristics of the bearing rollers. Figure 16a shows that the oil content of rollers is high at the azimuth angle of 180°, because the oil easily flows to the bottom by gravity. As shown in Figure 16b,c, at the right side of oil guide pipe 1 until the azimuth angle is 180°, the oil volume fraction of the rollers increases gradually. At the azimuth angle of 180° to oil guide pipe 2, the lubricating oil droplets fall due to gravity, and the oil volume fraction of the rollers decreases gradually in this range. On the right side of oil guide tube 2, the oil volume fraction of the rollers rises slowly. It can be seen that due to the influence of the rollers’ rotation, the lubricating oil flowing out of the pipe flows in a clockwise direction, that is, the lubricating oil flows in the direction of rotation of the rollers.
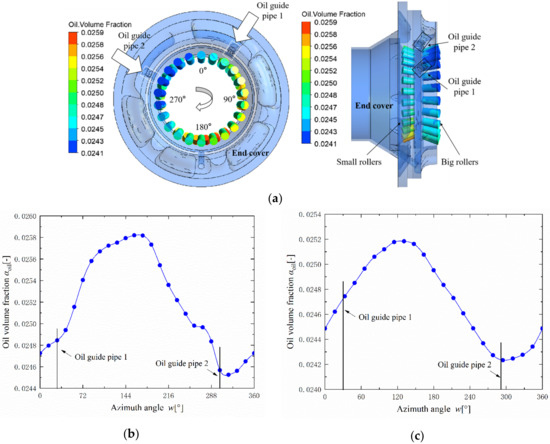
Figure 16.
Lubrication characteristics of bearing rollers: (a) azimuth angle of rollers; (b) oil volume fraction of small rollers; (c) oil volume fraction of big rollers.
The raceways of the inner and outer rings of the bearing are the key areas that are in direct contact with the rollers, and were analyzed in detail. Figure 17 shows the oil volume fraction of the raceways. As shown in Figure 17a, the oil content in the left raceway of the inner ring was higher than that in the right raceway of the inner ring. This is because the number of small rollers was larger and the stirring effect on the oil was stronger. As shown in Figure 17b, the outer ring was stationary, and the lubricating oil was deposited beneath the outer ring due to gravity.
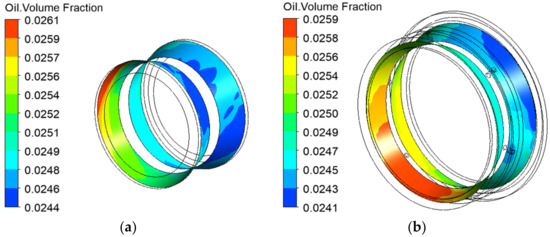
Figure 17.
Oil volume fraction of raceways: (a) inner ring; (b) outer ring.
5.4.2. Temperature Characteristics of Bearings
Figure 18 illustrates the temperature characteristics of the bearing rollers. The convective heat transfer coefficients differed at different positions on the rollers (Figure 18a). The temperature distribution of the small roller was more uniform, while the temperature difference of the big roller was larger (Figure 18b). As shown in Figure 18c,d, rollers with a higher convective heat transfer coefficient had a lower temperature. In splash lubrication, due to the comprehensive influence of heat convection and conduction, the temperature characteristics of the rollers at different azimuth angles were different. Compared to Figure 16b,c, there is no correlation between the roller temperature and the oil volume fraction on its surface. For example, the oil volume fraction on the wall of the small rollers at azimuth angles of 144–216° was high, and their temperature was also high. This is because the convective heat transfer coefficient of the roller wall is largely related to the lubrication environment of the roller, including the oil distribution inside the bearing cavity and the flow rate. Furthermore, the convective heat transfer coefficient and temperature of the rollers are not determined solely by the oil volume fraction of the roller wall. Additionally, this phenomenon appears in reference 18: there is no correlation between the temperature of the three test points of the bearing outer ring and the oil volume fraction in the bearing cavity obtained by simulation, and the lowest temperature of the outer ring measuring point is where the lubricating oil content of the bearing cavity is low.
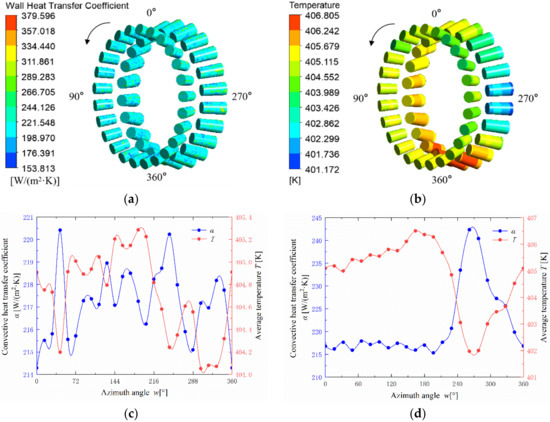
Figure 18.
Temperature characteristics of bearing rollers: (a) convective heat transfer coefficient of rollers; (b) temperature of rollers; (c) temperature characteristics of small rollers; (d) temperature characteristics of big rollers.
The raceways of the inner and outer rings of the bearing are the key locations for frictional heat generation and are prone to the occurrence of high-temperature areas. Consequently, a detailed analysis was performed. Figure 19 shows the temperature characteristics of the raceways. The axial section of the inner and outer rings of the bearing changes with the change in axial position, leading to differences in the heat conduction effect as well. The temperature of the bearing raceway under the combined influence of heat convection and conduction is shown in Figure 19b,d. The temperature of the middle portion of the inner ring raceway was high, while that of the upper portion of the outer ring was also high. To reduce the temperature of the outer ring, the contact area between the upper portion of the outer ring and the other solid should be increased, to enhance heat conduction.
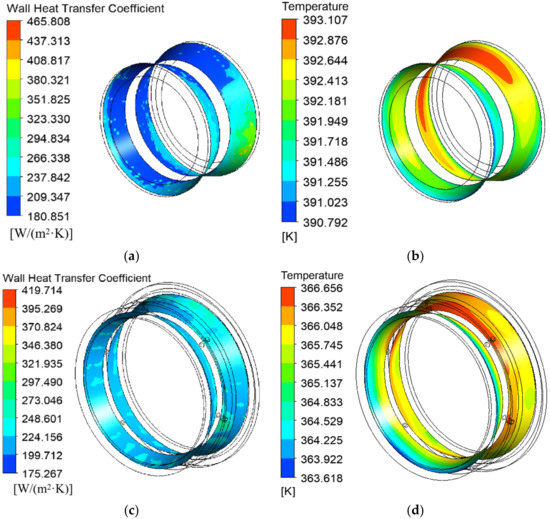
Figure 19.
Temperature characteristics of raceways: (a) convective heat transfer coefficient of inner ring; (b) temperature of inner ring; (c) convective heat transfer coefficient of outer ring; (d) temperature of outer ring.
6. Conclusions and Future Work
A numerical method was proposed to study the lubrication and temperature characteristics of an intermediate gearbox with splash lubrication. The temperature distribution was obtained through CFD simulations and experiments. Further numerical computations were performed to examine the flow details and the lubrication and temperature characteristics. The major conclusions are as follows:
- The maximum relative error between the experimental and simulation results of the wall temperature of the casing and end covers was 10.636%. The relative error between the experimental and simulation results of the oil temperature in the oil pool was 3.180%. The oil temperature satisfied the limit requirement (<110 °C), and the oil content met the engineering application standard. The results indicate that CFD simulations can accurately predict the temperature distribution of an intermediate gearbox with splash lubrication.
- In splash lubrication, large amounts of lubricating oil are splashed onto the tooth surface near the gear meshing area to lubricate and cool it, because the gear meshing area experiences the highest amount of frictional heat generation. A large convective heat transfer coefficient corresponds to a low gear tooth surface temperature. The tooth surface temperature of the driving gear is higher than that of the driven gear, because the heat output per unit area of the former is higher.
- The lubricating oil flows in the direction of rotation of the roller. Rollers with a large convective heat transfer coefficient have a lower temperature. The convective heat transfer coefficient of the roller wall is largely related to the lubrication environment of the roller, including the oil distribution inside the bearing cavity and the flow rate. Therefore, the convective heat transfer coefficient and temperature of the rollers are not determined solely by the oil volume fraction of the roller wall.
This study can serve as a reference to improve lubrication and reduce the temperature rise in a gearbox with splash lubrication, such as an intermediate gearbox.
Author Contributions
Conceptualization, F.L.; methodology, F.L. and M.W.; simulation, M.W.; experiment, W.P. and W.G.; validation, F.L., M.W. and W.P.; data curation, F.L.; writing—original draft preparation, F.L. and M.W.; writing—review and editing, F.L. and M.W.; supervision, F.L. and H.B.; project administration, F.L.; funding acquisition, F.L. All authors have read and agreed to the published version of the manuscript.
Funding
This research was funded by the National Natural Science Foundation of China, grant number 52075241.
Institutional Review Board Statement
Not applicable.
Informed Consent Statement
Not applicable.
Data Availability Statement
No new data were created or analyzed in this study. Data sharing is not applicable to this article.
Conflicts of Interest
The authors declare no conflict of interest.
References
- Ding, W.Q. Helicopter transmission system overview. J. Aerosp. Power 2018, 3, 65. [Google Scholar]
- Bartz, W. Lubrication of Gearing; Expert Verlag: London, UK, 1993; pp. 427–430. [Google Scholar]
- Townsend, D. Dudley’s Gear Handbook, 2nd ed.; McGraw-Hill: New York, NY, USA, 1992; pp. 15.1–15.5. [Google Scholar]
- Neurouth, A.; Changenet, C.; Ville, F.; Octrue, M.; Tinguy, E. Experimental Investigations to Use Splash Lubrication for High-Speed Gears. J. Tribol. 2017, 139, 061104. [Google Scholar] [CrossRef]
- Li, W.; Tian, J. Unsteady-state temperature field and sensitivity analysis of gear transmission. Tribol. Int. 2017, 116, 229–243. [Google Scholar] [CrossRef]
- Li, W.; Zhai, P.; Ding, L. Analysis of Thermal Characteristic of Spur/Helical Gear Transmission. J. Therm. Sci. Eng. Appl. 2018, 11, 021003. [Google Scholar] [CrossRef]
- Jiang, S.; Mao, H. Investigation of the High Speed Rolling Bearing Temperature Rise with Oil-Air Lubrication. J. Tribol. 2011, 133, 021101. [Google Scholar] [CrossRef]
- Roda-Casanova, V.; Sanchez-Marin, F.; Porras-Vazquez, A. A fast finite element based methodology to predict the temperature field in a thermoplastic spur gear drive. In Proceedings of the Volume 8: 29th Conference on Mechanical Vibration and Noise, Cleveland, OH, USA, 6–9 August 2017; p. 67724. [Google Scholar]
- Wang, Y.; Niu, W.; Chen, Y.; Song, G.; Tang, W. Convection heat transfer and temperature analysis of oil jet lubricated spur gears. Ind. Lubr. Tribol. 2016, 68, 624–631. [Google Scholar] [CrossRef]
- Hu, X.; Jiang, Y.; Luo, C.; Feng, L.; Dai, Y. Churning power losses of a gearbox with spiral bevel geared transmission. Tribol. Int. 2019, 129, 398–406. [Google Scholar] [CrossRef]
- Li, L.; Versteeg, H.K.; Hargrave, G.K.; Potter, T.; Halse, C. Numerical Investigation on Fluid Flow of Gear Lubrication. SAE Int. J. Fuels Lubr. 2008, 1, 1056–1062. [Google Scholar] [CrossRef]
- Arisawa, H.; Nishimura, M.; Imai, H.; Goi, T. CFD simulation for reduction of oil churning loss and windage loss on aeroengine transmission gears. ASME turbo expo 2010: Turbine technical conference and exposition. Am. Soc. Mech. Eng. 2010, GT2009-59226, 63–72. [Google Scholar]
- Arisawa, H.; Nishimura, M.; Imai, H.; Goi, T. Computational Fluid Dynamics Simulations and Experiments for Reduction of Oil Churning Loss and Windage Loss in Aeroengine Transmission Gears. J. Eng. Gas Turbines Power 2014, 136, 092604. [Google Scholar] [CrossRef]
- Deshpande, S.; Joshi, H.; Madhavan, J.; Mason, P.; Wink, C. Two-Way Coupled CFD Approach for Predicting Gear Temperature of Oil Jet Lubricated Transmissions. SAE Int. J. Commer. Veh. 2018, 11, 163–170. [Google Scholar] [CrossRef]
- Yan, K.; Dong, L.; Zheng, J.; Li, B.; Wang, N.; Sun, Y. Flow performance analysis of different air supply methods for high speed and low friction ball bearing. Tribol. Int. 2018, 121, 94–107. [Google Scholar] [CrossRef]
- Hu, J.; Wu, W.; Wu, M.; Yuan, S. Numerical investigation of the air–oil two-phase flow inside an oil-jet lubricated ball bearing. Int. J. Heat Mass Transf. 2014, 68, 85–93. [Google Scholar] [CrossRef]
- Wu, W.; Hu, C.; Hu, J.; Yuan, S.; Zhang, R. Jet cooling characteristics for ball bearings using the VOF multiphase model. Int. J. Therm. Sci. 2017, 116, 150–158. [Google Scholar] [CrossRef]
- Wu, W.; Hu, C.; Hu, J.; Yuan, S. Jet cooling for rolling bearings: Flow visualization and temperature distribution. Appl. Therm. Eng. 2016, 105, 217–224. [Google Scholar] [CrossRef]
- Hirt, C.; Nichols, B. Volume of fluid (VOF) method for the dynamics of free boundaries. J. Comput. Phys. 1981, 39, 201–225. [Google Scholar] [CrossRef]
- Anderson, J.D. Computational Fluid Dynamics: The Basics with Applications; McGraw-Hill: New York, NY, USA, 1995; pp. 60–74. [Google Scholar]
- Xiao, J.L.; Zhu, E.Q.; Wang, G.D. Numerical simulation of emergency shutdown process of ring gate in hydraulic turbine runaway. ASME J. Fluids Eng. 2012, 134, 124501. [Google Scholar] [CrossRef]
- Wenjun, G.; Daniel, N.; Kun, L. A multiphase computational study of oil distribution inside roller bearings with under-race lubrication. Tribol. Int. 2019, 140, 105862. [Google Scholar]
- Orszag, S.A.; Yakhot, V.; Flannery, W.S.; Boysan, F.; Choudhury, D.; Maruzewski, J.; Patel, B. Renormalization group modeling and turbulence simulations. In International Conference on Near-Wall Turbulent Flows; Hans: Tempe, AZ, USA, 1993. [Google Scholar]
- Luo, J.Y.; Issa, R.I.; Gosman, A.D. Prediction of impeller-induced flows in mixing vessels using multiple frames of reference. IChemE Symp. Ser. 1994, 136, 549–556. [Google Scholar]
- Harris, T.A.; Kotzalas, M.N. Rolling Bearing Analysis, 5th ed.; Taylor & Francis: New York, NY, USA, 2006. [Google Scholar]
- Kerdouss, F.; Bannari, A.; Proulx, P. CFD modeling of gas dispersion and bubble size in a double turbine stirred tank. Chem. Eng. Sci. 2005, 61, 3313–3322. [Google Scholar] [CrossRef]
- Chen, Y.X.; Liu, W.J. Accessory gearbox temperature field analysis considering fuel injection lubrication. J. Beijing Univ. Aeronaut. Astronaut. 2015, 41, 1171–1176. [Google Scholar]
- Anderson, N.E.; Loewenthal, S.H. An analytical method to predict of aircraft gear boxes. Technical memorandum NASA–TM–83716 (N84–25606). 1984. Available online: https://arc.aiaa.org/doi/10.2514/6.1984-1500 (accessed on 1 November 2020).
- BS ISO/TR 14179-1. Gears–Thermal Capacity; British Standards Institution: London, UK, 2001. [Google Scholar]
- Barber, J.R. Distribution of heat between sliding surfaces. Proc. Inst. Mech. Eng. Part C 1967, 9, 351–354. [Google Scholar] [CrossRef]
- Palmgren, A. Ball and Roller Bearing Engineering, 3rd ed.; SKF Industries Inc.: Philadelphia, PA, USA, 1959; pp. 34–41. [Google Scholar]
Publisher’s Note: MDPI stays neutral with regard to jurisdictional claims in published maps and institutional affiliations. |
© 2020 by the authors. Licensee MDPI, Basel, Switzerland. This article is an open access article distributed under the terms and conditions of the Creative Commons Attribution (CC BY) license (http://creativecommons.org/licenses/by/4.0/).