Abstract
Ultrashort optical pulses can trigger a variety of non-equilibrium processes in magnetic thin films affecting electrons and spins on femtosecond timescales. In order to probe the charge and magnetic degrees of freedom simultaneously, we developed an X-ray streaking technique that has the advantage of providing a jitter-free picture of absorption cross-section changes. In this paper, we present an experiment based on this approach, which we performed using five photon probing energies at the Ni -edges. This allowed us to retrieve the absorption and magnetic circular dichroism time traces, yielding detailed information on transient modifications of electron and spin populations close to the Fermi level. Our findings suggest that the observed absorption and magnetic circular dichroism dynamics both depend on the extreme ultraviolet (XUV) probing wavelength, and can be described, at least qualitatively, by assuming ultrafast energy shifts of the electronic and magnetic elemental absorption resonances, as reported in recent work. However, our analysis also hints at more complex changes, highlighting the need for further experimental and theoretical studies in order to gain a thorough understanding of the interplay of electronic and spin degrees of freedom in optically excited magnetic thin films.
1. Introduction
Since its discovery by Beaurepaire and coworkers in 1996 [1], the phenomenon of laser-induced ultrafast demagnetization has attracted worldwide attention and initiated an entirely new research field [2]. However, despite more than 20 years of ongoing experimental and theoretical work, the mechanisms underlying the femtosecond magnetization dynamics in ferromagnetic films following ultrafast optical excitation remain intensively debated [3,4,5,6,7]. The problem is interesting from a fundamental perspective—to date, it is not clear how angular momentum is transferred between the spin and electron systems and the crystalline lattice on sub-picosecond time scales—but it is also technologically relevant, as using light to steer magnetization on sub-ps timescales might pave the way for ultrafast all-optical spintronics and data storage [8,9,10]. Recent developments illustrating the application potential of ultrafast optical excitations include, for example, the creation of artificial neural networks [11], or the demonstration that focusing grating couplers can be used for photonic–electronic integration with magnetoresistive random access memory technology [12].
X-ray experiments are an ideal tool to study the dynamics of the spin, electron, and phonon sub-systems, since they combine high spatial resolution and element selectivity. In general, time-resolved scattering and absorption experiments mainly focus on spin and lattice dynamics, yielding information about superdiffusive spin currents [13,14,15,16], the role of spin-orbit coupling [17], the interaction of different magnetic sublattices [18], and the link between lattice and spin dynamics [19,20,21]. So far, only few studies have simultaneously looked at electron and spin dynamics [17,22,23,24]. Indeed, performing pure absorption measurements at X-ray free electron lasers (FELs) has been challenging, due to intrinsic fluctuations of the photon parameters and the lack of a reliable and linear incident intensity monitor [25]. However, motivated by time-resolved absorption experiments performed at femtoslicing facilities [17,22], as well as time- and spin-resolved photoelectron spectroscopy at high harmonic generation (HHG) sources [26,27], new technical advances were recently made to probe X-ray absorption dynamics using FEL [25,28,29,30,31] and HHG [32,33], thereby laying the ground for a systematic analysis of charge and spin dynamics [30,34].
Within this context, the investigation of the impact of the probing energy on the measured absorption and magnetic circular dichroism (MCD) dynamics has attracted increasing interest [35,36,37]. In a recent study, Yao et al. [34] provided experimental and theoretical evidence for an electronic and magnetic elemental absorption resonance redshift on ultrafast timescales. Unfortunately, the use of an HHG setup in this study [34] results in photon energies separated by approximately 3 eV, which impedes a detailed investigation of the absorption edge itself. To circumvent this shortcoming, we employed X-ray streaking at the extreme ultraviolet (XUV)-FEL at FERMI in Italy, to probe five energies at the Ni -edges (spanning from 64 to 68 eV). Our results confirm that absorption and MCD spectra are shifting but also hint at a more complicated scenario involving changes in spectra shapes after optical excitation. This calls for additional systematic experimental studies and in-depth theoretical calculations.
2. Experiment
The sample used in our experiment is a Ni(20 nm)/FeNi(10 nm)/Ni(20 nm) trilayer deposited via magnetron sputtering on top of Ta(3 nm)-covered SiN(30 nm) membranes. A final Pt(3 nm) capping was used to prevent oxidation (Figure 1). The magnetic layers are polycrystalline and exhibit an in-plane anisotropy with a square magnetic hysteresis loop and a coercive field of 8 mT. Note that the presence of the FeNi layer was required for a different femtomagnetism study but is not relevant for the outcome of the present work. Indeed, we would like to emphasize that Ni atoms in the alloy layer make up a total equivalent thickness of only 5 nm, to be compared with 40 nm of pure Ni. Alloyed Ni thus only contributes ≃10% to the total absorption signal. For comparison, we used NiFe layers with equal thickness placed at different depths (e.g., Ni(10 nm)/NiFe(10 nm)/Ni(30 nm)). Measurements on these samples yielded the same absorption time traces.
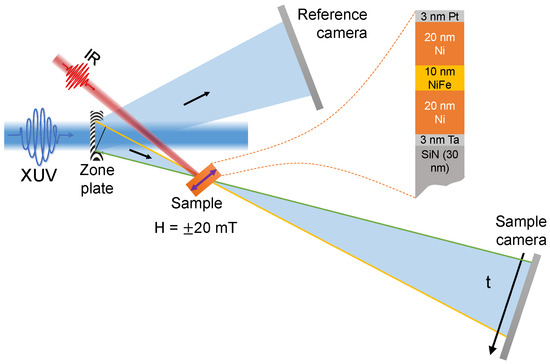
Figure 1.
Experimental setup and sample composition. A circularly polarized extreme ultraviolet (XUV) beam is diffracted using a zone plate. The positive, first diffraction order is focused on an in-plane magnetized sample, which is pumped using linear infrared pulses. The sample camera records the intensity transmitted through the sample I, resulting in a spatial encoding of the time traces. The reference camera records the incident intensity .
The experiments, based on our recently developed X-ray streaking technique [29], were performed at the DiProI end-station [38] of the seeded XUV-FEL at FERMI in Elettra, Trieste [39]. The setup employed in our study is shown in Figure 1. As described in detail previously [29], our approach is based on the use of a nearly collimated XUV beam with circular polarization, which illuminates an off-axis zone-plate. The converging first order emanating from the zone-plate passes through the sample and its intensity distribution is collected by a charge-coupled device (CCD) camera (sample camera). As shown in Figure 1, the photons detected at the bottom of this camera (yellow line) have traveled a longer path than the ones arriving at the top (green line). This results in a 2.6 ps time difference at the zone plate focus, which becomes spatially encoded in the sample camera. Note that optical geometry-induced contributions to the temporal resolution are as low as 2.5 fs and can be neglected here. To measure the shot-to-shot variations of the incident X-ray pulses, a second CCD detector (reference camera) is used to record the diverging first negative order. By dividing the sample camera with the reference camera picture, we obtain a measure for the transmission of the sample , where I is the photon intensity after, and the one before the sample. Angular integration of the intensity ratio pictures [29] eventually yields the transmission time traces shown in Figure 2a.
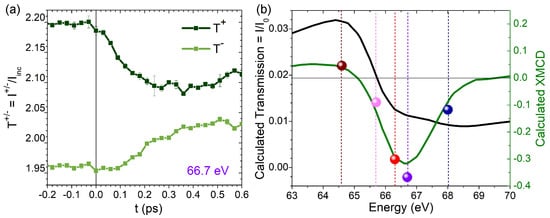
Figure 2.
Characteristic pump-induced changes of and on fs timescales and static energy-dependent transmission and magnetic circular dichroism (MCD). (a) Transmitted intensity time traces measured for both applied field directions obtained for eV. (b) Calculated transmission (black) and MCD (green) compared with experimental static MCD (colored dots).
In order to be sensitive to the in-plane magnetization of the Ni layer, the sample was tilted by 18° with respect to the incident beam. To ensure saturation of the magnetization for each pump-probe measurement, an in-plane magnetic field of ±20 mT was applied by using an electromagnet. The sample was excited by an 800 nm infrared (IR) laser delivering 60 fs pulses using an incident fluence of 5 mJ/cm, and probed by circularly polarized 70 fs XUV pulses, with an intensity at the sample plane well below the excitation regime [40]. In the sample plane, the size of the IR spot was ≃ 250 × 165 m (FWHM), significantly larger than the XUV spot size ≃ 130 × 70 m (FWHM). The experiment was performed at 50 Hz. To probe the absorption and MCD around the Ni resonances, we used five probing XUV wavelengths with energies of 64.6, 65.7, 66.3, 66.7 and 68 eV. For each energy, we recorded CCD images by accumulation of 150 to 250 shots with and without an IR pump for both applied magnetic field directions and both XUV helicities. Note that the CCDs employed in our study cannot be read out at 50 Hz, and that we use the same number of accumulated shots on the reference and the sample camera to perform the normalization. For symmetry reasons, reversing the XUV probe beam helicity is equivalent to a reversal of the applied magnetic field direction. This allows us to average the measured curves, resulting in two transmitted intensities . We grouped the data such as to obtain a data point every 30 fs, and the error bars presented in all our figures reflect this grouping and averaging procedure.
Typical transmitted intensity time traces are plotted in Figure 2a for an XUV energy of 66.7 eV and both external field directions (dark green) and (light green). As expected, the thin film is excited on sub-ps timescales; the difference between and is quickly decreasing after , which reflects the strong transient modifications of the magnetic properties of the system.
To quantify these changes, data can be used to calculate the absorption and the , which are related to the electronic occupation and to the spin state of our magnetic layer, respectively. We therefore use , and [41]. Quantities extracted from pumped data will be denoted , , and , while static data will be labeled , , and . In order to compare data measured using different XUV energies, we need to look at the relative changes , and . Here, the prefix is used as a short notation for a subtraction of the static signal, e.g., .
Due to different IR filters used in front of the cameras, experimental transmission data are only known up to a prefactor. This can be seen in Figure 2a, where the transmission is superior to 1, which is of course at odds with the fact that the beam intensity is weakened via absorption. To correct this artifact, we use the calculated transmission shown in Figure 2b (dark curve) to rescale our data and obtain the proper relative absorption. The calculated transmission and MCD curves presented in Figure 2b have been obtained using tabulated values (CXRO website [42]) for SiN, Ta, and Pt, which were combined with literature data for Ni and Fe [43]. Comparison of the calculated MCD signal (green curve in Figure 2b) with our static experimental (colored dots) yields good agreement for each energy scrutinized in the present study (Figure 2b) (note that the experimental MCD spectrum does not need to be rescaled since the constant pre-factors cancel out as shown in Equation (1)). The following equations summarize our approach, and all data presented in the remainder of this work are based on these calculations:
3. Results
Figure 3 shows the relative absorption for both field directions, obtained using 5 different XUV wavelengths. For all these probing energies, we observe an increase of the relative absorption for majority electrons (, dark green), while the relative minority electron absorption (, light green) increases for 64.6, 65.7 and 66.3 eV and decreases for 66.7 and 68 eV. Thus, the evolution of the minority electron (, light green) absorption with time (and, to a lesser extent, the majority electron adsorption) depends on the probing energy. Note that these changes result from a modification of available states before and after optical excitation. For probing energies below the Fermi level (66.2 eV for Ni [44]) the absorption increase corresponds for example to a depletion of electrons (i.e., more free states available), similarly, for probing energies above the Fermi level (namely 66.7 eV and 68 eV), a decrease of absorption indicates that the initial free states are now occupied by excited electrons. In addition, Figure 3 shows that transient absorption changes for different applied fields do not systematically start at : the same dynamics are observed for both field directions during the first tens of fs after optical excitation for E = 64.6, 65.7, and 66.3 eV (highlighted grey regions). At first glance, this is in line with the recent observation of a delay between ultrafast electronic and magnetic dynamics [30,34]. For eV, a closer look at the first 100 fs reveals a crossing between and curves. As we will explain in the discussion section, we believe that this is the signature of a MCD spectrum shift.
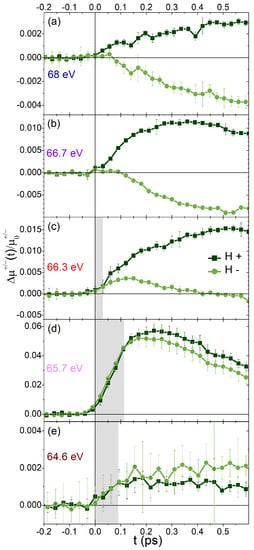
Figure 3.
Relative absorption time traces for both field directions: shown in dark green and shown in light green using XUV probing energies equal to (a) 68 eV (b) 66.7 eV (c) 66.3 eV (d) 65.7 eV and (e) 64.6 eV.
In order to compare the results obtained for different probing energies and to further quantify the electronic and magnetic dynamics, we have plotted the relative absorption and the relative MCD in Figure 4a,b, respectively. Figure 4a shows (vertical axis) as a function of the delay (left axis) and probing energies (right axis). As a reminder, the static absorption curve is shown in the background (dotted black line) with the corresponding probing energies (dotted colored line). Figure 4b shows which is directly proportional to the relative magnetization changes as a function of the time delay for all XUV energies.
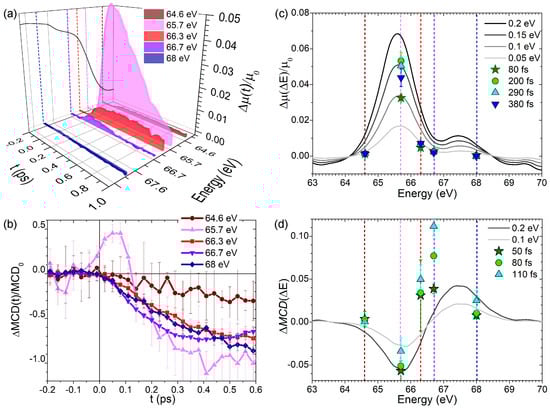
Figure 4.
Time- and energy-dependent absorption and MCD data: (a) Relative absorption time traces as a function of probing photon energies and time delay. (b) Relative MCD time traces for the five probing energies. (c) Calculated absorption, as a function of energy, resulting from a shift of the absorption spectra to lower energies (dark and grey lines). The experimental symbols extracted from (a) for different delays are compatible with a maximum shift of −0.15 eV. (d) Calculated magnetization, as a function of energy, considering a similar rigid MCD spectrum red shift (dark and grey lines). The experimental data, plotted for three different delays, are only in agreement with the prediction resulting from a MCD spectrum shift on very short time scales (<80 fs).
Several conclusions can be drawn from these graphs: (i) The relative absorption dynamics depend strongly on the probing energy. In fact, the maximum of the relative transient absorption change observed at 65.7 eV is one order of magnitude stronger than for all other energies scrutinized in this experiment. (ii) The relative magnetization curves display more subtle differences. The characteristic demagnetization times and rates show a weak dependence on the probing energy. As already highlighted, we see that for 66.3 and 64.6 eV, the onset of the demagnetization process is delayed with respect to . For a probing energy of 65.7 eV, we see a surprising increase and subsequent decrease of the magnetization in less than 100 fs. Note that this behavior is seen independently of the helicity of the incoming XUV pulses and has been observed in other Ni samples probed during the same experiment (data not shown).
4. Discussion
When a metallic thin film is excited by an ultrashort optical pulse, the electronic population close to the Fermi level is modified, causing a change in the X-ray absorption spectra on femtosecond timescales. This was first measured at the Ni -edge by Stamm et al. [22], who suggested that optical pumping of the sample can induce a redshift of the absorption edge during the first hundreds of femtoseconds. The effect was theoretically underpinned by Carva et al. [24], who explained the observed phenomenon as resulting from an optical excitation-induced electron depletion close to the Fermi energy. Furthermore, their calculations suggested that, in addition to the pure absorption spectra, the MCD should also be affected on sub-picosecond timescales. While subsequent experiments remained limited to the L-edges of transition metals [17], very recent work by Yao et al. [34] and Rösner et al. [30] unveiled that similar effects can also be observed at the M-edges of Fe, Co, and Ni. Furthermore, both studies demonstrated that, depending on the probing energy, a delay between the magnetic and pure charge dynamics (up to 100 fs) can exist. As detailed in Yao’s study [34], this might hint at a pump-induced redshift of the MCD spectra.
To test this hypothesis, we calculated the and (using the static data shown in Figure 2b), for different redshift values ranging from 0.05 eV up to 0.2 eV (see lines in Figure 4c,d). On top of these computed curves (black to gray lines), we have plotted our experimental data using color symbols for different time delays. When considering absorption changes as a function of energy, our experimental results are in reasonable agreement with the redshift predictions (Figure 4c). The maximum change in absorption is obtained using eV after 200 fs and corresponds to = −0.15 eV with respect to the static spectrum. Note that this is in good agreement with the aforementioned -edge measurements of Stamm et al., who reported an XAS shift of −0.13 eV after 200 fs [22], as well as with the calculation presented in the Yao et al. study [34]. All other probed energies give rise to less dramatic changes, in qualitative agreement with our calculations. However, from a quantitative perspective, the observed magnitudes of show slight deviations from the simple rigid edge shift, which hints at more subtle transient modifications of the absorption spectrum [34].
A comparison of the calculated with our experimental data, Figure 4d, also provides support for a shift of the MCD. Note that since the MCD is inferior to 0, a negative value of corresponds to an increase in magnetization. Therefore, we can interpret the observed increase in the magnetization shortly after ( eV, magenta data in panel (b)), as well as the small delays between and the onset of the demagnetization process ( eV and, to a lesser extent, eV) as resulting from a redshift of the MCD. This increase in the magnetization competes with the usual ultrafast demagnetization, and is visible only briefly after . Note that this explanation could provide additional insight into a recent study where an increase of the Ni magnetization on early timescales, in an FeNi alloy, has been attributed to optically induced spin transfer effects [44]. Furthermore, it is in agreement with the theoretical calculation of Carva et al. [24]. For 100 fs the magnetization quenching dominates, irrespective of the energy. For probing energies where the aforementioned electronic redistribution and ultrafast demagnetization channels do not compete (66.7 end 68 eV), we do not find any lag between the onset of the electronic and magnetic dynamics (Figure 3a,b). The increase and delay in the magnetic response briefly after thus unravel a subtle interplay between electronic and spin dynamics. Indeed, this highlights that the electronic population dynamics are spin-dependent and that ultrafast demagnetization is intimately linked to the change in density of states close to the Fermi level as previously observed in photoelectron experiments [26,36].
The redshift of the MCD should also be explicitly observed when plotting the MCD as a function of the photon energy for different delays. Even though we were not able to measure the full spectra, but only five energies, as shown in Figure 5, we indeed find evidence for a slight shift of the static MCD spectrum (black curve) towards smaller energies for fs (green stars). On longer timescales, however, the MCD magnitude decreases and we observe a distortion of the spectra, especially for higher energies. We emphasize that these results are not at odds with data presented recently by Stamm et al. [31]. In fact, their measurements on Ni are performed 0.7 ps after the excitation, which is well beyond the typical time where MCD energy shifts can be observed, as shown in the present study. However, this recent work of Stamm et al. [31] demonstrates that it is now possible to measure full MCD spectra for different delays.
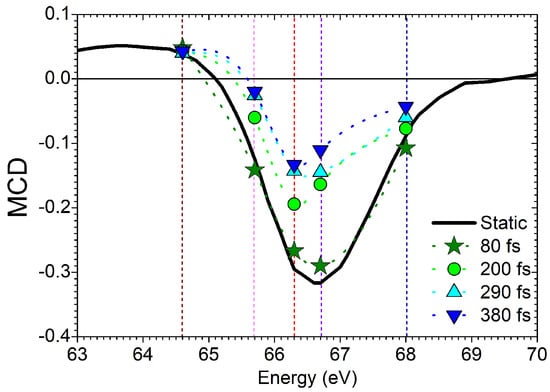
Figure 5.
Calculated static MCD spectra (black line) and measured MCD spectra for different time delays (colored symbols).
On longer timescales, as already mentioned, clear differences between the different demagnetization curves become apparent (Figure 4b). Despite the large experimental errors (linked to the use of different CCDs for the measurement of the incoming XUV intensity), which impede a thorough quantitative analysis, it is obvious that the demagnetization observed for eV is significantly slower than for all other probing energies. This is in agreement with work of Gort et al. [36], who conclude that the characteristic demagnetization times depend on the binding energy of the probed electrons with respect to the Fermi level. As already suggested by Carva [24], “correctly” probing the magnetization might thus require an integration over the entire MCD spectrum (as intrinsically performed using broadband sources), and must be critically discussed in femtomagnetism experiments, where single, well-defined probing wavelengths are used. This could explain why several studies, despite using comparable experimental conditions, reported rather different characteristic demagnetization times [45,46,47] and significant differences concerning the onset of demagnetization in material systems composed of multiple elements [48,49,50].
5. Conclusions
Using a recently developed X-ray streaking technique [29,30], we have probed the photo-absorption cross-section of a Ni thin film at the Ni -edges using circularly polarized XUV pulses for five probing energies, and both helicities and directions of the applied magnetic field. This allowed us to measure the time-dependent absorption and magnetic circular dichroism (MCD) time traces, and to retrieve information about transient changes occurring in the electronic and spin sub-systems close to the Fermi level. Our results show that the absorption and MCD dynamics both depend on the probing XUV wavelength. While providing a detailed microscopic model that can account for our observations is well beyond the scope of the present paper, we see that, to a first approximation, a redshift of the absorption and MCD spectra on very short timescales (<100–200 fs) can rationalize our data, which is in agreement with recent findings [34]. However, our analysis also hints at more complex modifications of those spectra, and we hope that our experimental findings will stimulate further work in order to obtain a truly quantitative picture of femtosecond charge and spin dynamics in magnetic thin films excited by ultrashort laser pulses.
Author Contributions
B.R., J.L., C.D., F.C., R.J., B.V., and E.J. conceived the experiments, B.R., F.D., V.A.G., M.L., B.W., and C.D. fabricated the zone plate optics, B.R., R.D., M.L., J.L., A.M., D.N., I.P.N., I.L.-Q., E.P., T.S., M.Z., C.D., F.C., B.V., and E.J. performed the experiment at FERMI. M.H. (Michel Hehn) and G.M. grew the sample. M.H. (Marcel Hennes), V.C., A.K., J.L., F.C., G.S.C., B.V., and E.J. interpreted and discussed the results. M.H. (Marcel Hennes) and E.J. prepared the figures and wrote the manuscript. All authors have read and agreed to the published version of the manuscript.
Funding
This work was funded within the EU-H2020 Research and Innovation Programme, No. 654360 NFFA-Europe (BR). The authors are grateful for the financial support received from CNRS-MOMENTUM, the SNSF project (No. 200021-160186), UMAMI ANR-15-CE24-0009, and the CNRS-PICS programs.
Institutional Review Board Statement
Not applicable.
Informed Consent Statement
Not applicable.
Data Availability Statement
The data presented in this study are available on request from the corresponding author.
Acknowledgments
We acknowledge the great support of the technical team of FERMI, at Trieste, as well as the help of Hugues RINGUENET and Pascal LEROY from Sorbonne Université. We also thank Clemens von Korff Schmising for stimulating discussions.
Conflicts of Interest
The authors declare no conflict of interest. The funders had no role in the design of the study; in the collection, analysis, or interpretation of data; in the writing of the manuscript, or in the decision to publish the results.
Abbreviations
The following abbreviations are used in this manuscript:
| XUV | Extreme ultraviolet |
| MCD | Magnetic circular dichroism |
| FEL | Free electron laser |
| HHG | High harmonic generation |
| CCD | Charge-coupled device |
| I | Intensity |
| H | Applied magnetic field |
| T | Transmission |
| Absorption |
References
- Beaurepaire, E.; Merle, J.C.; Daunois, A.; Bigot, J.Y. Ultrafast spin dynamics in ferromagnetic nickel. Phys. Rev. Lett. 1996, 76, 4250. [Google Scholar] [CrossRef] [PubMed]
- Kirilyuk, A.; Kimel, A.V.; Rasing, T. Ultrafast optical manipulation of magnetic order. Rev. Mod. Phys. 2010, 82, 2731. [Google Scholar] [CrossRef]
- Koopmans, B.; Malinowski, G.; Dalla Longa, F.; Steiauf, D.; Fähnle, M.; Roth, T.; Cinchetti, M.; Aeschlimann, M. Explaining the paradoxical diversity of ultrafast laser-induced demagnetization. Nat. Mater. 2010, 9, 259–265. [Google Scholar] [CrossRef] [PubMed]
- Battiato, M.; Carva, K.; Oppeneer, P.M. Superdiffusive spin transport as a mechanism of ultrafast demagnetization. Phys. Rev. Lett. 2010, 105, 027203. [Google Scholar] [CrossRef] [PubMed]
- Bierbrauer, U.; Weber, S.T.; Schummer, D.; Barkowski, M.; Mahro, A.K.; Mathias, S.; Schneider, H.C.; Stadtmüller, B.; Aeschlimann, M.; Rethfeld, B. Ultrafast magnetization dynamics in Nickel: Impact of pump photon energy. J. Phys. Condens. Matter 2017, 29, 244002. [Google Scholar] [CrossRef]
- Ferté, T.; Bergeard, N.; Le Guyader, L.; Hehn, M.; Malinowski, G.; Terrier, E.; Otero, E.; Holldack, K.; Pontius, N.; Boeglin, C. Element-resolved ultrafast demagnetization rates in ferrimagnetic CoDy. Phys. Rev. B 2017, 96, 134303. [Google Scholar] [CrossRef]
- Jal, E.; López-Flores, V.; Pontius, N.; Ferté, T.; Bergeard, N.; Boeglin, C.; Vodungbo, B.; Lüning, J.; Jaouen, N. Structural dynamics during laser-induced ultrafast demagnetization. Phys. Rev. B 2017, 95, 184422. [Google Scholar] [CrossRef]
- Stanciu, C.D.; Hansteen, F.; Kimel, A.V.; Kirilyuk, A.; Tsukamoto, A.; Itoh, A.; Rasing, T. All-Optical Magnetic Recording with Circularly Polarized Light. Phys. Rev. Lett. 2007, 99, 047601. [Google Scholar] [CrossRef]
- Choi, G.M.; Min, B.C.; Lee, K.J.; Cahill, D.G. Spin current generated by thermally driven ultrafast demagnetization. Nat. Commun. 2014, 5. [Google Scholar] [CrossRef]
- El-Ghazaly, A.; Gorchon, J.; Wilson, R.B.; Pattabi, A.; Bokor, J. Progress towards ultrafast spintronics applications. J. Magn. Magn. Mater. 2020, 502, 166478. [Google Scholar] [CrossRef]
- Chakravarty, A.; Mentink, J.H.; Davies, C.S.; Yamada, K.T.; Kimel, A.V.; Rasing, T. Supervised learning of an opto-magnetic neural network with ultrashort laser pulses. Appl. Phys. Lett. 2019, 114, 192407. [Google Scholar] [CrossRef]
- Becker, H.; Krückel, C.J.; Van Thourhout, D.; Heck, M.J.R. Out-of-Plane Focusing Grating Couplers for Silicon Photonics Integration with Optical MRAM Technology. IEEE J. Sel. Top. Quantum Electron. 2020, 26, 1–8. [Google Scholar] [CrossRef]
- Vodungbo, B.; Gautier, J.; Lambert, G.; Sardinha, A.B.; Lozano, M.; Sebban, S.; Ducousso, M.; Boutu, W.; Li, K.; Tudu, B.; et al. Laser-induced ultrafast demagnetization in the presence of a nanoscale magnetic domain network. Nat. Commun. 2012, 3, 999. [Google Scholar] [CrossRef] [PubMed]
- Pfau, B.; Schaffert, S.; Müller, L.; Gutt, C.; Al-Shemmary, A.; Büttner, F.; Delaunay, R.; Düsterer, S.; Flewett, S.; Frömter, R.; et al. Ultrafast optical demagnetization manipulates nanoscale spin structure in domain walls. Nat. Commun. 2012, 3, 1–6. [Google Scholar] [CrossRef]
- Graves, C.E.; Reid, A.H.; Wang, T.; Wu, B.; de Jong, S.; Vahaplar, K.; Radu, I.; Bernstein, D.P.; Messerschmidt, M.; Müller, L.; et al. Nanoscale spin reversal by non-local angular momentum transfer following ultrafast laser excitation in ferrimagnetic GdFeCo. Nat. Mater. 2013, 12, 293–298. [Google Scholar] [CrossRef]
- Weder, D.; von Korff Schmising, C.; Günther, C.M.; Schneider, M.; Engel, D.; Hessing, P.; Strüber, C.; Weigand, M.; Vodungbo, B.; Jal, E.; et al. Transient magnetic gratings on the nanometer scale. Struct. Dyn. 2020, 7, 054501. [Google Scholar] [CrossRef]
- Boeglin, C.; Beaurepaire, E.; Halté, V.; López-Flores, V.; Stamm, C.; Pontius, N.; Dürr, H.A.; Bigot, J.Y. Distinguishing the ultrafast dynamics of spin and orbital moments in solids. Nature 2010, 465, 458–461. [Google Scholar] [CrossRef]
- Radu, I.; Vahaplar, K.; Stamm, C.; Kachel, T.; Pontius, N.; Dürr, H.A.; Ostler, T.A.; Barker, J.; Evans, R.F.L.; Chantrell, R.W.; et al. Transient ferromagnetic-like state mediating ultrafast reversal of antiferromagnetically coupled spins. Nature 2011, 472, 205–208. [Google Scholar] [CrossRef]
- Henighan, T.; Trigo, M.; Bonetti, S.; Granitzka, P.; Higley, D.; Chen, Z.; Jiang, M.; Kukreja, R.; Gray, A.; Reid, A.; et al. Generation mechanism of terahertz coherent acoustic phonons in Fe. Phys. Rev. B 2016, 93, 220301. [Google Scholar] [CrossRef]
- Reid, A.H.; Shen, X.; Maldonado, P.; Chase, T.; Jal, E.; Granitzka, P.W.; Carva, K.; Li, R.K.; Li, J.; Wu, L.; et al. Beyond a phenomenological description of magnetostriction. Nat. Commun. 2018, 9, 388. [Google Scholar] [CrossRef]
- Dornes, C.; Acremann, Y.; Savoini, M.; Kubli, M.; Neugebauer, M.J.; Abreu, E.; Huber, L.; Lantz, G.; Vaz, C.a.F.; Lemke, H.; et al. The ultrafast Einstein–de Haas effect. Nature 2019, 565, 209. [Google Scholar] [CrossRef] [PubMed]
- Stamm, C.; Kachel, T.; Pontius, N.; Mitzner, R.; Quast, T.; Holldack, K.; Khan, S.; Lupulescu, C.; Aziz, E.F.; Wietstruk, M.; et al. Femtosecond modification of electron localization and transfer of angular momentum in nickel. Nat. Mater. 2007, 6, 740–743. [Google Scholar] [CrossRef] [PubMed]
- Kachel, T.; Pontius, N.; Stamm, C.; Wietstruk, M.; Aziz, E.F.; Dürr, H.A.; Eberhardt, W.; de Groot, F.M.F. Transient electronic and magnetic structures of nickel heated by ultrafast laser pulses. Phys. Rev. B 2009, 80, 092404. [Google Scholar] [CrossRef]
- Carva, K.; Legut, D.; Oppeneer, P.M. Influence of laser-excited electron distributions on the X-ray magnetic circular dichroism spectra: Implications for femtosecond demagnetization in Ni. EPL (Europhys. Lett.) 2009, 86, 57002. [Google Scholar] [CrossRef]
- Higley, D.J.; Hirsch, K.; Dakovski, G.L.; Jal, E.; Yuan, E.; Liu, T.; Lutman, A.A.; MacArthur, J.P.; Arenholz, E.; Chen, Z.; et al. Femtosecond X-ray magnetic circular dichroism absorption spectroscopy at an X-ray free electron laser. Rev. Sci. Instrum. 2016, 87, 033110. [Google Scholar] [CrossRef]
- Eich, S.; Plötzing, M.; Rollinger, M.; Emmerich, S.; Adam, R.; Chen, C.; Kapteyn, H.C.; Murnane, M.M.; Plucinski, L.; Steil, D.; et al. Band structure evolution during the ultrafast ferromagnetic-paramagnetic phase transition in cobalt. Sci. Adv. 2017, 3, e1602094. [Google Scholar] [CrossRef]
- You, W.; Tengdin, P.; Chen, C.; Shi, X.; Zusin, D.; Zhang, Y.; Gentry, C.; Blonsky, A.; Keller, M.; Oppeneer, P.M.; et al. Revealing the Nature of the Ultrafast Magnetic Phase Transition in Ni by Correlating Extreme Ultraviolet Magneto-Optic and Photoemission Spectroscopies. Phys. Rev. Lett. 2018, 121, 077204. [Google Scholar] [CrossRef]
- Buzzi, M.; Makita, M.; Howald, L.; Kleibert, A.; Vodungbo, B.; Maldonado, P.; Raabe, J.; Jaouen, N.; Redlin, H.; Tiedtke, K.; et al. Single-shot Monitoring of Ultrafast Processes via X-ray Streaking at a Free Electron Laser. Sci. Rep. 2017, 7, 7253. [Google Scholar] [CrossRef]
- Jal, E.; Makita, M.; Rösner, B.; David, C.; Nolting, F.; Raabe, J.; Savchenko, T.; Kleibert, A.; Capotondi, F.; Pedersoli, E.; et al. Single-shot time-resolved magnetic X-ray absorption at a free-electron laser. Phys. Rev. B 2019, 99, 144305. [Google Scholar] [CrossRef]
- Rösner, B.; Vodungbo, B.; Chardonnet, V.; Döring, F.; Guzenko, V.A.; Hennes, M.; Kleibert, A.; Lebugle, M.; Lüning, J.; Mahne, N.; et al. Simultaneous two-color snapshot view on ultrafast charge and spin dynamics in a Fe-Cu-Ni tri-layer. Struct. Dyn. 2020, 7, 054302. [Google Scholar] [CrossRef]
- Stamm, C.; Murer, C.; Wörnle, M.S.; Acremann, Y.; Gort, R.; Däster, S.; Reid, A.H.; Higley, D.J.; Wandel, S.F.; Schlotter, W.F.; et al. X-ray detection of ultrashort spin current pulses in synthetic antiferromagnets. J. Appl. Phys. 2020, 127, 223902. [Google Scholar] [CrossRef]
- Willems, F.; Smeenk, C.T.L.; Zhavoronkov, N.; Kornilov, O.; Radu, I.; Schmidbauer, M.; Hanke, M.; von Korff Schmising, C.; Vrakking, M.J.J.; Eisebitt, S. Probing ultrafast spin dynamics with high-harmonic magnetic circular dichroism spectroscopy. Phys. Rev. B 2015, 92, 220405. [Google Scholar] [CrossRef]
- Dewhurst, J.K.; Willems, F.; Elliott, P.; Li, Q.Z.; Schmising, C.v.K.; Strüber, C.; Engel, D.W.; Eisebitt, S.; Sharma, S. Element Specificity of Transient Extreme Ultraviolet Magnetic Dichroism. Phys. Rev. Lett. 2020, 124, 077203. [Google Scholar] [CrossRef] [PubMed]
- Yao, K.; Willems, F.; von Korff Schmising, C.; Radu, I.; Strüber, C.; Schick, D.; Engel, D.; Tsukamoto, A.; Dewhurst, J.K.; Sharma, S.; et al. Distinct spectral response in M-edge magnetic circular dichroism. Phys. Rev. B 2020, 102, 100405. [Google Scholar] [CrossRef]
- Frietsch, B.; Bowlan, J.; Carley, R.; Teichmann, M.; Wienholdt, S.; Hinzke, D.; Nowak, U.; Carva, K.; Oppeneer, P.M.; Weinelt, M. Disparate ultrafast dynamics of itinerant and localized magnetic moments in gadolinium metal. Nat. Commun. 2015, 6, 8262. [Google Scholar] [CrossRef]
- Gort, R.; Bühlmann, K.; Däster, S.; Salvatella, G.; Hartmann, N.; Zemp, Y.; Holenstein, S.; Stieger, C.; Fognini, A.; Michlmayr, T.U.; et al. Early Stages of Ultrafast Spin Dynamics in a 3d Ferromagnet. Phys. Rev. Lett. 2018, 121, 087206. [Google Scholar] [CrossRef]
- Jana, S.; Malik, R.S.; Kvashnin, Y.O.; Locht, I.L.M.; Knut, R.; Stefanuik, R.; Di Marco, I.; Yaresko, A.N.; Ahlberg, M.; Åkerman, J.; et al. Analysis of the linear relationship between asymmetry and magnetic moment at the M edge of 3d transition metals. Phys. Rev. Res. 2020, 2, 013180. [Google Scholar] [CrossRef]
- Capotondi, F.; Pedersoli, E.; Mahne, N.; Menk, R.H.; Passos, G.; Raimondi, L.; Svetina, C.; Sandrin, G.; Zangrando, M.; Kiskinova, M.; et al. Invited Article: Coherent imaging using seeded free-electron laser pulses with variable polarization: First results and research opportunities. Rev. Sci. Instrum. 2013, 84, 051301. [Google Scholar] [CrossRef]
- Allaria, E.; Appio, R.; Badano, L.; Barletta, W.A.; Bassanese, S.; Biedron, S.G.; Borga, A.; Busetto, E.; Castronovo, D.; Cinquegrana, P.; et al. Highly coherent and stable pulses from the FERMI seeded free-electron laser in the extreme ultraviolet. Nat. Photonics 2012, 6, 699–704. [Google Scholar] [CrossRef]
- Wang, T.; Zhu, D.; Wu, B.; Graves, C.; Schaffert, S.; Rander, T.; Müller, L.; Vodungbo, B.; Baumier, C.; Bernstein, D.P.; et al. Femtosecond Single-Shot Imaging of Nanoscale Ferromagnetic Order in Co/Pd Multilayers Using Resonant X-ray Holography. Phys. Rev. Lett. 2012, 108, 267403. [Google Scholar] [CrossRef]
- Stöhr, J.; Siegmann, H.C. Magnetism: From Fundamentals to Nanoscale Dynamics; Springer Series in Solid-State Sciences; Springer: Berlin/Heidelberg, Germany, 2006. [Google Scholar]
- CXRO. X-ray Interactions with Matter; CXRO: Berkeley, CA, USA, 2008. Available online: https://henke.lbl.gov/optical_constants/filter2.html (accessed on 30 December 2020).
- Willems, F.; Sharma, S.; Schmising, C.V.K.; Dewhurst, J.K.; Salemi, L.; Schick, D.; Hessing, P.; Strüber, C.; Engel, W.D.; Eisebitt, S. Magneto-Optical Functions at the 3p Resonances of Fe, Co, and Ni: Ab initio Description and Experiment. Phys. Rev. Lett. 2019, 122, 217202. [Google Scholar] [CrossRef] [PubMed]
- Hofherr, M.; Häuser, S.; Dewhurst, J.K.; Tengdin, P.; Sakshath, S.; Nembach, H.T.; Weber, S.T.; Shaw, J.M.; Silva, T.J.; Kapteyn, H.C.; et al. Ultrafast optically induced spin transfer in ferromagnetic alloys. Sci. Adv. 2020, 6, eaay8717. [Google Scholar] [CrossRef] [PubMed]
- López-Flores, V.; Bergeard, N.; Halté, V.; Stamm, C.; Pontius, N.; Hehn, M.; Otero, E.; Beaurepaire, E.; Boeglin, C. Role of critical spin fluctuations in ultrafast demagnetization of transition-metal rare-earth alloys. Phys. Rev. B 2013, 87, 214412. [Google Scholar] [CrossRef]
- Fan, G.; Legare, K.; Cardin, V.; Xie, X.; Kaksis, E.; Andriukaitis, G.; Pugzlys, A.; Schmidt, B.E.; Wolf, J.P.; Hehn, M.; et al. Time-resolving magnetic scattering on rare-earth ferrimagnets with a bright soft-X-ray high-harmonic source. arXiv 2019, arXiv:1910.14263. [Google Scholar]
- Hennes, M.; Merhe, A.; Liu, X.; Weder, D.; Schmising, C.V.K.; Schneider, M.; Günther, C.M.; Mahieu, B.; Malinowski, G.; Hehn, M.; et al. Laser-induced ultrafast demagnetization and perpendicular magnetic anisotropy reduction in a Co88Tb12 thin film with stripe domains. Phys. Rev. B 2020, 102, 174437. [Google Scholar] [CrossRef]
- Mathias, S.; La-O-Vorakiat, C.; Grychtol, P.; Granitzka, P.; Turgut, E.; Shaw, J.M.; Adam, R.; Nembach, H.T.; Siemens, M.E.; Eich, S.; et al. Probing the timescale of the exchange interaction in a ferromagnetic alloy. Proc. Natl. Acad. Sci. USA 2012, 109, 4792–4797. [Google Scholar] [CrossRef]
- Radu, I.; Stamm, C.; Eschenlohr, A.; Radu, F.; Abrudan, R.; Vahaplar, K.; Kachel, T.; Pontius, N.; Mitzner, R.; Holldack, K.; et al. Ultrafast and Distinct Spin Dynamics in Magnetic Alloys. SPIN 2015, 5, 1550004. [Google Scholar] [CrossRef]
- Eschenlohr, A.; Persichetti, L.; Kachel, T.; Gabureac, M.; Gambardella, P.; Stamm, C. Spin currents during ultrafast demagnetization of ferromagnetic bilayers. J. Phys. Condens. Matter 2017, 29, 384002. [Google Scholar] [CrossRef]


Publisher’s Note: MDPI stays neutral with regard to jurisdictional claims in published maps and institutional affiliations. |
© 2020 by the authors. Licensee MDPI, Basel, Switzerland. This article is an open access article distributed under the terms and conditions of the Creative Commons Attribution (CC BY) license (http://creativecommons.org/licenses/by/4.0/).