1. Introduction
In some of the first studies of the effects of focussing the output of the X-ray Free Electron Laser (XFEL) pulse of the Linear Coherent Light Source (LCLS) at irradiances of order 10
17 Wcm
−2 onto foil targets, it was demonstrated that hot (up to 200 eV) plasmas could be created at exactly solid density [
1,
2]. The materials studied to date have been low-
Z elements, such as Mg, Al, and Si, with the incident photon energy of the XFEL being around and above the associated K-shell ionisation energies—i.e., in the 1–2 keV range. Diagnosis of the plasma conditions and associated physics was made by observing the K-shell emission of the various charge states produced, with L-shell electrons filling the single or double core holes in the ions created by the XFEL, thus leading, in many cases, to emission all the way up to the hydrogenic species (i.e., Ly-
). As the final temperatures produced are insufficient to thermally excite the K-shell of such ions, the observed emission spectrum is gated by the pulse length of the LCLS beam itself (typically sub-100 fs), and on such a timescale, the micron scale solid density plasma is effectively confined by its own inertia.
Detailed studies of the X-ray spectra have led to an improved understanding of ionization potential depression (IPD) [
3,
4,
5], as well as affording measurements of the femtosecond collisional ionization rates by means of the Auger-clock method [
6,
7]. Given the relatively long penetration depth of the X-rays compared with optical light, a study of the emission from slabs of plasma of varying thickness (from a few tens to a few hundred nm) has allowed direct measurements of K-shell opacity [
8].
In addition to the above experiments, saturable absorption of the incident X-ray pulse has also been demonstrated by tuning of the photon energy of the incident beam, such that when it creates and heats the solid-density sample, the K edges of the ions present in the hot collisional plasma—which have energies that increase as a function of ionization have energies exceeding the photon energy of the X-rays [
9]. Saturable absorption is a potentially useful phenomenon, in that it increases the effective absorption length of the X-rays, leading to more uniform deposition of the incident X-ray energy, with a concomitant reduction in temperature and electron density gradients in the direction of the XFEL beam. Such an improvement in the uniformity of the plasma conditions is of importance in experiments designed to specifically measure plasma parameters as a function of temperature and electron density.
The X-ray spectra collected in the experiments mentioned above have been simulated by use of the atomic-kinetics code SCFLY [
10]. SCFLY is a thoroughly revised version of the widely available collisional-radiative FLYCHK suite [
11,
12], and is specifically tailored for X-ray laser problems, using super-configurations to describe the atomic physics of the system [
13]. In comparison with FLYCHK, rather than using a simple screened hydrogenic model, SCFLY uses calculated atomic quantities that are given as an input by the user generated, for example, by the DHS code [
14]. However, despite its usefulness and evident successes, it should be borne in mind that SCLFY is a 0-D code, and as such, is not well-suited for modelling situations where the incident X-rays are rapidly absorbed, resulting in significant gradients along the direction of incidence of the FEL beam. Although such effects can, to a certain extent, be accounted for by use of multiple simulations of successive thin laminae of plasma-with the calculated exit spectrum of the FEL from one lamina being used as the incident beam for the next [
9], such an approach is far from ideal. We return to this point below, when we outline the use of the multi-dimensional Cretin code for the work presented in this paper [
15].
It is in the above context that we present here the results of experiments and simulations of the heating of a solid sample of a medium atomic number material, Germanium (), by the focused output of LCLS. As in the previous K-shell work mentioned briefly above, the Ge plasma was created by irradiation with relatively soft X-rays, with energies ranging from 1300 to 1600 eV, just above the cold L-III edge, which lies at 1216 eV. As such, we expect that as the plasma is heated, it will pass through ion stages that will have L-edge energies of order or greater than the XFEL photon energy, impacting the total absorbed energy, and the uniformity of its deposition, akin to the way in which the K-edges of the lower Z elements shifted in those experiments. However, and in contrast to the cases where we studied the K-shell spectra of lower Z elements, the Ge ions will also have a plethora of L-M bound-bound transitions at energies that could overlap those of the heating X-rays. Such bound transitions were largely absent in the lower Z work, as the M shell electrons of the cold solid are already free for cold Mg and Al, and the measured IPDs indicate that rebinding of the M-shell would not have taken place for those elements, except perhaps at the highest ion stages. Given that both the relevant edge structures and bound-bound transitions of the various ion stages of Ge will alter the energy deposition of the FEL as the Ge plasma passes through the various ion stages as it is heated, we might thus expect a degree of richness and complexity in the way in which the intense LCLS beam interacts with this system: indeed this is the case, and in this energy range, we find that the greatest uniformity of energy deposition occurs for an incident photon energy around 1400 eV, with an associated lower overall electron temperature than obtained with LCLS photon energies immediately above and below this value, and we discuss below the underlying atomic physics underpinning this finding.
The paper is laid out in the following manner. In
Section 2, we discuss the experimental set-up and materials used, as well as the different diagnostics that were fielded in the experiments. Additionally, the radiative transfer simulations used to model the results are described.
Section 3 presents the results of these simulations, as well as those from experimental measurements. Special emphasis is placed on the computational predictions for the temperature and ionisation distribution along the targets. These results are compared with the experimental measurements, and their relation is discussed. Finally, a summary of the findings is presented.
2. Materials and Methods
The experiments were conducted at the Soft X-ray (SXR) endstation [
16] of the LCLS. The X-ray pulse, which had an approximately Gaussian temporal envelope with a Full Width Half Maximum (FWHM) of 60 fs [
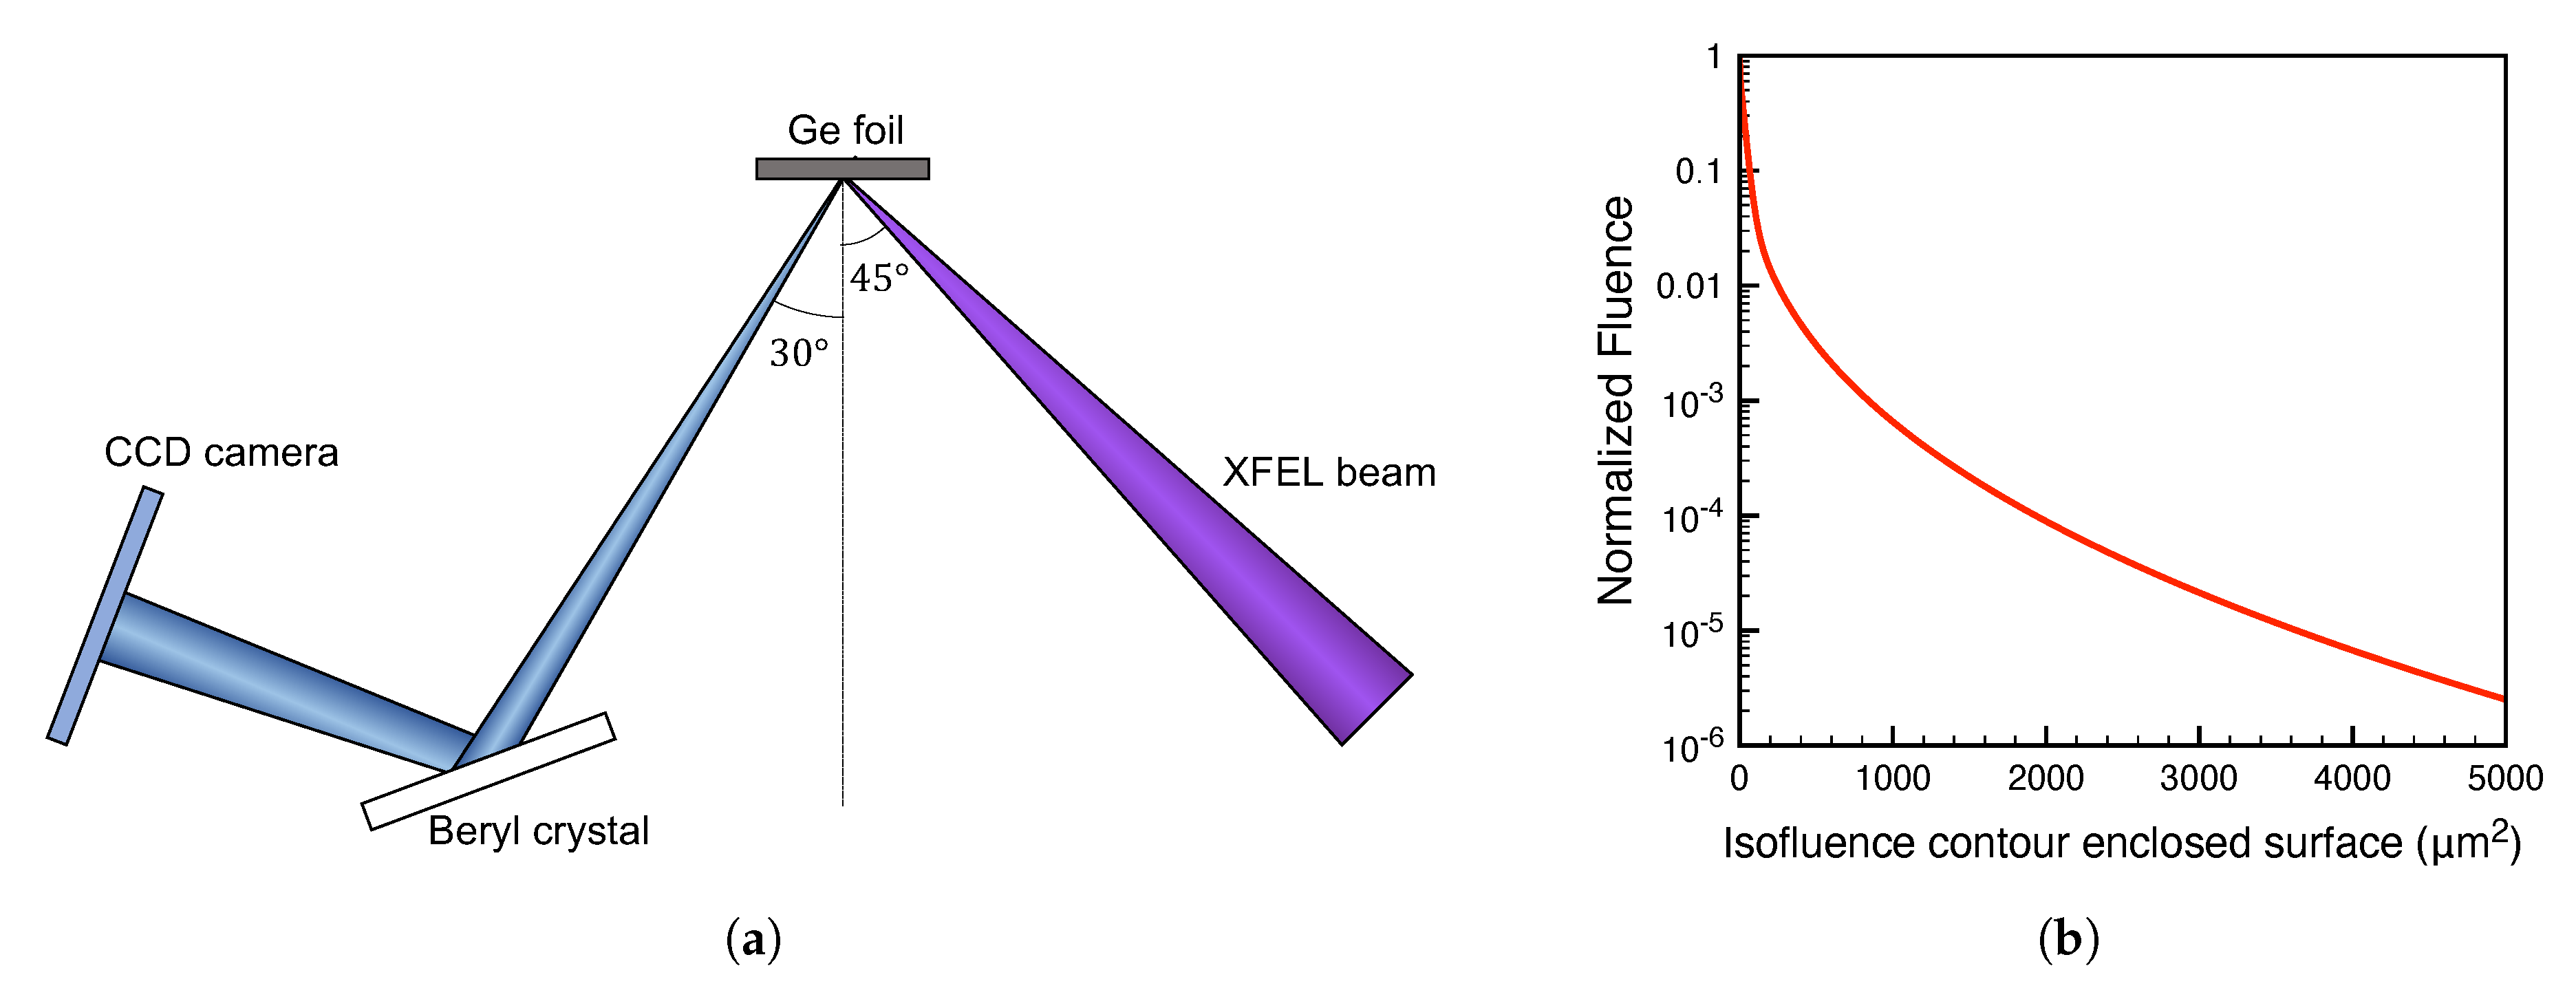
17], was focused on 508 nm thick germanium foils, mounted on a silicon substrate. The targets were oriented at an angle of 45° with respect to the incident laser beam. The nominal energy of the laser was ∼2 mJ, reduced to 0.7 mJ after transmission through the beamline optics [
18]. The photon energy of the XFEL pulse was varied between 1300 and 1600 eV in 100 eV steps, with a nominal bandwidth of 0.4% of the central photon energy in all cases. The spatial profile of the XFEL spot was measured using imprint measurements on PbI
2 targets mounted on a polymethyl methacrylate (PMMA) substrate [
19]. The effective area of the laser spot was measured to be 28.5 μm
2, resulting in a peak intensity of the XFEL of ∼
W cm
−2. The measured spot profile is shown in
Figure 1b, where the
y-axis indicates the fluence normalised to its peak, and the
x-axis indicates the area enclosed by the corresponding iso-fluence profile, as detailed in Ciricosta et al. [
10].
X-ray spectroscopy was used to diagnose the plasma. The spectra of the emission at 30° with respect to the target normal were measured with a flat-crystal Bragg spectrometer which used a Beryl
crystal (
) for diffracting the X-rays before they were recorded by a Princeton Instruments CCD camera. The angular set-up of the experiment was designed so that the spectrometer was sensitive to X-rays between 1100 and 1600 eV, to observe the emission from L-shell transitions. A schematic drawing of the experimental set-up is shown in
Figure 1a.
Radiative Transfer Simulations
Simulations were run with the one-dimensional radiative transfer code Cretin [
15] to study the uniformity of the plasma conditions. These simulations served a dual purpose: firstly to identify any possible gradients and secondly to produce reliable synthetic spectra that could be directly compared with the experimental data. The one dimensional capability of the code was necessary to study the change in the plasma conditions as a function of the depth along the targets. These were modelled as planar slabs, with the number of computational nodes across them chosen so that convergence in the kinetics calculations was obtained. The radiation field from the X-ray laser pulse is assumed to be Gaussian in time with the profile given above. The finite bandwidth of the incident radiation was also taken into account, and also assumed to be a Gaussian distribution in frequency.
In order to replicate the experimental conditions, where the profile of the XFEL spot caused different regions of the plasma to be illuminated with a different laser intensity, simulations were run over six orders of magnitude of the laser intensity, and the time-integrated spectra were then adequately weighted according to the experimentally measured spatial distribution of the XFEL spot, following the procedure in Ciricosta et al. (2016) [
10]. This allows for direct comparison of the simulated spectra with the spectra measured in the experiment.
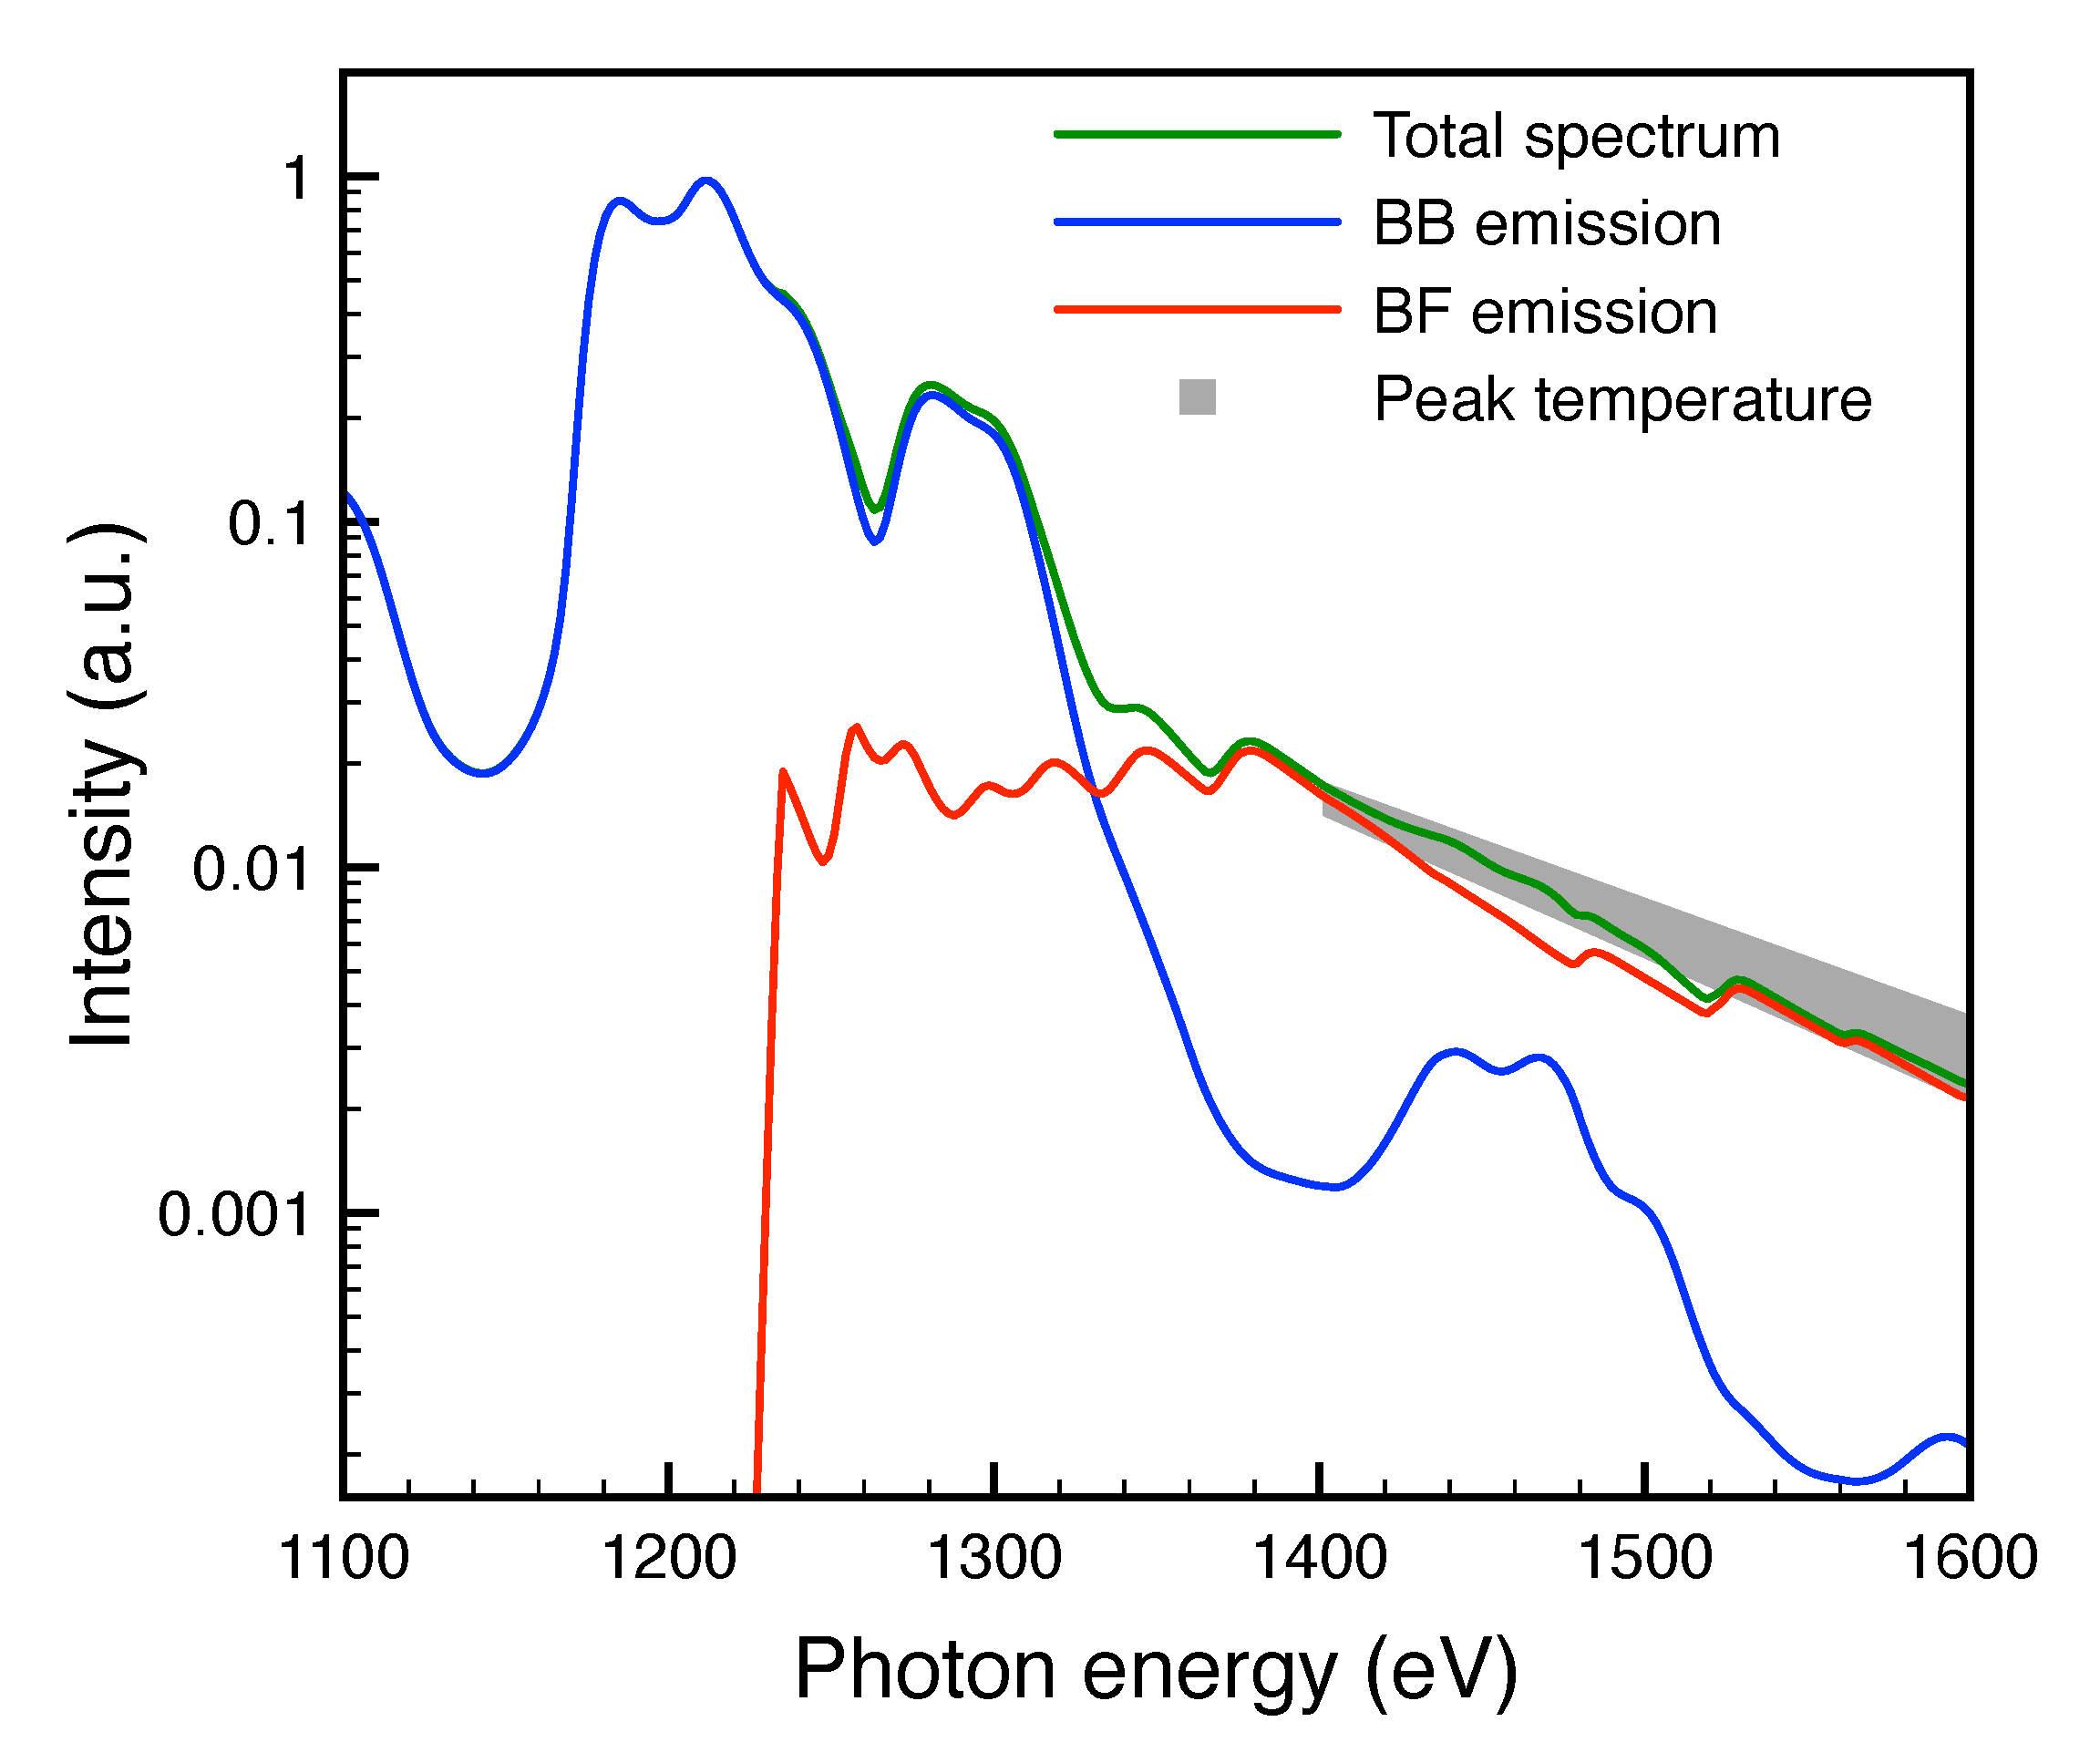
Figure 2 shows an example of the simulated time-and-space integrated spectrum for a photon energy of the XFEL of 1400 eV (green line). By separating the bound-bound and bound-free contributions from the spectrum (blue and red lines respectively), it can be seen that, in this case, the emission above 1400 eV is mostly produced by bound-free transitions. The intensity of the free-free emission in this region is several orders of magnitude lower, and therefore is not shown here. Given that the bound-free spectral emission has a characteristic energy dependence given by
, it is possible to obtain an equivalent temperature by fitting the slope of the spectrum at these photon energies. Although this method can be used to characterise the temperature of isothermal plasmas [
20], care must be taken in this case with the interpretation of the equivalent temperature, as this is an integrated measurement and the spectrum does not correspond to a single temperature.
However, in this experiment, the spectral emission of the plasma is gated by the XFEL pulse, and therefore the time-integrated spectrum is heavily weighted by the conditions at the peak of the pulse (this was confirmed by the simulations). Additionally, owing to the large effective area of the laser spot on target, the contribution to the overall spectra from the wings of the spot is negligible compared to that from the high intensity regions. These two characteristics combined cause the time-and-space integrated spectra to be representative of the plasma conditions at the peak intensity of the laser, and therefore the temperature that can be obtained from the bound-free slope is comparable to the peak temperature reached by the plasma. The Cretin simulations show that the difference between the peak temperature and that obtained from fitting the integrated spectra is below
. This is illustrated with the gray band in
Figure 2, which corresponds to the slope of the bound-free emission at the peak temperature (
). It can be seen that the slope of the space- and time-integrated spectrum is representative of this condition.
3. Results
3.1. Simulation Results
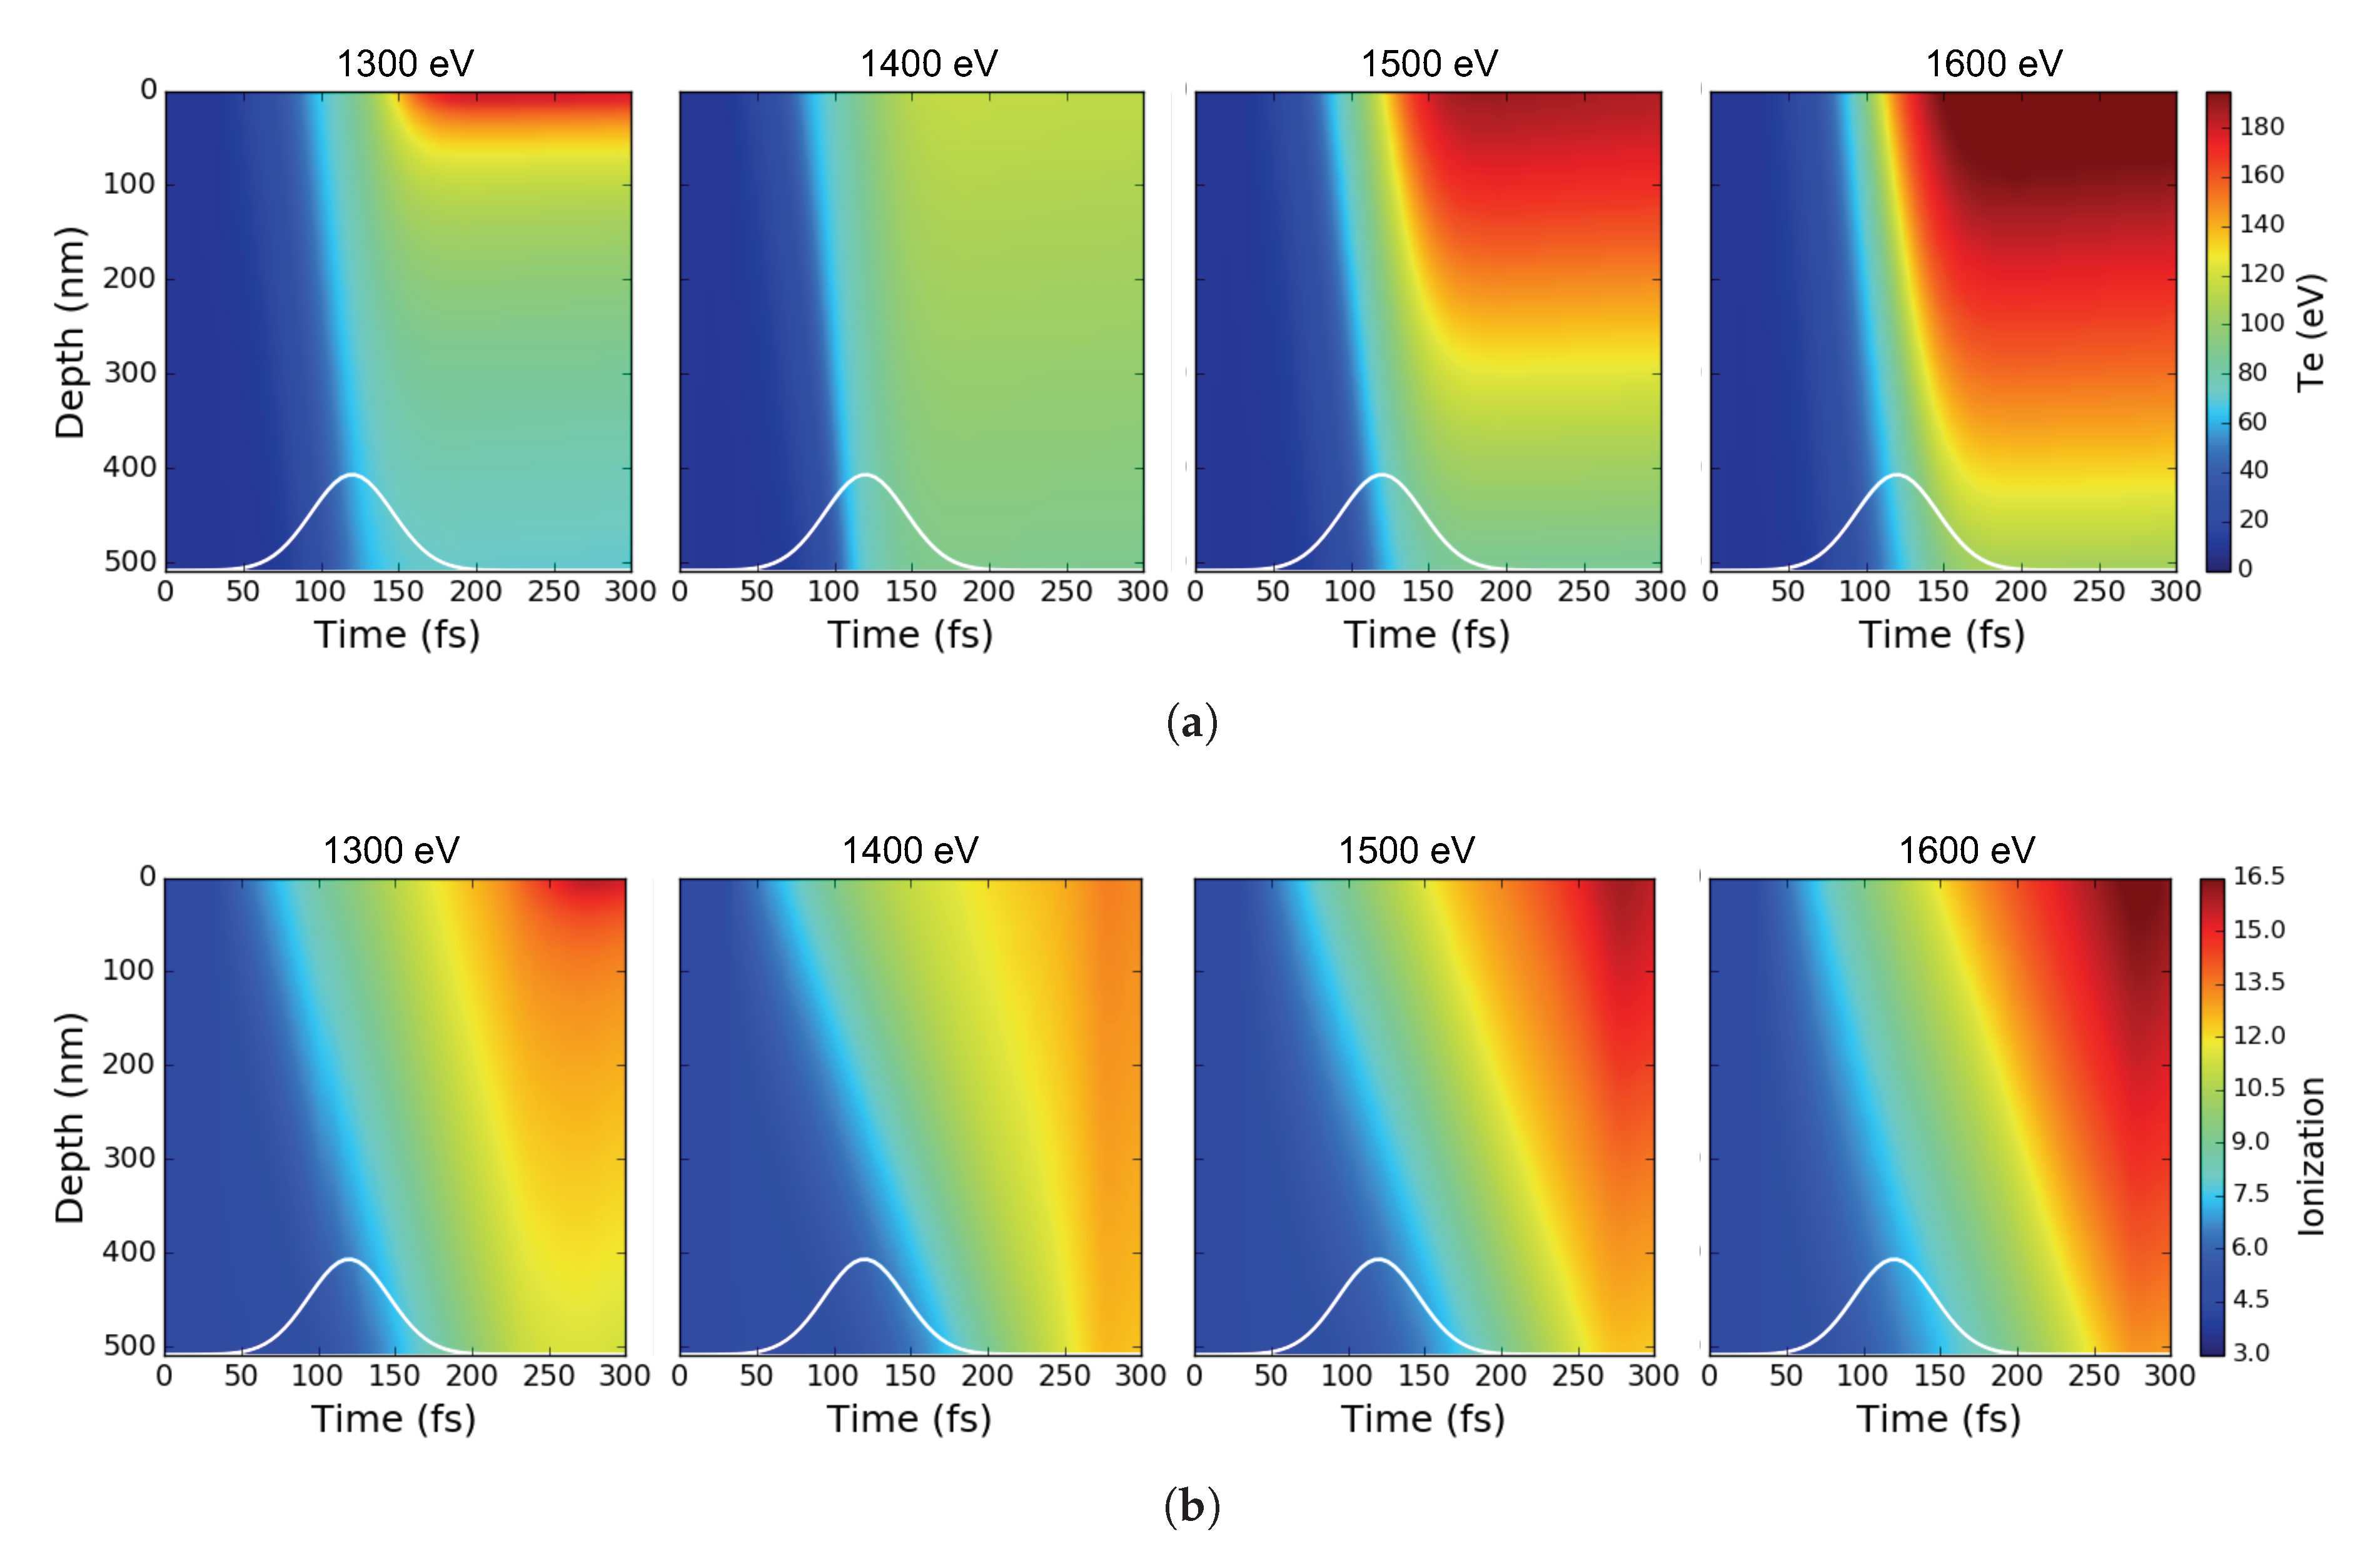
Figure 3 shows the results for the temperature and mean charge predicted across the target for the four XFEL photon energies of consideration. The vertical axis of the figures corresponds to the depth of the target, with the XFEL beam, irradiating at 0 nm (top of the figures). The pulse shape is plotted for comparison. It can be seen that, except for the case at 1400 eV, there is a significant temperature gradient across the target, with the surface that is irradiated by the laser (top) being about two times hotter than the back of the target. Surprisingly, in the 1400 eV case, this hot region at the front of the target is not present, and the target is uniformly heated to ∼
eV.
Similar gradients appear in the mean charge () of the targets. For a photon energy of 1400 eV, after the XFEL beam has left the target (around t = 250 fs), the ionisation is roughly constant across the depth of the plasma, and the mean charge equals 12–13. However, for the other photon energies under consideration, the hot region at the front of the target gets ionised further (), whereas the back of the target remains at lower ionisation levels. This is most noticeable for a XFEL photon energy of 1300 eV, where the front of the target is S-like (), while the back of the target is Sc-like ().
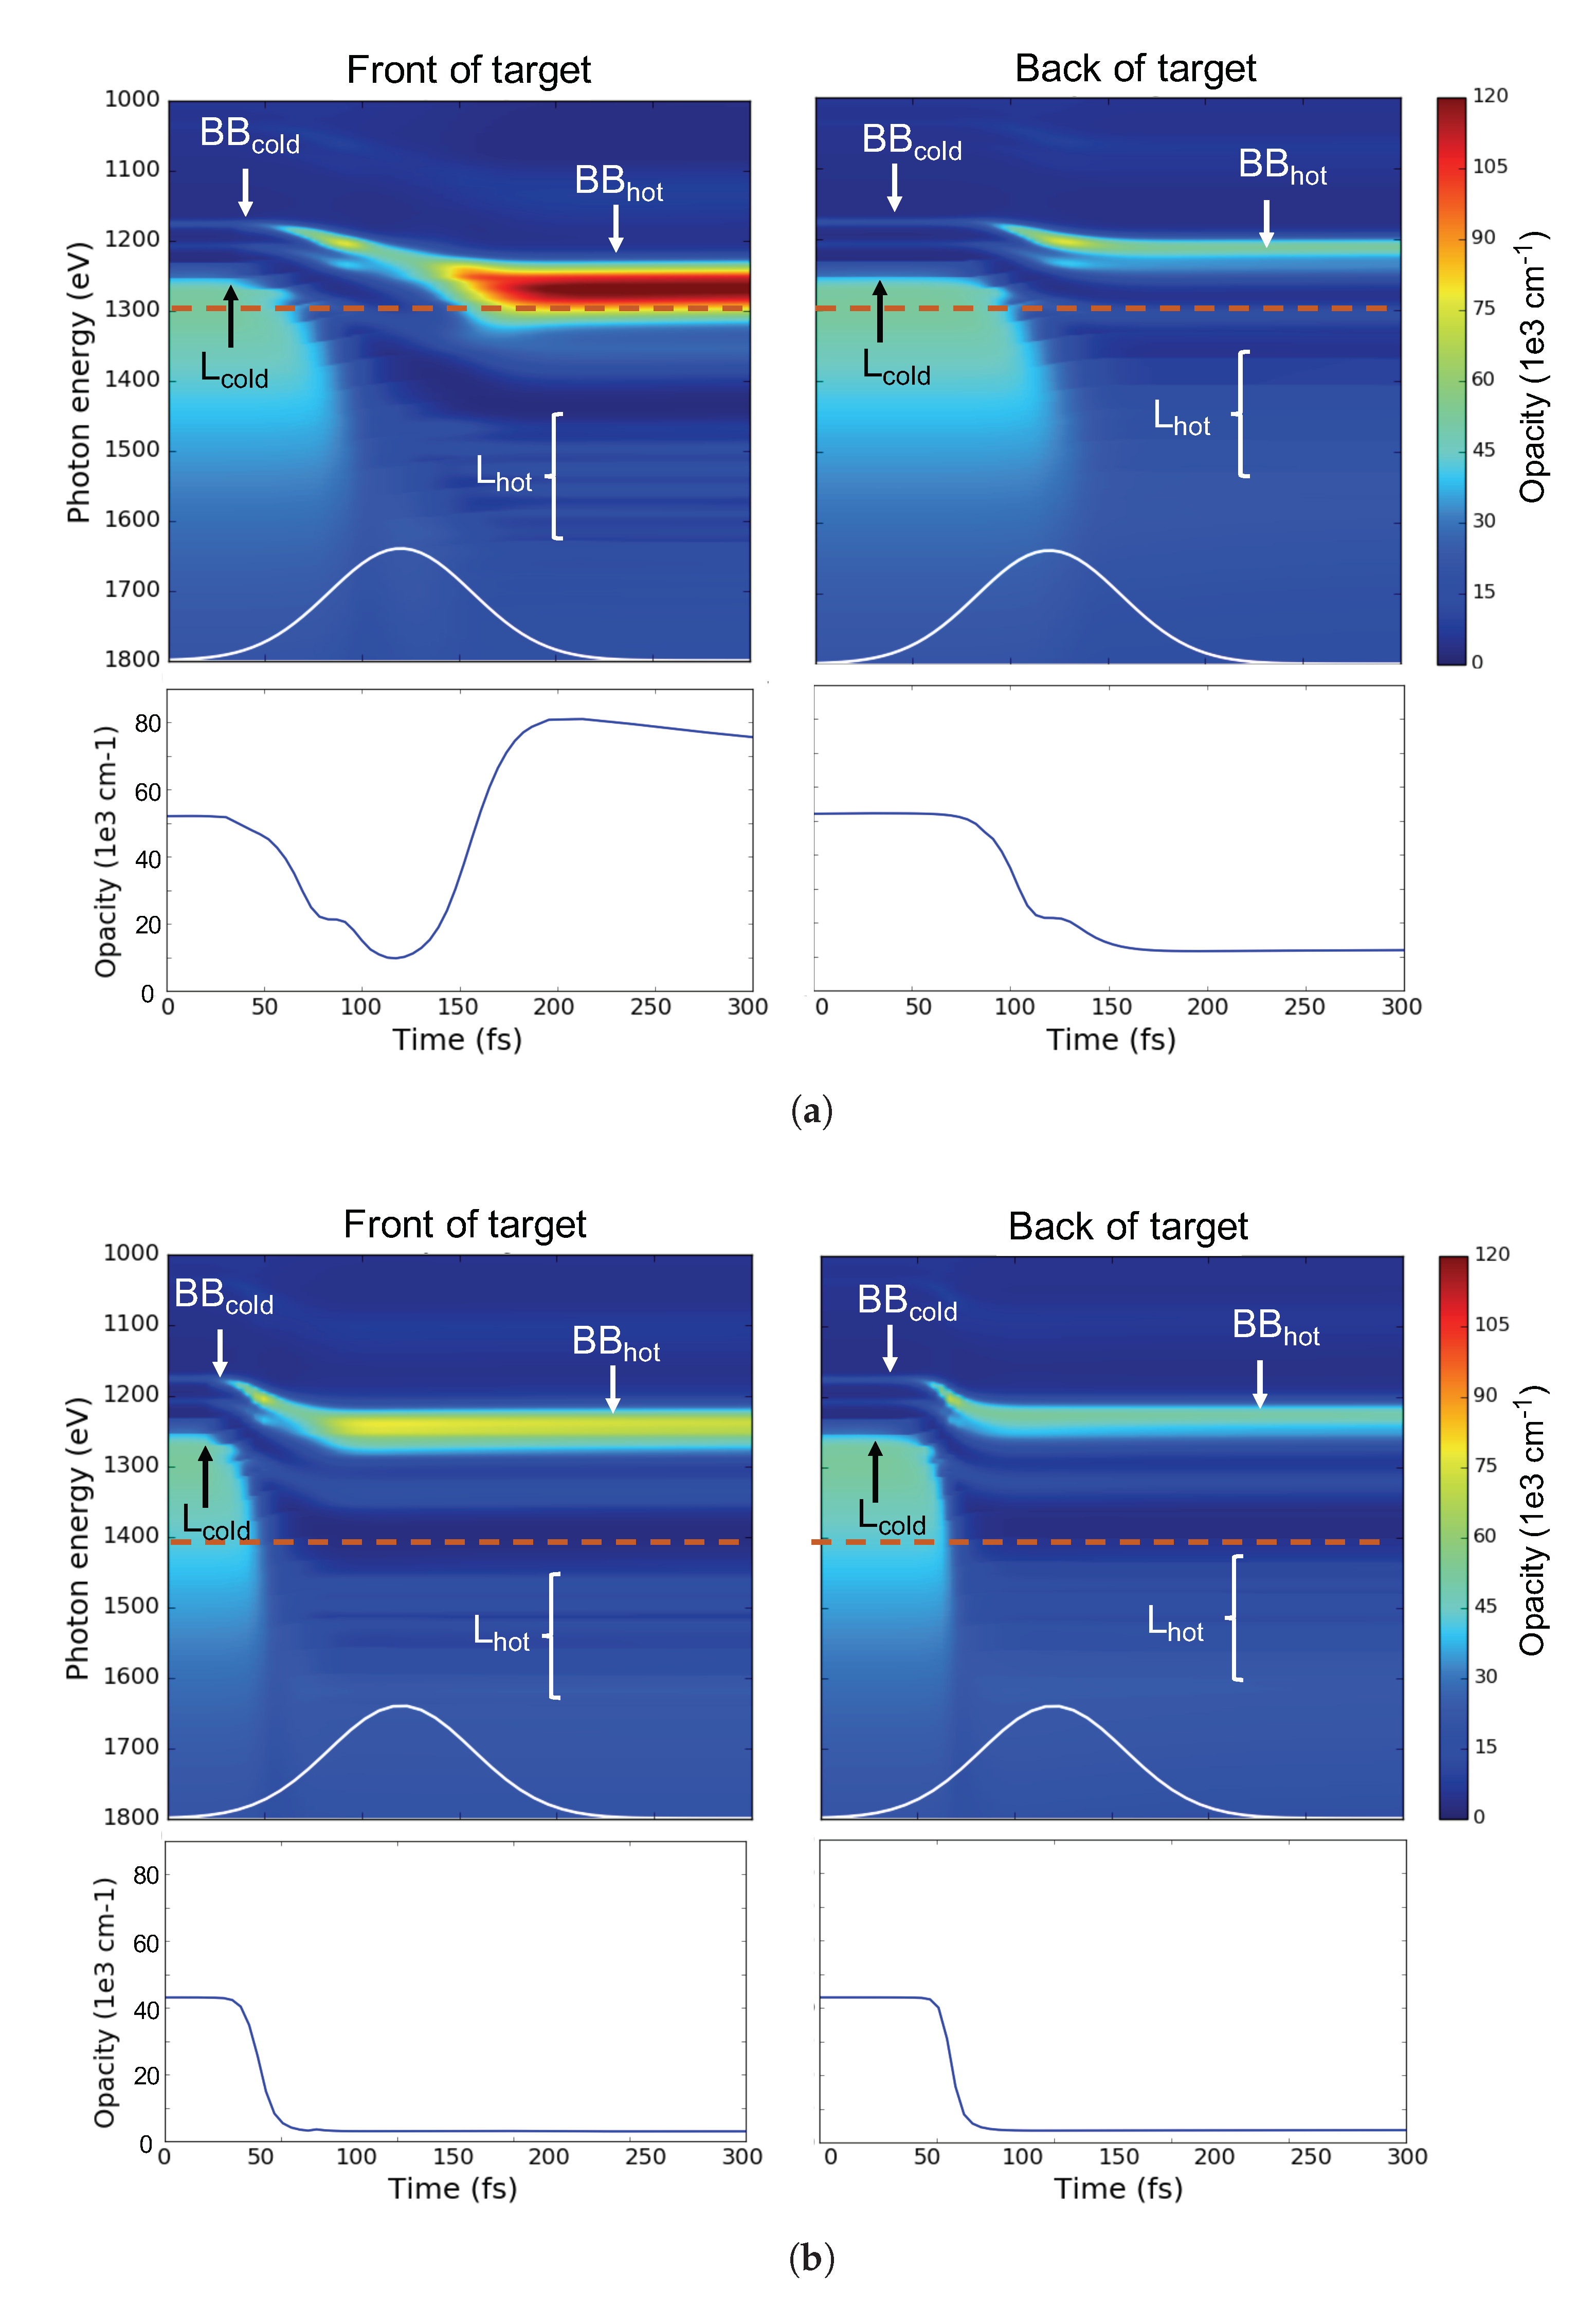
The reason for this more uniform behaviour when the photon energy of the XFEL beam is 1400 eV is related to both the position of bound-bound (L-M) transitions and the L-edges of the various ion stages as the plasma heats up. This can be understood by studying
Figure 4, where we show results of Cretin simulations of the opacity at the front (left) and back (right) of the targets for XFEL energies of 1300 (
Figure 4a) and 1400 eV (
Figure 4b) as a function of time and photon energy, for the peak intensity of the laser. In this case, the front refers to the laser-irradiated surface of the target, and the laser pulse is indicated in white in all cases. Additionally, the photon energy of the XFEL is indicated as a dashed orange line. Each of the inset plots below the figures shows a more detailed lineout of the time evolution of the plasma opacity at the photon energy of the XFEL.
It can be seen that, initially, the bound-bound absorption lines lie around ∼1190–1220 eV, whereas the L (bound-free) absorption edge of the cold material sits at ∼1250 eV. That is to say in all cases the photon energy of the XFEL lies above the cold L-edge, and thus is initially efficiently absorbed, and thus the target starts to heat and be ionised. As higher charge states are generated, both the L-M bound-bound transitions and the bound-free L-edges of these higher charge states lie at higher energies. In both the 1300 and 1400 eV cases, the heating is such that rapidly the L-edges of the ions produced lie above the incident photon energy, and the L-shell bound-free absorption decreases (which leaves photoionisation of the M shell as the main laser absorption mechanism). In the case of an incident photon energy of 1300 eV, just after the middle of the XFEL pulse, the heating is such that the L-M bound-bound transitions of the ions come into resonance, and the absorbed energy increases rapidly as a consequence, and the associated shorter absorption depth leads to the large temperature gradients shown in
Figure 3. In contrast, for an incident photon energy of 1400 eV, we have a situation where the L-M transitions never come into resonance, and the L-edges of the ions in the heated system lie above the photon energy, leaving only M-shell photoionisation as the dominant absorption mechanism throughout the laser pulse. This bound-free M-shell absorption is about an order of magnitude less than that of the L-shell, and thus the 1400 eV photons are poorly absorbed, but the plasma as a consequence has a more uniform temperature gradient. Whilst not plotted here for reasons of space, for higher incident photon energies we can see even from these plots that they will start to lie above the L-edges of the ions in the heated system, thus again leading to increased absorption at the expense of a reduction in spatial uniformity.
3.2. Experimental Results
Good quality spectra were obtained for the four XFEL photon energies of consideration. Spectra were constructed by integrating single photon detections along energy contours on the CCD image, and were then corrected for energy dispersion, solid angle projection, filter transmission and detector response.
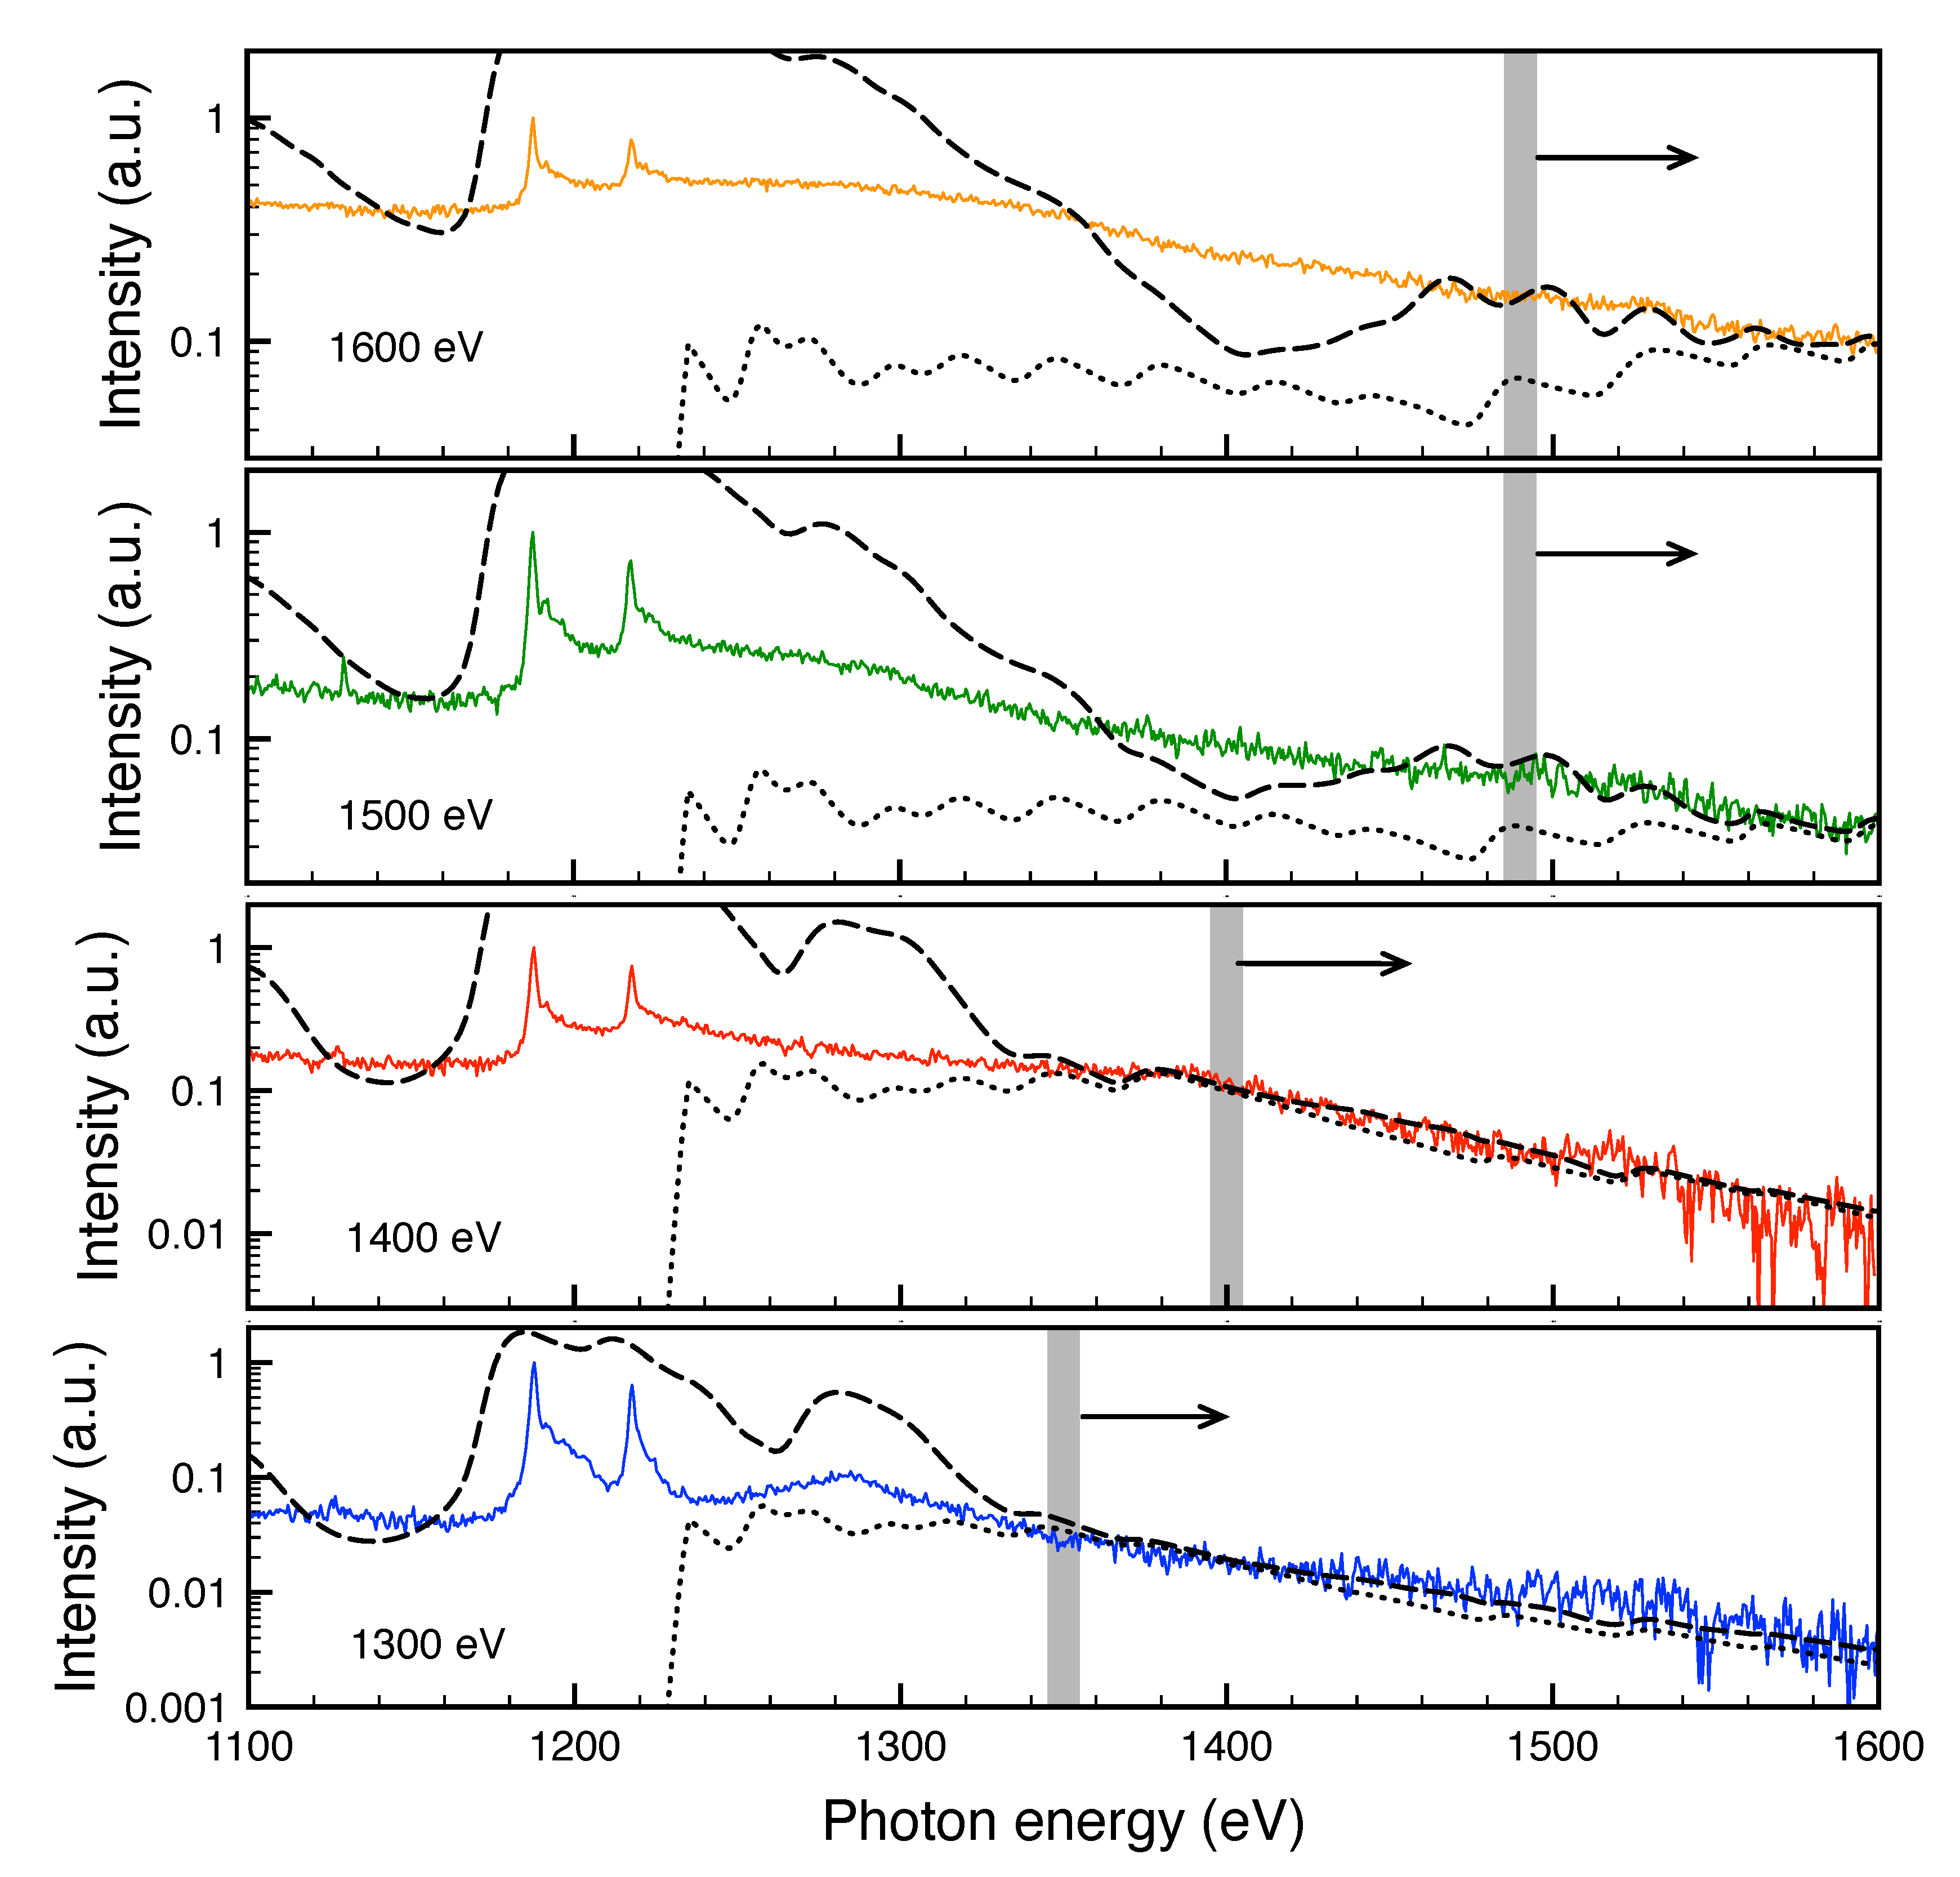
Figure 5 shows the average spectra obtained for the four XFEL photon energies of consideration, compared with the results from the radiative transfer simulations. The gray regions in the figure indicate the photon energy above which the spectral emission is dominated by bound-free transitions for each case. Note how the simulations agree with the experimental spectra in the slope of the bound-free regions, whereas the bound-bound emission features (at energies lower than those indicated with the gray regions) are not well reproduced by the simulations. This is not surprising, as modelling open shell L-shell spectra of mid- and high-Z elements is a complicated issue that the code-developing community is currently working on (see
Review of the 11th non-LTE code comparison Workshop in preparation). The level of detail necessary to treat all the atomic transitions involved in these spectra requires extremely complicated atomic data, that are usually simplified, which can underestimate the contribution of some transitions to the overall spectra.
As described in the previous section, the peak temperature of the plasma (
T) was determined by fitting the bound-free region of each measured spectrum (right of the gray regions in
Figure 5), to the function
where
K is a constant introduced to account for any background emission,
is a scaling parameter for the spectral intensity,
E is the energy of the emitted photons, and
is Boltzmann’s constant.
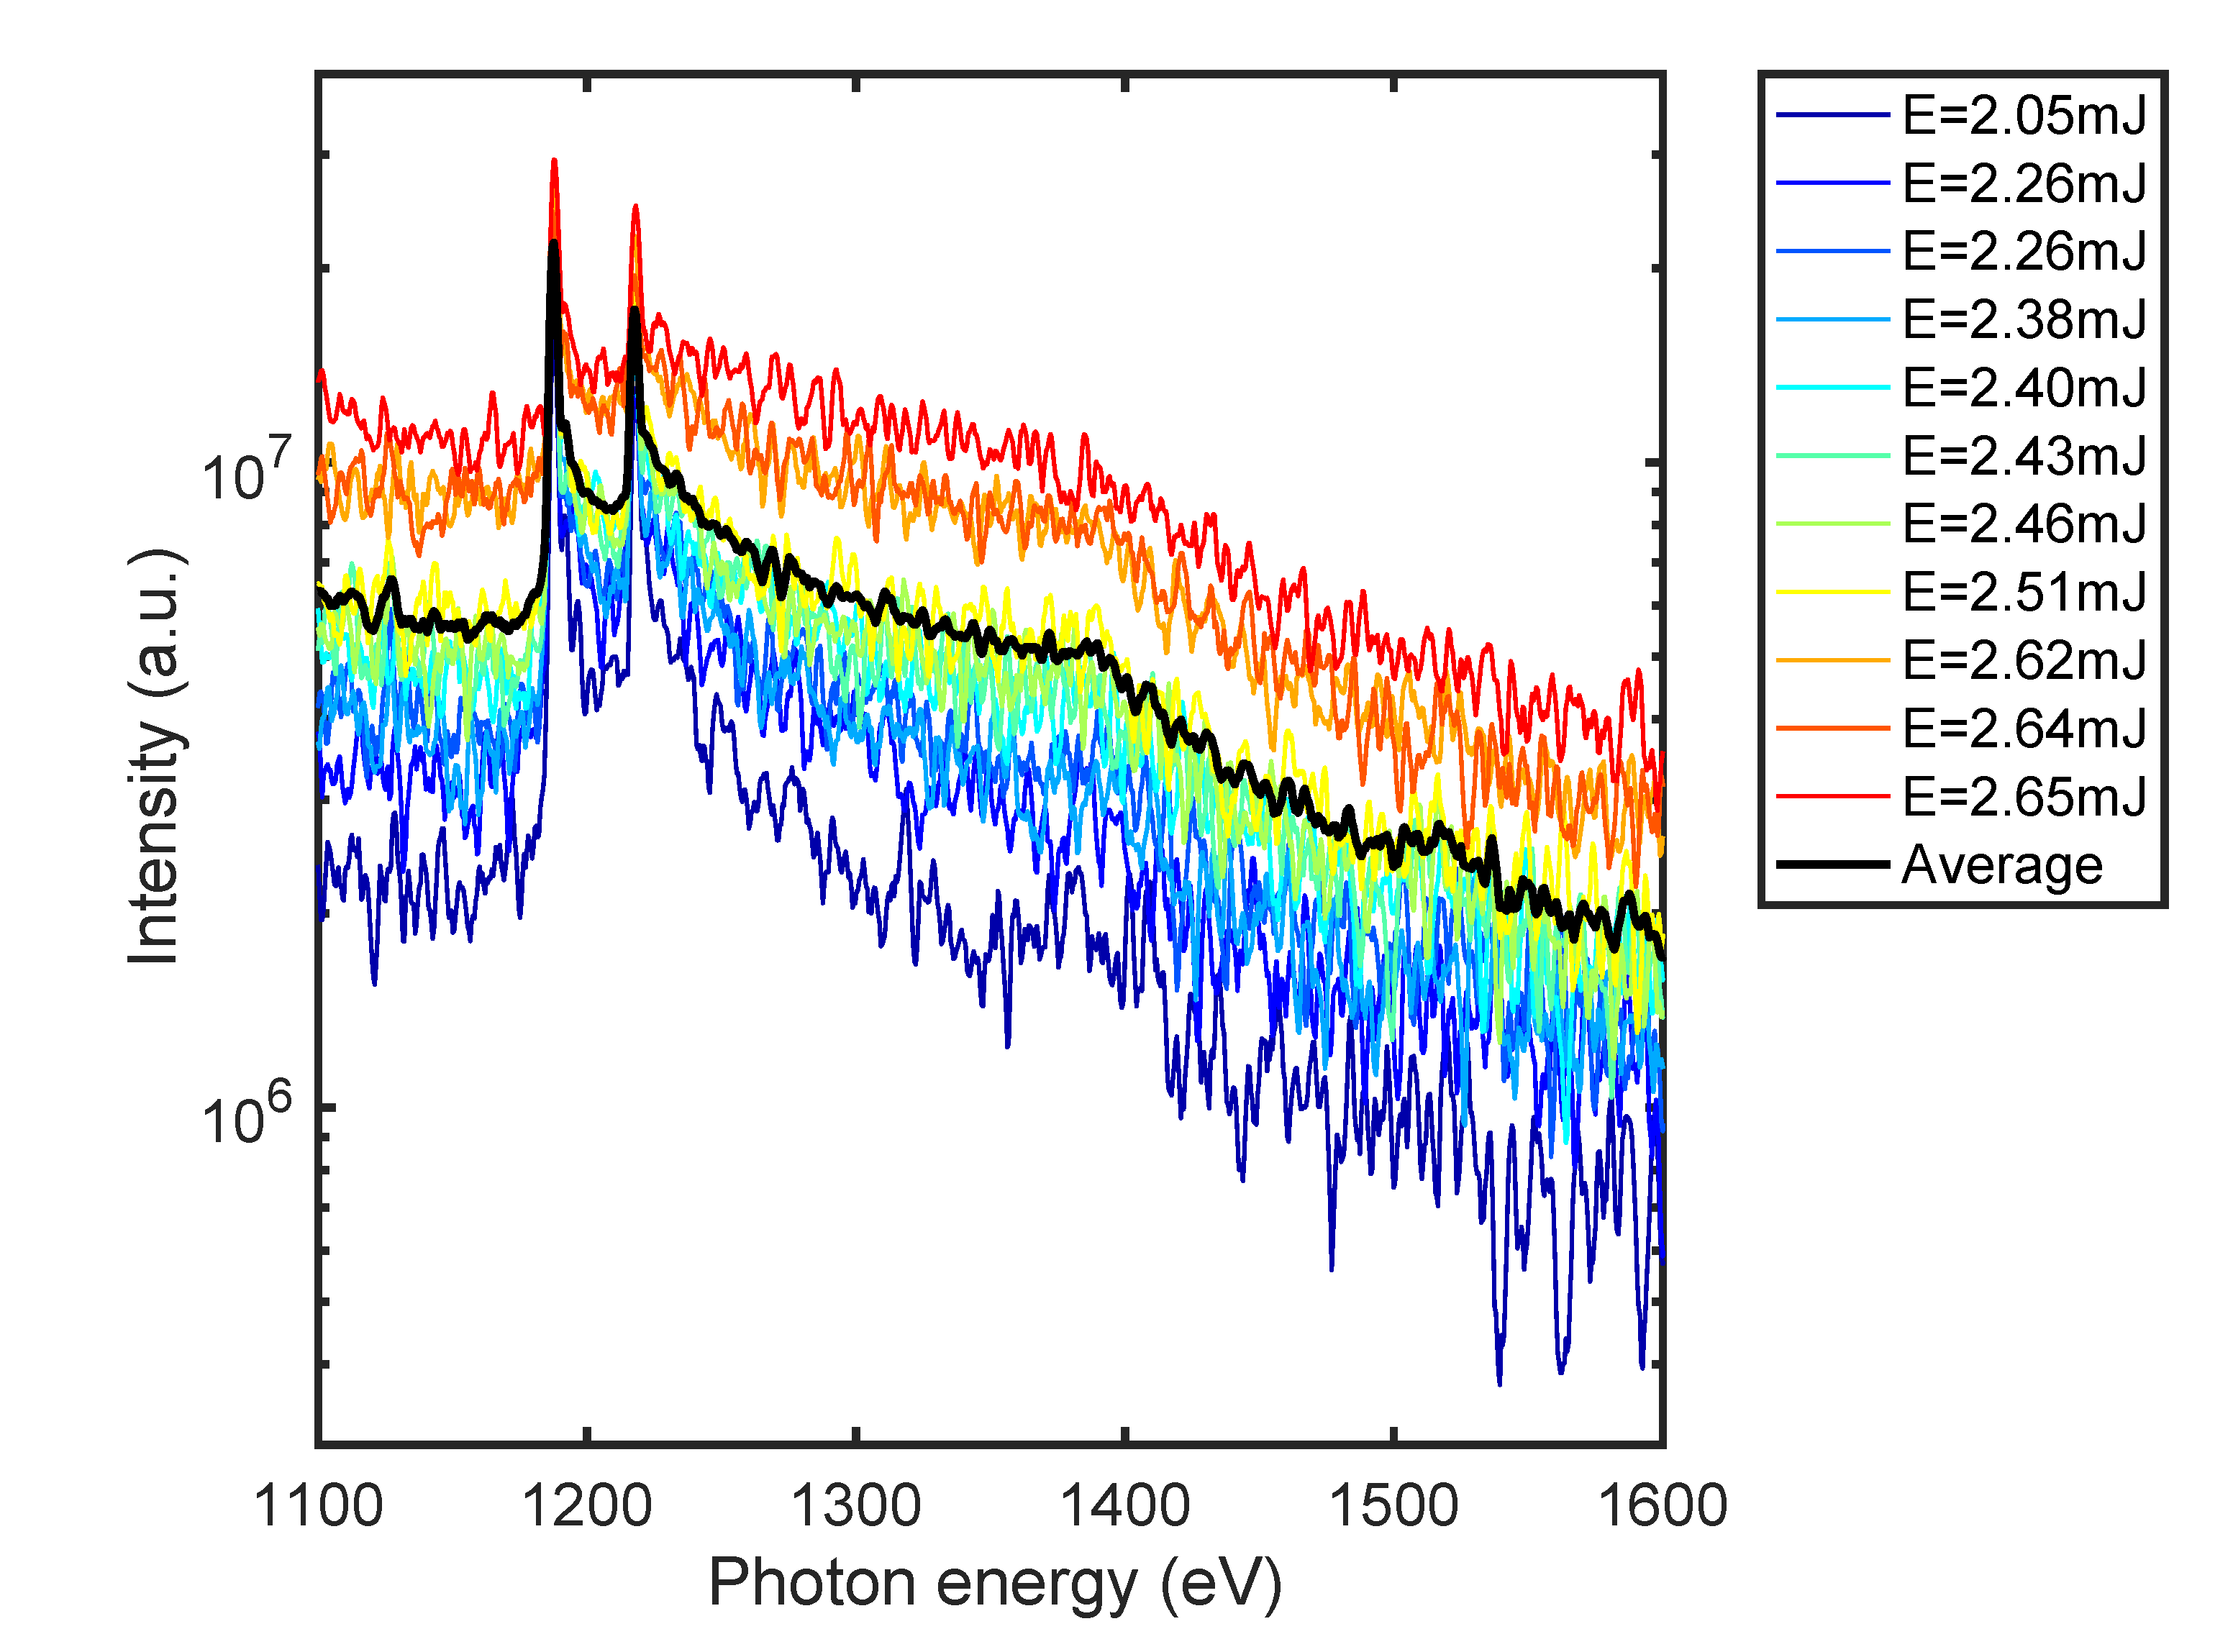
We found that variations in the XFEL pulse energy of
, translate into significant variations in the spectral intensity. This is shown in
Figure 6, where the spectra from different shots with a XFEL photon energy of 1400 eV are shown together as a function of the pulse energy together with the average spectrum. These intensity variations arise from differences in the temperature of the emitting region of the plasma, as indicated by Equation (
1), which allowed us to obtain an estimate of the error introduced in our temperature measurement by the deviations from the nominal laser energy. In
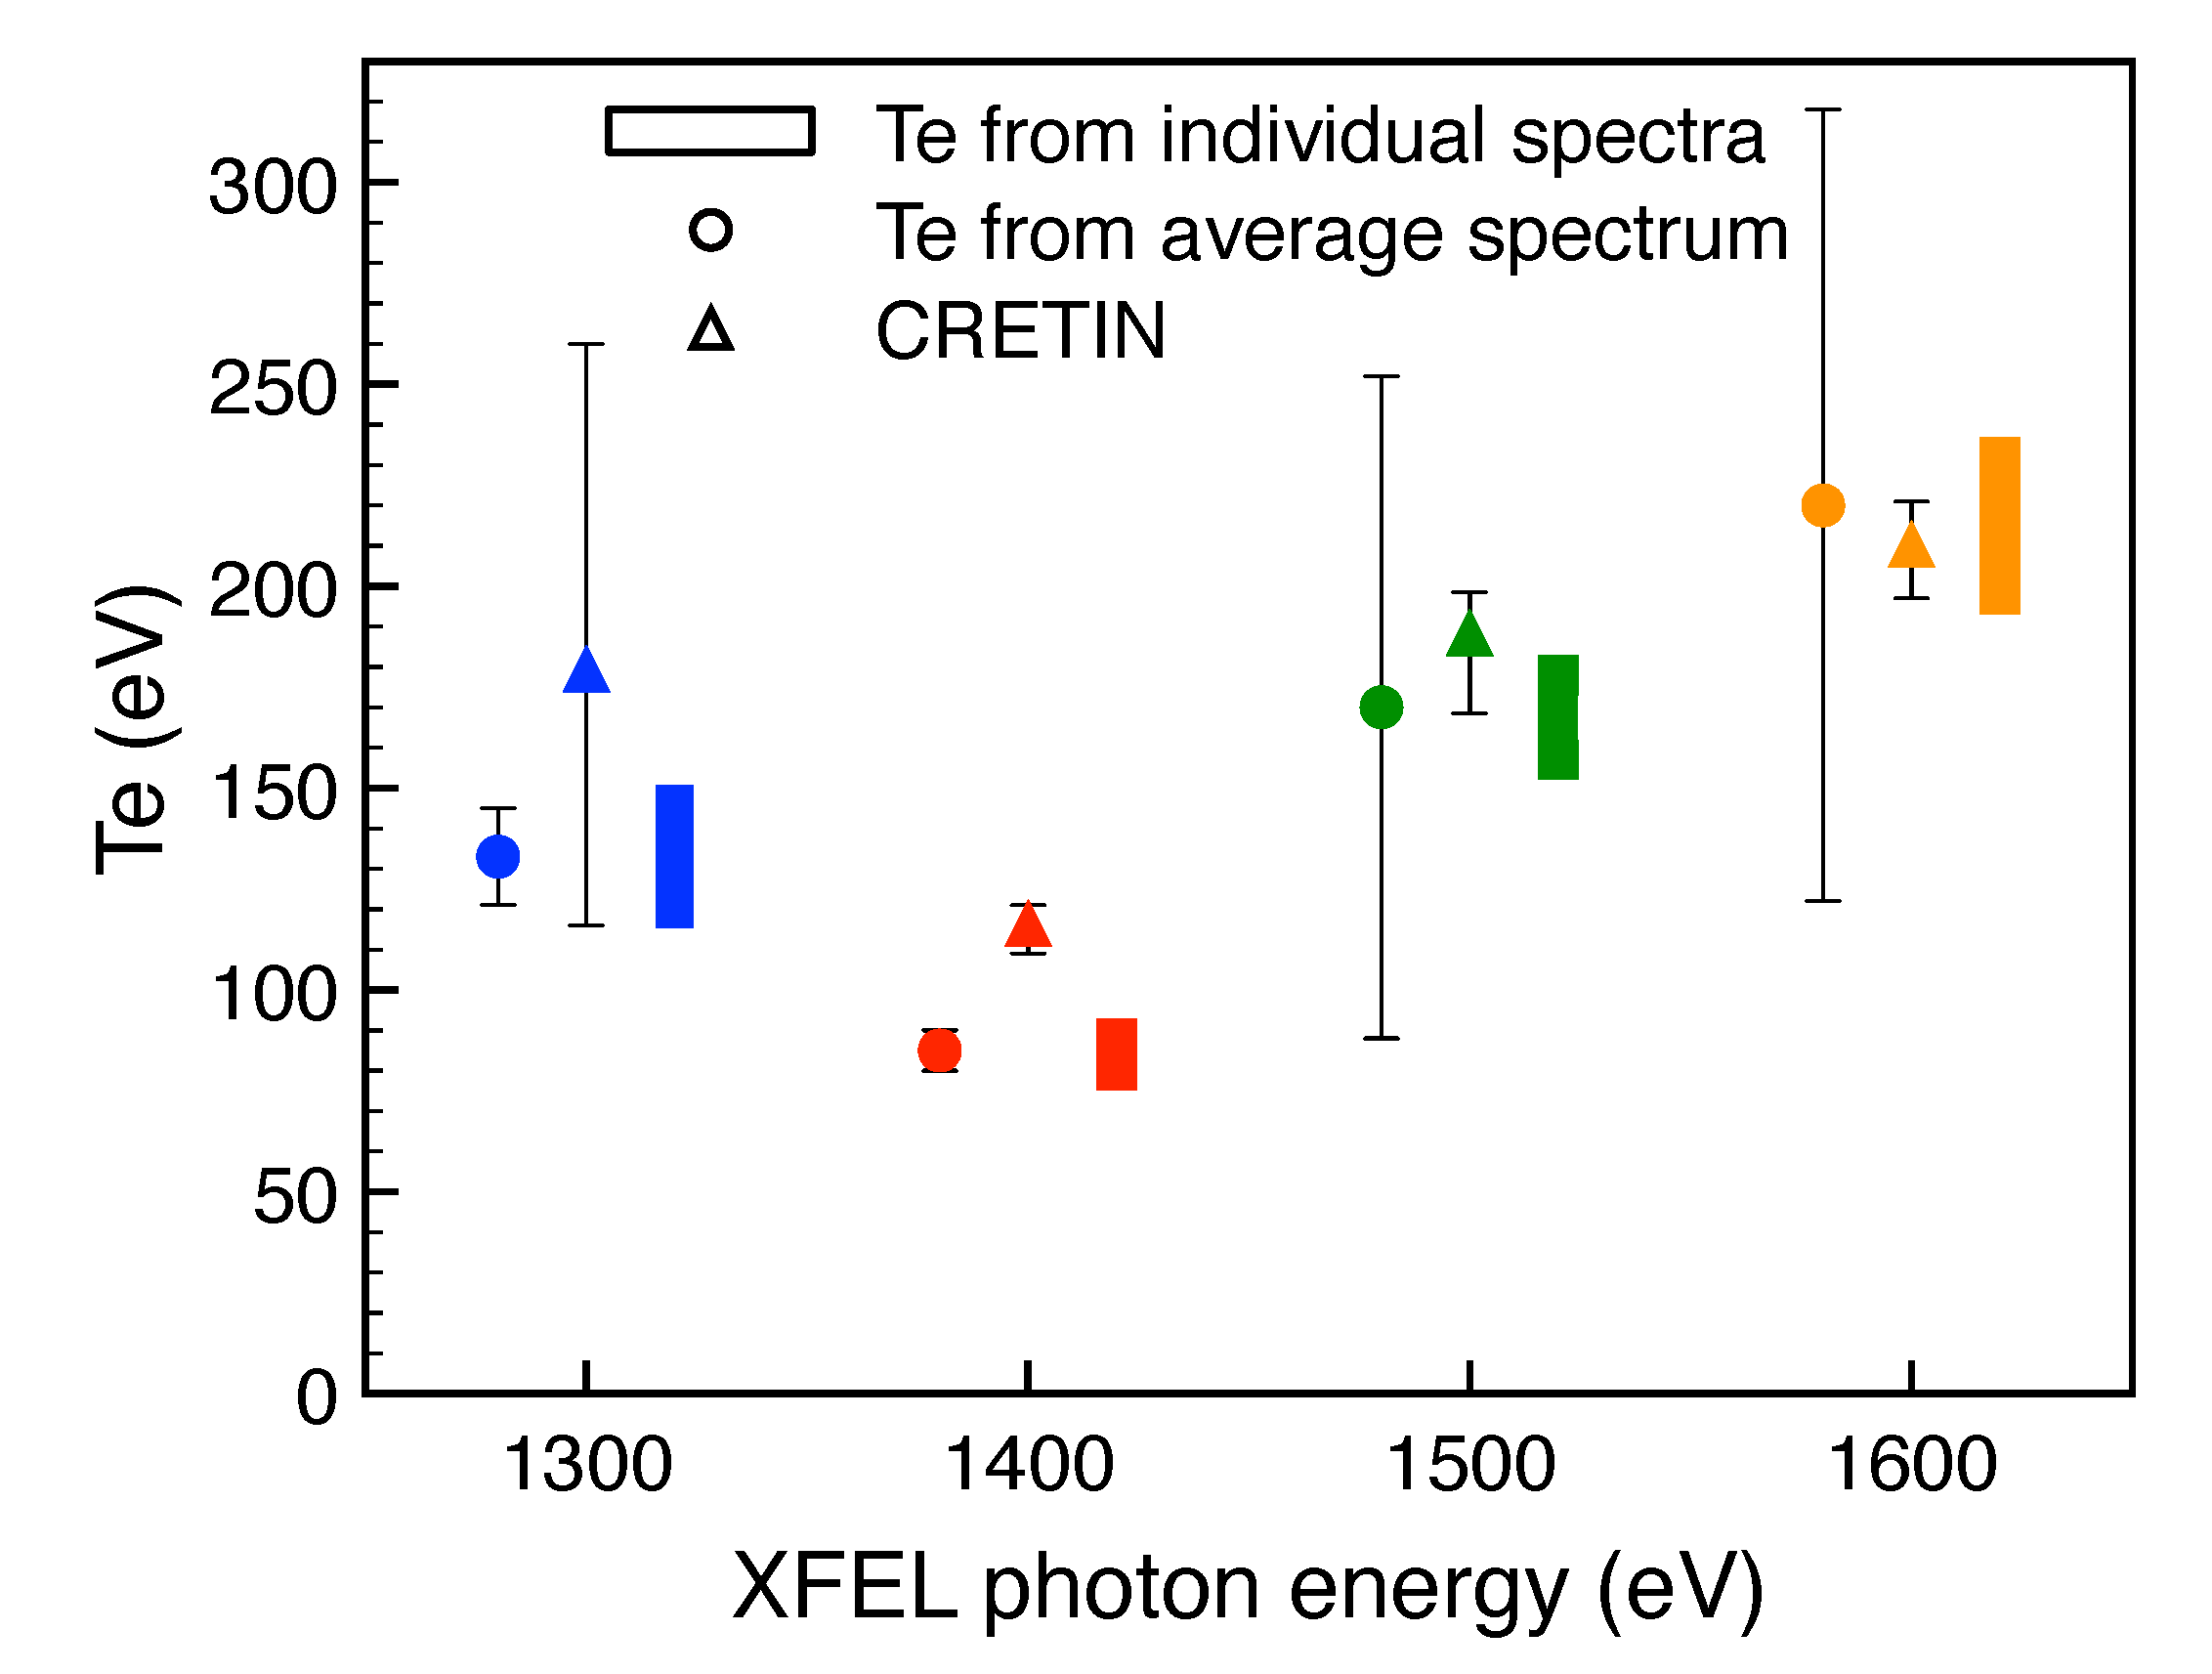
Figure 7, we show the comparison between the experimentally obtained temperatures and the peak temperatures predicted by the simulations for the four photon energies of consideration. The triangles represent the peak temperature predicted by Cretin, with the error bars corresponding to variations in this peak temperature with the change of the laser energy. The circles correspond to the temperature obtained from fitting the average spectra for each photon energy, with the error bars corresponding to the standard deviation of the fit parameters. The colored rectangles represent the range of temperatures obtained from individual shots by comparing their absolute spectral bound-free intensity with that of the average spectrum (shown in
Figure 6), as given by
.
Note that, while the temperature obtained from the average spectrum does not correspond in general with the average temperature, owing to the non-linearity of Equation (
1), the change in slope of the bound-free emission is monotonic in temperature. Therefore, over a small range of incident intensities, as is the case in this paper, this approximation is valid. Note how, as seen in
Figure 6, the slope of the bound-free emission from single shot spectra is very similar among different shots, which is indicative of small changes in the temperature. Moreover, the measured variations in the absolute intensity of the bound-free emission from single-shots, also correspond to small changes in the temperature between different shots, as shown by the colored rectangles in
Figure 7.
As expected, the lowest temperature is found for the 1400 eV case, where the laser absorption within the plasma is minimal. Additionally, as the plasma is most uniform, the temperature variations observed are minimal as well. On the contrary, for the 1300 eV case, Cretin predicts variation of ∼50% in the temperature as the laser energy is modified, owing to the sensitivity of the peak temperature achieved in this case to the position of the bound-bound absorption features. Although such variation is not found in our experimental measurements, that should not be surprising, given that (as mentioned above), the L-shell structure of mid- and high-Z materials is extremely complicated to model, and small deviations from the real position of the lines can give rise to considerable temperature variations.
For photon energies other than 1400 eV, the large peak temperatures measured (60 to 160% greater than the peak temperature measured for 1400 eV) are owed to the hot layer that is generated at the front of the target, in agreement with the Cretin simulations.
Additionally, note how for the 1500 and 1600 eV cases, the error in the temperature obtained from the average spectrum is extremely large. This can be understood by looking at
Figure 5, where we show that for these cases, although the signal above ∼1490 eV is mostly caused by bound-free emission, the slope is heavily affected by the multiple absorption edges from the different charge states present in the plasma, which therefore affect the fit of the slope.
4. Discussion and Conclusions
We have presented the results from a experiment at LCLS in which solid-density germanium plasmas were generated using four different photon energies. We have shown that careful consideration of the photon energy of the XFEL with respect to the position of the edges of the dominant ionization stages and bound-bound transitions in a heated plasma is necessary to achieve uniformity in the plasma conditions.
The experimental spectra have been modeled using one-dimensional radiative transfer simulations, weighted accordingly with the measured profile of the laser spot. The synthetic spectra showed that the time-and-space integrated spectra are heavily weighted by the plasma conditions near the peak intensity of the laser pulse, and are therefore a reasonable diagnostic of the peak temperature of the plasma. This temperature can be extracted from the slope of the bound-free spectral emission which allowed us to compare the experimental results with the predictions from the simulations.
We observed that the peak temperature of the plasma is lowest for a XFEL photon energy of 1400 eV, as this energy lies between bound-bound and bound-free absorption features in hot germanium, and therefore no hot layer is generated at the front of the target. The agreement between experiment and simulations provides further confidence that the generated conditions for this case are uniform across the target. Our measurements also show how for lower (1300 eV) and higher (1500 and 1600 eV) XFEL photon energies, the obtained peak temperatures are larger, owing to resonance with the L-M bound-bound transitions, and lying above the L-edge of the ions in the heated system respectively. Thus, the main features of the spectra, in terms of the temperatures extracted from them, are broadly in good agreement with the computational results.
This work shows that generating uniform conditions in solid density plasmas created with a XFEL for high-Z materials requires careful consideration of the experimental parameters, as the complicated atomic structure of these elements greatly complicates the interaction between the XFEL and the plasma itself.

 ,
, 


