Article

Three-Dimensional Determination of the Fusion Zone between the Distal Maxilla and the Pterygoid Plate of the Sphenoid Bone and Considerations for Implant Treatment Procedure

by
Stefan Ihde
1,*,
Łukasz Pałka
2,
Sławomir Jarząb
3,
Maciej Janeczek
4,
Karolina Goździewska-Harłajczuk
4,*,
Joanna Klećkowska-Nawrot
4,
Izabela Janus
5 and
Maciej Dobrzyński
6
1
International Implant Foundation, Dental Implants Faculty, 116 Leopold Street, 80802 Munich, Germany
2
Reg-Med Dental Clinic, Rzeszowska 2, 68-200 Zary, Poland
3
Divison of Rehabilitation in the Movement Disorders, Department of Physiotherapy, Faculty of Health Sciences, Wroclaw Medical University, Grunwaldzka 2, 50-355 Wroclaw, Poland
4
Department of Biostructure and Animal Physiology, Wroclaw University of Environmental and Life Sciences, Kozuchowska 1, 51-631 Wroclaw, Poland
5
Department of Pathology, Division of Pathomorphology and Forensic Veterinary Medicine, Wroclaw University of Environmental and Life Sciences, Norwida 31, 50-375 Wroclaw, Poland
6
Department of Pediatric Dentistry and Preclinical Dentistry, Wroclaw Medical University, Krakowska 26, 50-425 Wroclaw, Poland
*
Authors to whom correspondence should be addressed.
Appl. Sci. 2021, 11(1), 30; https://doi.org/10.3390/app11010030
Submission received: 20 November 2020 / Revised: 9 December 2020 / Accepted: 21 December 2020 / Published: 23 December 2020
(This article belongs to the Special Issue Sports Science, Medicine and Rehabilitation)

Abstract

:
During pre-operation planning, an implantologist has to decide about the location of a dental implant based on the available bone, anatomical structures and future prosthetics. The aim of this study was to provide an overview of the configurations of the junction zone of the pterygoid process, maxillary tuberosity and pyramidal process among the population and to determine the usefulness of 3D model visualization in regard to precision of anatomical structure projections for clinical planning. A total of 72 cases were analyzed for seven measurements (lateral, medial, rostral, caudal, area, line-1 longitudinal, line-2 transverse) on both body sides—right (R) and left (L). In 57 cases, age and sex of the patient were given. In 15 cases this information was missing. Among the group of 57 cases with complete data, there were 30 females (F) and 27 males (M). A total of 57 models of upper jaws including the adjacent pterygoid process of the sphenoid bone were taken for investigation. The results of the comparison between the right and left side showed no differences (p > 0.05) in values of the measured parameters. The results of the comparison between males and females showed a statistically significant difference when assessing the line-2 transverse (p < 0.05)—in the male group the average was 8.22 mm, in the female group the average was lower (7.83 mm). No statistically significant differences in values of the measured parameters for females and males were found for the left side nor for the right side. In all examined specimens there was enough bone surface in the fusion zone to allow for the stable placement of one tuberopterygoid implant.

1. Introduction

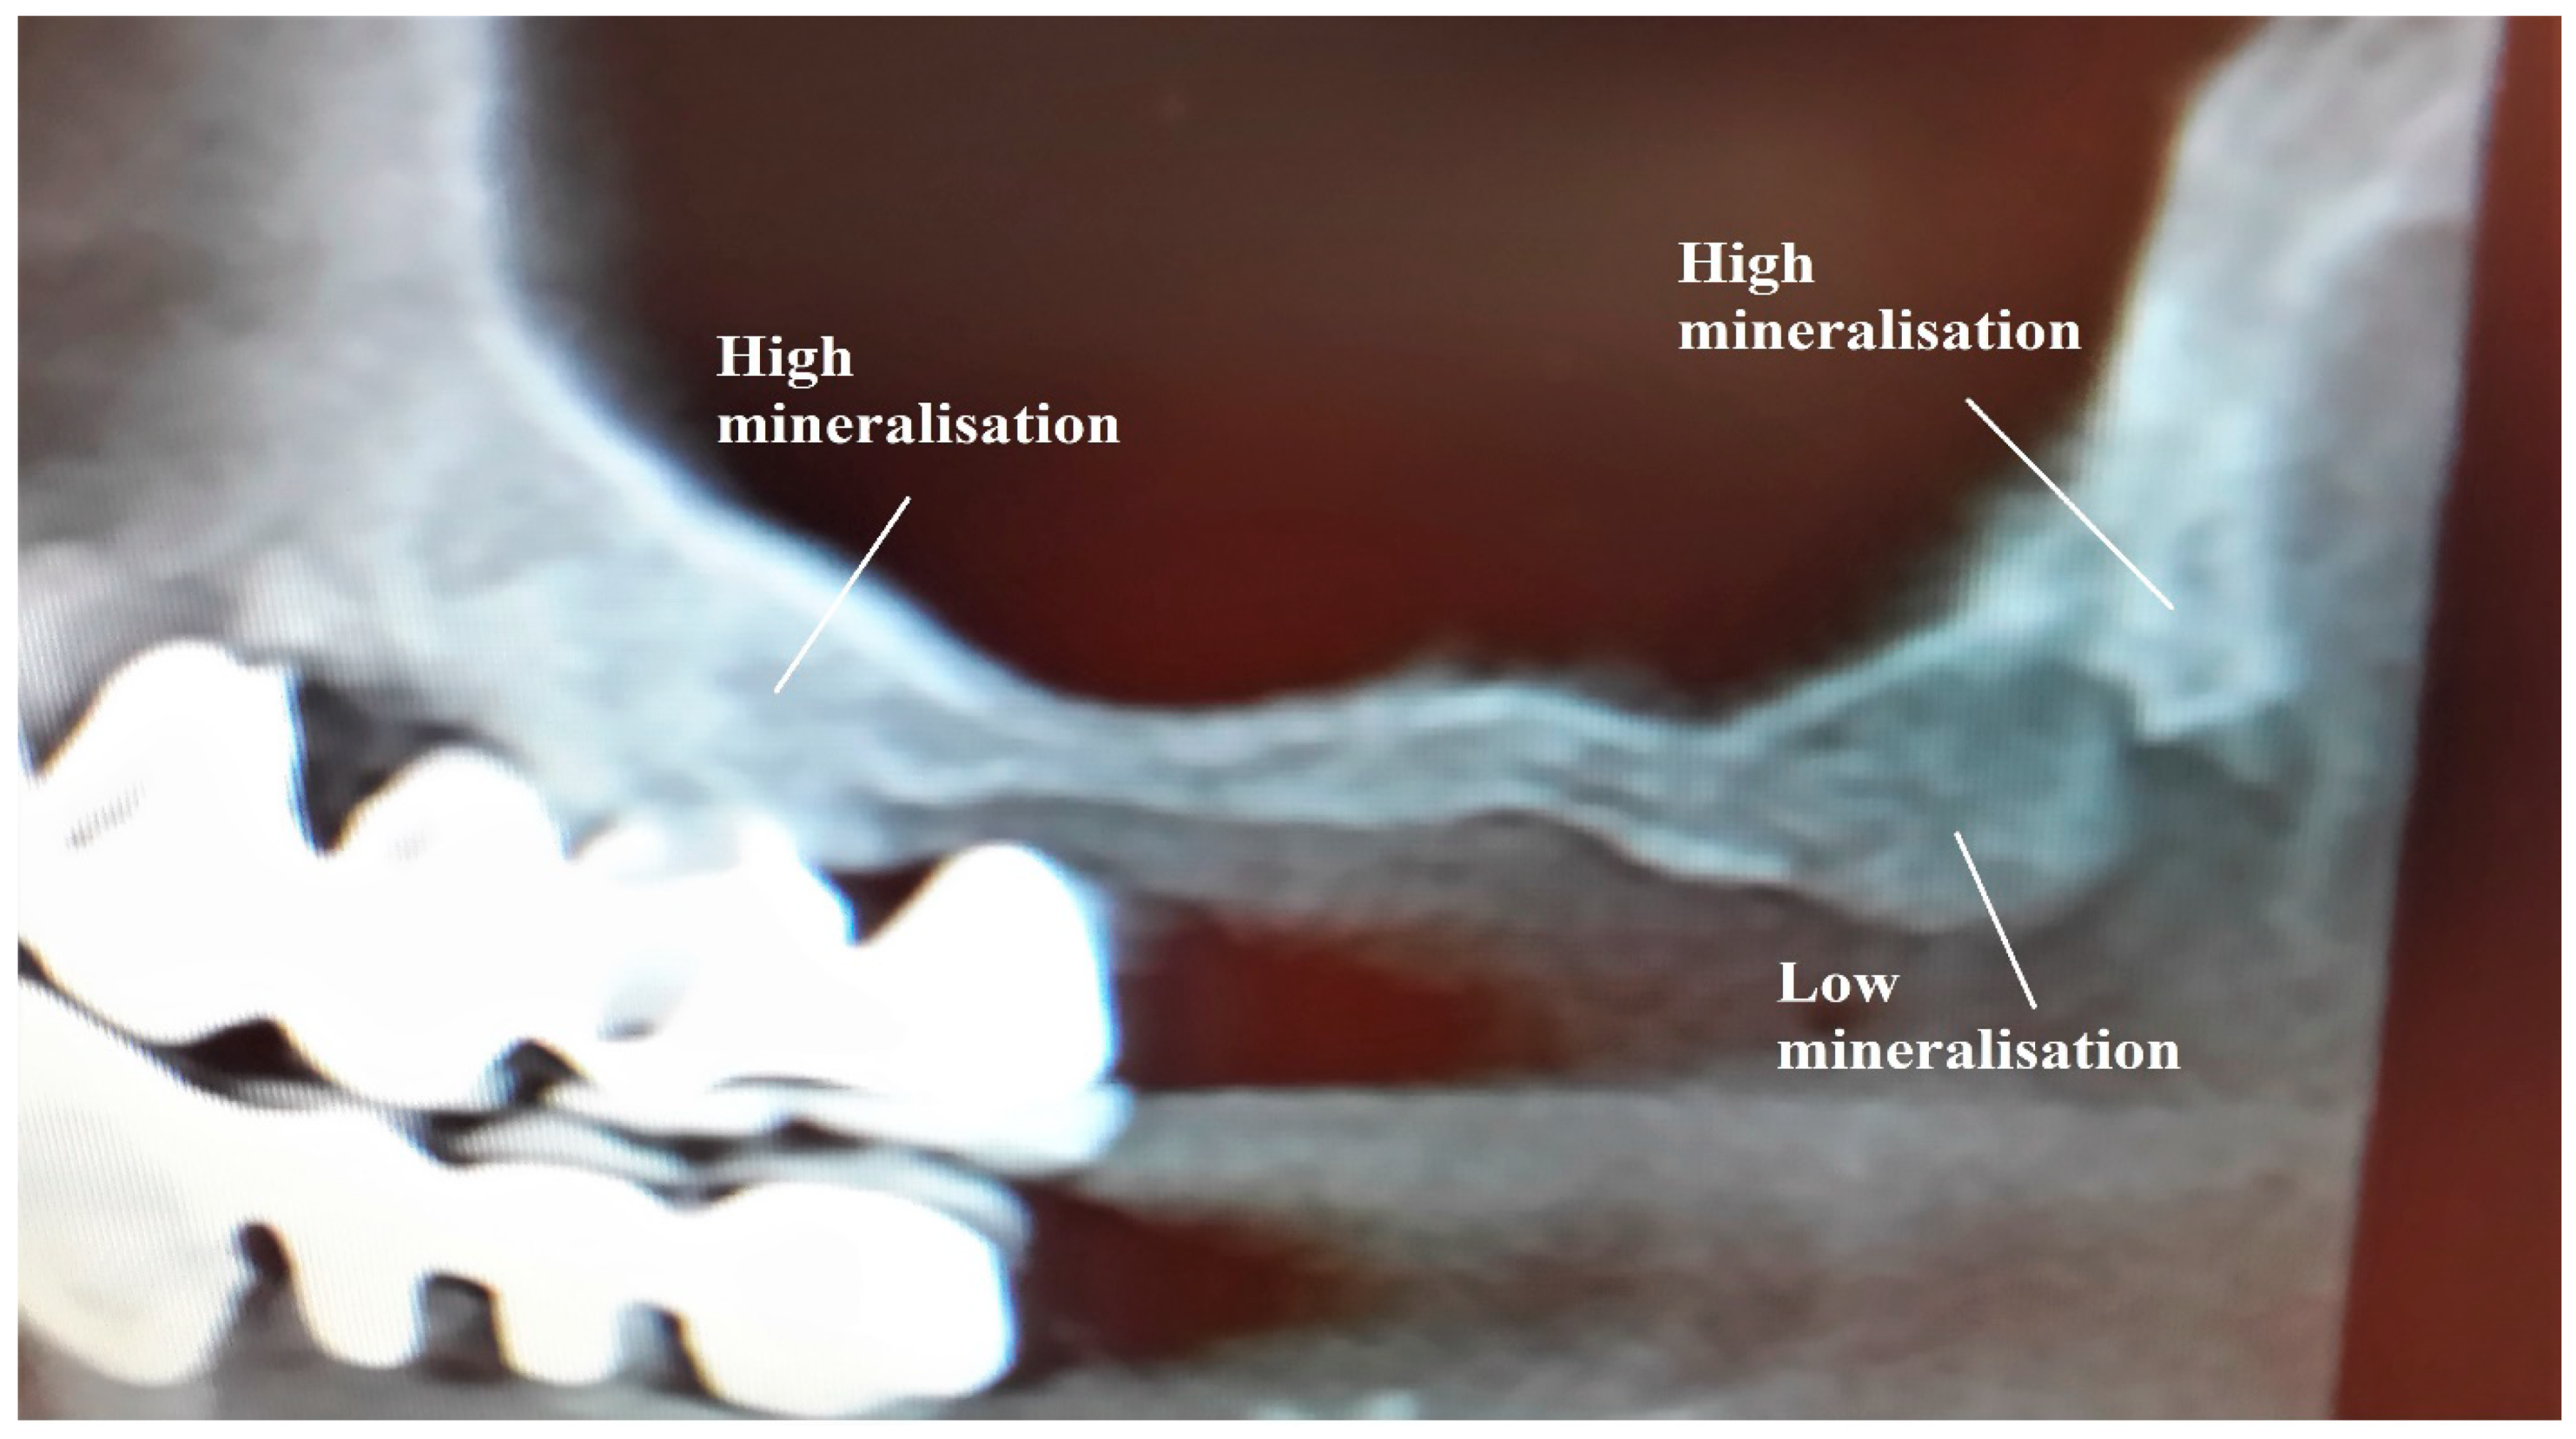
During pre-operation planning, an implantologist has to decide about the location of a dental implant based on the available bone, anatomical structures and future prosthetics. There are locations which are more—or less—favorable, such as the mandible bone which is much more suitable than the maxillary one because it is more dense, with less fat and marrow spaces, especially when the posterior parts are being considered as implantation sites [1]. In the case of severe bone atrophy in the maxillae with enlarged pneumatisation of the maxillary sinuses, it seems that the only available bone is in the front around and under nasal cavity and it is widely utilized in all-on-4, V-4 concept and nazalus implants. An alternative to these methods is zygomatic implants, but they require advance surgery, such as extensive flaps, sinus wall osteotomy and sinus membrane elevation. A third option involves an area of very good mineralization—even 139.2% greater than in the tuberosity zone—and this is called the tubero-pterygoid region [2]. In this region three bones: the maxillary tuberosity, the pterygoid process of the sphenoid bone and the pyramidal process of the palatine bone create a symphysis zone which can be used for implant anchorage, achieving great primary stabilization. There is still confusion in the literature about an adequate nomenclature of the implants and the placement sites. Terms «pterygoid» or «pterygomaxillar» and «tuberosity implants» are almost equally used. The term pterygoid is defined in the glossary of oral and maxillofacial implants, as positioning the implants through the tuberosity of maxilla into the pterygoid plate. Maxillary tuberosity is defined as the most distal aspect of the maxillary alveolar ridge [3]. Some authors use the term pterygomaxillary implants, which probably emphasizes implantation in the region of the complex anatomy of the sphenoid and palate bones [4]. Pterygoid implants go through maxillary tuberosity, but mostly anchorage occurs in the dense, compact bone of the pterygoid plates of the sphenoid bone and pyramidal process of palatal bone. In the literature regarding basal implantology, the term «tubero-pterygoid» implants is used most commonly and it will be used in this thesis as well [5,6]. Maxilla and the pterygoid process of the sphenoid bone are fused in a fusion zone (Figure 1a,b). Below and above the fusion zone both bones form a fissure. The distal maxilla and the pterygoid process differ in mineralization (Figure 2).
The literature regarding drilling directions and angulations during implant bed preparations, implant length and implant positioning is inconsistent. There are many factors that influence the right decision, such as degree of bone atrophy, maxillary sinus range diversity, soft tissue thickness or the configuration of the maxillary tuberosity in relation to the pterygoid and palatal processes themselves [7]. There are some anatomical variations of dimensional correlation of this zone which should be recognized by the operator in order to increase the surgical accuracy and to minimize the risk of complications. It is crucial to know what kind of bone configuration and anatomical structures the implant surgeon can meet in this area and how they differ among the population. One of the possible tools which can make the treatment planning more predictable is Cone Bean Computed Tomography (CBCT) and the use of a 3D printed model of the maxillae based on CBCT examination [8].
The aim of our study was to provide an overview of the configurations of the junction zone of the pterygoid process, maxillary tuberosity and pyramidal process among the population and to determine the usefulness of 3D model visualization in regard to the precision of anatomical structure projections for clinical planning.

2. Materials and Methods

A total of 72 cases were analyzed, with 3 repetitions in each cases for 7 measurements (lateral, medial, rostral, caudal, area, line-1 longitudinal–central longitudinal line on the area surface from rostral to caudal orientation, line-2 transverse–central transverse line on the area surface from lateral to medial orientation) on both body sides—right (R) and left (L).

2.1. Study Group

In 57 cases age and sex of analyzed group were given. In 15 cases this information was missing. Among the group of 57 cases with complete data, there were 30 females (F) and 27 males (M).
The age of this group of 57 cases varied from 49 to 76 years (average 61.74 years; SD = 6.01 years). The male age was from 49 to 67 years (average 59.22 years; SD = 4.96 years). The female age was from 52 to 76 years (average 64.00 years; SD = 6.04 years).
The participants were not recruited for this study. We agreed with a CT-center to supply us a copy of all consecutives CT of every case who will have an upper jaw CT. We received the CTs anonymously, and we received them with the personal information data which were required for the study, such as age and gender. Nothing else was required. Under these circumstances no consent of the people who underwent CT-examination for whatever reason they or their doctor had, was required. The cases who underwent the CT-examination were a cohort.

2.2. Measurements

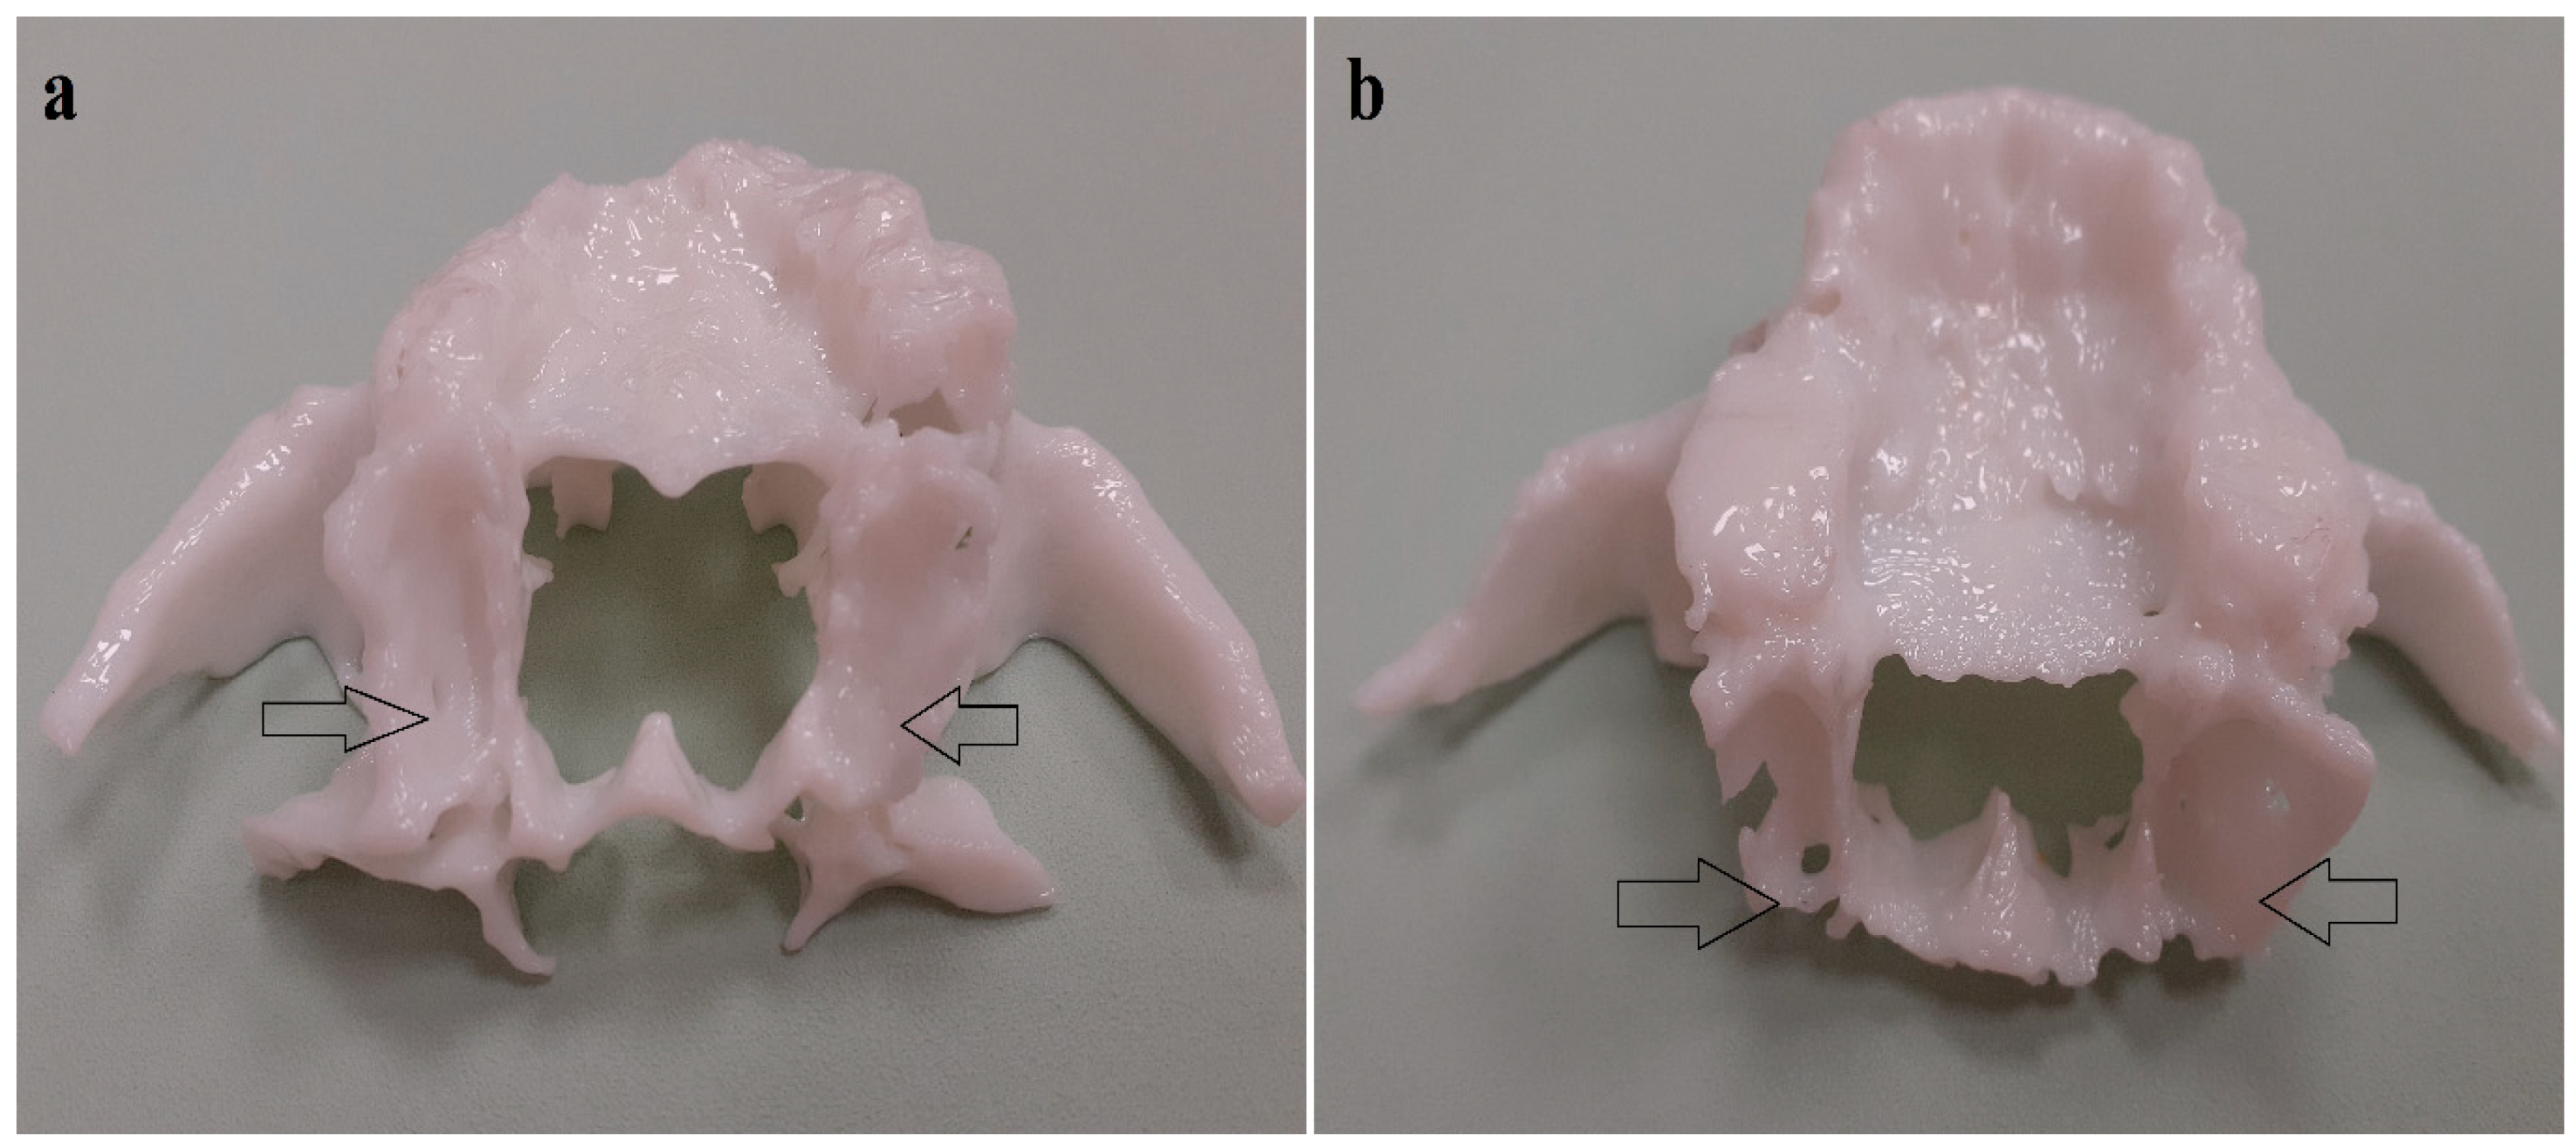
A total of 57 models of upper jaws including the adjacent pterygoid process of the sphenoid bone from randomly selected cases were taken for investigation. The only prerequisite for inclusion was either edentulousness in the upper jaw or at least some missing teeth in the distal maxilla on both sides (Figure 3). All CTs were obtained during regular CT-appointments, data were anonymized copies of the CT-data were made and only the patient’s gender and age were noted. For this investigation, permission of an ethics committee was hence not required. CTs were taken in the same center and subsequently, so from this point of view this study group represents a cohort with only one single recording (CT) taking.
Printing was done with the printing device Inspire A370
Build Volume 320 × 330 × 370 mm
12.6 × 13.0 × 14.6 in
Layer Thickness 0.175, 0.2, 0.25, 0.3, 0.35, 0.4 mm
Build Speed 5~60 cm3/h
Jetting Head Single
Build Material ABS B501
Support Material ABS S301
The craniometrical measurements were taken using electronic caliper (GEDORE No. 711) and with AxioVision Rel 4.8.2 programme (Carl Zeiss, Oberkochen, Germany) (size of the junction zone, orientation of the junction zone, size of the hammuli of the pterygoid bone).

2.3. Comparisons and Statistical Analysis

Received data were analyzed using Statistica 12 (StatSoft, Kraków, Polska) and the following tests: Shapiro–Wilk test to check the normality of data distribution; t-student test (parametric data); and Mann–Whitney U and Wilcoxon tests (nonparametric data) to check the differences between the data acquired on the right and the left side, and between the data acquired for females and males. The statistical significance was assumed as p ≤ 0.05.

3. Results

3.1. Anatomical Measurements

Average values (aver.), standard deviations (SD), range (min; max) and norm values (aver − 1.96 × SD; aver + 1.96 × SD) for each parameter are shown in the Table 1 (M—male, F—female, R—right body side, L—left body side).

3.2. Comparison between Right and Left Side

No differences (p > 0.05) in values of the measured parameters taken on the right and left side were found (Table 2).

3.3. Comparison between Female and Male Group

There was a statistically significant difference between the values for females and males when assessing the line-2 transverse (p < 0.05). The male group average was 8.22 mm, whereas the female group average was lower (7.83 mm).
No statistically significant differences in values of the measured parameters for females and males were found for the left side nor for the right side.
The values of the p parameter are presented in Table 3.

4. Discussion

Today there are two different ways of 3D printing available, printing in liquid light-cure resin, and printing with of filament materials. Resin-materials allow one to print out precise and stable models, however no internal structures inside the bone are printed, the models are massive through and through. We chose to print the models from filaments, because the procedure allowed us to print out internal structures (spongious bone struts) and these structures would be available for investigation. The idea to harness the tubero-pterygoid region for implant anchorage is quite old. In 1972 L. Linkow suggested using the pterygoid process of the sphenoid bone for additional support of subperiosteal implants of his own design [9]. In 1989 Tulsane described the idea of Paul Tesseir [10,11], in regard to implant placement in the distal part of the maxilla. The strategy for such implants is to pass through the tuberosities soft bone of upper jaw, into the pterygoid process of the sphenoid bone and to anchor in the highly mineralized pterygoid plate. Another advantage of the use of tubero-pterygoid implants is that the prosthesis will have adequate posterior support, and the necessity for cantilever is eliminated [12]. This way it becomes easily possible to treat cases with abnormal jaw relationship (e.g., cases with a skeletal angle class III) with fixed prosthodontics [13].
In other words, the procedure of implantation requires penetration through the first cortical of the maxilla in the disto-medial direction with the area of the second molar as the usual start point for the osteotomy [7,14]. If the implant is inserted through this bone junction at an angle of about 30–45 degrees, it is possible to gain more endosseous length in the dense compact bone. Considering the long distance which in most cases implants have to pass through the maxillary tuberosity or the maxillary sinus in order to reach this stable bone site, the length of pterygoid implants varies from 17–29 mm. The pyramidal process and the pterygoid plate are composed of dense, compact bone, and the average bone thickness at their junction is 6.0–6.7 mm According to the literature, the average height of the fusion zone between maxilla and sphenoid bone is around 13 mm, the anterior–posterior thickness of this zone can be between 3 mm and over 6.5 mm, the medio-lateral distance (width) being 9.5 mm. The average length from the tuberosity to the most apical point of the pterygoid apophysis is 22.5 mm ± 4.8 mm [7,15,16].
Wasemann et al. studied the usefulness of 3D printed models for orthodontic purposes with results showing that rendering the 3D model based on CBCT revealed significantly higher accuracy with regard to dental casts than dental impressions [17]. Radic et al. [18] compared the diagnostic accuracy of different dentoalveolar pathologies performed by residents of orthodontic (ORTH) and surgery (OS) departments with the use of OPG, CBCT and 3D models. The results for correct answers given by OS were 66.3% for OPG, 83.4% for CBCT and 76.4% for 3D models. This is in comparison to those given by ORTH with 63.7% for OPG, 78.0% for CBCT and 78.7% for the 3D model [18]. In the field of implantology, Bell et al. compared the accuracy of implant placement with the use of thermoplastic and 3D printed models, showing that the head and apex position of the implants placed with the use of a thermoplastic surgical guide are less accurate than those utilizing a 3D-printed surgical guide [19].
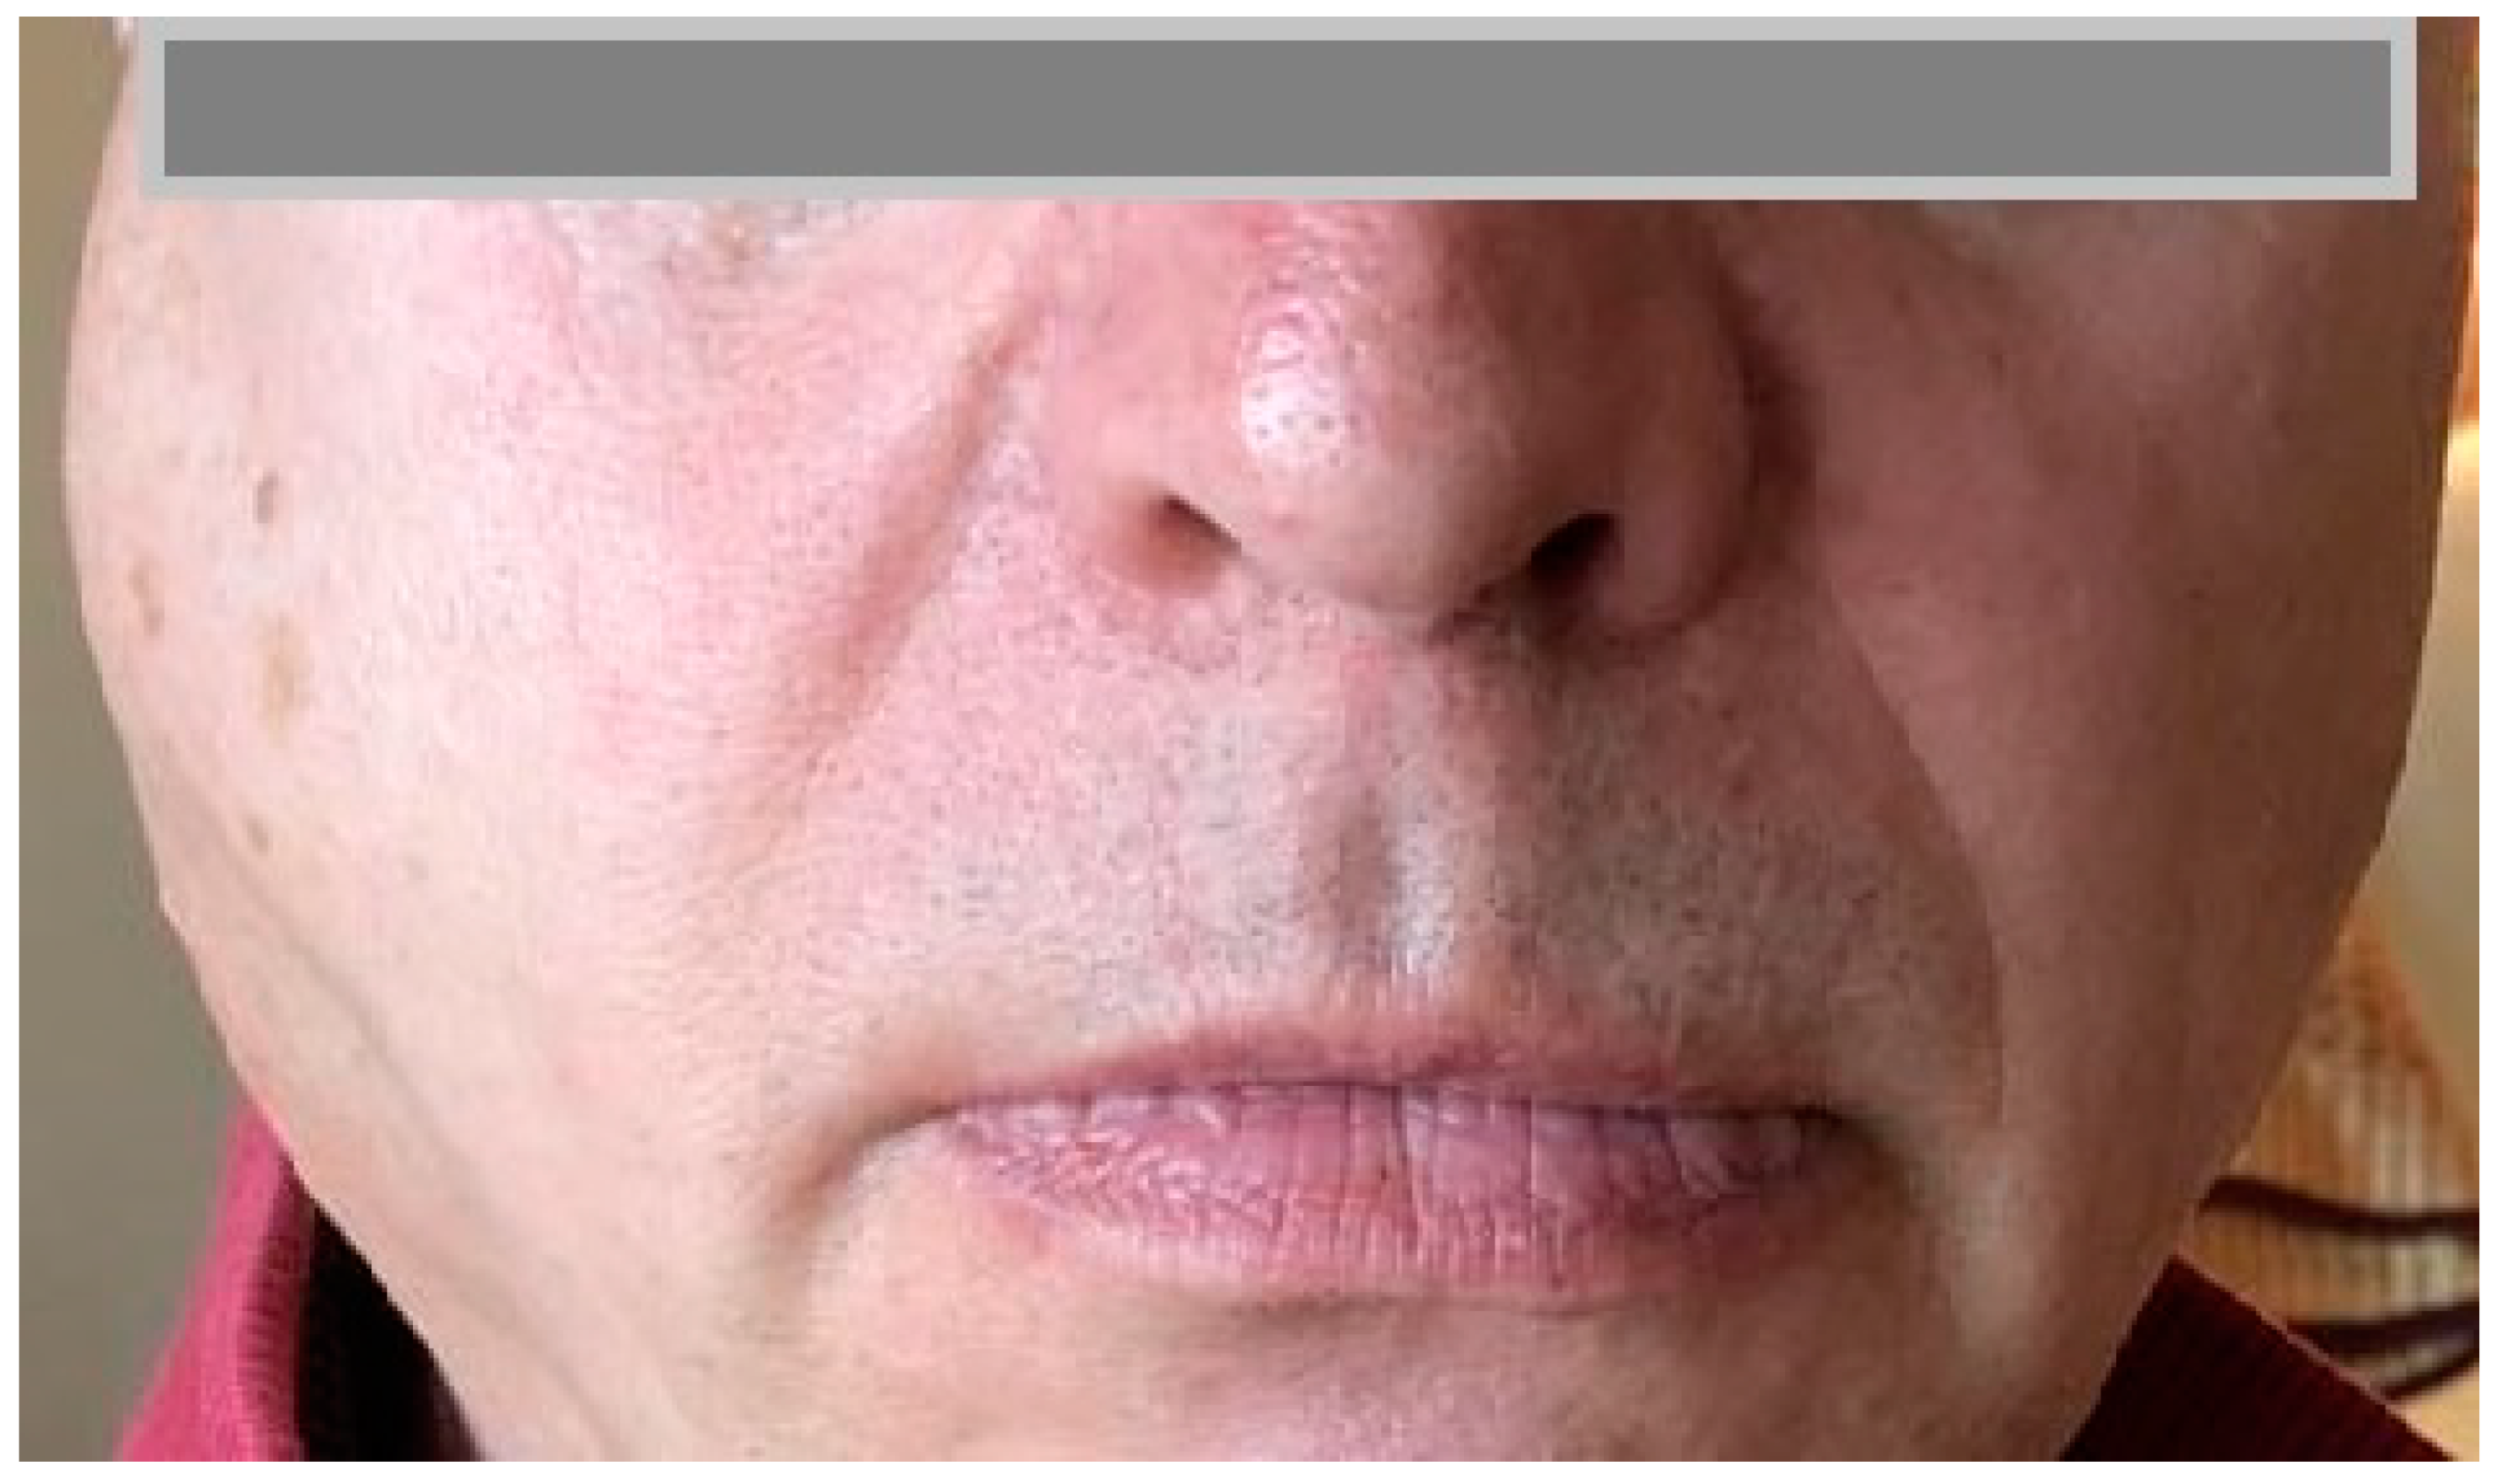
The following complications have been observed: if the apex of the implant is positioned close to the medial bony border to the nose, then the palatal artery might be opened in its intra-bony passage in the fusion zone between. This leads to a noticeable bleeding out of the drill cavity. In such cases the treatment provider will evaluate placement of a slightly shorter implant. After implant placement the bleeding stops immediately. Should the bleeding reach the pterygopalatine fossa, injections of sodium-chloride or anaesthetics are performed in order to increase the pressure inside the tissue. In such cases no bleeding out of the tissues is visible as long as no flap is raised. Swellings remain only for one or two days (Figure 4) and they do not require any therapy. Injuries of the palatal nerve have not been reported, although this nerve accompanies the mentioned vessel on its way through the junction between the maxillary bone and the pterygoid process of the sphenoid bone. According to Rodriguez et al., site-specific complications can be divided in to intraoperative: hemorrhage (palatine plexus) and postoperative: transient hypoesthesia of the palatine nerve, pterygomaxillary pain. The authors consider that the use of drills and implants, up to 20 mm in length make this a safe technique. From the author’s experience and anatomy, we know that if the length of the straight placed implant in the maxillae tuberosity region does not exceed 25 mm, then the risk of bleeding from the artery is negligible.

5. Conclusions

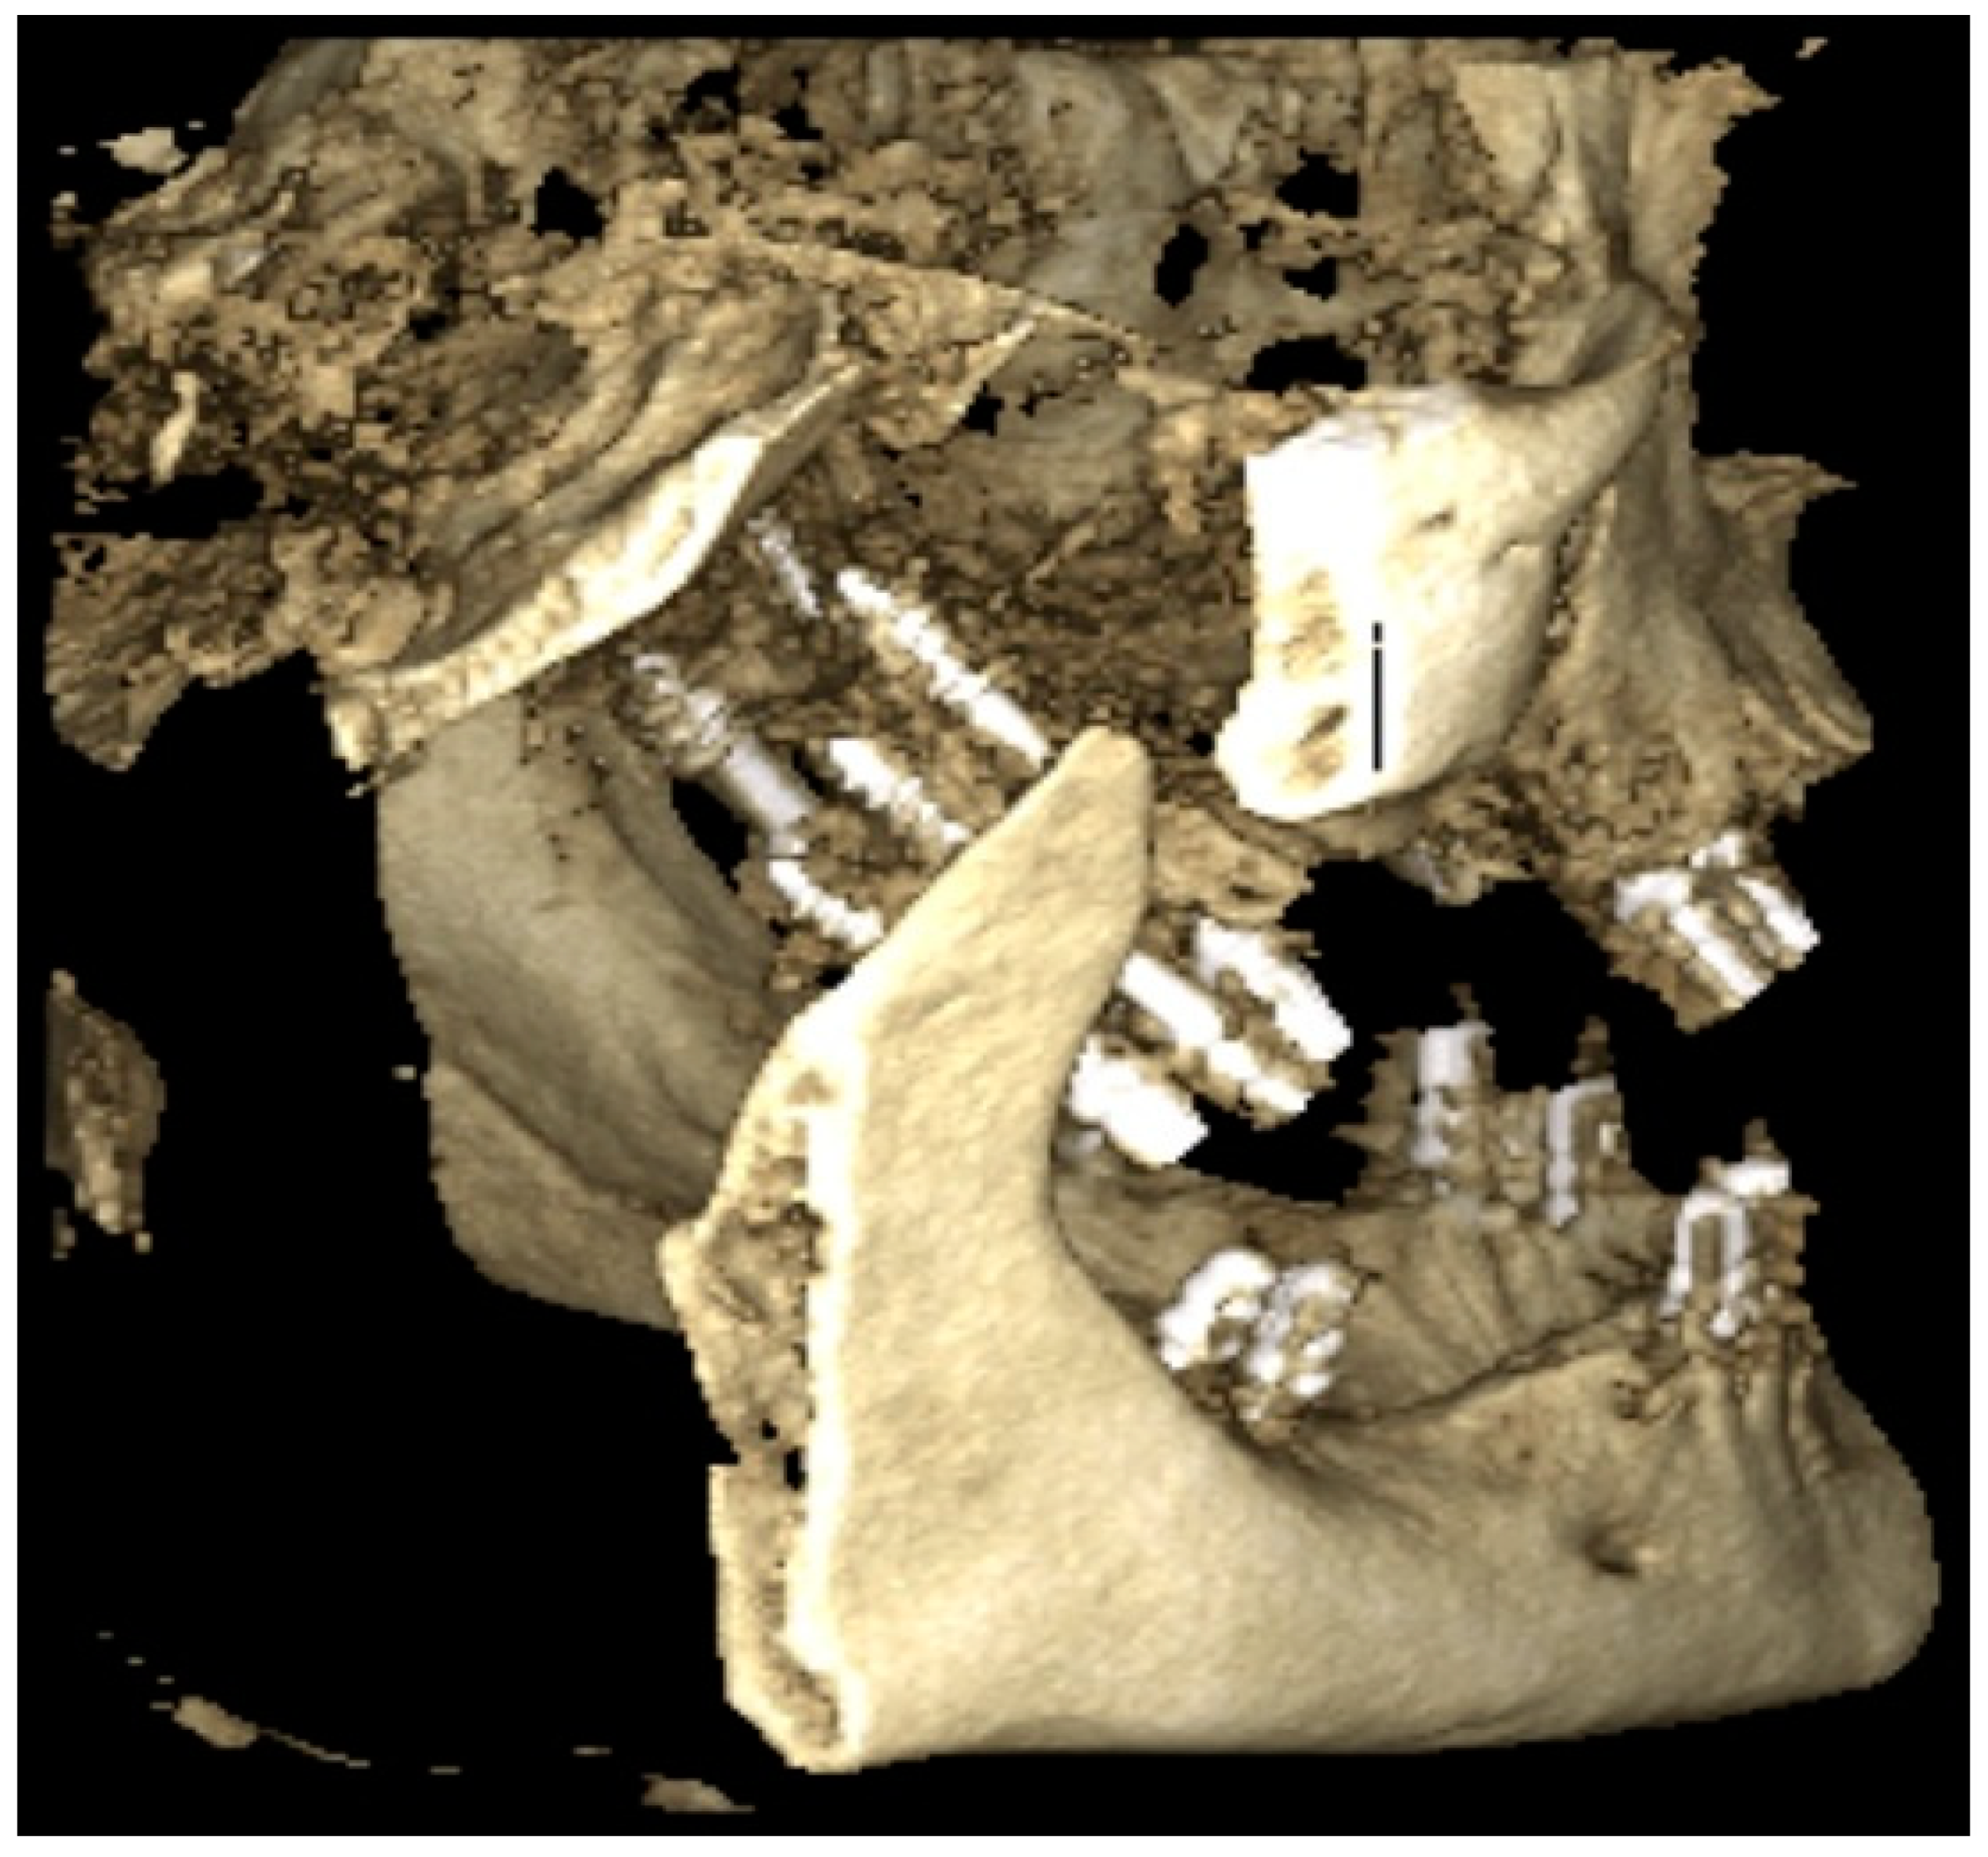
In all examined specimens there was enough bone surface in the fusion zone to allow for the stable placement of one tuberopterygoid implant. If the rectangular surface is utilized as well, two tuberopterygoid implants would have been possible. In single cases with a large fusion zone even three tuberopterygoid implants can be placed. This option should be evaluated in cases of partial maxillary resection and maxillo-facial reconstructions (Figure 5).

Author Contributions

Conceptualization, S.I. and Ł.P.; methodology, S.I., Ł.P., M.J. and M.D.; software, S.J.; validation, S.I., S.J.; formal analysis, S.I.; investigation, S.I., Ł.P.; resources, S.J.; data curation, S.J., K.G.-H., J.K.-N., I.J.; writing—original draft preparation, S.I., Ł.P., M.J.; writing—review and editing, S.I., K.G.-H., J.K.-N.; visualization, K.G.-H., J.K.-N., I.J.; supervision, M.D.; project administration, S.I., Ł.P., M.J.; funding acquisition, M.J. All authors have read and agreed to the published version of the manuscript.

Funding

This research received no external funding.

Conflicts of Interest

The authors declare no conflict of interest.

References

  1. Lindhe, J.; Bressan, E.; Cecchinato, D.; Corra, E.; Toia, M.; Liljenberg, B. Bone tissue in different parts of the edentulous maxilla and mandible. Clin. Oral Implants Res. 2013, 24, 372. [Google Scholar] [PubMed]
  2. Rodríguez, X.; Lucas-Taulé, E.; Elnayef, B.; Altuna, P.; Gargallo-Albiol, J.; Peñarrocha Diago, M.; Hernandez-Alfaro, F. Anatomical and radiological approach to pterygoid implants: A cross-sectional study of 202 conebeam computed tomography examinations. Int. J. Oral. Maxillofac. Surg. 2016, 45, 636. [Google Scholar] [CrossRef] [PubMed]
  3. Hjørting-Hansen, E.; Laney, W.R.; Broggini, N.; Buser, D.; Cochran, D.L.; Garcia, L.T. Glossary of Oral and Maxillofacial Implants; Quintessence Publishing Ltd.: Berlin, Germany, 2007. [Google Scholar]
  4. Reiser, G.M. Implant use in the tuberosity, pterygoid, and palatine region. Anatomic and surgical consideration. Implant Ther. Clin. Approaches Evid. Success. 1998, 2, 197–206. [Google Scholar]
  5. Ihde, S. Principles of BOI; Springer: Berlin/Heidelberg, Germany, 2004; ISBN 3-540-21665-0. [Google Scholar]
  6. Ihde, S.; Ihde, A. Immediate Loading, 2nd ed.; International Implant Foundation Publishing: Munich, Germany, 2012; ISBN 978-3-9851468-3-5. [Google Scholar]
  7. Lee, S.P.; Paik, K.S.; Kim, M.K. Anatomical study of the pyramidal process of the palatine bone in relation to implant placement in the posterior maxilla. J. Oral Rehabil. 2001, 28, 125–132. [Google Scholar] [CrossRef] [PubMed]
  8. Manzanera, E.; Llorca, P.; Manzanera, D.; García-Sanz, V.; Sada, V.; Paredes-Gallardo, V. Anatomical study of the maxillary tuberosity using cone beam computed tomography. Oral Radiol. 2018, 34, 56–65. [Google Scholar] [CrossRef] [PubMed]
  9. Linkow, L. The pterygoid extension implant. J. Miss. Dent. Assoc. 1972, V28, 10–19. [Google Scholar]
  10. Tulasne, J.F. Implant treatment of missing posterior dentition. In The Branemark Osseointegrated Implant; Quintessence: Chicago, IL, USA, 1989; pp. 103–116. [Google Scholar]
  11. Tulasne, J.F. Osseointegrated fixtures in the pterygoid region. In Advanced Osseointegration Surgery Applications in the Maxillofacial Region; Quintessence: Chicago, IL, USA, 1992; pp. 182–188. [Google Scholar]
  12. Balshi, T.J.; Wolfinger, G.J.; Balshi, S.F., 2nd. Analysis of 356 pterygomaxillary implants in edentulous arches for fixed prosthesis anchorage. Int. J. Oral Maxillofac. Implants 1999, 14, 398–406. [Google Scholar] [PubMed]
  13. Ihde, S. Fixed Prosthodontics in Skeletal Class III Patients with partially edentulous jaws and age related prognathism: The basal osseointegration procedure. Implant Dent. 1999, 8, 241. [Google Scholar] [CrossRef] [PubMed]
  14. Graves, S.L. The pterygoid plate implant: A solution for restoring the posterior maxilla. Int. J. Periodontics Restor. Dent. 1994, 14, 512–523. [Google Scholar]
  15. Rodriguez, X.; Lucas-Taule, E.; Elnayef, B. Anatomical and radiological approach to pterygoid implants: A cross-sectional study of 202 cone beam computed tomography examinations. Int. J. Oral Maxillofac. Surg. 2016, 45, 636–640. [Google Scholar] [CrossRef] [PubMed]
  16. Rodriguez, X.; Mendez, V.; Vela, X.; Segala, M. Modified surgical protocol for placing implants in the pterygomaxillary region: Clinical and radiologic study of 454 implants. Int. J. Oral Maxillofac. Implant 2012, 27, 1547–1553. [Google Scholar]
  17. Wesemann, C.; Muallah, J.; Mah, J.; Bumann, A. Accuracy and efficiency of full-arch digitalization and 3D printing: A comparison between desktop model scanners, an intraoral scanner, a CBCT model scan, and stereolithographic 3Dprinting. Quintessence Int. 2017, 48, 41–50. [Google Scholar] [CrossRef] [PubMed]
  18. Radic, J.; Patcas, R.; Stadlinger, B.; Wiedemeier, D.; Rücker, M.; Giacomelli-Hiestand, B. Do we need CBCTs for sufficient diagnostics?-dentist-related factors. Int. J. Implant Dent. 2018, 4, 37. [Google Scholar] [CrossRef] [PubMed] [Green Version]
  19. Bell, C.K.; Sahl, E.F.; Kim, Y.J.; Rice, D.D. Accuracy of Implants Placed with Surgical Guides: Thermoplastic Versus 3D Printed. Int. J. Periodontics Restor. Dent. 2018, 38, 113–119. [Google Scholar] [CrossRef] [PubMed] [Green Version]
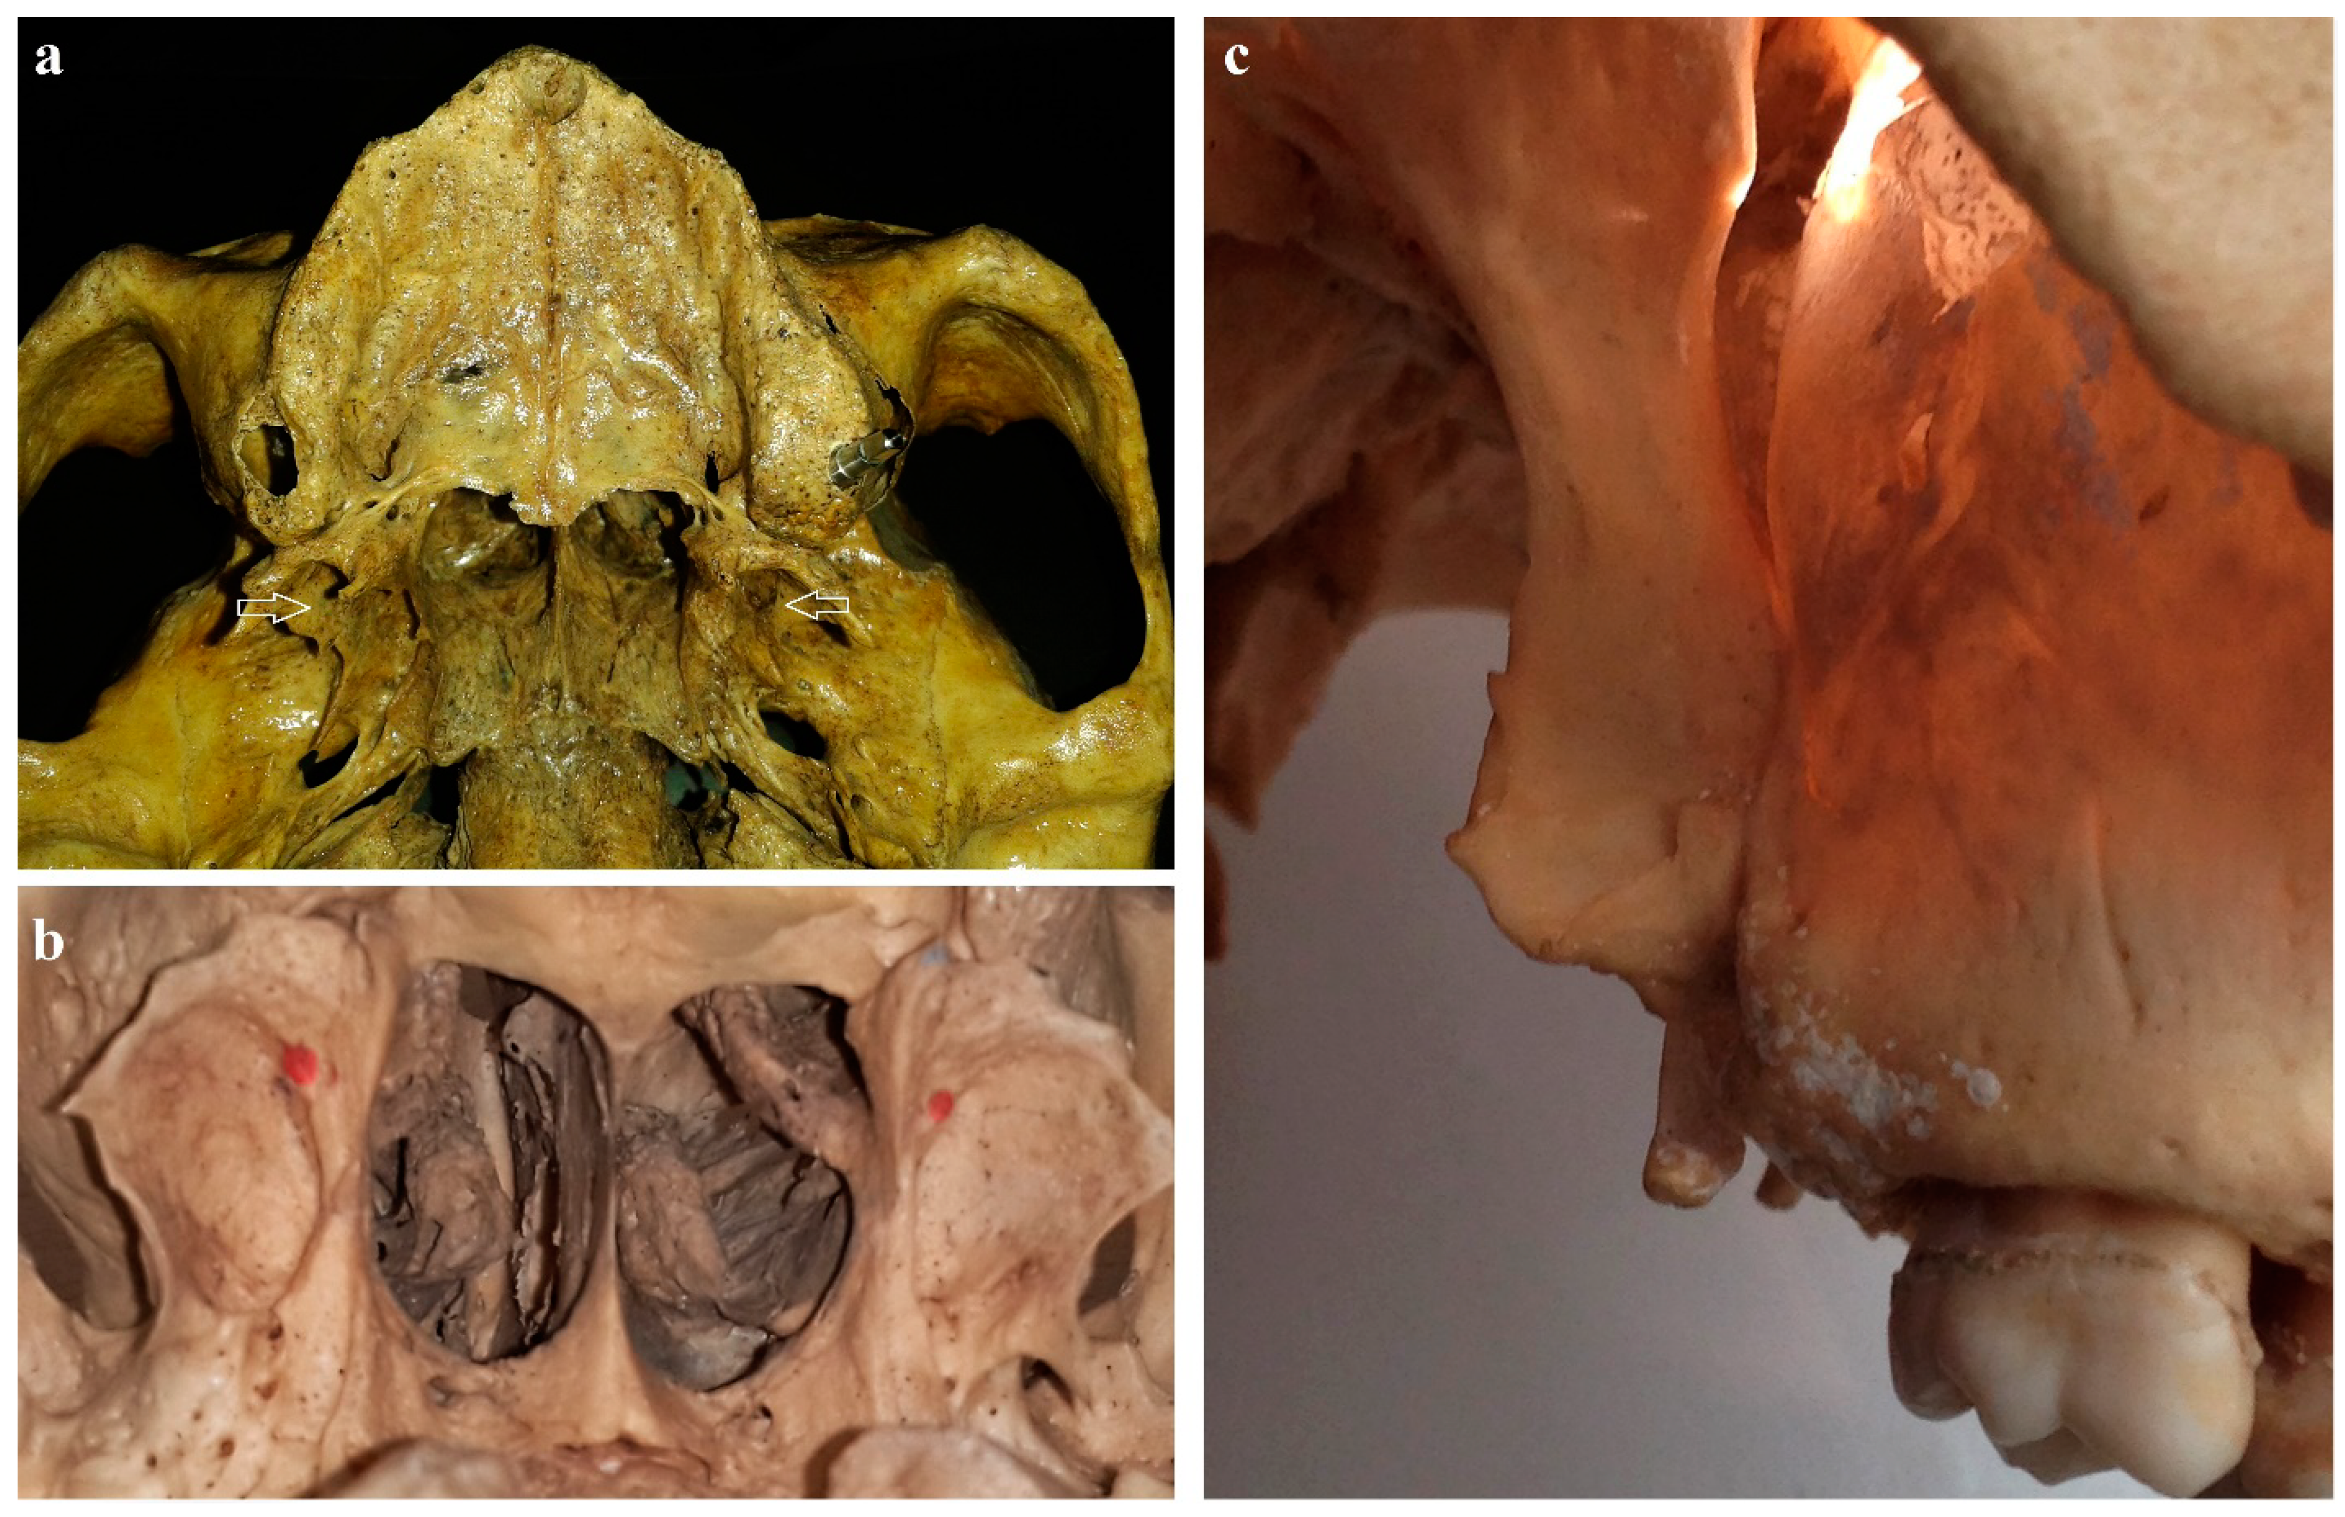
Figure 1. View from distal towards both processus pterygoidei and into the nasal cavity (a,b). White arrows indicate the junction zone of the pterygoid process, maxillary tuberosity and pyramidal process (a). Red points mark ideal penetration points for the apex of the implants (b). This case shows a pronounced atrophy of the distal maxilla (centrifugal atrophy) (b). View of lateral distal maxilla and adjacent processus pterygoidei of the sphenoid bone (c).
Applsci 11 00030 g001
Figure 2. View on distal maxilla and adjacent processus pterygoideus of the sphenoid bone on a panoramic picture. Both the bone of the pterygoid processus pterygoideus and the anterior maxilla show high mineralization, whereas the bone in the region of the two premolars appears strongly atrophied (both from the side of the maxillary sinus and from the crest of the alveolar process) and with low mineralization.
Applsci 11 00030 g002
Figure 3. 3D models of the upper jaw with the visualization of the junction zone. (a) 3D model of the male upper jaw; (b) 3D model of the female upper jaw.
Applsci 11 00030 g003
Figure 4. Visualization of such a swelling on the postoperative day. The swelling was gone 2 days later without any therapy. The bleeding takes place in a closed compartment. In some cases the swelling is visible only cranially to the zygomatic arch.
Applsci 11 00030 g004
Figure 5. Visualization of the partial maxillary resection.
Applsci 11 00030 g005
Table 1. Summary of anatomical measurement results for the whole examined group.
ParameterAverSDRangeNorm
MinMaxAver − 1.96 × SDAver + 1.96 × SD
no divisionlateral (mm)18.743.26.6825.4412.4625.01
medial (mm)18.733.028.6424.3912.8224.65
rostral (mm)5.990.93.578.244.227.75
caudal (mm)8.921.375.7711.756.2311.61
area (mm2)157.7739.0745.36328.881.18234.36
line-1 longitudinal (mm)20.363.037.7926.5414.4126.31
line-2 transverse (mm)7.790.925.429.795.999.59
right body sideR lateral (mm)18.883.516.6825.4412.0125.76
R medial (mm)18.673.268.6423.5912.2925.06
R rostral (mm)5.990.993.577.994.067.93
R caudal (mm)8.861.305.8311.196.3111.41
R area (mm2)160.0644.6845.36328.872.48247.63
R line-1 longitudinal (mm)20.513.387.7926.2113.8927.12
R line-2 transverse (mm)7.820.935.879.426.009.63
left body sideL lateral (mm)18.592.886.8325.0512.9524.24
L medial (mm)18.792.7810.024.3913.3524.24
L rostral (mm)5.980.814.528.244.397.57
L caudal (mm)8.981.455.7711.756.1411.82
L area (mm2)155.4832.6948.74234.9691.41219.55
L line-1 longitudinal (mm)20.212.669.1126.5414.9925.44
L line-2 transverse (mm)7.770.925.429.975.979.57
femaleF lateral (mm)18.862.7512.0522.6713.4824.24
F medial (mm)18.922.609.9223.413.8324.01
F rostral (mm)5.850.774.07.54.347.36
F caudal (mm)9.041.465.7711.756.1811.89
F area (mm2)164.1443.7878.18328.878.34249.94
F line-1 longitudinal (mm)20.622.4713.2125.2415.7725.47
F line-2 transverse (mm)7.830.945.969.975.999.67
maleM lateral (mm)19.472.9515.3125.4413.6925.25
M medial (mm)18.783.2612.6324.3912.3925.17
M rostral (mm)6.011.033.578.244.008.02
M caudal (mm)9.371.177.5711.197.0811.67
M area (mm2)166.1527.86103.2234.96111.55220.74
M line-1 longitudinal (mm)21.052.7416.426.5415.6826.43
M line-2 transverse (mm)8.220.666.799.426.929.52
female; right sideFR lateral (mm)18.983.1612.0522.6712.7925.17
FR medial (mm)18.813.089.9223.412.7724.84
FR rostral (mm)5.790.834.07.154.167.41
FR caudal (mm)9.001.336.8611.06.3911.62
FR area (mm2)170.5555.7278.18328.861.35279.76
FR line-1 longitudinal (mm)20.762.9813.2125.2414.9226.61
FR line-2 transverse (mm)7.810.885.969.056.089.54
female; left sideFL lateral (mm)18.752.3113.1421.0714.2223.28
FL medial (mm)19.032.0515.6822.3615.0123.05
FL rostral (mm)5.910.725.077.54.507.32
FL caudal (mm)9.071.595.7711.755.9512.19
FL area (mm2)157.7326.63117.05212.11105.53209.92
FL line-1 longitudinal (mm)20.481.8816.8522.6316.8024.16
FL line-2 transverse (mm)7.861.016.369.975.889.83
male; right sideMR lateral (mm)19.643.3515.3125.4413.0826.21
MR medial (mm)18.533.3312.823.5912.0125.04
MR rostral (mm)6.041.183.577.763.748.35
MR caudal (mm)9.281.147.5711.197.0311.52
MR area (mm2)163.6126.72103.2210.1111.24215.99
MR line-1 longitudinal (mm)21.212.9516.426.2115.4227.00
MR line-2 transverse (mm)8.250.846.799.426.619.90
male; left sideML lateral (mm)19.302.5415.6325.0514.3324.27
ML medial (mm)19.033.2312.6324.3912.7025.37
ML rostral (mm)5.980.875.178.244.287.69
ML caudal (mm)9.471.217.7611.017.0911.85
ML area (mm2)168.6829.23131.88234.96111.39225.97
ML line-1 longitudinal (mm)20.902.5617.8726.5415.8725.92
ML line-2 transverse (mm)8.180.437.558.747.339.02
Table 2. The values of p parameter for comparison of measurements between the right and the left side (t-student test for dependent samples, Wilcoxon test).
No DivisionFemaleMale
lateral0.59 10.75 10.67 1
medial0.81 10.74 10.57 2
rostral0.93 10.53 10.82 1
caudal0.60 10.85 20.54 1
area0.48 10.26 10.51 1
line-1 longitudinal0.57 10.66 10.68 1
line-2 transverse0.76 10.85 10.68 1
1 data not normally distributed (Shapiro–Wilk analysis p < 0.05)—result obtained using Wilcoxon test. 2 data normally distributed (Shapiro—Wilk analysis p > 0.05)—results obtained using t-student test for dependent samples
Table 3. The values of p parameter for comparison of measurements between the female and male group (t-student test for independent samples, Mann–Whitney U test).
No DivisionLeft SideRight Side
lateral0.25 10.39 10.44 1
medial0.80 10.99 20.74 1
rostral0.33 10.73 10.34 2
caudal0.18 10.29 20.41 2
area0.77 10.14 20.56 1
line-1 longitudinal0.38 10.48 10.57 1
line-2 transverse0.01 10.13 20.57 2
1 data not normally distributed (Shapiro–Wilk analysis p < 0.05)—result obtained using Mann–Whitney U test. 2 data normally distributed (Shapiro–Wilk analysis p > 0.05)—results obtained using t-student test for dependent samples.
Publisher’s Note: MDPI stays neutral with regard to jurisdictional claims in published maps and institutional affiliations.