Article

Vibration-Based Thermal Health Monitoring for Face Layer Debonding Detection in Aerospace Sandwich Structures

by
Thomas Bergmayr
1,2,*,
Christoph Kralovec
1 and
Martin Schagerl
1,2
1
Institute of Structural Lightweight Design, Johannes Kepler University Linz, 4040 Linz, Austria
2
Christian Doppler Laboratory for Structural Strength Control of Lightweight Constructions, Johannes Kepler University Linz, 4040 Linz, Austria
*
Author to whom correspondence should be addressed.
Appl. Sci. 2021, 11(1), 211; https://doi.org/10.3390/app11010211
Submission received: 28 November 2020 / Revised: 21 December 2020 / Accepted: 22 December 2020 / Published: 28 December 2020

Abstract

:
This paper investigates the potential of a novel vibration-based thermal health monitoring method for continuous and on-board damage detection in fiber reinforced polymer sandwich structures, as typically used in aerospace applications. This novel structural health monitoring method uses the same principles, which are used for vibration-based thermography in combination with the concept of the local defect resonance, as a well known non-destructive testing method (NDT). The use of heavy shakers for applying strong excitation and infrared cameras for observing thermal responses are key hindrances for the application of vibration-based thermography in real-life structures. However, the present study circumvents these limitations by using piezoelectric wafer active sensors as excitation source, which can be permanently bonded on mechanical structures. Additionally, infrared cameras are replaced by surface temperature sensors for observing the thermal responses due to vibrations and damage. This makes continuous and on-board thermal health monitoring possible. The new method is experimentally validated in laboratory experiments by a sandwich structure with face layer debonding as damage scenario. The debonding is realized by introduction of an insert during the manufacturing process of the specimen. The surface temperature sensor results successfully show the temperature increase in the area of the debonding caused by a sinusoidal excitation of the sandwich structure with the PWAS at the first resonance frequency of the damage. This is validated by conventional infrared thermography. These findings demonstrate the potential of the proposed novel thermal health monitoring method for detecting, localizing and estimating sizes of face layer debonding in sandwich structures.

1. Introduction

Fiber reinforced polymers (FRP) sandwich structures are increasingly utilized for a wide range of lightweight applications, due to their big beneficial in plate strength-to-weight and stiffness-to-weight ratios compared to metal and monolithic structures. Consequently, many applications can be found in the aerospace, the automotive and the wind energy industry. However, the major disadvantages of using FRP sandwich composites are the high initial cost due to the expensive manufacturing of molds and the complex failure mechanisms. The latter reduces the lightweight potential because of the high safety factors, since failure prediction is not reliable so far. In order to use the full lightweight potential of FRP material and to guarantee the integrity of composite structures at the same time new technologies, like structural health monitoring (SHM) are introduced. SHM is the continuous monitoring of mechanical structures during operation by using sensors to detect and identify damages [1]. As a consequence, damage tolerant structures can be exchanged or repaired before catastrophic failures. Furthermore, SHM might allow a condition-based maintenance of mechanical structures in the future, and thus, has the potential to reduce down times and maintenance costs dramatically. SHM methods utilize specific measurable physical effects of damages. They can be classified into static and dynamic methods, depending if static or dynamic physical effects are evaluated [1]. Well known dynamic methods are, for example, the electro-mechanical impedance [2,3] and the guided waves method [4,5]. Typical static methods are the electrical impedance tomography [6] or strain-based methods [7,8,9]. Thermal effects are also used for SHM, but there has not been much research considering these effects. Only a few publications present methods and strategies for the use of thermal effects under the term thermal health monitoring for SHM. A thermal health monitoring concept that uses fiber optical sensors (FOS) embedded in a composite structure as temperature sensor was published by Anna Stewart et al. [10,11]. It applies FOS sensors to measure changes in the thermal conductivity of a specimen due to a damage. The heating of the specimen was performed by a flash lamp chamber.
The main motivation of the presented work is to discuss a novel vibration-based thermal health monitoring method as a possible SHM method to detect and identify face layer debondings in aerospace sandwich structures. Therefore, the present study considers a simplified composite sandwich structure derived from an aircraft spoiler of a large civil aircraft, as shown in Figure 1. Face layer debonding is a critical internal damage mechanism of such sandwich structures [12,13]. This damage mechanism can be triggered by impact events like bird strike or tool drop. Also small manufacturing defects which grow during operational live time can lead to a critical face layer debonding. Therefore, the focus of the present paper is the continuous on-board monitoring of face layer debonding in sandwich structures.
Nowadays, reliable face-core bonding and quality control during manufacturing by a non-destructive testing method (NDT) are employed for avoiding face layer debonding. For composite delamination, the well known vibration-based thermography can be used [14,15]. This NDT method is the basis for the presented SHM method, it works on the same principle. Vibrations cause friction between separated face layers and the sandwich core, which results in heat generation and an increase in local temperatures [14]. This technique is often combined with the concept of local defect resonance (LDR) [16,17,18,19,20], which represents the most efficient way to excite the damaged area. This can be realized if the LDR frequency and the excitation frequency of the ultrasonic transducer match. Nonetheless, the commonly used shakers and the external IR-cameras limit this technique to a ground-based system.
This article presents a novel approach that overcomes the limitations of vibration-based thermography as a stationary ground-based system by replacing the shaker and the IR-camera with piezoelectric wafer active sensors (PWAS; as typically applied for various SHM methods) and an array of surface temperature sensors that are permanently bonded to the structure of interest and discusses its applicability as an SHM method. A challenge of the novel vibration-based thermal health monitoring method is the weak excitation by PWAS in contrast to heavy shakers. The lower excitation levels are compensated by the application of the LDR principle. To evaluate the potential of the novel thermal health monitoring approach for face layer debonding detection and identification, laboratory experiments with different excitation sources are performed. First, the general applicability of vibration-based thermography for detecting and identifying this type of damage is investigated experimentally by means of a piezoelectric stack actuator as excitation source and an array of surface temperature sensors and an IR-camera for temperature measurements. Notwithstanding, that this setup is a typical NDT setup, it is required to proof the basic measurement concept, as there is a lack of research so far in NDT and SHM literature for sandwich debonding. Furthermore, it allows the comparison of the results of the surface temperature sensor and the IR-camera measurements. Second, the applicability and potential of the novel vibration-based thermal health monitoring is demonstrated experimentally using the same damaged structure by means of a small and lightweight PWAS as excitation source and the validated surface temperature sensor array. To find the resonance frequencies of the considered face layer debonding and to investigate local vibration amplitudes and its consequent heating by the different excitation sources, vibration measurements with a scanning laser Doppler vibrometer (SLDV) are performed.

2. Methods

Since vibration-based thermography is a scientifically well-studied NDT technique that forms the basis of the presented SHM method, this section starts with the fundamentals of this technique. First, the basics of heat generation caused by excitation are described, followed by an explanation of the local defect resonance concept, and ends with an overview of the used thermography data processing algorithms. Subsequently, the idea of the novel thermal health monitoring method is presented.

2.1. Vibration-Based Thermography

The vibration-based thermography, also known as thermosonic testing or vibro-thermography uses, for example, an ultrasonic horn, an electrodynamic shaker or a vacuum attached piezoelectric shaker to excite a structure of interest by ultrasonic waves [19]. The subsequent vibration causes friction at boundaries of the damage (where crack faces are very close), and thus, converts mechanical energy into thermal energy. The subsequent local temperature increase can be evaluated for damage detection and identification. Recent investigations show high effectiveness for detection and identification of friction inducing damages like cracks and delaminations [14,21]. Nevertheless, it should be noticed that there exist also other heat generation sources such as the plasticity-induced heat generation, the thermoelastic effect and the viscoelastic effect [22].

2.2. Local Defect Resonance Concept

Recent investigations showed that the use of high power ultrasonic equipment is not necessary, if vibration-based thermography is combined with the concept of local defect resonance (LDR) [16,17,18,19,20]. The concept of LDR is based on the fact that a structural damage (e.g., the debonded face layer of a sandwich) leads to changed stiffness and damping properties for a certain mass of the material in this region, and consequently has its own resonance frequencies [17]. Is the host structure excited at resonance frequencies of the damage, energy is specifically transferred into the damage, which leads to a local temperature increase due to the before mentioned effects. Solodov et al. [16] first introduced an analytical formula to approximate the LDR frequency of a near-surface delamination with respect to a circular shaped damage geometry
f 0 = 1.6 H r 2 E 12 ρ ( 1 ν ) 2 ,
where H is the residual thickness, that is, thickness of the debonded plate, r is the radius, E is the Young’s modulus, ρ is the density and ν is the Poisson’s number. An equivalent solution for the resonance frequencies of square shaped delaminations with a side length s is introduced by Solodov [18], and given by
f 0 = 4 π H 3 s 2 E 6 ρ ( 1 ν ) 2 .
The problem in practical use of these analytical equations are the assumed boundary conditions, therefore finite element simulations (FEM) are generally used to visualize the LDR vibration patterns and to evaluate the LDR frequencies [3,16,17]. In industrial applications, the damage size and shape are unknown, thus their corresponding resonance frequency is generally unknown. Therefore, broadband excitation is usually employed for applying the concept of LDR without knowing the specific resonance frequency [19,20]. Recent investigations utilize periodic chirps or other commonly used broadband signals to excite a damage and identify its resonance frequencies by local temperature changes. In the present research a periodic chirp as broadband excitation together with a SLDV are used to identify the resonance frequencies of the considered sandwich face layer debonding.

2.3. Thermography Data Processing Algorithms

A typical vibration-based thermography procedure results in a sequence of IR-images reflecting the evolution of temperature in time: T ( x i , y j , t k ) , where x i , y i are the surface coordinates of the pixels and t k are the discrete time steps. Mathematically, such a sequence of IR-images can be regarded as a 3D matrix T i j k of temperature data, where i (row), j (column) are pixels of the 2D IR-image and k (frame) is the discrete measurement time. Data processing algorithms for IR-image data can be classified into 1D algorithms, being applied to pixel-based temperature evaluations in time T k , or 2D algorithms, being applied to single 2D IR-images T i j without considering the change over time [23]. Due to the lack of information resulting from the 2D single image algorithms, pixel-based methods that consider the evolution of temperature over time are commonly used. These 1D pixel-based T k methods reach from very simple ones like averaging algorithms [23,24] to more advanced ones like the principal component analysis (PCA) method [23,25,26,27]. The PCA method is commonly used to reduce data dimensions and extract main features and patterns from the IR thermography image sequences. This is done by using either selected principal components or PCA scores of the original images as features with improved properties, for example the ability to detect deep defects. Another commonly used thermography data processing algorithm to suppress slow uneven heating phenomena caused by environmental conditions and enhance the visibility of damages like delaminations that are located within the investigated structure is the discrete Fourier transformation (DFT) [23,28].

2.4. Thermal Health Monitoring

To overcome the limitations of vibration-based thermography as a stationary ground-based system the shaker and the IR-camera can be replaced by PWAS and temperature sensors. For the practical application of this novel method in large sandwich structures, several options to monitor the temperature of the structure are feasible. Temperature monitoring can be realized by an array of local surface temperature sensors, temperature sensitive thin films or fiber optical sensor (FOS) [10,11]. Nanocomposite thin films, such as carbon nanotube (CNT) thin films, which are very sensitive to temperature deviations, could be used. In addition, the combination of CNT thin films and the electrical impedance tomography (EIT) enables the thermal imaging of surfaces [29,30]. The presented method would be generally applicable to curved structures typically used in aerospace applications. The array of local surface temperature sensors used in this experimental investigation, or the alternative sensors mentioned previously, would also be applicable to curved surfaces. In contrast, the PWAS used for excitation in this investigation are not suitable for mounting on highly curved surfaces, instead piezoceramic patch transducers that are flexible and bendable could be used in practical aerospace applications.

3. Experimental Investigation

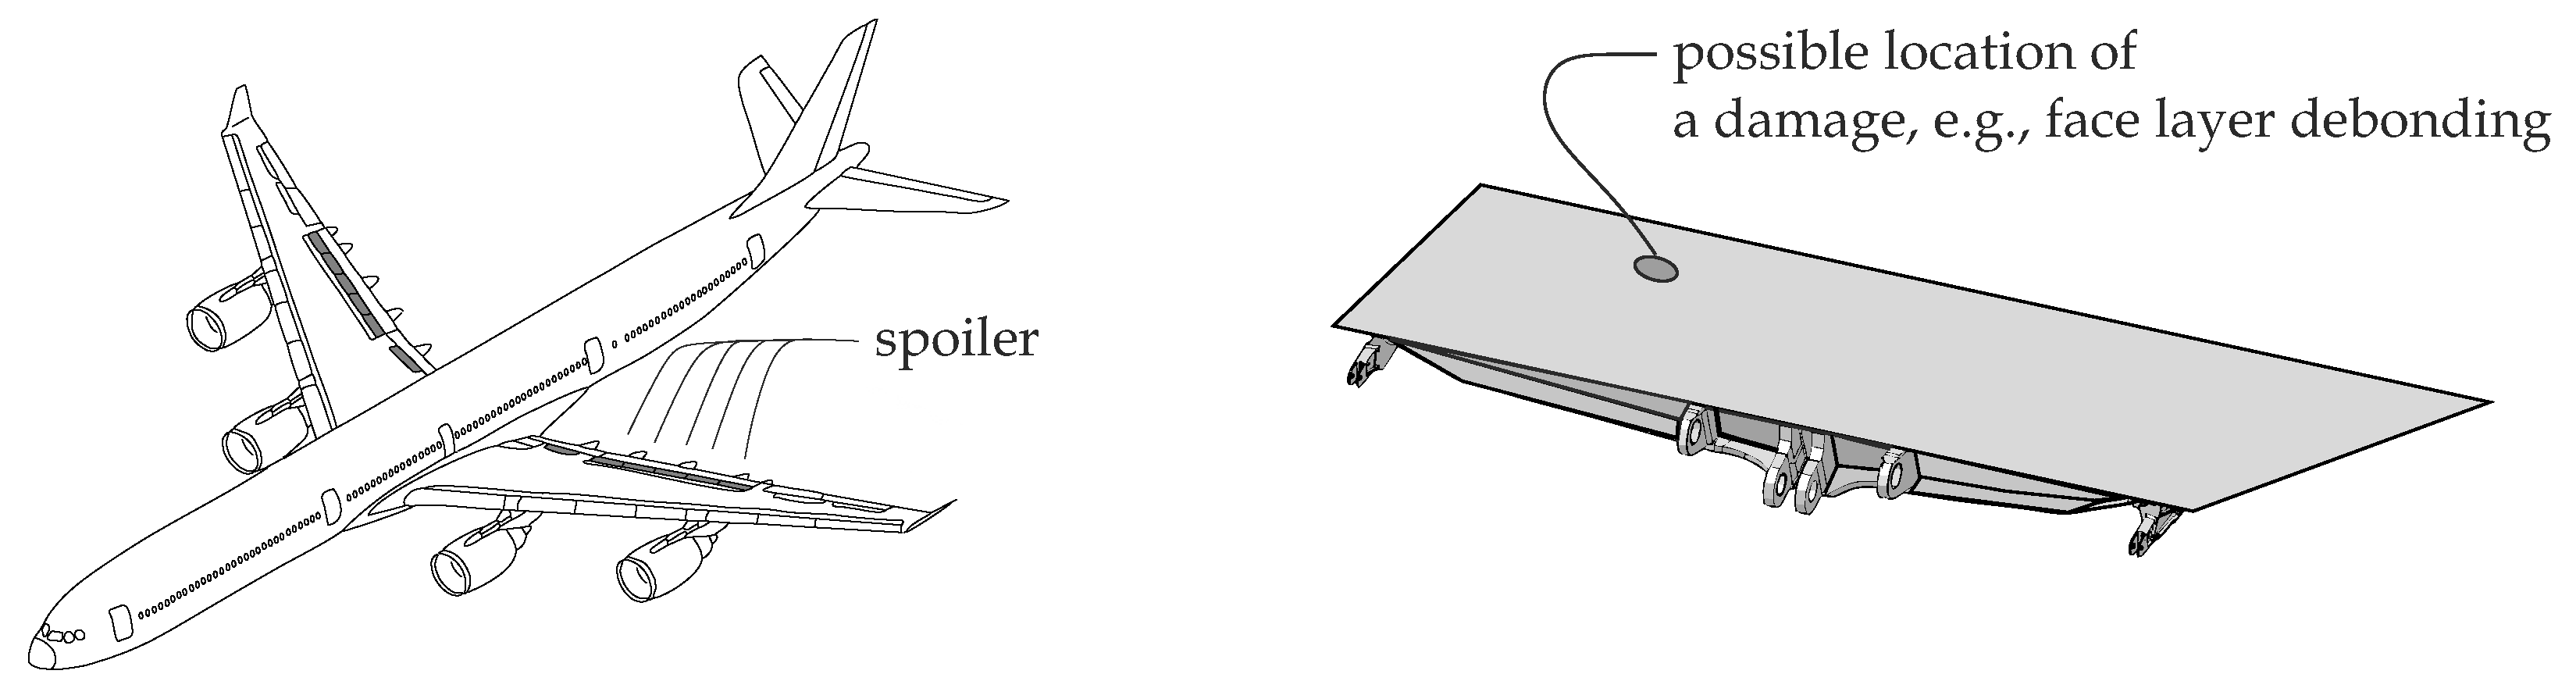
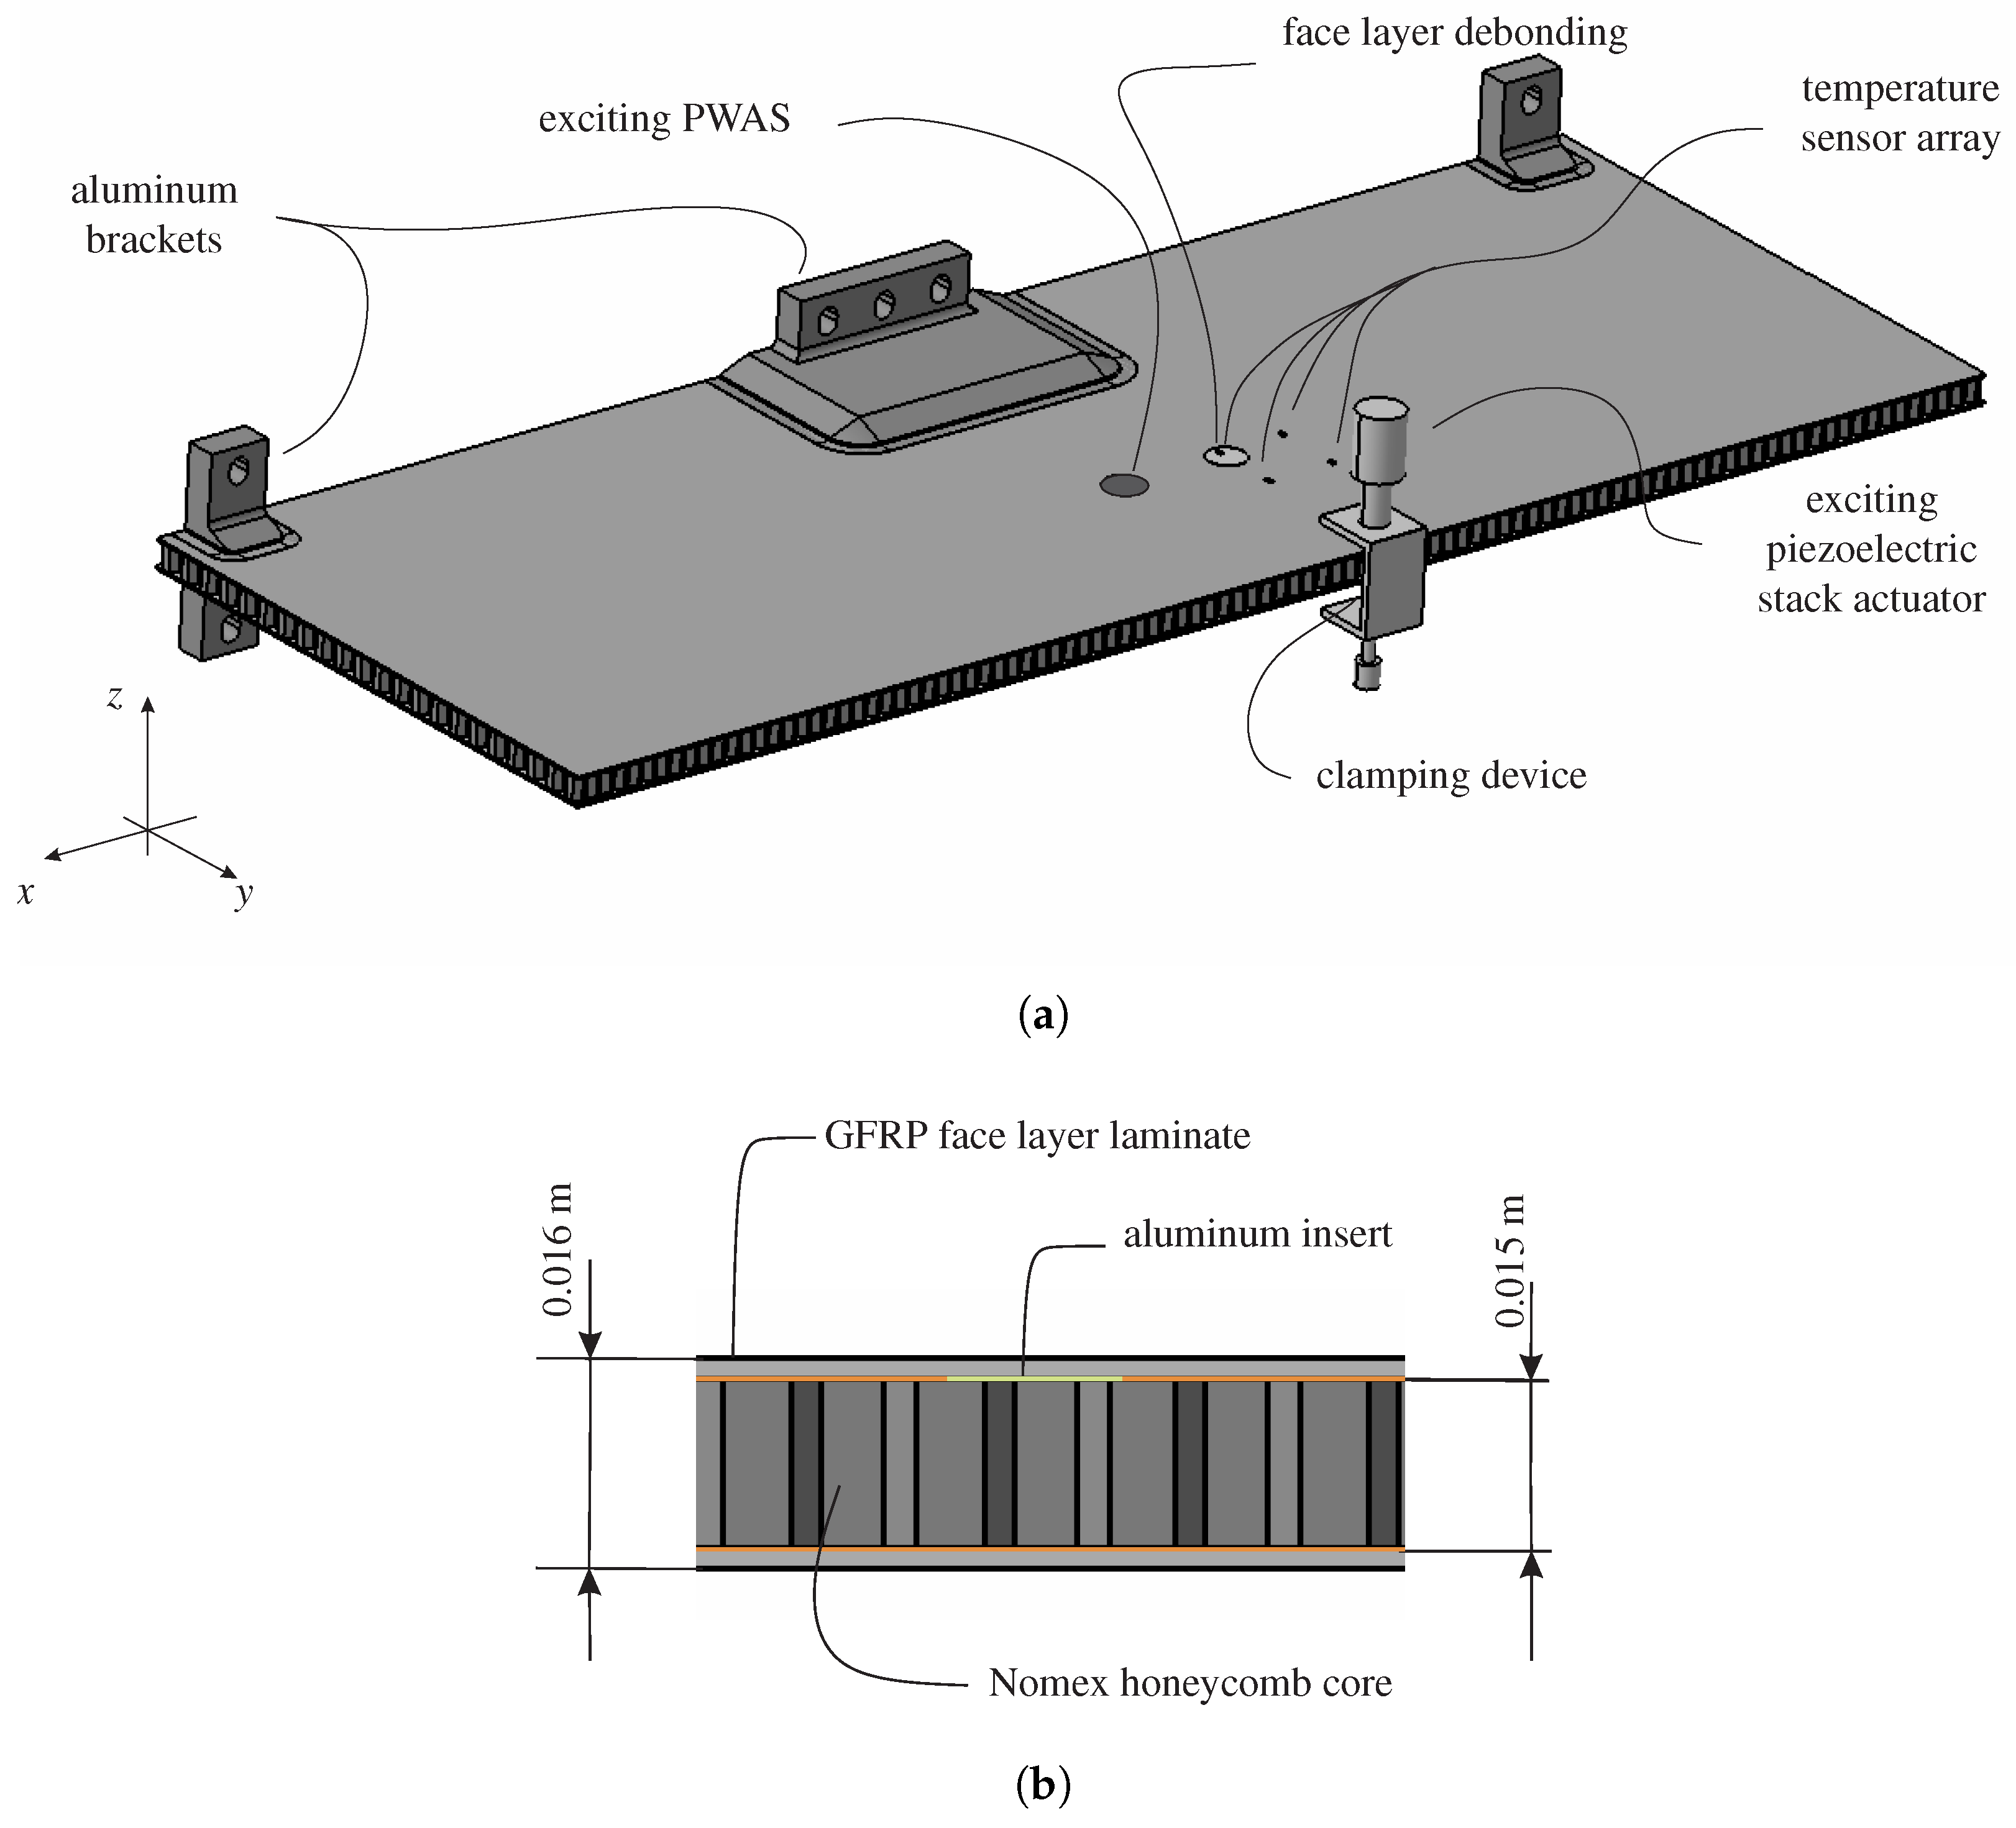
3.1. Investigated Structure

The composite sandwich structure with the dimension of 1 × 0.38 × 0.016 m 3 represents a simplified 2:1 model of a large civil aircraft. Figure 2 shows the sandwich structure composed of glass fiber reinforced plastic face layers, a Nomex® Aramid honeycomb core (Grade 5) and adhesively bonded aluminum brackets. The glass fiber reinforced polymer (GFRP) face layer laminate is built up of four prepreg fabric plies [0, 45, −45, 0], with a total thickness of 0.5 × 10 3 m. The Nomex honeycomb core has a total thickness of 0.015 m.
This paper focuses on the detection of face layer debondings in sandwich structures. The severity of such type of damage is typically non-critical for structural integrity if it is smaller than a specific critical size, that is, the structure is damage tolerant to a certain extent. Typical definitions of critical sizes for circular shaped damages have a diameter between one and two inches [31]. In the sandwich panel under study a face layer debonding with a diameter of 0.025 m (approximately one inch) was artificially introduced during the manufacturing process via an insert. Using an aluminum or Teflon insert to imitate a delamination or face layer debonding for thermography investigations is a well established technique [10,15]. For the present investigation a circular aluminum foil with a thickness of 0.01 mm was used as insert. Compared to Teflon foils, aluminum foils disturb the laminate layup less because they are thinner. Aluminum also has a higher thermal conductivity, which avoids heat accumulation. Furthermore, untreated aluminum foil gets bonded to the laminate when cured, and thus, a single and well defined surface of separation can be produced by applying release agent on only one side, the outer (negative z-direction, side oriented to the sandwich core) of the inserted foil. Figure 2b shows a section of the manufactured artificial debonding. Nonetheless, it has to be noted that the contact situation as well as thermal properties, of the artificially introduced debonding, deviate from a real delamination or debonding.

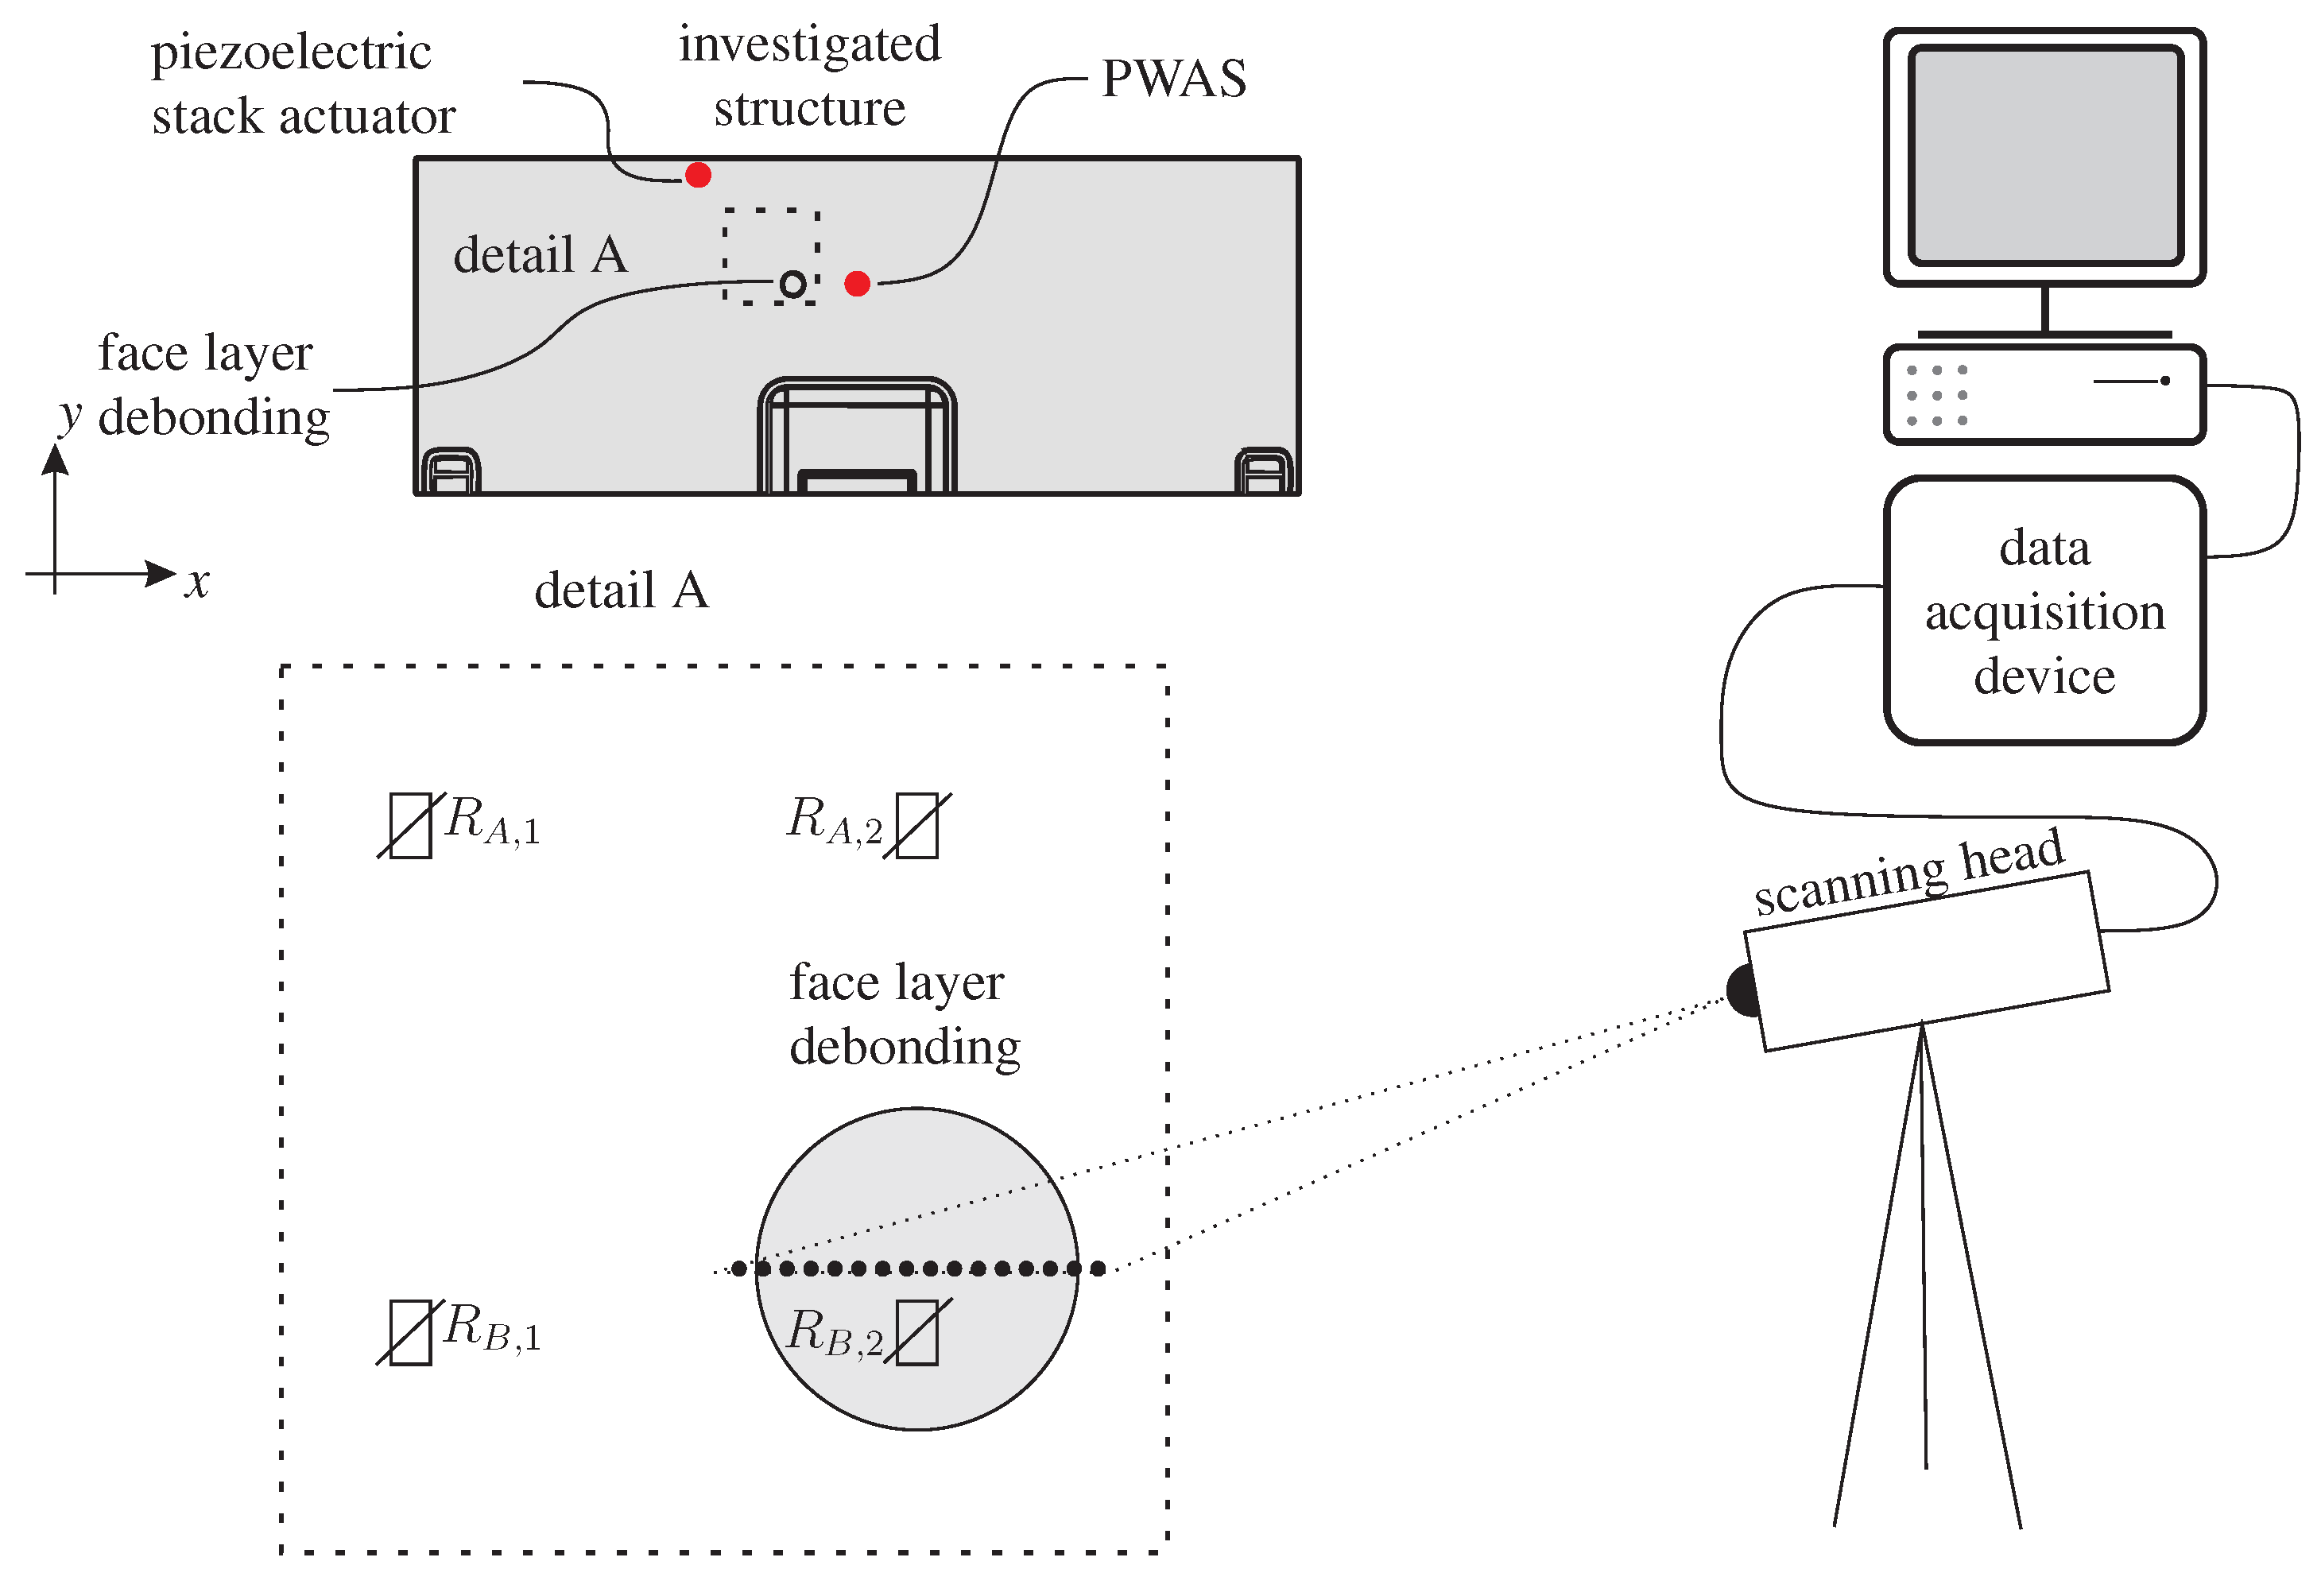
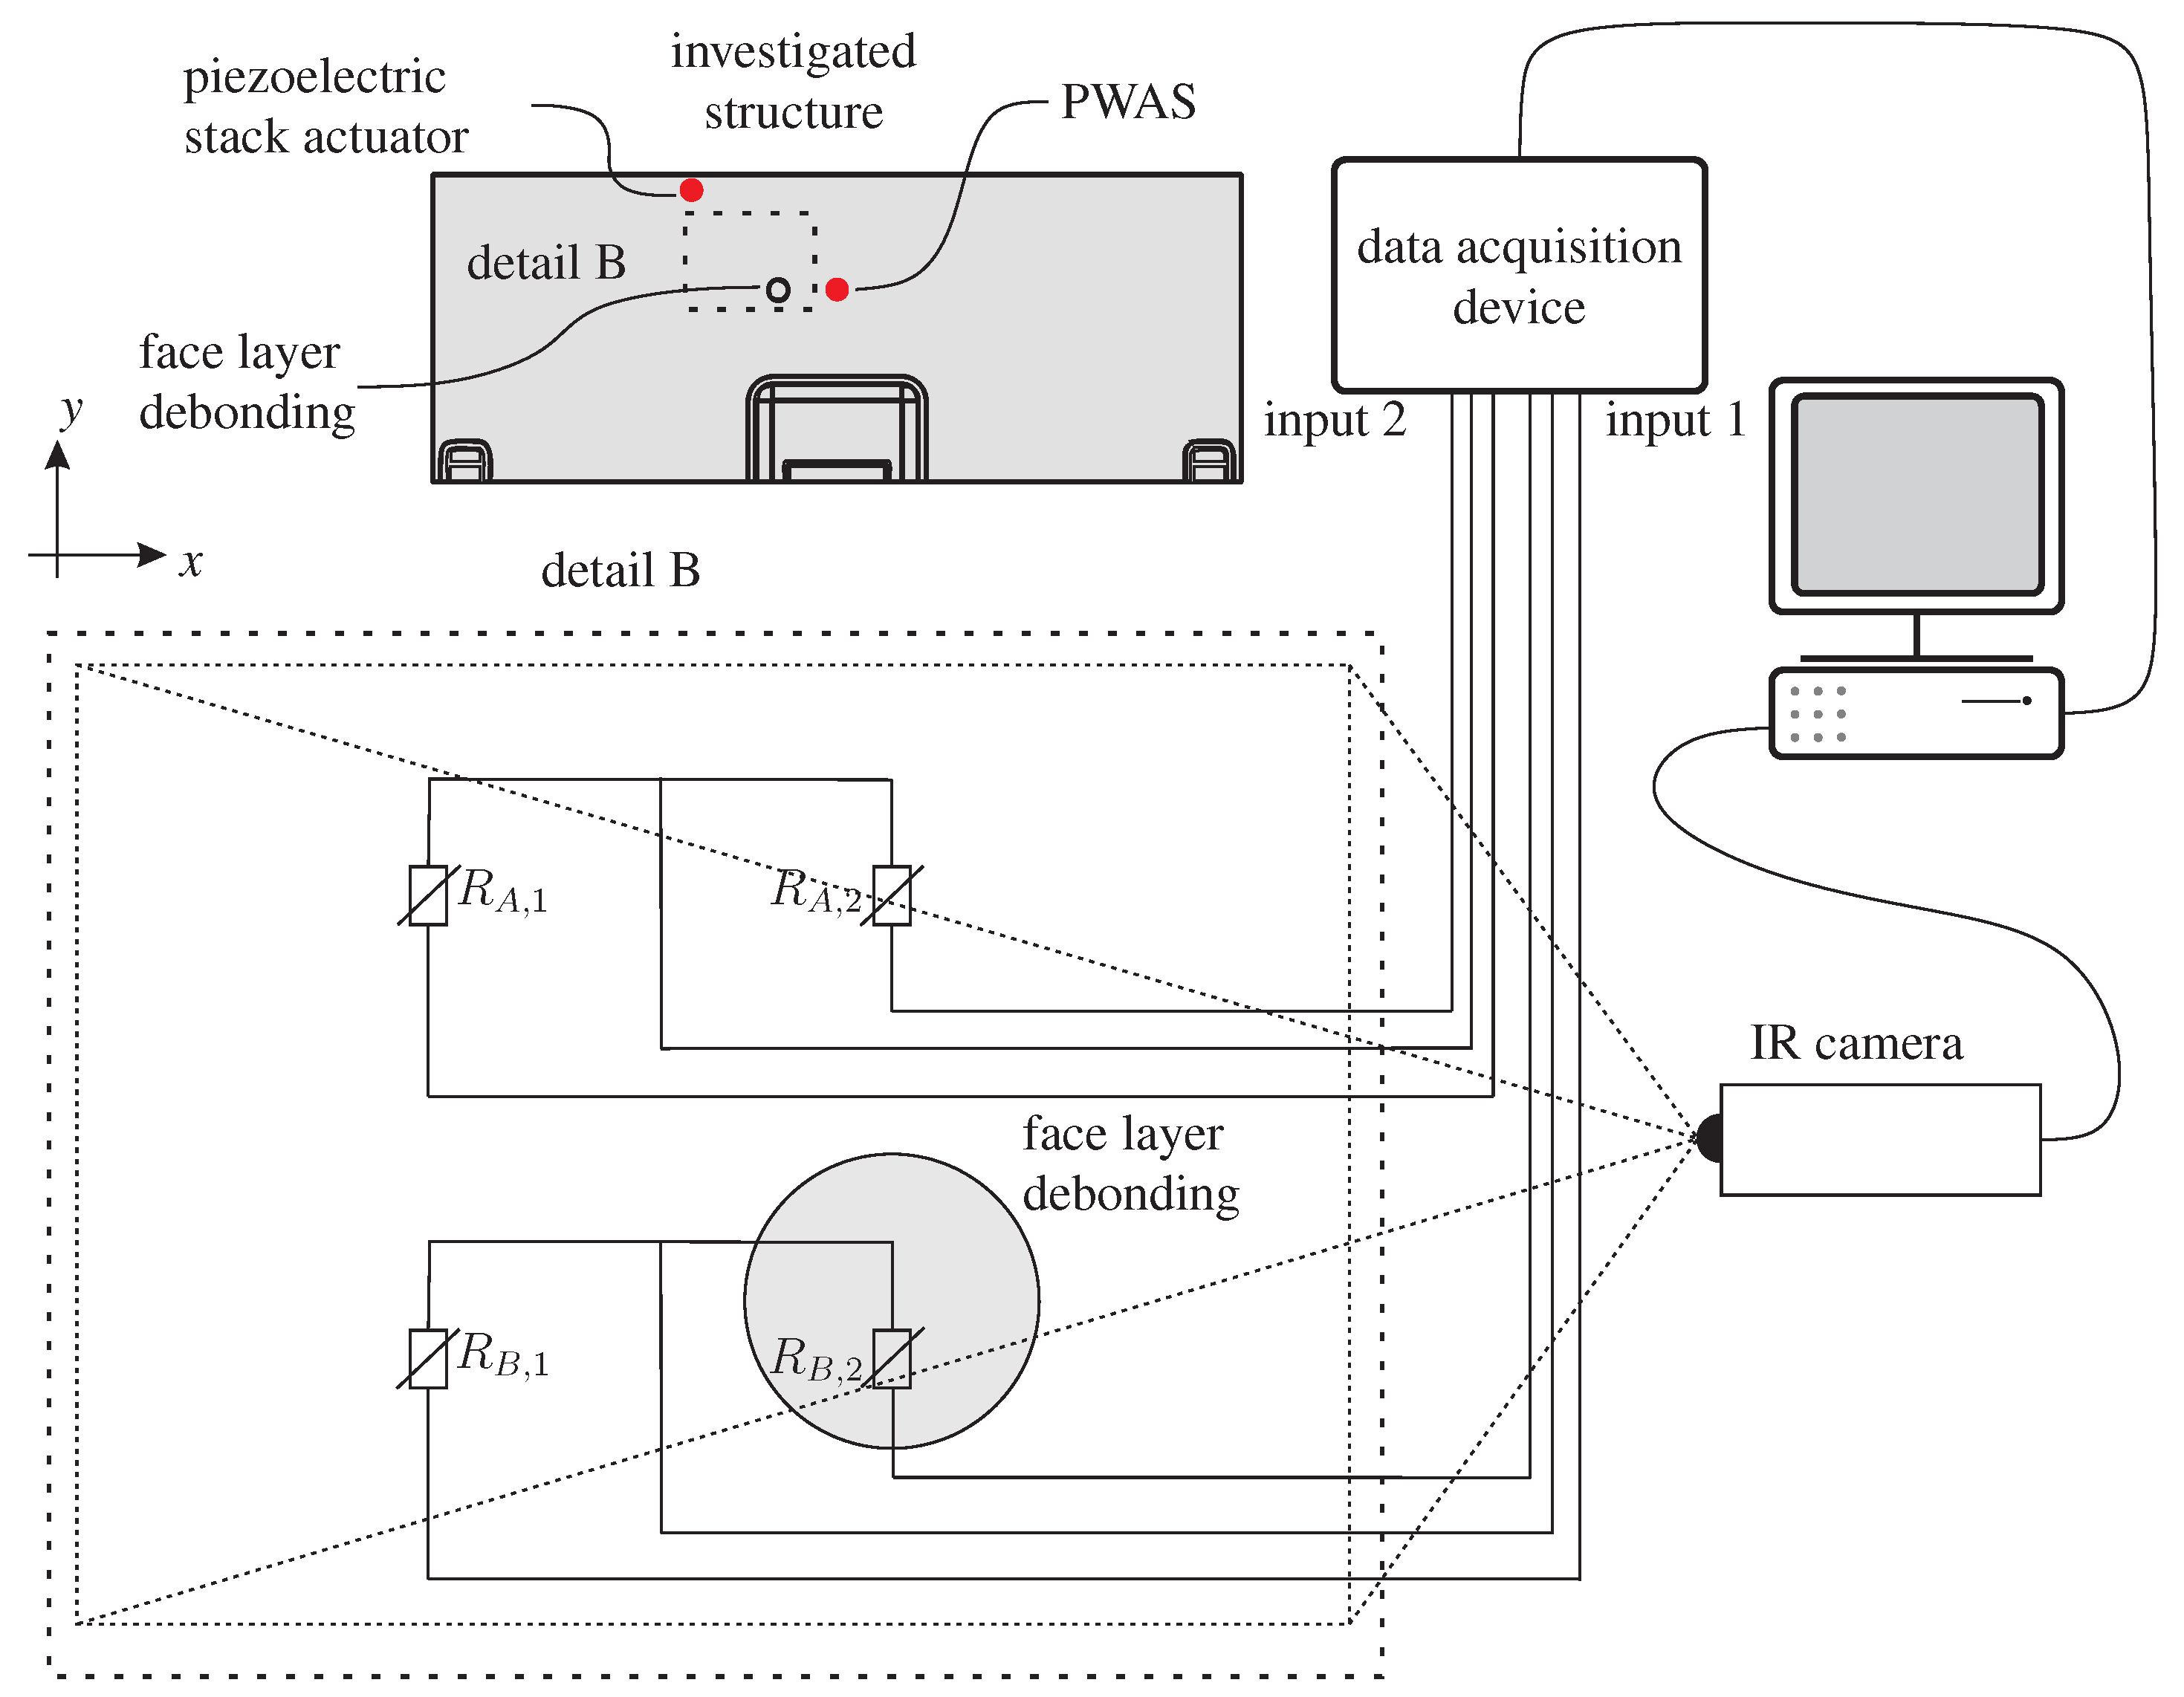
3.2. Experimental Set-Ups

For the present investigation, three different experimental set-ups are used separately from each other to prevent the measuring devices of the different set-ups from influencing each other. First, measurements with a SLDV are performed to visualize the vibration modes of the debonded face layer, identify its corresponding resonance frequencies and to compare the amplitudes caused by different excitation sources. Second, experiments for temperature-based damage identification are performed to examine the applicability of vibration-based thermography for face layer debonding detection and identification. The temperature monitoring is done via an IR-camera and surface temperature sensors. For excitation a piezoelectric stack actuator is used. Third, the applicability and potential of the novel vibration-based thermal health monitoring method is experimentally demonstrated by means of an array of surface temperature sensors and a PWAS (for excitation) permanently bonded to the considered structure.
The first experimental set-up is depicted in Figure 3. It consists of the different excitation sources (piezoelectric stack actuator type Piezosystem jena PSt 1000/25/40 and adhesively bonded PWAS transducer type PI ceramic PIC255), the SLDV (Polytech PSV-500-HV) and the structure under investigation. The circular shaped PWAS transducer has a diameter of 25mm and a thickness of 1mm. The signal-to-noise level of the measurements is increased by amplifying the voltage excitation signal of the function generator (Tektronix AFG3022C) with the help of a linear power amplifier(AE Techron 7224). To identify the LDR frequency of the debonded face layer, (i.e., the damage) experimentally, the out-of-plane velocity at 16 SLDV scan points located horizontally (x-direction) along a line across the damage (with 2 mm spacing, which sufficiently resolves the considered 1st axisymmetric flexural mode shape) is analyzed. The SLDV uses a sampling rate of 250 kHz. The time signals are averaged 26 times for each scan point to increase the signal quality.
The experimental set-ups for the demonstration of the applicability of the vibration-based thermography for face layer debonding detection and identification and the investigation of its SHM potential are shown in Figure 4. In the first step, the sandwich structure is excited by the piezoelectric stack actuator (setup demonstration LDR for face layer debonding). The position of the piezoelectric stack actuator is selected to provide the most efficient excitation of the damage. For this purpose, measurements were made with the SLDV with varying piezo stack actuator positions and the amplitudes were compared. The position with the highest amplitude response at constant excitation voltage was selected. To demonstrate the SHM potential of the presented method, the glued PWAS transducer is used for excitation (setup demonstration of SHM potential; piezoelectric stack actuator was removed). The bonded PWAS transducer was positioned along the centerline of the structure to maintain symmetry for possible future experiments. Further care was taken to ensure that there was enough distance between the damage and the PWAS so that the temperature rise of the exciting PWAS would not affect the temperature sensor results. The temperature monitoring was performed by an array of four surface temperature sensors (CeLaGo TS-LM03) and an IR-camera (Micro-Epsilon TIM Connect T450), which monitors a surface area of approximately 109 mm by 83 mm in x-direction and y-direction, respectively. The four surface temperature sensors are arranged in a rectangular pattern with a side length of 45 mm on the sandwich face layer. One of the sensors is directly located on top of the debonded area of the face layer, see Figure 2, Figure 3 and Figure 4. The evaluation of the surface temperature sensors is done by two Wheatstone half bridges, shown in Figure 4. The first half bridge, which consists of the two temperature sensors R A , 1 and R A , 2 is located at the undamaged structure, whereas temperature sensor R B , 2 of the second half bridge, which consists of R B , 1 and R B , 2 , is directly located at the damage. The measurement signal acquisition of the two Wheatstone bridges is done by a HBM Quantum X MX840A. Applying these half bridge circuits enables to measure only the temperature difference between the connected temperature sensors, and thus allows compensating global temperature fluctuations of the structure. Global temperature changes of the structure can result from changes of the surrounding temperature, thermal radiation, warming of the structure due to loading, and so forth.

4. Results and Discussion

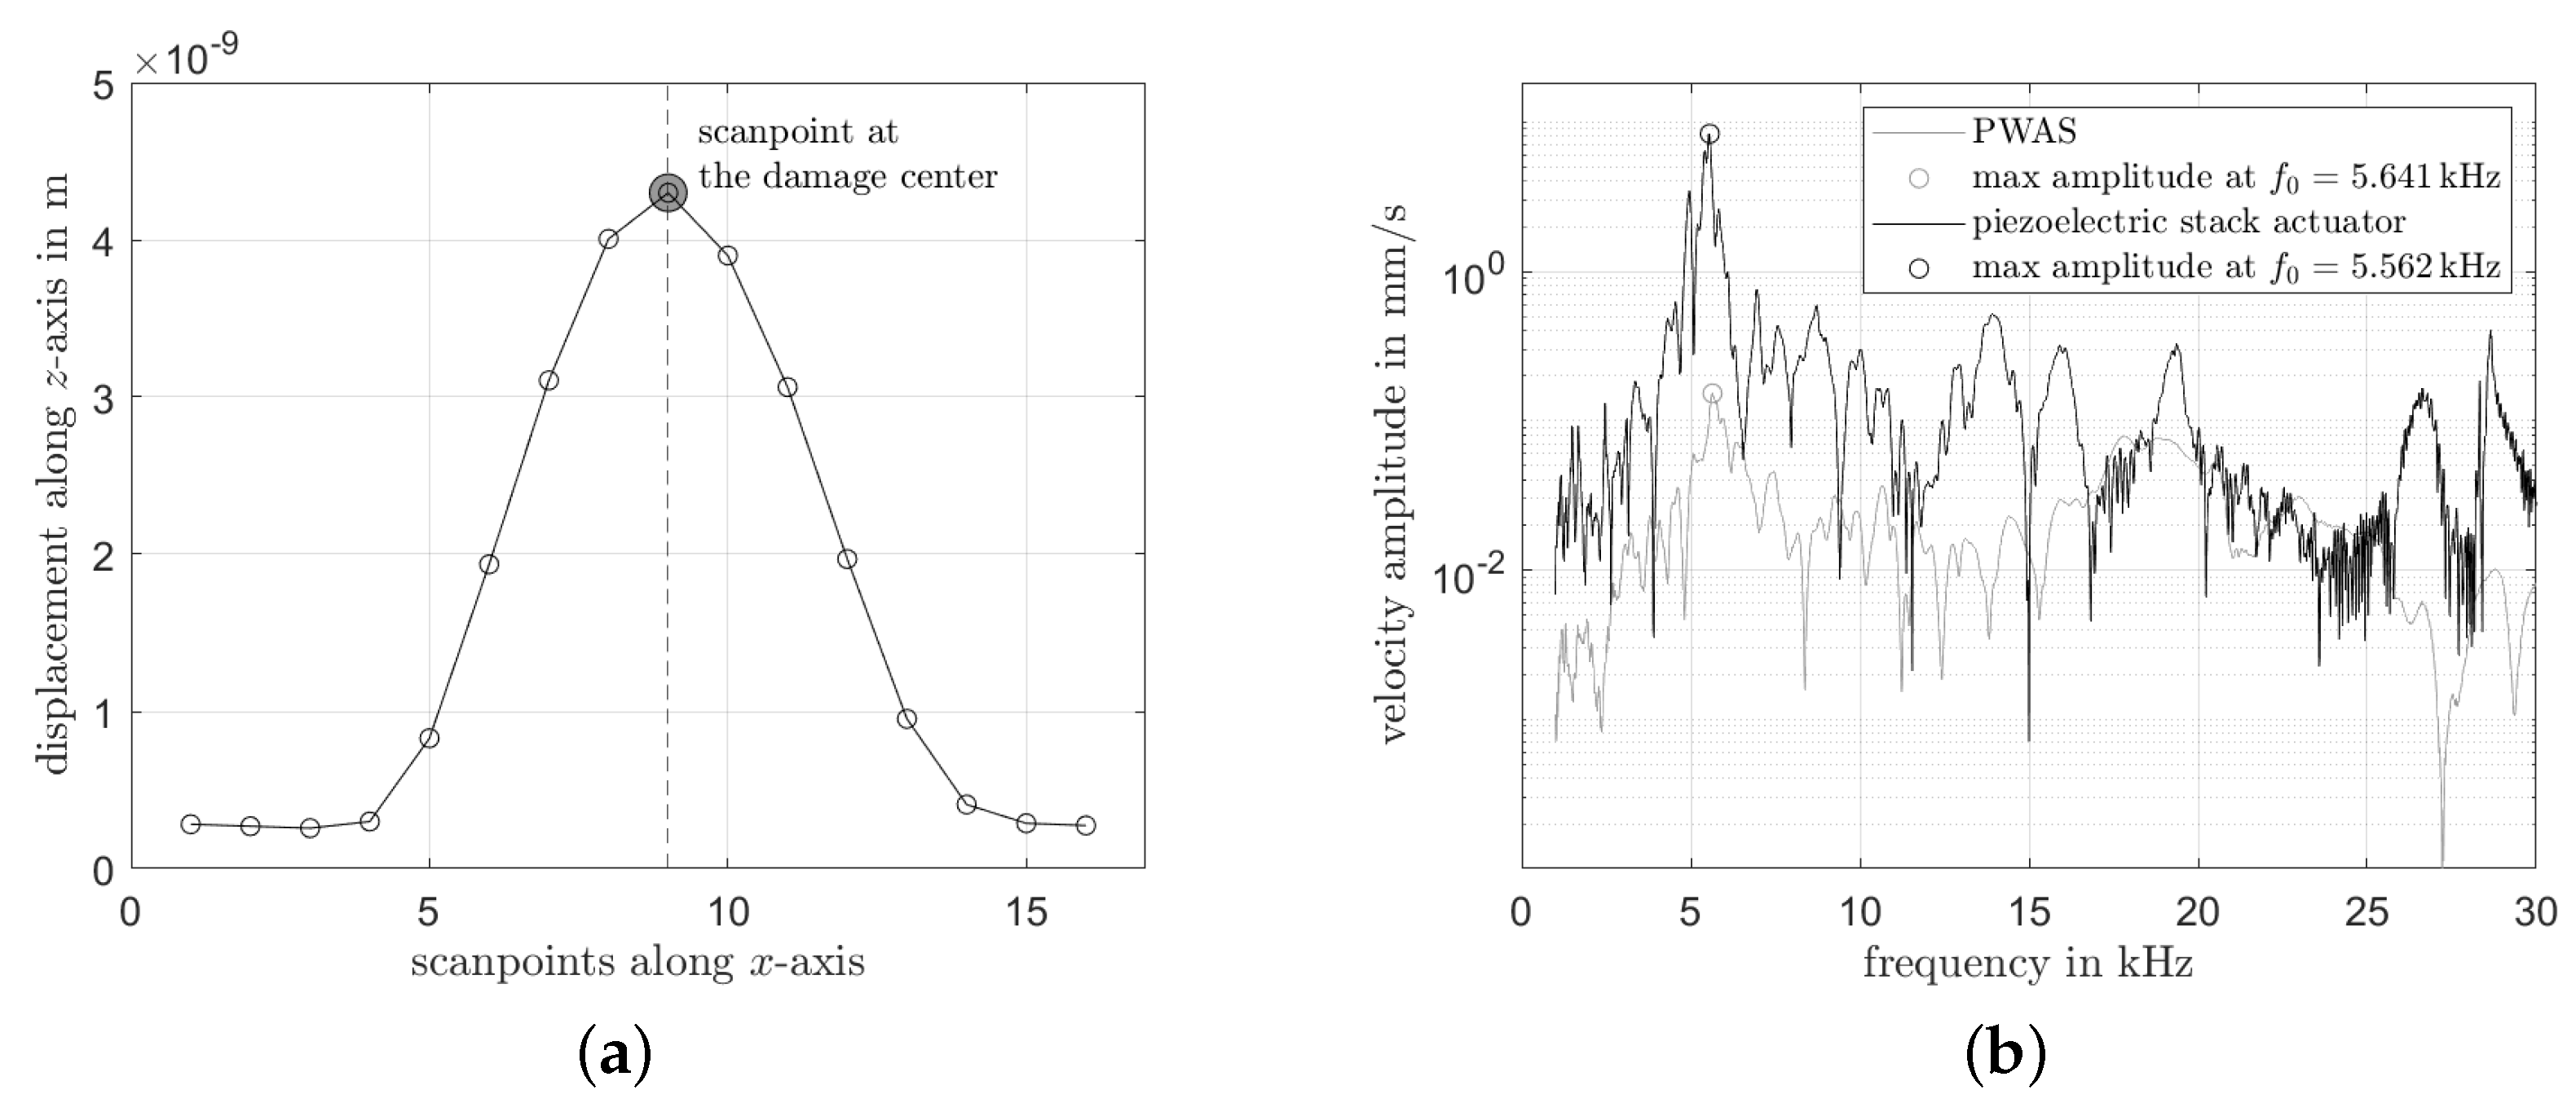
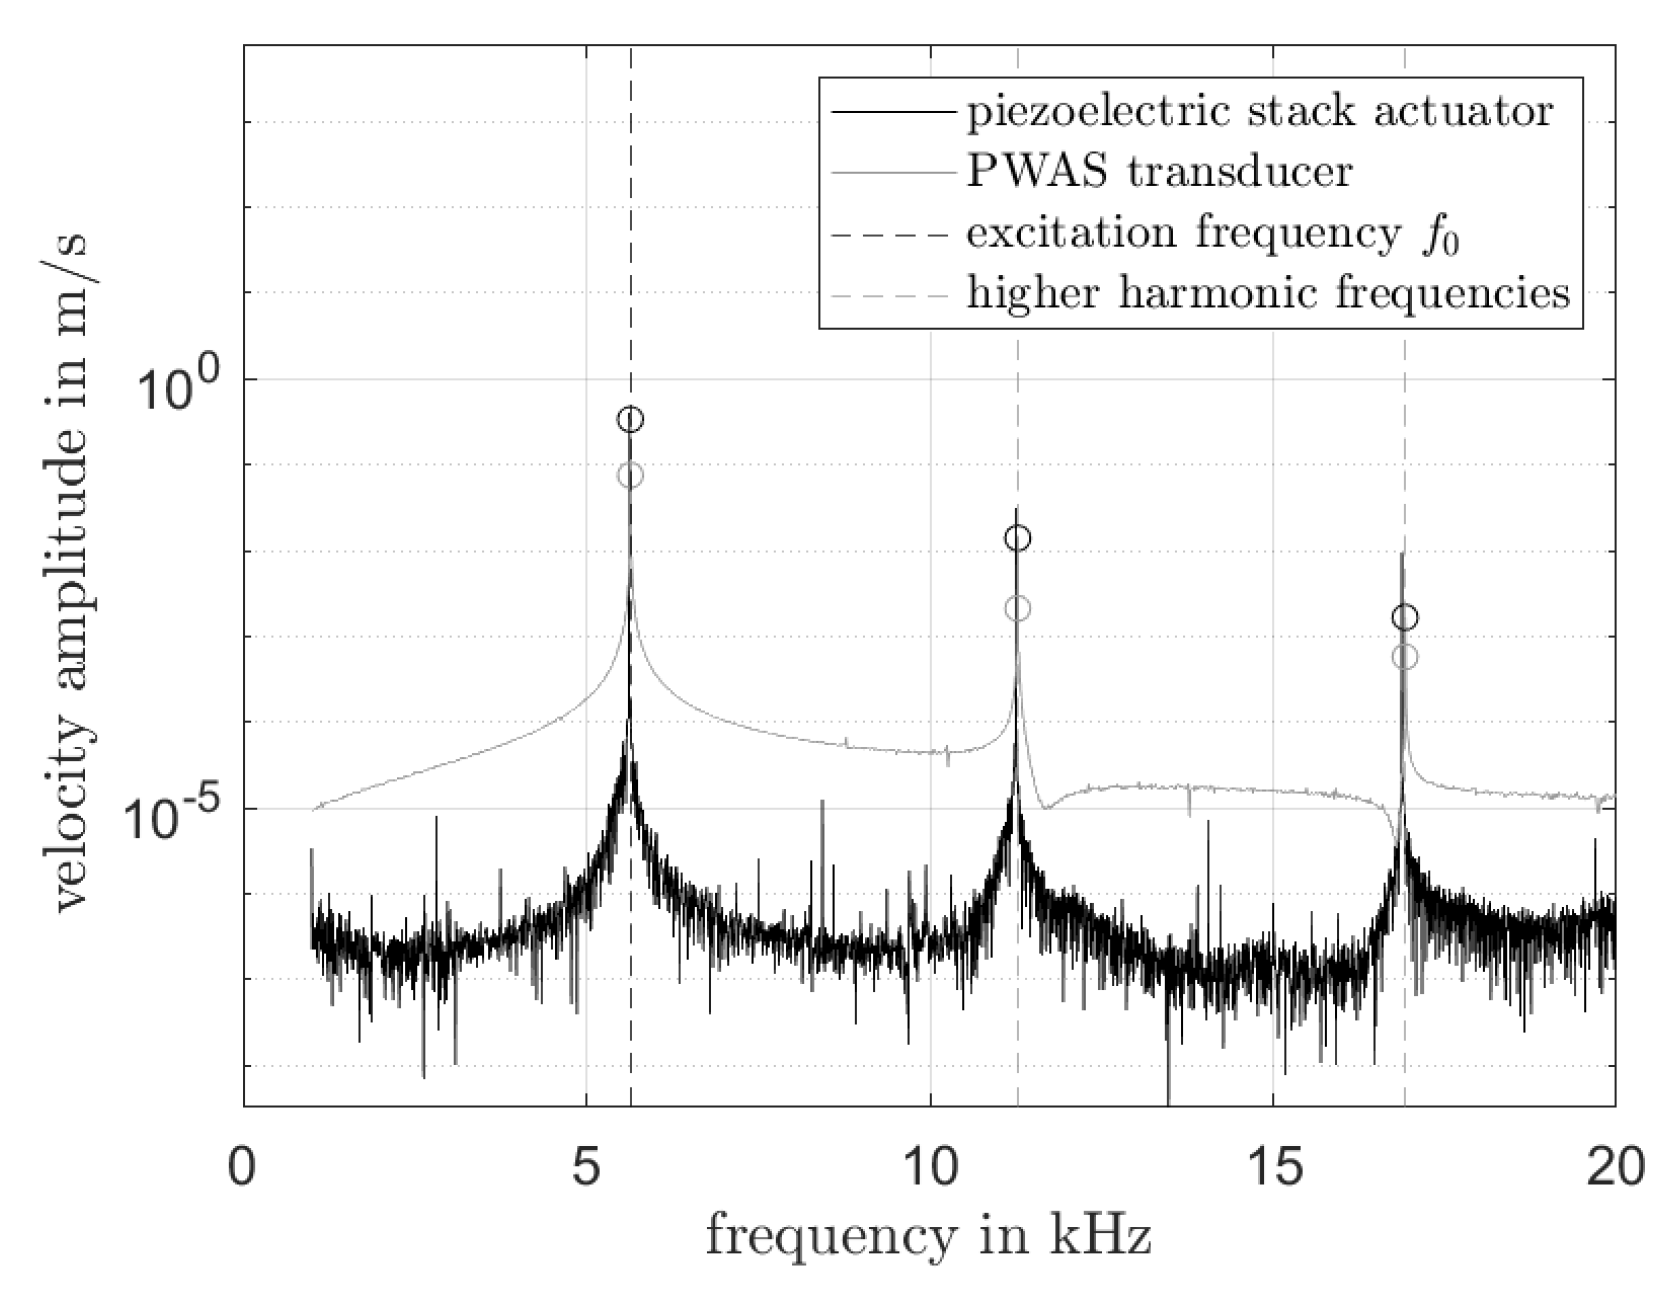
4.1. Local Damage Vibration Results

Figure 5b shows the dynamic responses in the frequency range of interest measured at the debonding center (cf. Figure 5a) by means of the SLDV (experimental setup depicted in Figure 3) for both, piezoelectric stack actuator and PWAS excitation, excited with a periodic chirp signal from 1 to 100 kHz. The first resonance frequencies f 0 of the debonded area can be identified for both excitations as highest amplitudes in the corresponding spectra shown in Figure 5b. The peaks occur at 5.641 kHz and 5.562 kHz for PWAS and piezoelectric stack actuator excitation, respectively. Although the frequencies differ slightly, the modal shapes of the first eigenmode, as shown in Figure 5a, are found to be almost identical. The difference in the first resonant frequency can be explained by the increasing contact non-linearity for the piezoelectric stack actuator compared to the PWAS excitation [18,32]. Nevertheless, this effect was neglected in this study, and the same resonance frequency was selected for both excitations. Figure 5a shows the first bending mode of the considered face layer debonding excited with the PWAS.
Additional resonance frequencies of the debonded area are identified for PWAS excitation at f 1 = 11.438 kHz and f 2 = 17.828 kHz for the second and third bending eigenmodes, respectively. Nonetheless, for the present investigation only the first eigenmode is considered. To analyze the differences in the dynamic response between the excitation with the piezoelectric stack actuator and the PWAS transducer, which have a significant effect on the heating of the excited damage, the measurement results are analyzed in the center of debonding (cf. Figure 5a). The excitation is a sinusoidal voltage signal with the frequency of the first debonding resonance f 0 , resulting from the experiments with the PWAS used as excitation source. The voltage signal amplitude is selected as 40 V for the piezoelectric stack actuator and 150 V for the PWAS transducer. Figure 6 shows the resulting frequency spectra of the dynamic velocity response measured by the SLDV. The maximum velocity response amplitudes of the damage caused by the excitation with the piezoelectric stack actuator is 338.42 mm / s. The response amplitude resulting by the excitation with the PWAS is 75.64 mm / s, which is approximately 4.5 times smaller than the response to the piezoelectric stack actuator. A summary of the maximum dynamic out-of-plane velocity response for the considered excitation sources is presented in Table 1. Although the excitation voltage is smaller, the piezoelectric stack actuator introduces much more power (current is much higher) to the sandwich structure, and thus, the resulting velocity responses amplitude of the debonded area is much higher compared to the excitation with the PWAS transducer. As expected, both frequency spectra show the highest response at the first harmonic. Furthermore, strong higher harmonic response to the sinusoidal excitation can be observed. This is an expected result due to excitation signal distortion of the amplifier and contact acoustic non-linearity between debonded face layer and sandwich core. For the temperature-based damage detection experiments with the IR-camera and the surface temperature sensors, the excitation signal parameters according to Table 1 are used.

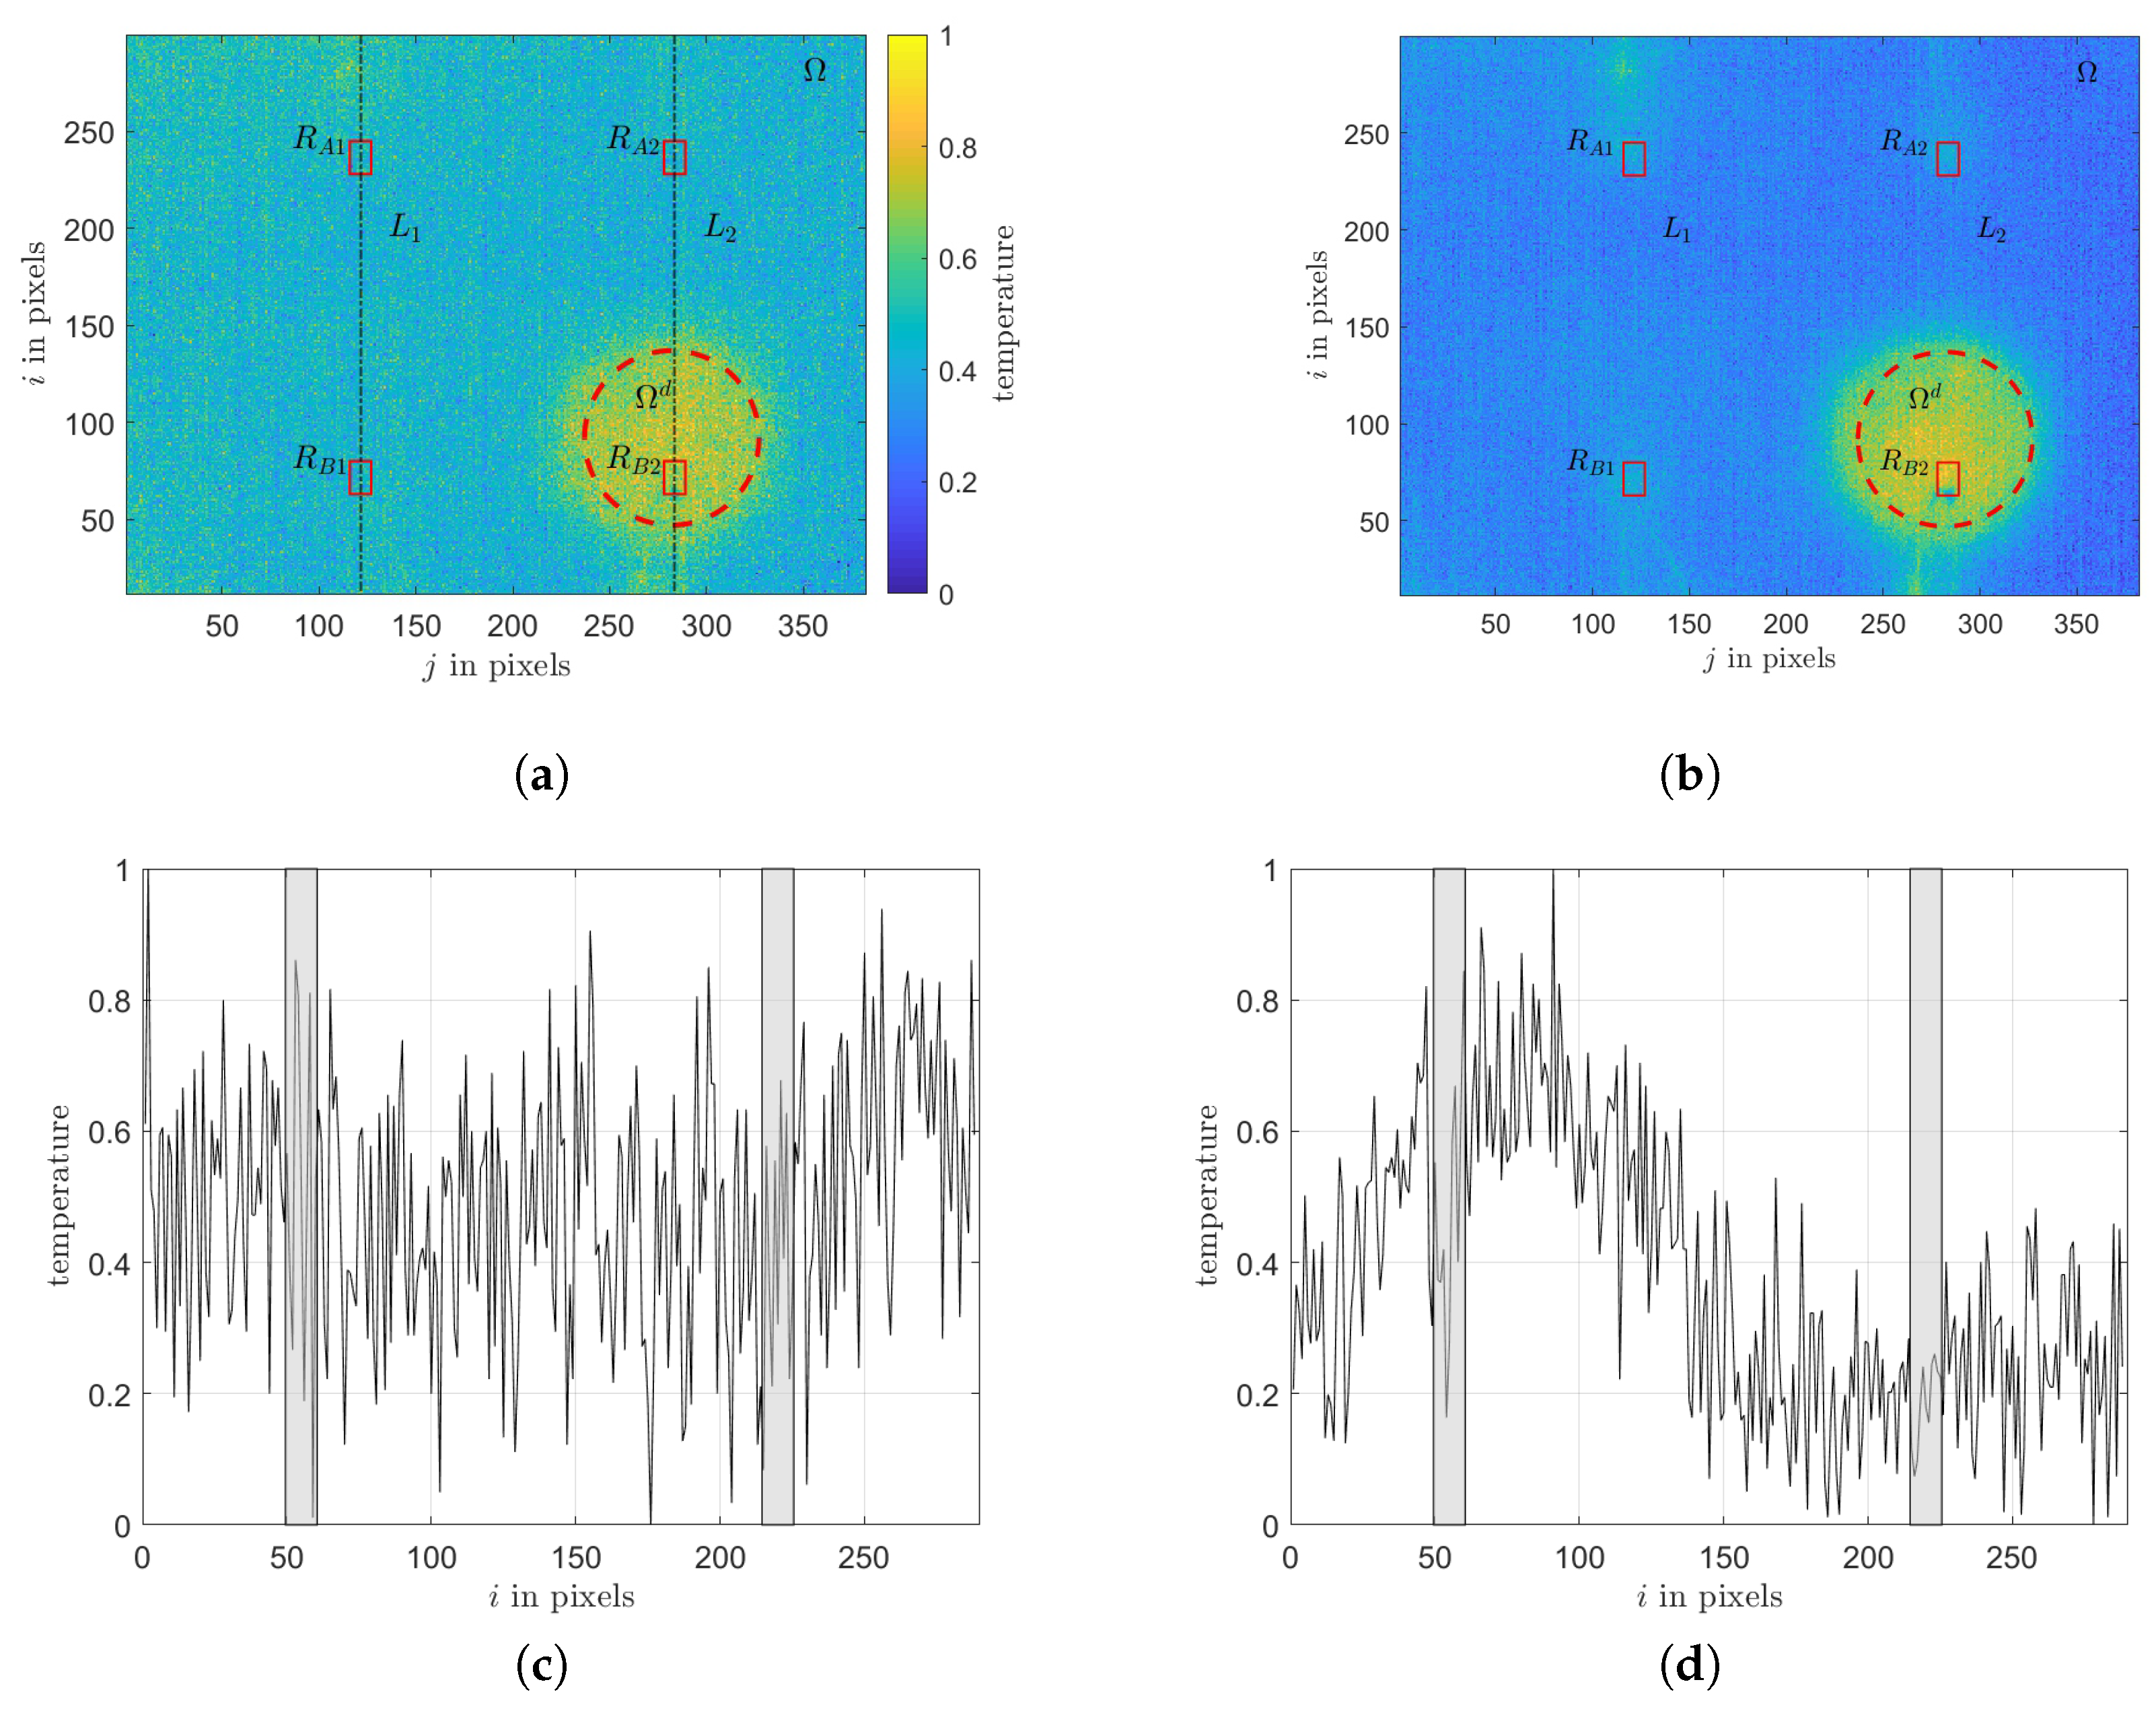
4.2. Temperature-Based Damage Identification

The results of the temperature-based sandwich debonding detection and identification are subdivided into two sections. First, the measurement results of the experiment with the excitation with the piezoelectric stack actuator are analyzed with typical NDT data processing algorithms, to demonstrate the applicability of the LDR concept for sandwich debonding identification. Additionally, the measurements of the surface temperature sensors are analyzed and verified. Second, the surface temperature sensor measurements of the PWAS excitation are analyzed to demonstrate the local heating of the damage due to resonance. This shows the potential of the presented thermal monitoring method for a possible SHM set-up.

4.2.1. Demonstration of LDR Concept for Face Layer Debonding Detection

The demonstration of the LDR concept (excitation at a resonance frequency of a defect or damage causes local heat generation) is realized by a piezoelectric stack actuator combined with an amplifier for excitation and an IR-camera for spatial temperature measurement (cf. Figure 4). The infrared temperature measurement is analyzed by typical thermography data processing algorithms. The excitation frequency was selected as 5.641 kHz in order to match the first resonance frequency f 0 of the debonded face layer (cf. Section 4.1). The excitation is applied sequentially, where one minute with excitation follows one minute without excitation and so on. This procedure is repeated three times during a measurement to verify the repeatability of the results. The resolution N i × N j of the IR-camera was N i = 288 and N j = 382 pixels, and the sample frequency f s was specified as 0.5 Hz. This leads to an array T i j k , where i = 1 , . . . , N i and j = 1 , . . . , N j are the image pixels discretizing the surface coordinates and k = 1 , . . . , N k is the time step according to k = t k / Δ t = t k / ( 1 / f s ) . The array has thus the dimension N i × N j × N k = 288 × 382 × 180 , c.f. Section 2.3 and can be defined as
T i j k = T ( x i , y i , t k ) .
The measured IR-images and temperature sensor signal are post-processed by Matlab R2019a®. As described in Section 2.3 there are several common analyzing algorithms for thermography data. For the present investigation different algorithms are used for analysis. First, the spatial temperature difference Δ T ¯ i j is calculated by subtracting IR-images from before ( t ex , on is the time when excitation starts, k ex , on = t ex , on / ( 1 / f s ) ) and at the end ( t ex , off is the time when excitation ends, k ex , off = t ex , off / ( 1 / f s ) ) of the first excitation period. To reduce measurement noise, five consecutive images N a = 5 are averaged [23,24,33]. Let us define
T ¯ i j ex , off = 1 N a k = k ex , on N a k ex , on T i j k
as the averaged temperature data of five consecutive images before the first excitation period starts and
T ¯ i j ex , on = 1 N a k = k ex , off N a k ex , off T i j k
as the temperature data of the five consecutive images at the end of the first excitation period. Consequently, the spatial temperature difference Δ T ¯ i j can be defined as
Δ T ¯ i j = T ¯ i j ex , off T ¯ i j ex , on .
Figure 7a depicts the normalized temperature difference results Δ T ¯ i j . This simple post-processing algorithm enables already to make the artificially introduced face layer debonding visible. Figure 7c and d shows the normalized temperature profile according to the pixel-lines L 1 and L 2 marked in Figure 7a. For a better differentiation of regions in IR-images that show a deviating thermal behavior to the surrounding structure (typical for defects and damages) the more complex PCA method proposed by Bin Gao et al. [25] (cf. Section 2.3) is used as second data analysis algorithm. The results of this algorithm depicted in Figure 7b demonstrate the ability of the PCA technique to extract abnormal patterns in IR-images and enhance the contrast of a damage. Summarized can be noted that the results of both data processing algorithms show clearly the temperature increase caused by the excitation with the local resonance frequency of the debonded face layer, and thus, demonstrate the applicability of the combined concept of LDR and thermography for sandwich debonding detection, localization and quantification.
To validate these promising results the local surface temperature difference changes are also evaluated by means of the four applied surface temperature sensors. Figure 8a shows the temperature difference Δ T A = T A , 2 T A , 1 in the undamaged region and Δ T B = T B , 2 T B , 1 for the debonded area measured by means of the Wheatstone half-bridges over time (cf. Figure 4). Both, Δ T A and Δ T B reflect the phases with and without excitation. The signals of Δ T B are significantly higher than those of Δ T A , which clearly indicates the heating due to the debonded face layer excited at its first resonance frequency. The reflection of the excitation in the temperature difference measurement at the undamaged region is expected to be caused by a slight increase of the temperature over the whole considered sandwich structure due to the excitation. Consequently, the temperature at the sensor R A , 1 is higher as it is closer to the excitation source. The minimal higher temperature increase of the sensor R A , 1 is not visible at the temperature difference profile of the pixel-line L 1 , depicted in Figure 7c, because of the low temperature difference and the low signal-to-noise level. Due to high noise, this measurement cannot be directly validated by the thermography results. To overcome this issue and to enable the comparison of the temperature difference measurement results of the surface temperature sensors with the results of the IR-camera, spatially averaged values over the debonded area and the remaining bonded area with respect to the time are used. The set of pixels of the debonded area, cf. dashed circle in Figure 7a,b, is defined as Ω d , and N d is defined as the total number of pixels in this area. The set of pixels of the bonded area is defined as Ω Ω d and N p = N i × N j N d is defined as the total number of pixels in the bonded area. To illustrate this approach, let us call
T ¯ k d = 1 N d ( i , j ) Ω d T i j k
is the averaged temperature data of pixels which are located inside the debonded area Ω d , and
T ¯ k p = 1 N p ( i , j ) ( Ω Ω d ) T i j k
the temperature data array of pixels which are located outside the debonded area. Consequently, the difference of the averaged temperature profile Δ T ¯ k , depicted in Figure 8, of the debonded and bonded area with respect to the time is defined as
Δ T ¯ k = T ¯ k d T ¯ k p .
Due to the fact that the increased temperature is not uniformly distributed over the whole debonded area (cf. Figure 7a,b,d), a comparison of the absolute temperature values is not meaningful. Moreover, the IR results show a very high noise level. Nonetheless, it should be noted that the absolute temperature increase of the IR-camera results Δ T ¯ k is of a similar order of magnitude compared to the temperature increase of approximately 1 K displayed by the temperature difference measurements using the surface sensors. The normalized temperature difference results for both surface sensors and spatially averaged IR-images correlate very well, as shown in Figure 8a. Both temperature profiles measured at the debonded face layer clearly shows heating and cooling phases, depending on whether the structure, particularly the damage, is being excited or not. Due to the fact that most of the noise and structural temperature drifts caused by the environment are equally distributed over the whole structure during the experiment the subtracting step in this presented procedure reduces the noise in the IR-camera results significantly. Furthermore, it can be seen hat due to the slower cooling compared to the heating phases in a cycle, the structure heats up continuously over the subsequent cycles.

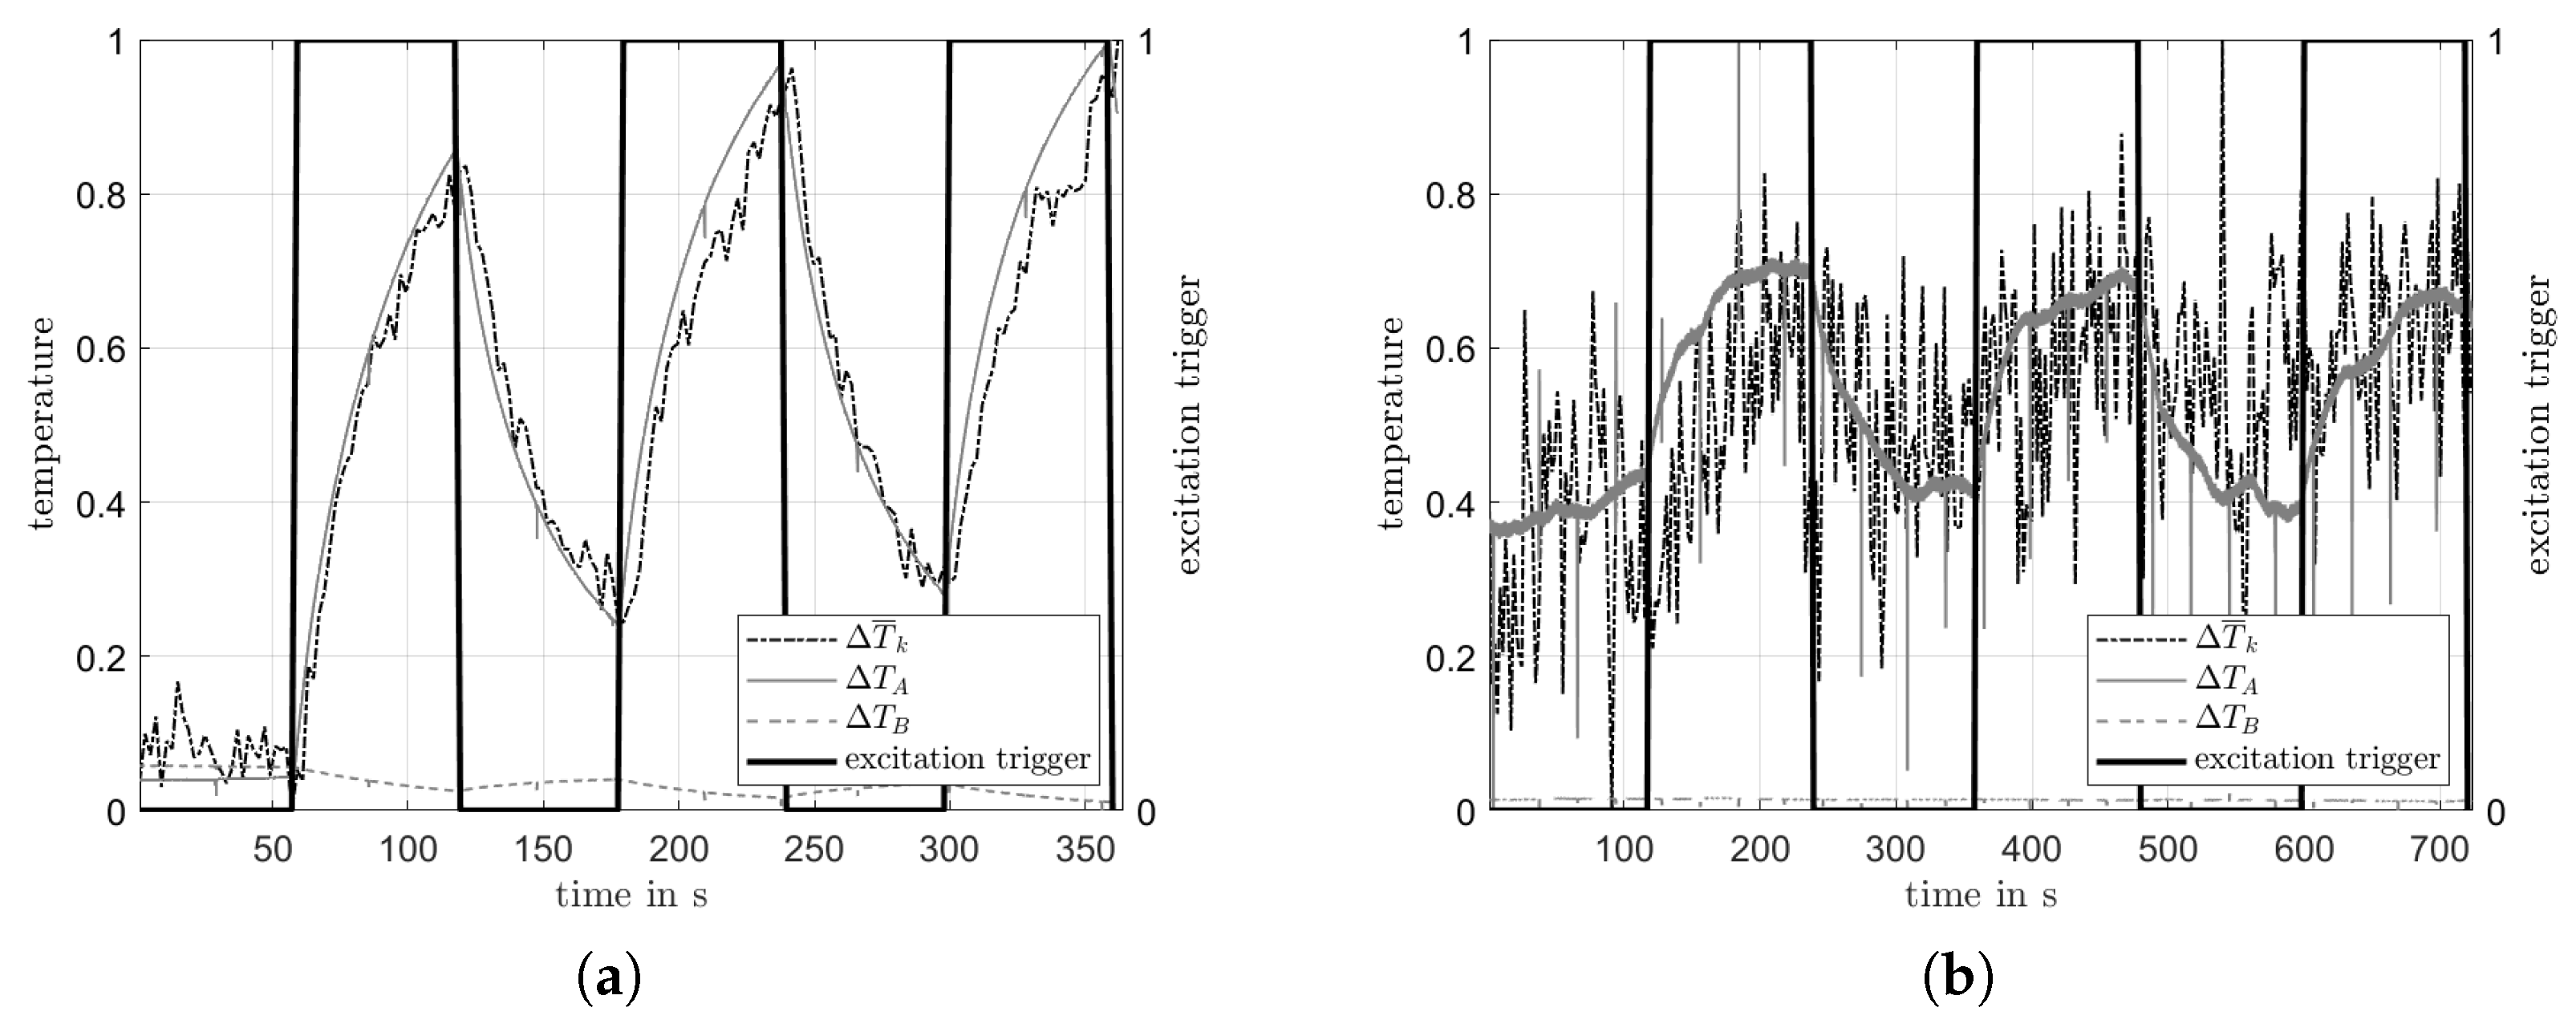
4.2.2. Potential of Vibration-Based Thermal Health Monitoring

The evaluation of the potential of the novel thermal health monitoring method is done by temperature difference measurements at the debonded and bonded face layer by the surface temperature sensors while being excited by a PWAS transducer (cf. Figure 3). In this experiment, each excitation and non-excitation phase in a cycle was extended to two minutes to overcome the smaller dynamic response (compared to the piezoelectric stack actuator; cf. Figure 6), and correspondingly expected slower and smaller heating of the damage. The excitation cycle is again three times repeated and the results depicted in Figure 8b show the normalized measured surface temperature difference Δ T A and Δ T B over time. The temperature differences Δ T A and Δ T B show clearly a temperature increase at the debonding during the excitation phase and a temperature decrease back to the initial temperature when not excited. To verify the results of the surface temperature sensors by the thermography results, the same spatial averaging procedure as described in Section 4.2.1 is used. The difference Δ T ¯ k of the averaged temperature data at the debonded face layer area and at the bonded area are again calculated and compared to the surface temperature sensor output Δ T A and Δ T B , see in Figure 8b. Thermography and surface temperature sensors show clearly the same behavior, that is, heating of the debonding when excited and cooling down to the initial temperature when not excited. Nevertheless, the thermography results, although being averaged, are very noisy compared to the surface sensor results. The maximum temperature difference increase Δ T B measured by the surface sensors at the debonded face layer is approximately 0.05 K at a very good signal-to-noise level. This temperature increase is much lower than the temperature increase caused by the excitation via the piezoelectric stack actuator due to the lower excitation power. The temperature difference measured by the surface sensors at the bonded sandwich area do not show any reaction to the excitation state. Moreover, the temperature difference increase presented in Figure 8b shows convergence to a static value for excitation with the PWAS transducer. This behavior would indicate that the heating has reached a maximum for the given excitation, which was not given for the excitation with the piezoelectric stack actuator (cf. Figure 8a).
In summary the applicability of the presented novel thermal health monitoring method for sandwich debonding is demonstrated for the considered sandwich structure equipped with small and lightweight temperature sensors and a conventional adhesively bonded PWAS transducer as excitation source. Furthermore, the very high excitation voltage and duration that was used with the PWAS transducer could be reduced for the given setup due to high sensitivity of the used temperature sensors and the very good signal-to-noise ratio. However, it should be mentioned that these results may vary with different setups of sensors, excitation sources, structures, and damage. Nevertheless, with a sufficiently dense array of surface temperature sensors and PWAS transducers for excitation the novel thermal health monitoring method is capable of detecting, localizing and quantifying debonding of sandwich face layers.

5. Conclusions

The present paper presents a novel vibration-based thermal health monitoring method for face layer debonding detection in aerospace sandwich structures. The novel approach extends the vibration-based thermography NDT method to a continuous and on-board SHM method with high potential for detection, localization and quantification of face layer debondings in composite sandwich structures. The method employs well known NDT methods for SHM, by replacing the large and heavy excitation sources (e.g., shaker or piezoelectric stack actuator) and temperature sensing devices (IR-camera) by small and lightweight PWAS transducers and surface temperature sensors, respectively. To demonstrate the applicability and potential of the novel method several experiments, with a component level sandwich structure and different excitation sources (PWAS transducer and piezoelectric stack actuator) were performed. First, the basics of the LDR concept and the vibration-based thermography NDT approach was demonstrated for identification of sandwich face layer debonding by means of an IR-camera and a piezoelectric stack actuator for excitation. Additionally, the proposed use of surface temperature sensors was validated by the IR-camera results. Second, the applicability of the novel thermal health monitoring method was experimentally demonstrated by using the surface temperature sensors and replacing the piezoelectric stack actuator by a PWAS transducer. The results of the surface temperature sensors show clearly the heating of the debonded face layer of approx. 1 inch diameter when excited and the cooling down to the initial temperature when not excited. The presented method shows highest potential for continuous and on-board damage detection, due to the high sensitivity and the low noise level of the surface temperature sensors compared to an IR-camera. Nonetheless, it should be noted that the presented method was demonstrated for laboratory conditions only. The application of this novel method in large sandwich structures requires modifications and improvements of the technique, for example, by using a broadband excitation to identify the local damage frequency or by using more suitable temperature sensors. Nevertheless, the paper showed that it is possible to detect a relevant damage of approx. 1 inch diameter by using lightweight on-board sensors and actuators in a possible SHM set-up. A further advantage of the presented novel method is that it enables a multi-sensor approach, as the PWAS transducers used for excitation could also be used for other SHM methods, (e.g., guided waves or electromechanical impedance method).

Author Contributions

Conceptualization, T.B., C.K. and M.S.; methodology, T.B.; investigation, T.B.; writing—original draft preparation, T.B.; writing—review and editing, T.B., C.K. and M.S.; visualization, T.B.; project administration, M.S.; funding acquisition, M.S. All authors have read and agreed to the published version of the manuscript.

Funding

This research was funded by the Christian Doppler Research Association, the Austrian Federal Ministry for Digital and Economic Affairs, and the National Foundation for Research, Technology and Development.

Data Availability Statement

The data presented in this study are available on request from the corresponding author.

Conflicts of Interest

The authors declare no conflict of interest.

References

  1. Kralovec, C.; Schagerl, M. Review of Structural Health Monitoring Methods Regarding a Multi-Sensor Approach for Damage Assessment of Metal and Composite Structures. Sensors 2020, 20, 826. [Google Scholar] [CrossRef] [PubMed] [Green Version]
  2. Rytter, A. Vibrational Based Inspection of Civil Engineering Structures. Ph.D. Thesis, Department of Building Technology and Structural Engineering, Aalborg University, Aalborg, Denmark, 1993. [Google Scholar]
  3. Kralovec, C.; Schagerl, M. Electro-Mechanical Impedance Measurements as a Possible SHM Method for Sandwich Debonding Detection. Key Eng. Mater. 2017, 742, 763–777. [Google Scholar] [CrossRef]
  4. Gschoßmann, S.; Humer, C.; Schagerl, M. Lamb Wave Excitation and Detection with Piezoelectric Elements: Essential Aspects for a Reliable Numerical Simulation. In Proceedings of the 8th EWSHM, Bilbao, Spain, 5–8 July 2016. [Google Scholar]
  5. Kulakovskyi, A.; Mesnil, O.; Lhémery, A.; Chapuis, B.; d’Almeida, O. Defect Imaging in Layered Composite Plates and Honeycomb Sandwich Structures Using Sparse Piezoelectric Transducers Network. J. Phys. Conf. Ser. 2019, 1184, 012001. [Google Scholar] [CrossRef]
  6. Nonn, S.; Schagerl, M.; Zhao, Y.; Gschossmann, S.; Kralovec, C. Application of Electrical Impedance Tomography to an Anisotropic Carbon Fiber-Reinforced Polymer Composite Laminate for Damage Localization. Compos. Sci. Technol. 2018, 160, 231–236. [Google Scholar] [CrossRef]
  7. Grassia, L.; Iannone, M.; Califano, A.; D’Amore, A. Strain Based Method for Monitoring the Health State of Composite Structures. Compos. Part B Eng. 2019, 176, 107253. [Google Scholar] [CrossRef]
  8. Schagerl, M.; Viechtbauer, C.; Schaberger, M. Optimal Placement of Fiber Optical Sensors along Zero-Strain Trajectories to Detect Damages in Thin-Walled Structures with Highest Sensitivity. In Proceedings of 7th IWSHM; Destech Publications: Lancaster, PA, USA, 2015. [Google Scholar] [CrossRef]
  9. Bergmayr, T.; Winklberger, M.; Kralovec, C.; Schagerl, M. Strain Measurements along Zero-Strain Trajectories as Possible Structural Health Monitoring Method for Debonding Initiation and Propagation in Aircraft Sandwich Structures. Procedia Struct. Integr. 2020, 28, 1473–1480. [Google Scholar] [CrossRef]
  10. Stewart, A.; Carman, G.; Richards, L. Health Monitoring Technique for Composite Materials Utilizing Embedded Thermal Fiber Optic Sensors. J. Compos. Mater. 2005, 39, 199–213. [Google Scholar] [CrossRef]
  11. Stewart, A.; Carman, G.; Richards, L. Nondestructive Evaluation Technique Utilizing Embedded Thermal Fiber Optic Sensors. J. Compos. Mater. 2003, 37, 2197–2206. [Google Scholar] [CrossRef]
  12. Fereidoon, A.; Andalib, M.; Hemmatian, H. Bending Analysis of Curved Sandwich Beams with Functionally Graded Core. Mech. Adv. Mater. Struct. 2015, 22, 564–577. [Google Scholar] [CrossRef]
  13. Bahabadi, H.M.; Farrokhabadi, A.; Rahimi, G.H. Investigation of Debonding Growth between Composite Skins and Corrugated Foam-Composite Core in Sandwich Panels under Bending Loading. Eng. Fract. Mech. 2020, 230, 106987. [Google Scholar] [CrossRef]
  14. Chi, X.; Di Maio, D.; Lieven, N.A. Modal-Based Vibrothermography Using Feature Extraction with Application to Composite Materials. Struct. Health Monit. 2019. [Google Scholar] [CrossRef] [Green Version]
  15. Meola, C.; Carlomagno, G.M.; Giorleo, G. Using Infrared Thermography to Analyze Substrate and Adhesive Effects in Bonded Structures. J. Adhes. Sci. Technol. 2004, 18, 617–634. [Google Scholar] [CrossRef]
  16. Solodov, I.; Bai, J.; Busse, G. Resonant Ultrasound Spectroscopy of Defects: Case Study of Flat-Bottomed Holes. J. Appl. Phys. 2013, 113, 223512. [Google Scholar] [CrossRef]
  17. Solodov, I.; Bai, J.; Bekgulyan, S.; Busse, G. A Local Defect Resonance to Enhance Acoustic Wave-Defect Interaction in Ultrasonic Nondestructive Evaluation. Appl. Phys. Lett. 2011, 99, 211911. [Google Scholar] [CrossRef]
  18. Solodov, I. Resonant Acoustic Nonlinearity for Defect-Selective Imaging and NDT. In Proceedings of the RECENT DEVELOPMENTS IN NONLINEAR ACOUSTICS: 20th International Symposium on Nonlinear Acoustics Including the 2nd International Sonic Boom Forum, Écully, France, 29 June–3 July 2015; p. 020003. [Google Scholar] [CrossRef] [Green Version]
  19. Rahammer, M.; Kreutzbruck, M. Fourier-Transform Vibrothermography with Frequency Sweep Excitation Utilizing Local Defect Resonances. NDT E Int. 2017, 86, 83–88. [Google Scholar] [CrossRef]
  20. Rahammer, M.; Kreutzbruck, M. Local Defect Resonance Excitation Thermography for Damage Detection in Plastic Composites. In Proceedings of the Europe/Africa Conference—Polymer Processing Society, Dresden, Germany, 27–29 June 2017; p. 120004. [Google Scholar] [CrossRef]
  21. Stepinski, T.; Uhl, T.; Staszewski, W.J. Advanced Structural Damage Detection: From Theory to Engineering Applications; Wiley: Chichester, UK, 2013. [Google Scholar]
  22. Renshaw, J.; Chen, J.C.; Holland, S.D.; Bruce Thompson, R. The Sources of Heat Generation in Vibrothermography. NDT E Int. 2011, 44, 736–739. [Google Scholar] [CrossRef] [Green Version]
  23. Vavilov, V.P.; Burleigh, D.D. Review of Pulsed Thermal NDT: Physical Principles, Theory and Data Processing. NDT E Int. 2015, 73, 28–52. [Google Scholar] [CrossRef]
  24. Vavilov, V.P.; Taylor, R. Theoretical and Practical Aspects of the Thermal Nondestructive Testing of Bonded Structures; Academic Press, Research Techniques in Nondestructive Testing: Oxford, UK, 1982; pp. 239–280. [Google Scholar]
  25. Gao, B.; Bai, L.; Woo, W.L.; Tian, G.Y.; Cheng, Y. Automatic Defect Identification of Eddy Current Pulsed Thermography Using Single Channel Blind Source Separation. IEEE Trans. Instrum. Meas. 2014, 63, 913–922. [Google Scholar] [CrossRef]
  26. Rajic, N. Principal Component Thermography for Flaw Contrast Enhancement and Flaw Depth Characterisation in Composite Structures. Compos. Struct. 2002, 58, 521–528. [Google Scholar] [CrossRef]
  27. Liang, T. Low Energy Impact Damage Detection in CFRP Using Eddy Current Pulsed Thermography. Compos. Struct. 2016, 143, 352–361. [Google Scholar] [CrossRef] [Green Version]
  28. Maldague, X.; Marinetti, S. Pulse Phase Infrared Thermography. J. Appl. Phys. 1996, 79, 6. [Google Scholar] [CrossRef]
  29. Karimov, K.S.; Khalid, F.A.; Tariq Saeed Chani, M.; Mateen, A.; Asif Hussain, M.; Maqbool, A. Carbon Nanotubes Based Flexible Temperature Sensors. Optoelectron. Adv. Mater. Rapid Commun. 2012, 6, 194–196. [Google Scholar]
  30. Sauerbrunn, E.; Chen, Y.; Didion, J.; Yu, M.; Smela, E.; Bruck, H.A. Thermal Imaging Using Polymer Nanocomposite Temperature Sensors: Thermal Imaging. Phys. Status Solidi(a) 2015, 212, 2239–2245. [Google Scholar] [CrossRef]
  31. James, R.; Giurgiutiu, V. Towards the Generation of Controlled One-Inch Impact Damage in Thick CFRP Composites for SHM and NDE Validation. Compos. Part B Eng. 2020, 203, 108463. [Google Scholar] [CrossRef]
  32. Kralovec, C.; Schagerl, M.; Mayr, M. Localization of Damages by Model-Based Evaluation of Electro-Mechanical Impedance Measurements. In Proceedings of the 9th EWSHM, Manchester, UK, 10–13 July 2018; p. 12. [Google Scholar]
  33. Vavilov, V.; Burleigh, D. Infrared Thermography and Thermal Nondestructive Testing; Springer International Publishing: Cham, Switzerland, 2020. [Google Scholar] [CrossRef]
Figure 1. Composite spoiler of a civil aircraft.
Applsci 11 00211 g001
Figure 2. Investigated structure: (a) The investigated sandwich structure with the face layer debonding, excitation devices and surface temperature sensors (b) Cross-section of the investigated structure at the artificially introduced face layer debonding.
Applsci 11 00211 g002
Figure 3. Experimental set-up of the scanning laser Doppler vibrometer measurements (detail A is a scaled magnification of the area of interest).
Applsci 11 00211 g003
Figure 4. Experimental set-up of the temperature-based damage identification experiment (detail B is a scaled magnification of the area of interest).
Applsci 11 00211 g004
Figure 5. Illustration of dynamic responses of the debonded area to a broadband excitation via the piezoelectric wafer active sensors (PWAS) by the scanning laser Doppler vibrometer (SLDV) results. (a) Eigenmode of debonded face layer at the first damage resonance frequency f 0 . (b) Velocity amplitude of dynamic response at the SLDV scan point at the center of the debonding for both excitations.
Applsci 11 00211 g005
Figure 6. Dynamic out-of-plane velocity response to a sinusoidal excitation at the local resonance frequency f 0 = 5.641 kHz for considered excitation sources and scan point at the debonding center.
Applsci 11 00211 g006
Figure 7. (a) Temperature difference Δ T ¯ k of five consecutive images before excitation and five consecutive IR-images at the end of the excitation sequence. (b) Thermography results of the principal component analysis (PCA)-based feature extraction algorithm. (c) Normalized temperature difference profile with respect to the pixel-line L 1 , whereas (d) shows the profile with respect to the pixel-line L 2 . In both temperature profiles the gray shaded areas indicate the location of the surface temperature sensors.
Applsci 11 00211 g007
Figure 8. (a) Shows the normalized temperature profile of the averaged difference of the pristine and damaged area Δ T ¯ k resulting of the IR-images compared to the results of the surface temperature sensors Δ T ¯ A and Δ T ¯ B at the experiment, in which the piezoelectric stack actuator is used as excitation source, whereas (b) shows the results of the experiment with the PWAS bonded on the structure used as excitation source. The excitation trigger signal is schematically shown whether the excitation is on (1), or off (0).
Applsci 11 00211 g008
Table 1. Summary of maximum dynamic out-of-plane velocity response to a sinusoidal excitation at the the local resonance frequency f 0 = 5.641 kHz for selected excitation sources and scan point at debonding center.
Excitation SourceExcitation Voltage Amplitude
[V]
Offset Voltage
[V]
Velocity Response Amplitude
mm/s
piezoelectric stack actuator40 V20 V338.42
PWAS150 V075.64
Publisher’s Note: MDPI stays neutral with regard to jurisdictional claims in published maps and institutional affiliations.

