Article

Experimental Investigation of Oxygen Carrier Aided Combustion (OCAC) with Methane and PSA Off-Gas

Department of Space, Earth and Environment, Chalmers University of Technology, SE-412 96 Gothenburg, Sweden
*
Author to whom correspondence should be addressed.
Appl. Sci. 2021, 11(1), 210; https://doi.org/10.3390/app11010210
Submission received: 26 October 2020 / Revised: 15 December 2020 / Accepted: 21 December 2020 / Published: 28 December 2020
(This article belongs to the Section Energy Science and Technology)

Abstract

:
Oxygen carrier aided combustion (OCAC) is utilized to promote the combustion of relatively stable fuels already in the dense bed of bubbling fluidized beds by adding a new mechanism of fuel conversion, i.e., direct gas–solid reaction between the metal oxide and the fuel. Methane and a fuel gas mixture (PSA off-gas) consisting of H2, CH4 and CO were used as fuel. Two oxygen carrier bed materials—ilmenite and synthetic particles of calcium manganate—were investigated and compared to silica sand, an in this context inert bed material. The results with methane show that the fuel conversion is significantly higher inside the bed when using oxygen carrier particles, where the calcium manganate material displayed the highest conversion. In total, 99.3–99.7% of the methane was converted at 900 °C with ilmenite and calcium manganate as a bed material at the measurement point 9 cm above the distribution plate, whereas the bed with sand resulted in a gas conversion of 86.7%. Operation with PSA off-gas as fuel showed an overall high gas conversion at moderate temperatures (600–750 °C) and only minor differences were observed for the different bed materials. NO emissions were generally low, apart from the cases where a significant part of the fuel conversion took place above the bed, essentially causing flame combustion. The NO concentration was low in the bed with both fuels and especially low with PSA off-gas as fuel. No more than 11 ppm was detected at any height in the reactor, with any of the bed materials, in the bed temperature range of 700–750 °C.

1. Introduction

In bubbling fluidized bed reactors with silica sand, it has been observed that most of the methane is converted in the freeboard [1,2] when fluidizing with air and methane/natural gas at moderate temperatures. Methane is a very stable gaseous fuel. This is connected to the fact that it is sterically hindered, due to the symmetrical tetrahedral structure and the activation of the C-H bond with a dissociation energy of 439 kJ/mol [3]. Thus, ignition requires harsh conditions [4]. In a bubbling fluidized bed, the solid particles effectively hinder the combustion of methane. There are two main reasons for this. Firstly, due to the presence of particles, heat is transferred to the surrounding particles in contact with the bubble [5], which otherwise could result in a local temperature increase, which could lead to ignition. Secondly, it has been identified that free radicals (H, O, OH and HO2) are quenched by a high concentration of inert particles [6]. The radicals are required intermediates for homogeneous reactions, which result in an inhibition of the gas combustion in the dense bed [6] because the bed particles have a large surface area where radical recombination occurs [7].
It has been observed that there is a critical bubble size for the air-fuel-mixture with light hydrocarbons that is required before ignition may occur [7]. When using propane as fuel, it was shown that no combustion occurred in the emulsion phase [7]. Temperature has been identified as a key parameter where an increased dense bed temperature causes the methane conversion to gradually move downwards into the dense bed [2]. It was observed that smaller and smaller bubbles are ignited when the bed temperature is increased [7] and since the bubble size is increasing when passing through the bed, this can be used to explain why the combustion reaction is moving downwards into the bed at higher temperatures. At a high enough bed temperature, it was observed that bubbles ignited very soon after being formed at the distributor plate [7]. Another interesting observation which has been made is that decreasing the gas flow rate shows an effect similar to that of increasing the bed temperature [2]. The studies that have been conducted so far use measurements of temperature and gas concentration along the length of the reactor to verify where methane conversion takes place [1,2]. The studies mentioned using low gas velocities, mostly in the range 2–2.5 times the minimum fluidization velocity.
Another possible solution to move the methane conversion downwards into the dense bed could be to replace the inert bed material with active oxygen carrier particles. The underlying idea behind this is that the gas–solid reaction between methane and the oxygen carrier is not inhibited by temperature as much as the homogeneous reaction. Oxygen carrier materials have been tested for several years for the carbon capture technology Chemical Looping Combustion (CLC), where it has been shown that it is possible to convert methane in the fuel reactor where no gaseous oxygen is present [8]. These findings led to the introduction of the technology of Oxygen Carrier Aided Combustion (OCAC), where oxygen carrier materials are used with the intention of improving the oxygen distribution in fluidized combustion units. The technology was proposed in 2013, when it was successfully tested in a 12 MWth CFB unit for biomass combustion by the partial substitution of sand with ilmenite (iron–titanium oxides) [9]. Since then, ilmenite has been used in large-scale CFB plants for biomass combustion, where it has been observed to significantly reduce the need for excess air [10].
Ilmenite is often regarded as the primary choice among oxygen carrier materials. This can be explained by its mechanical durability, non-toxicity and relatively low cost [11]. However, in the development of Chemical Looping Combustion systems, more than 900 oxygen carrier materials have been examined [12] including materials manufactured specifically for high reactivity towards certain fuels. One example of such manufactured material is the calcium–manganite-based material of single perovskite structure CaMn0.775Mg0.1Ti0.125O3-δ (also referred to as C28). This material was developed within EU-FP7 research projects, named INNOCUOUS and SUCCESS, between 2010–2017 [13]. The overall goal of the INNOCUOUS project was to develop efficient synthetic oxygen carrier particles with zero or at least very little nickel, specifically for fuels rich in methane. In the material screening, it was observed that materials based on calcium manganite with the addition of small amounts of magnesium and titanium were regarded among the most promising. Based on this work, the SUCCESS project aimed at finding suitable materials for low-cost production and the adaptation of a large-scale production process of these materials. A summary of the INNOCUOUS project was published by Mattisson et al. [14] and the development process of calcium manganite materials is summarized by Moldenhauer et al. [13] and additional articles presenting experimental work with C28 can be found in [15,16,17,18]
There are a few examples where the addition of oxygen carrier particles to BFB systems for methane combustion have been attempted. At a bed temperature of 700 °C it was shown that, by replacing as little as 0.13–1.3% of the inert bed material with iron oxide (Fe2O3), a significant reduction in methane and CO concentration could be achieved in the dense bed by increasing the oxygen carrier inclusion rate [1]. The effect of replacing more inert bed material with oxygen carrier material has also been attempted, where it could be seen that a 50% inclusion rate of manganese ore decreased the concentration of CO in the exhaust gas at 800–850 °C in general and especially at low air-to-fuel ratios [19]. However, since no temperature profile nor concentration profile for CH4 or CO was determined for the system, it is difficult to use this as proof that higher inclusion rates move the methane conversion into the dense bed. Results from experimental campaigns in a 12 MWth CFB boiler with wood chips using ilmenite [9], manganese ore [20] and steel converter slag [21] as a bed material all indicate that the partial substitution of silica sand as a bed material with these oxygen carrier bed materials increases fuel conversion and thus also the heat generation in the dense bed. This was concluded mainly based on the temperature profile of the boiler. In all instances, the temperature profile was significantly altered, such that the temperature at the top of the dense bed [20,21] was higher when the oxygen carrier was present in the bed compared to using only silica sand. Additionally, the temperature drop in the cyclone [9,20,21] was more pronounced when oxygen carriers were present, suggesting that less combustion took place here compared to when sand was used.
One example of a possible application of bubbling fluidized beds with methane/light hydrocarbons as fuel is to use the bed as a heat source for steam reforming [22,23,24,25,26]. In this process, the fuel gas is expected to be a mix of PSA off-gas consisting of mainly CO2 but also H2, CO and CH4 and supplementary fuel in the form of light hydrocarbons. The aim is to burn the fuel gas to enable the transfer of heat from the combustion to the immersed steam reforming tubes, which is envisaged to enable improved overall process performance. Methane constitutes a significant part of this fuel gas and it is therefore important to convert the fuel in the dense bed of the bubbling fluidized bed to generate the heat of combustion inside the bed. If it is possible to display experimental results, showing that it is possible convert the methane inside the dense bubbling bed, it should be possible to also convert other targeted gaseous fuels with most common oxygen carriers. This reasoning is in line with the results presented by Ortiz et al. [25], for example, where it was displayed that it was more difficult to convert methane than PSA off-gas in a fluidized bed with oxygen carrier particles. Both methane and PSA off-gas are considered interesting to include as fuels in a study on in-bed fuel conversion.
One of the possible benefits of the process to use a BFB as a heat source for SMR, compared to the conventional SMR furnace, is that it should also be possible to convert the fuel gas in the furnace without the presence of a flame. This should significantly reduce the risk of thermal NO formation as a result of local temperature hotspots. Hence, it is of interest to study NO formation in OCAC experiments and compare with normal sand experiments.
The aim of this work is to examine OCAC in a bubbling fluidized bed system fed with methane or PSA off-gas as fuel. Three bed materials are examined, namely silica sand, ilmenite and C28. The system is operating with an air-to-fuel ratio of 1.05. The superficial gas velocity is 0.2 m/s. The system is operated at bed temperatures ranging from 600 to 900 °C with methane and between 600 to 800 °C with PSA off-gas. The targeted bed temperature is reached by adjusting the target temperature of the furnace while the air and fuel gas are fed to the system. Temperatures and dry gas concentrations are measured over the length of the reactor to assess where the fuel conversion takes place.

2. Materials and Methods

2.1. Reactor System

The experiments were carried out on a laboratory-scale high temperature 253 MA steel reactor (see Figure 1). The reactor is 1.27 m high and has a 77.9 mm inside diameter. The reactor is placed in an electrically heated furnace with three different heating zones, which can be controlled separately by adjusting targeted furnace temperature in each zone. The fluidization gas consists of air and fuel gases, which are mixed in a T-connection outside of the furnace before entering the wind box. The fuel gas consists of either 99.5% methane or a gas mixture representing a typical PSA off-gas composition. The gas mixture entering the wind box then passes through a 5 mm thick hole plate with 61 0.6 mm holes to the bubbling fluidized bed. The bottom plate was designed to provide sufficient pressure drop to enable a good gas distribution. The fuel gas flow was controlled using mass flow controllers (MFCs).
In order to ensure that the fuel is converted inside the bed and nowhere else it is important to consider the risk of fuel ignition in the wind box of the reactor. The temperature at which this can occur is best described by the so called autoignition temperature, which is the lowest temperature at which a certain substance spontaneously ignites without the presence of an external source of ignition, such as a flame or spark. The fuel/air mixtures, which result in the lowest autoignition temperature, are different for different fuels, but the autoignition temperature is approximately 500 °C for hydrogen, 580 °C for methane and 609 °C for carbon monoxide [27]. As soon as the ignition reaction is initiated, the exothermic process rapidly increases the temperature which, in turn, causes positive feedback for the combustion of the fuel. The wind box temperature should therefore be limited. Thus, a cooling coil with a 6 mm outer diameter is placed in the wind box. Cooling air is flowing through the coil at high velocity and the coil makes several passes along the walls of the wind box (see Figure 1). The air flow in the cooling coil is controlled manually with the goal to keep the wind box temperature below 500 °C, in order to reduce the risk of fuel ignition in the wind box. The approach to premix air and fuel in the wind box has been used also in previous experiments to study methane combustion in a BFB [1,2].
Due to the size of the reactor its surface area to volume ratio is low, resulting in significant heat losses to the surroundings. Consequently, the reactor is placed in an electrically heated furnace with three different heating zones, which can be controlled separately to reach the target temperature for the system. The temperature is measured in the wind box as well as at the nine vertical positions (MP0-MP8)—see Table 1—by using thermocouples measuring the temperature approximately 1 cm from the inside reactor wall. The thermocouples, type K, tolerance class 1, have a common reference point and are connected to an NI 9213 measurement module where the measurement is done in high-resolution mode with a measurement accuracy of < 0.02 °C. The second measurement point located approximately 9 cm above the distribution plate, MP2, was chosen as representative for the bed temperature and was thus closely monitored during the experiments. The tubes where the thermocouples are introduced are also used to measure the pressure. Gas present in this volume is in connection with pressure transducers, which are used to measure the pressure. It is also possible to use the same tube connections to flush the tubes with nitrogen, to remove accumulated bed material. At similar heights but on the opposite side of the reactor, corresponding to the same measurement points named MP1-MP8, sampling gas can be extracted. Gas sampling tubes are injected into the reactor where the ends of the tubes are located 2 cm from the inside reactor wall. The ends of the sampling tubes have porous metal cups (10 mm OD, 6 mm ID) consisting of nickel-chromium-iron-molybdenum alloy (316 L) with a porosity of approximately 150 µm. The metal cups act as a filter to prevent bed material from entering the gas sampling tube. After each measurement, the sampling tubes are flushed in the opposite direction with pressurized air in order to remove possible fines from the porous surface. Jacketed tubing is used on this side to make it possible to move the tube over the cross section.
In order to avoid condensation in the extracted gas stream, a hose with heating bands is attached at the end of the gas sampling tube at the vertical measurement point of interest and a temperature controller is used to keep the temperature at approximately 190 °C. One normal litre per minute is the required gas flow to the analysers. The sampled gases are sent to a hot filter operating at a temperature of 190 °C. The wet gas is then dried in a condenser followed by a cold filter before it is provided to the SICK GMS810 gas analyser. NDIR (nondispersive infrared sensors) are used to measure the concentration of CO, CO2 and CH4. O2 is measured with a paramagnetic sensor, thermal conductivity is used to detect H2 and the NO concentration is estimated with Non-Dispersive Ultra Violet Spectroscopy (NDUV). All the mentioned measurements are made online where one datapoint is retrieved every second. The analysers were calibrated at the start of each day when an experiment was carried out (at the zero point and an additional calibration point). The uncertainty in the gas concentration measurement is <0.5% for each component.
Figure 2 shows the key zones of the bubbling fluidized bed and provides an indication where these zones are found in the setup used. Equal volumes of bed materials were used in the experiments. Bulk density measurements prior to the experiments were conducted to estimate the required bed inventory. The target was to have the bed height Hbed between the third and fourth measurement points (MP3 and MP4) from the distributor plate of the reactor. This point was estimated based on the assumption that the gauge pressure at the top of the splash zone should be close to 0. Based on the pressure measurement data at MP3, the bed height was therefore estimated according to Equation (1). A constant pressure gradient is assumed between MP3 and the top of the splash zone. The air density ( ρ a i r ) is assumed to be negligible compared to the particle density ( ρ p ) and the voidage of the fixed bed ( ε f i x e d ) is assumed to be 0.4, whereas the voidage in the bubbling bed ( ε B F B ) is assumed to be 0.6.
H b e d = H 3 + P 3 9.81 ( ρ p ρ a i r ) ( 1 ε B F B )
The particle density was determined based on the measured bed density for the bed materials used according to Equation (2).
ρ p = ρ b e d 1 ε f i x e d
It should be noted that the borders between indicated zones in Figure 2 are more for illustrative purpose, since it is difficult to ascertain precisely where the border between dense bed and splash zone is positioned with the limited number of measurement points available in this reactor. The position of these borders is also, to some extent, different for different gas velocities and bed temperatures, which makes it difficult to keep the bed height constant. Initial experiments were conducted with sand as a bed material, where the bed inventory was varied during cold flow operation to find a point where the bed inventory resulted in a fluidized bed height between measurement points 3 and 4 (corresponding to a fixed bed height of at least 136.5 mm). The stationary bed height used with sand in cold conditions was then used for all the experimental runs in the determination of a suitable bed inventory. This was done to maintain a similar bed height for all three bed materials, which was the target in this study. There were two main reasons for this. Firstly, the vertical measurement points were placed in the reactor with the purpose to study different bed materials with similar bed heights. The measurement points were placed in the bed and especially close to the expected top of the bed. Secondly, the proposed application, to use a fluidized bed as a heat source, means having a certain defined bed height based on the design of the fluidized bed heat exchanger which motivates the focus on fluidized bed height rather than bed mass, for example.

2.2. Bed Material

The most commonly used bed material in biomass fluidized bed boilers is silica sand, which is inert towards fuel and air but acts as an ash absorbent and thermal flywheel. In these experiments, silica sand from Baskarp, Sweden, was used. The second material used was Norwegian rock ilmenite concentrate, supplied by Titania A/S. Ilmenite is a mineral ore rich in iron and titanium oxides. The third material evaluated in this work is a synthetic oxygen carrier referred to as C28 (CaMn0.775Mg0.1Ti0.125O3-δ) which was manufactured by VITO in Belgium by spray drying [18]. The C28 material used in these experiments was recovered from the fuel reactor after experiments in a 10 kWth CLC reactor used for gaseous fuels [15]. The elemental composition for sand and ilmenite is reported in Table 2.
Sand could be assumed to be an inert bed material, but to make sure that this is the case, the reactivity of sand was tested in a separate experiment at high temperature where syngas was mixed with nitrogen [29]. This experiment showed that the sand was inert and did not show any tendencies of gas–solid reactions with the CO or H2. Ilmenite and C28 are, however, oxygen carriers and these are oxidized/reduced when reacting with the oxygen/fuel which has already been shown in numerous CLC experiments. The general reaction between an oxygen carrier ( Me x O y ) and a hydrocarbon fuel ( C j H 2 k ) is shown in Equation (3).
( 2 j + k ) Me x O y + C j H 2 k ( 2 j + k ) Me x O y 1 + kH 2 O + CO 2
The reaction between methane and the most oxidized state of ilmenite, which is pseudobrookite ( Fe 2 TiO 5 ) and rutile ( TiO 2 ) can, for example, be described according to Equation (4).
1 4 CH 4 + Fe 2 TiO 5 +   TiO 2   2 FeTiO 3 + 1 4 CO 2 + 1 2 H 2 O   Δ H = 35   kJ / mol   O
The reoxidation of ilmenite can be described by Equation (5). It should be noted that other reactions can occur with ilmenite as well, such as redox reactions with magnetite (Fe3O4) and hematite (Fe2O3).
2 FeTiO 3 + 1 2 O 2   Fe 2 TiO 5 + TiO 2   Δ H = 235   kJ / mol   O
The reduction of C28 with methane can be defined according to Equation (6).
1 4 CH 4 +   CaMn 0.775 Mg 0.1 Ti 0.125 O 3 δ     CaMn 0.775 Mg 0.1 Ti 0.125 O 3 δ 1 + 1 2 H 2 O +   1 4 CO 2      
Equation (7) describes the reoxidation of C28.
1 2 O 2   +   CaMn 0.775 Mg 0.1 Ti 0.125 O 3 δ 1       CaMn 0.775 Mg 0.1 Ti 0.125 O 3 δ
All three bed materials were sieved to the size interval 90–212 μm and from that sample the particle size distribution was estimated (see Figure 3). Some differences can be observed between the different bed materials where sand has predominantly particles with a size in the lower range of the chosen sieving size interval.
The main data of the particles employed are presented in Table 3. The bulk density was estimated according to the ISO standard 3923-1:2008 where the mass poured into a known volume was measured. Based on the particle size distribution the weighted mean particle diameter was estimated. The minimum fluidization velocity was estimated based on the expression of Wen and Yu [30] and the terminal velocity was determined based on the expressions presented by Kunii and Levenspiel [31]. The values presented in Table 3 are based on operation at 750 °C using air as a fluidization gas. The thermal input indicated in the same table is estimated for the case with a superficial gas velocity of 0.2 m/s, an air-to-fuel-ratio of 1.05 and a temperature of 750 °C.

2.3. Experimental Procedure

The reactor setup enables continuous measurements of pressure and temperature for all measurement positions. The gas composition can be measured continuously for one vertical position at a time. An air flow is constantly fed to the reactor to prevent bed material from falling through the distribution plate and to avoid local hotspots in the bed. Fuel was added to the system once the bed temperature had reached its setpoint value and measurement data were then extracted for 1 min once steady state operation was observed with respect to measured pressure, temperature and gas concentrations. The chosen temperature intervals were chosen to cover a range from a low temperature (600 °C) at which little or no fuel conversion could be expected to take place, to a high temperature where complete if not close to complete fuel conversion occurs. This should enable a good comparison between the different bed materials as well as providing insights about the temperature dependence. The target was to maintain a wind box temperature not exceeding 500 °C to avoid fuel ignition before the gas reaches the bed. When operating at a bed temperature of at least 750 °C fuel ignition took place above the bed with all three bed materials.
Each bed material was pre-heated in the reactor system at 900 °C in the presence of air for at least one hour before the start of the experiments. This was mainly done to ensure that there was no net absorption of oxygen in the system with ilmenite, which otherwise could occur when using fresh ilmenite particles at low temperatures. When the gas sampling probe was placed at a certain height, the gas concentration at that point is estimated, as well as the average temperature and pressure at all measurement points. As a result, several average temperatures and pressures are recorded and the one presented in this article for a certain position is the average of those values. The targeted superficial gas velocity is estimated based on the targeted bed temperature.
The air-to-fuel ratio (AFR) is defined as the ratio of the volumetric flow rate of air fed to the fluidized bed to the volumetric flowrate, corresponding to the stoichiometric combustion of methane. The stoichiometric amount of air is based on the amount of oxygen needed to convert the methane fed to the reactor, according to Equation (8):
CH 4 + 2   O 2   CO 2 + 2   H 2 O   Δ H 298 ° C = 891   kJ / mol
If CO rather than CO2 is detected, it indicates that the combustion is incomplete.
When PSA off-gas is used, the amount of air is, in addition to the required oxygen to convert the methane, estimated based on the oxygen needed to burn H2 and CO, according to Equations (9) and (10).
H 2 + 1 2   O 2   H 2 O   Δ H 298 ° C = 286   kJ / mol
CO + 1 2   O 2   CO 2   Δ H 298 ° C = 283   kJ / mol
The gas composition of the simulated PSA off-gas is presented in Table 4.
The measurements with both methane and PSA off-gas were made with an air-to-fuel ratio of 1.05 and a superficial gas velocity of approximately 0.2 m/s. In the experiments with methane as fuel, the air-to-fuel ratio was also varied from 1 to 1.2 at 750 °C for all three bed materials. A temperature of 750 °C was chosen as a suitable temperature because it was easier to distinguish differences in fuel conversion at this temperature rather than at high bed temperatures, such as 900 °C. After operation, the system was cooled down and the remaining solids inventory in the reactor was weighed. The results from this weighing showed that approximately 10 g or less was lost.

3. Results

3.1. Experiments with Methane

The three materials (sand, ilmenite and C28) were examined at five different bed temperatures (600, 750, 800, 850, 900 °C). The results from these experiments using methane as fuel are also presented in Tables S1–S3 in the 
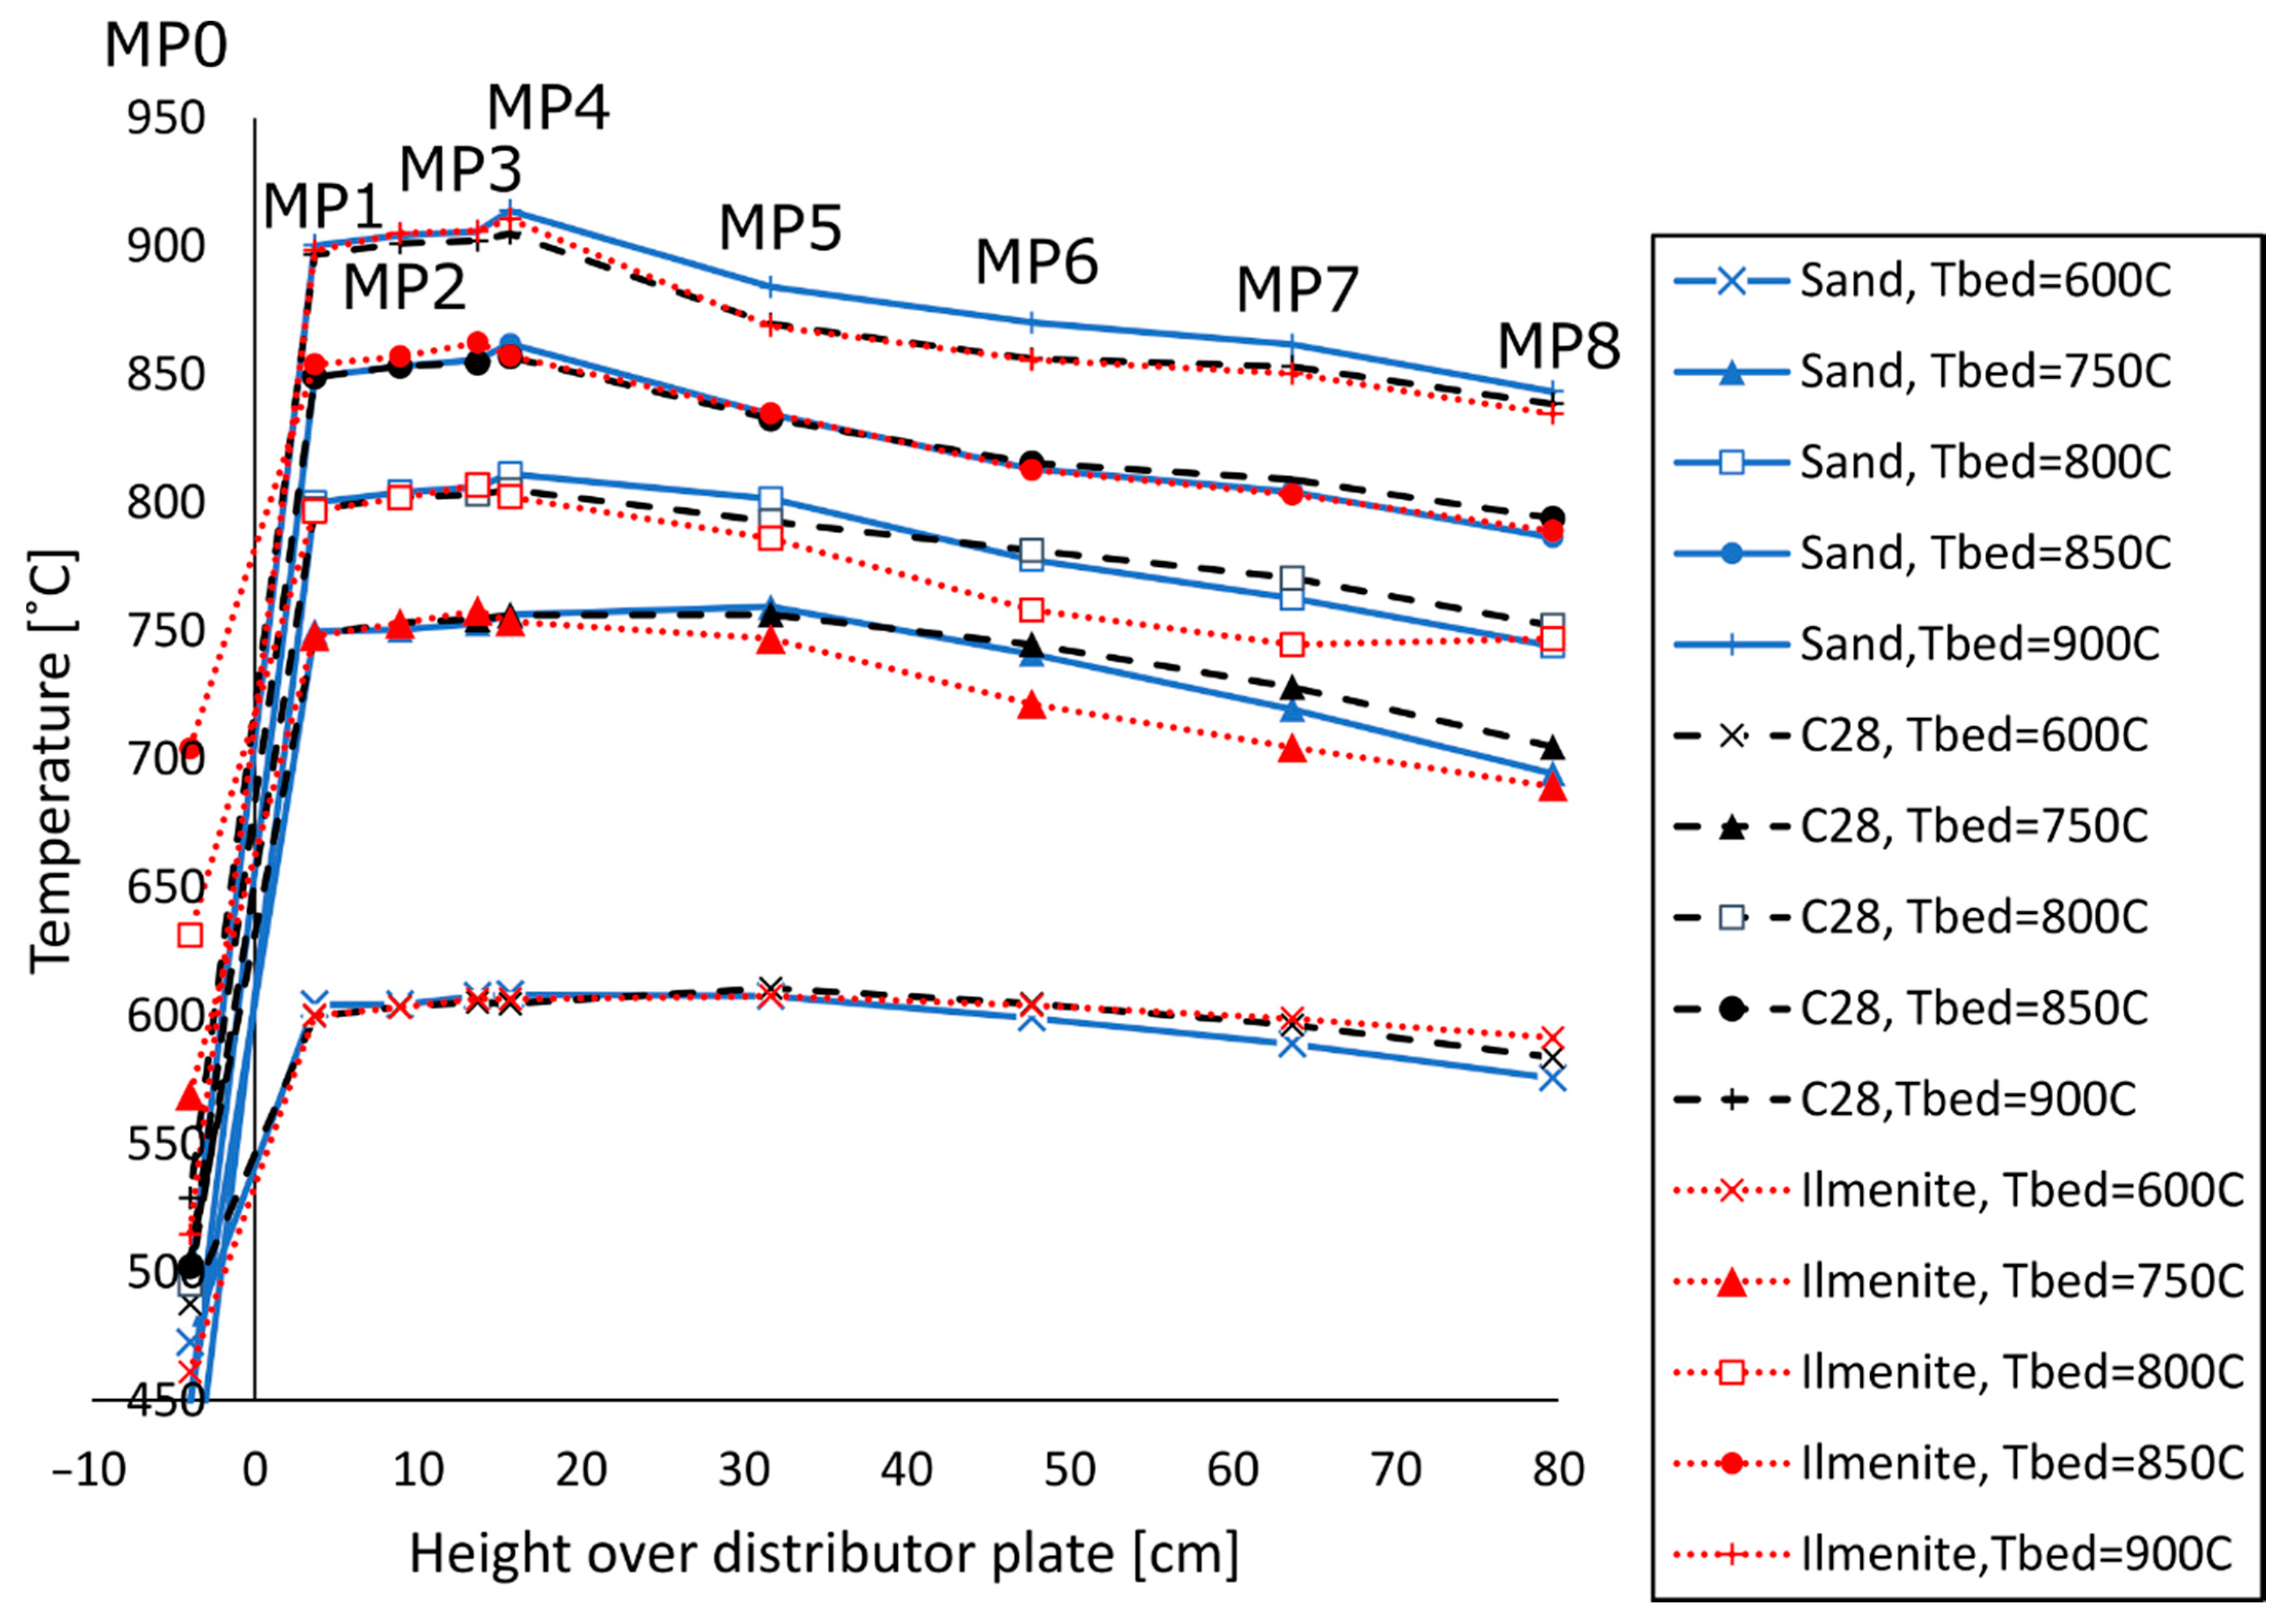
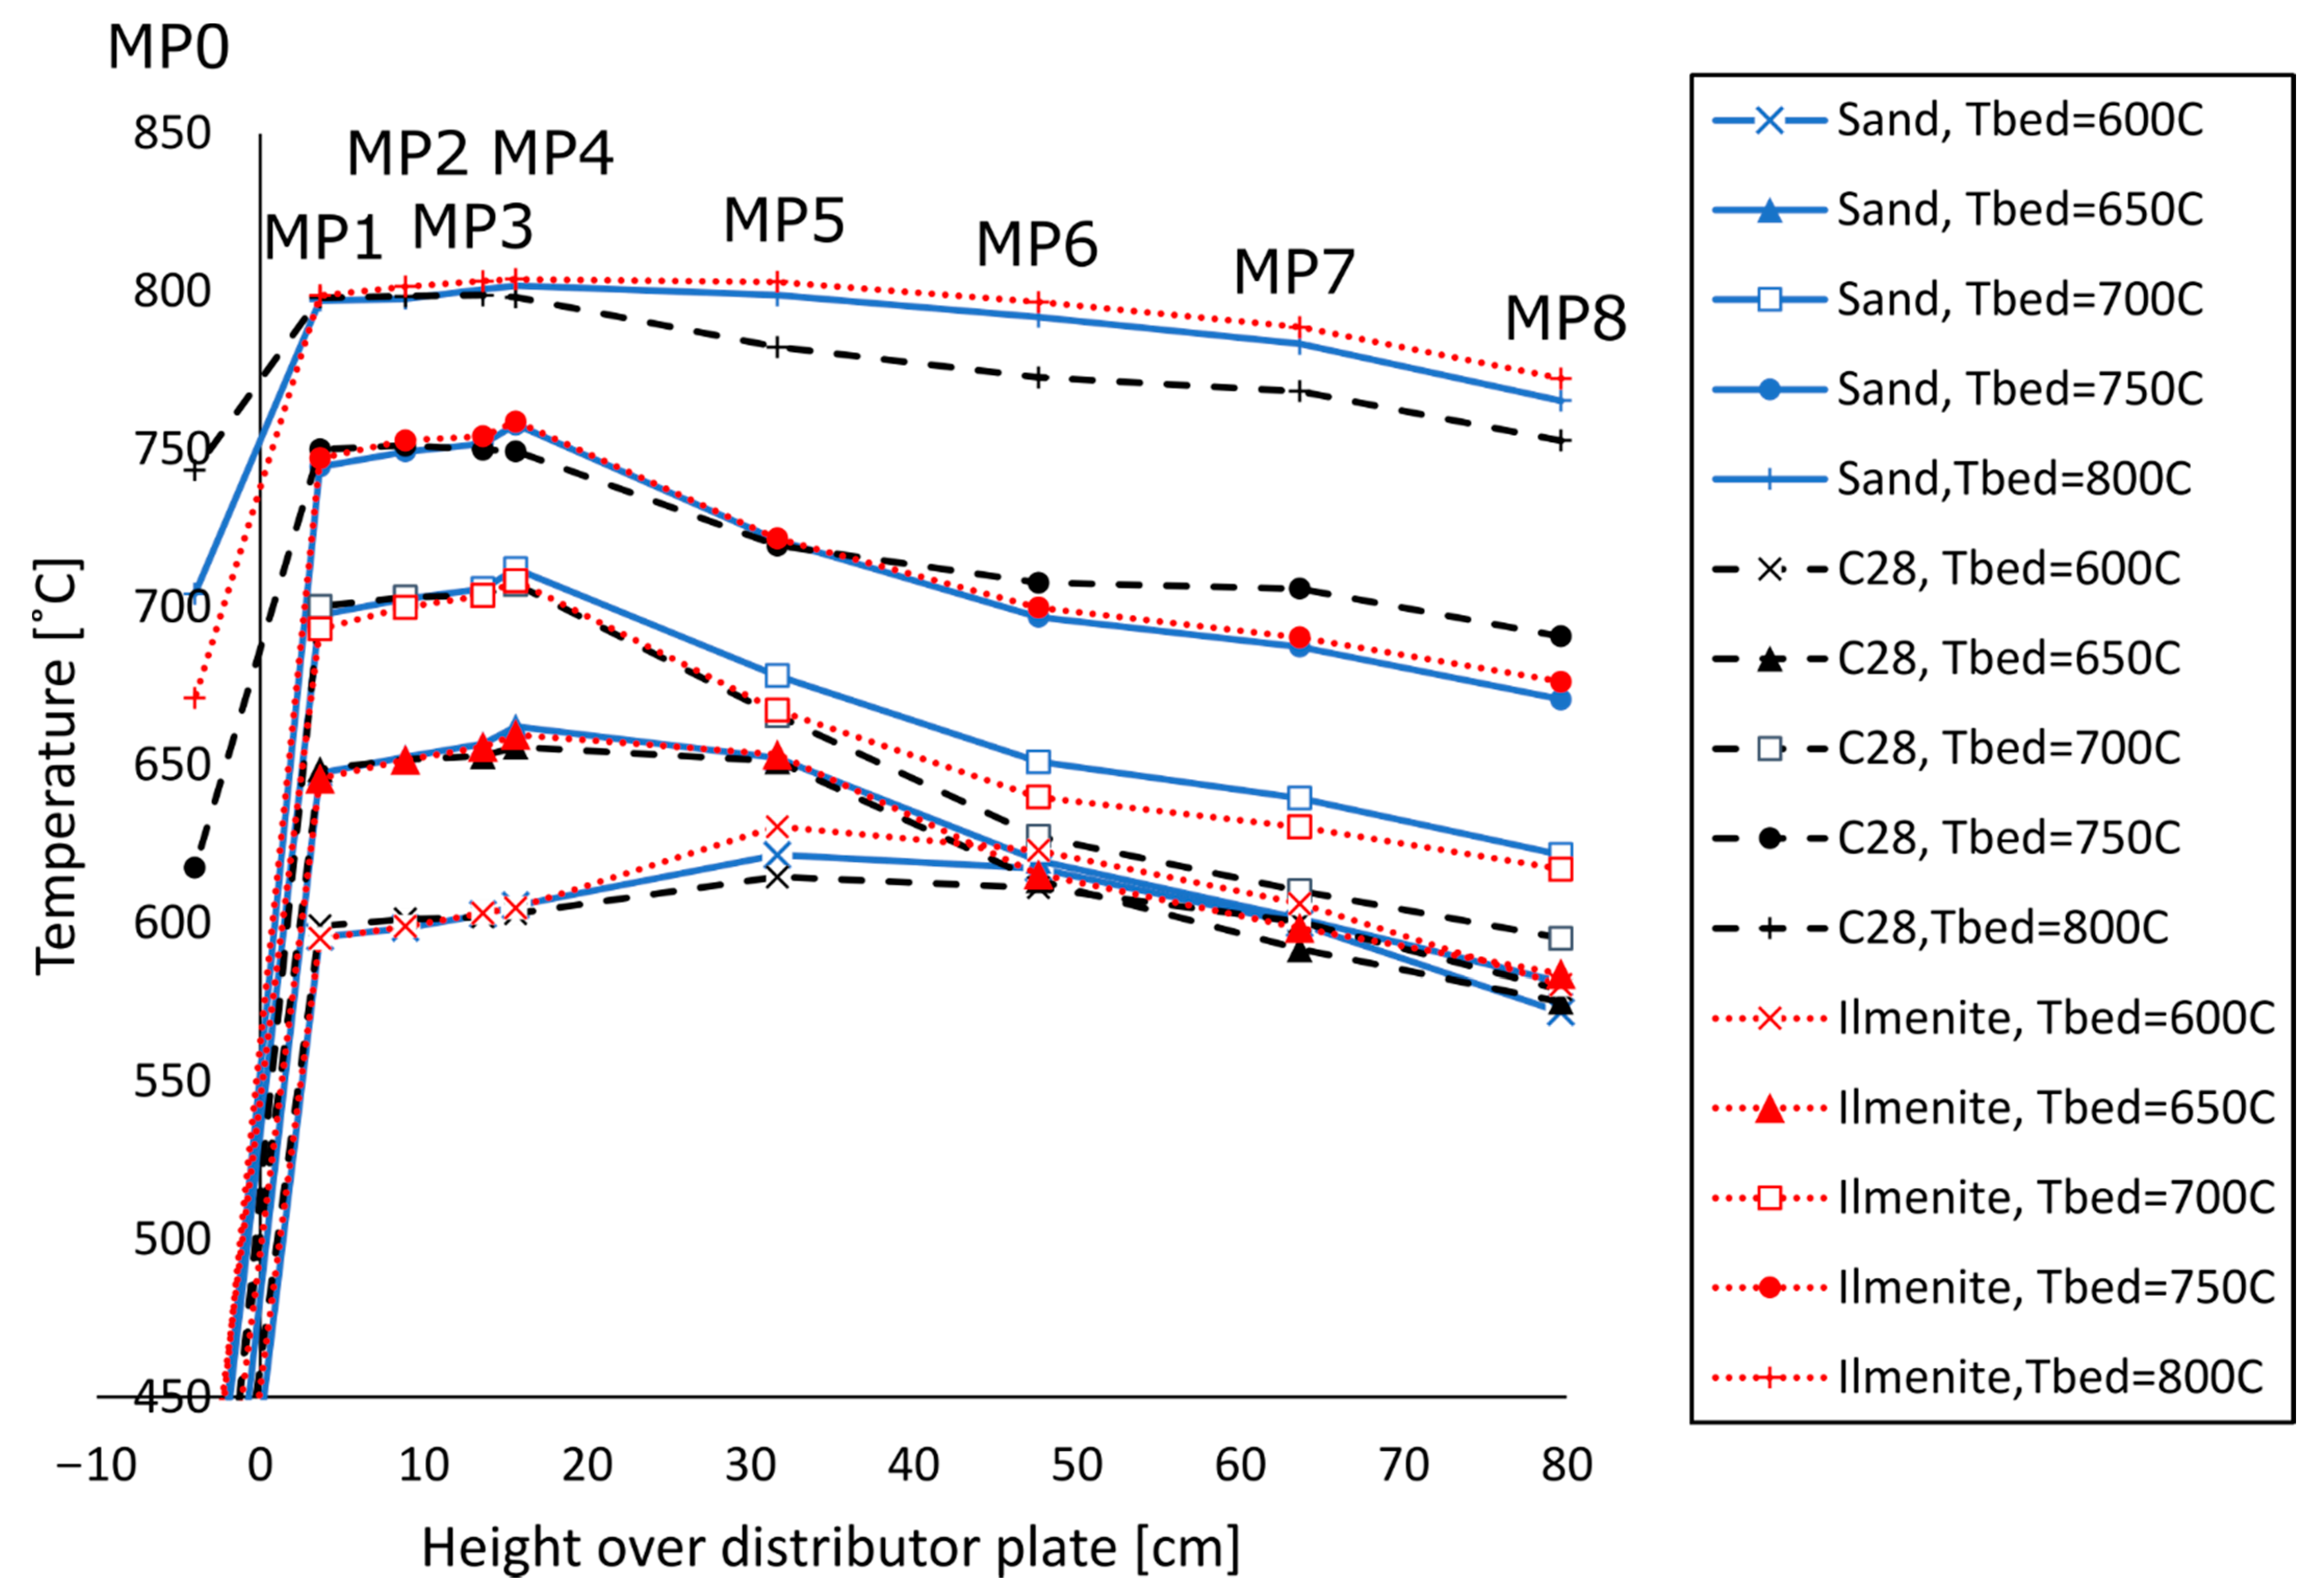
supplementary material. The vertical temperature profiles measured for the systems operated with sand, ilmenite and C28 at different bed temperatures can be seen in 
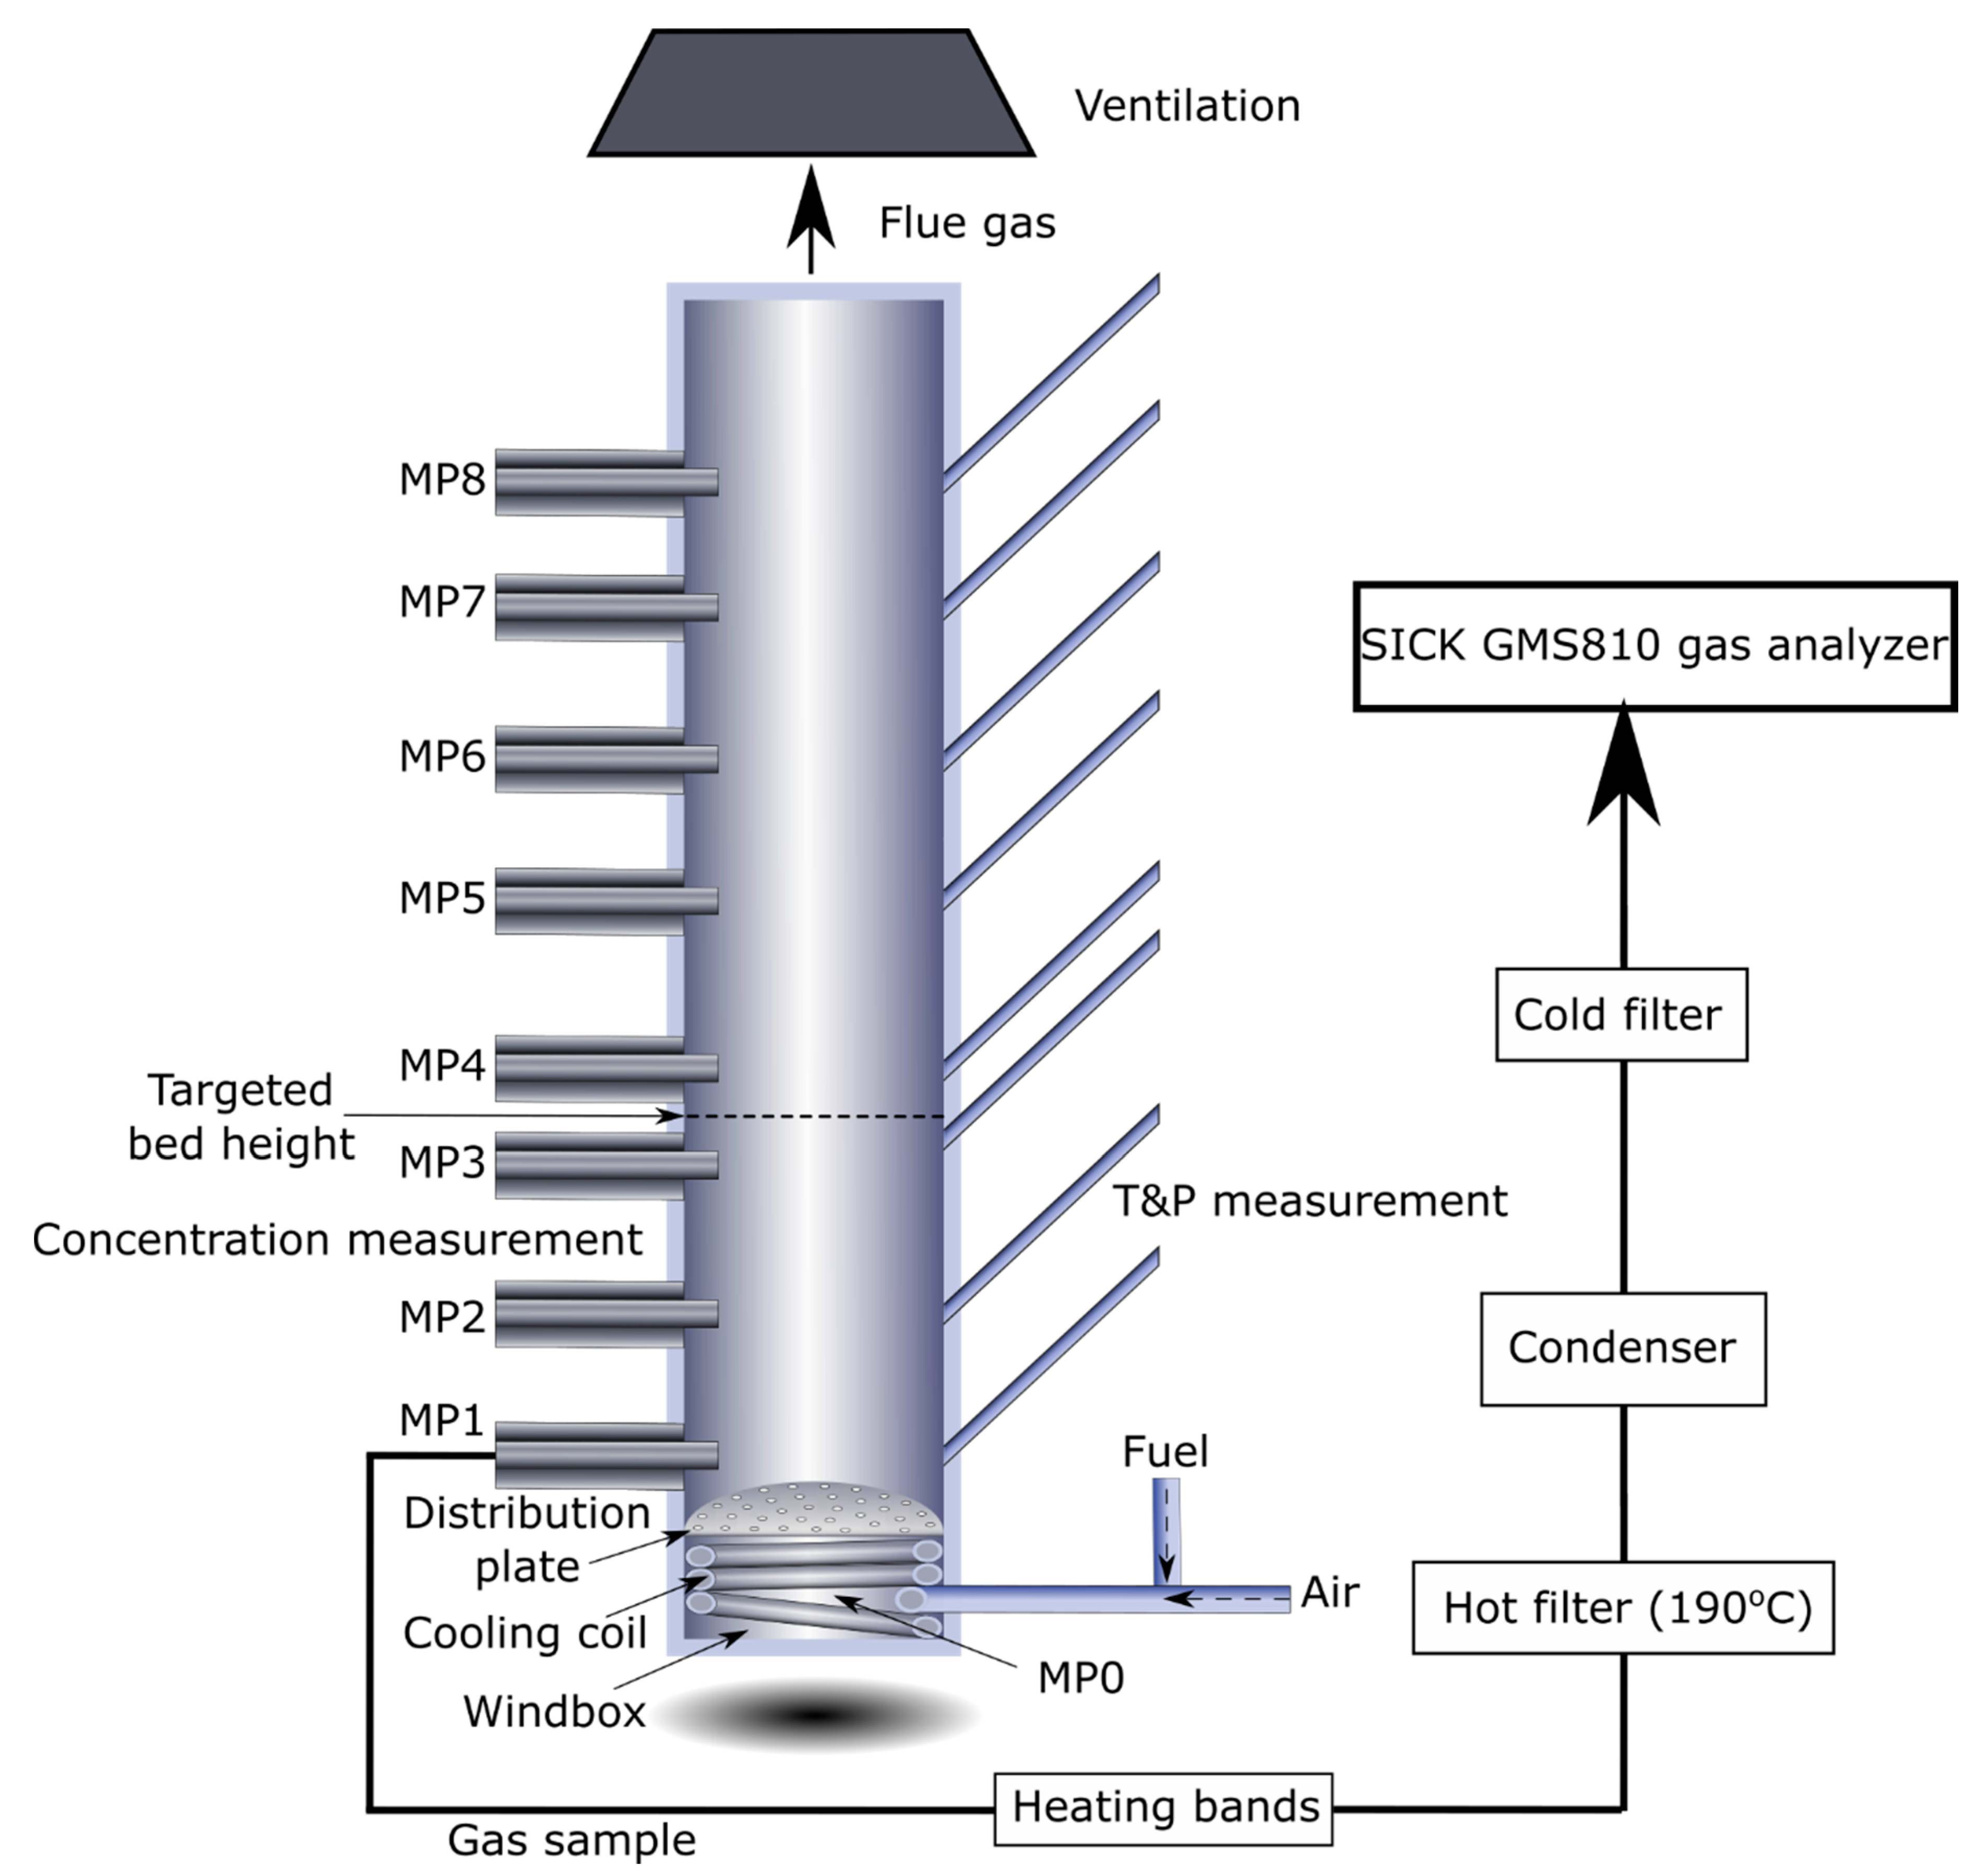
Figure 4. The bed heights were estimated for the three bed materials at all bed temperatures. The average bed height was 15.6 cm for sand, 15.3 cm for ilmenite and 14.6 cm for C28, based on the pressure drop measurements for experiments with methane as fuel. The estimated bed height is, therefore, between measurement points 3 and 4 for all three materials. In all gas concentration measurements with methane as fuel, the methane concentration at the inlet was 9.07%, and the measured concentrations in the reactor are dry since steam is condensed prior to the gas analyser.
In 
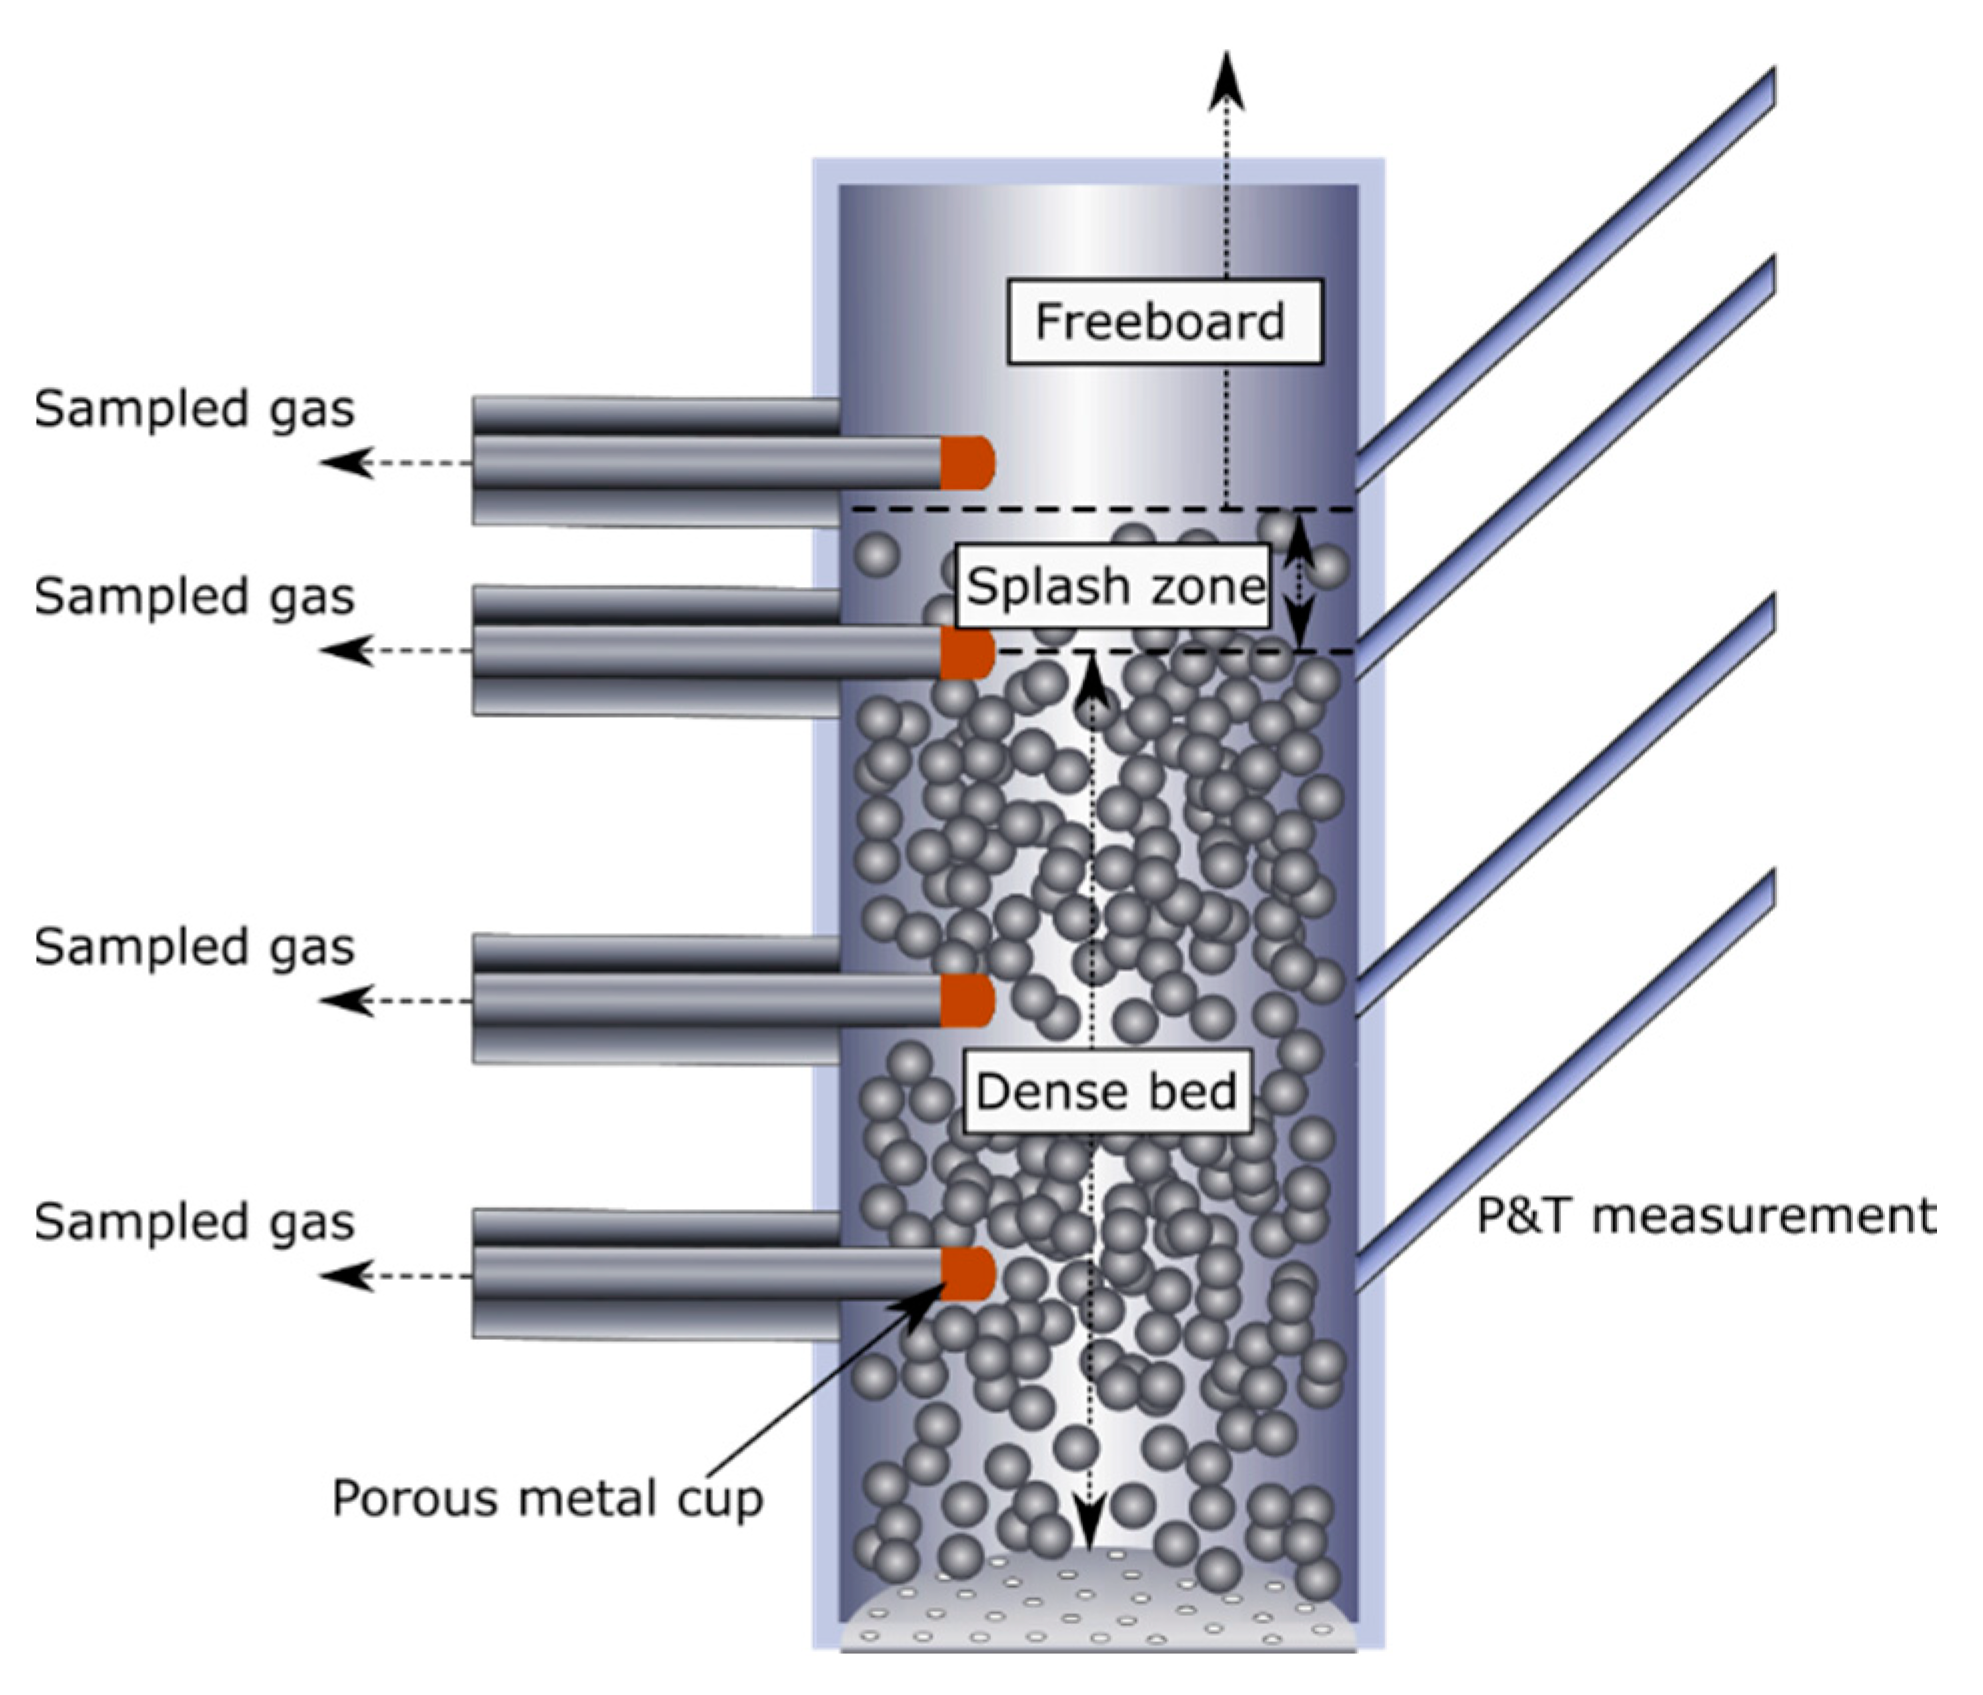
Figure 4, it can firstly be observed that the temperature profile is rather similar for all bed materials for the respective bed temperatures. The gases are rapidly heated upon entering the bed from the wind box below the distribution plate. The temperature is then rather constant in the bed (MP1–MP3) and for the most part also between MP3 and MP4, where the splash zone is considered to be located. The highest temperature is usually found just above the bed (MP4). In the freeboard (MP4–MP8), the temperature level is slowly decreased towards a value which is closer to the setpoint of the electrically heated furnace, which surrounds the reactor. The measured temperatures are overall very similar for the three bed materials although some differences can be observed in the freeboard at 700, 750 and 900 °C.
Since it is expected that increased temperature results from heat release from fuel combustion, it is interesting to observe if such temperature gains can be seen for the three bed materials. It is observed that there are differences in the ΔT between MP4 and MP5 for the three bed materials, which therefore could indicate that there are also differences in fuel conversion in this region for these materials. The temperature in the freeboard drops overall for all tested materials and bed temperatures but the drop is more significant at higher temperatures. The reason for this temperature drop is that the furnace temperature is below the temperature in the reactor where the exothermic reaction heats the inside of the reactor resulting in a heat loss to the surrounding furnace. It should also be mentioned that the operation of the ventilation system above the furnace is expected to cool the top of the freeboard to some extent. A more pronounced temperature drop, therefore, indicates that little or no fuel combustion takes place in this zone. A less pronounced temperature drop could indicate that more methane combustion takes place in the freeboard. Except for the measurements at 900 °C, where sand appears have a smaller temperature drop than the other two bed materials, it is difficult to observe any significant differences between the bed materials. The difficulty to see temperature differences, in general, can be traced to the fact that the convective heat transfer from the gas is lower compared to radiative heat transfer from bed materials and walls. It is also possible that conductive heat transfer from walls to the thermocouples could influence the measurements. This could, therefore, limit the possibility to observe changes in measured temperature based on temperature differences in the gas, especially in the freeboard where the presence of particles is scarce. In order to get a better idea about the differences between the three bed materials, gas concentrations measurements should, therefore, be consulted.
In relation to the gas concentration measurements, it is somewhat uncertain how representative the measured value for the average gas concentration in the bed is. There are two main reasons for this. The first reason for this is related to the nature of fluidized beds, where the gas concentration can be assumed to be different in the emulsion phase and in the bubble phase, at least according to the two-phase theory for fluidization. As a result of the presence of these two theoretically distinguishable phases, it could be expected that the probe manages to sample more gas from the emulsion phase where the gas is flowing upwards with a lower velocity. It is, in this experiment, unknown from which phase the extracted gas originates from (emulsion phase, bubble phase or both) which could have an impact on the measured concentration. It should also be mentioned that the gas velocity is the same for the different bed materials and the particle size is similar. A quick estimation of bubble diameters, bubble velocities and bubble fractions based on equations provided by Kunii and Levenspiel [31] show that only minor differences between the three bed materials can be expected. The same conclusion is drawn when comparing the apparent overall coefficients of gas interchange between bubble and emulsion phases based on the equations presented by Sit and Grace [32]. This indicates that the three cases should have a similar share of extracted gas from bubble and emulsion phase and that the mass transfer between bubble and emulsion phase should be similar. In summary, the results for different bed materials should be useful for comparison.
The second reason is that the measured gas concentration is affected by the depth at which the gas sampling takes place. This was evaluated in separate experiment with sand as bed material where the gas sampling point was varied between one side of the reactor wall to the other. In this experiment it could be observed that less fuel conversion took place in the middle of the tube where a higher CH4 concentration and lower CO2 concentrations was observed, compared to close to the reactor walls where more fuel was converted. This could, for example, be explained by the fact that bubbles are more easily formed in the middle of the bed and gas present in the bubbles has lower residence time in the bed. At 900 °C, the difference in measured CO2 concentration was quite significant at MP3, 6.9% in the middle compared to around 9.6% by the reactor walls. These measurements supported the choice to place the gas sampling location at a point approximately halfway into the middle of the tube, which should provide an estimated gas concentration, which is the most representative overall. It should be said that, at 600 °C, the measured concentrations were already very similar at MP1 and throughout the whole bed. This indicates that the gases were well mixed when entering the bed and a larger concentration difference over the cross section when the in-bed fuel conversion is higher.
The measured concentration should, nevertheless, provide for a good comparison between different cases and it is also observed overall that the measured concentrations align well with the measured values in the freeboard which supports the conclusion that the measured values are reliable.
A first observation, which can be seen in 
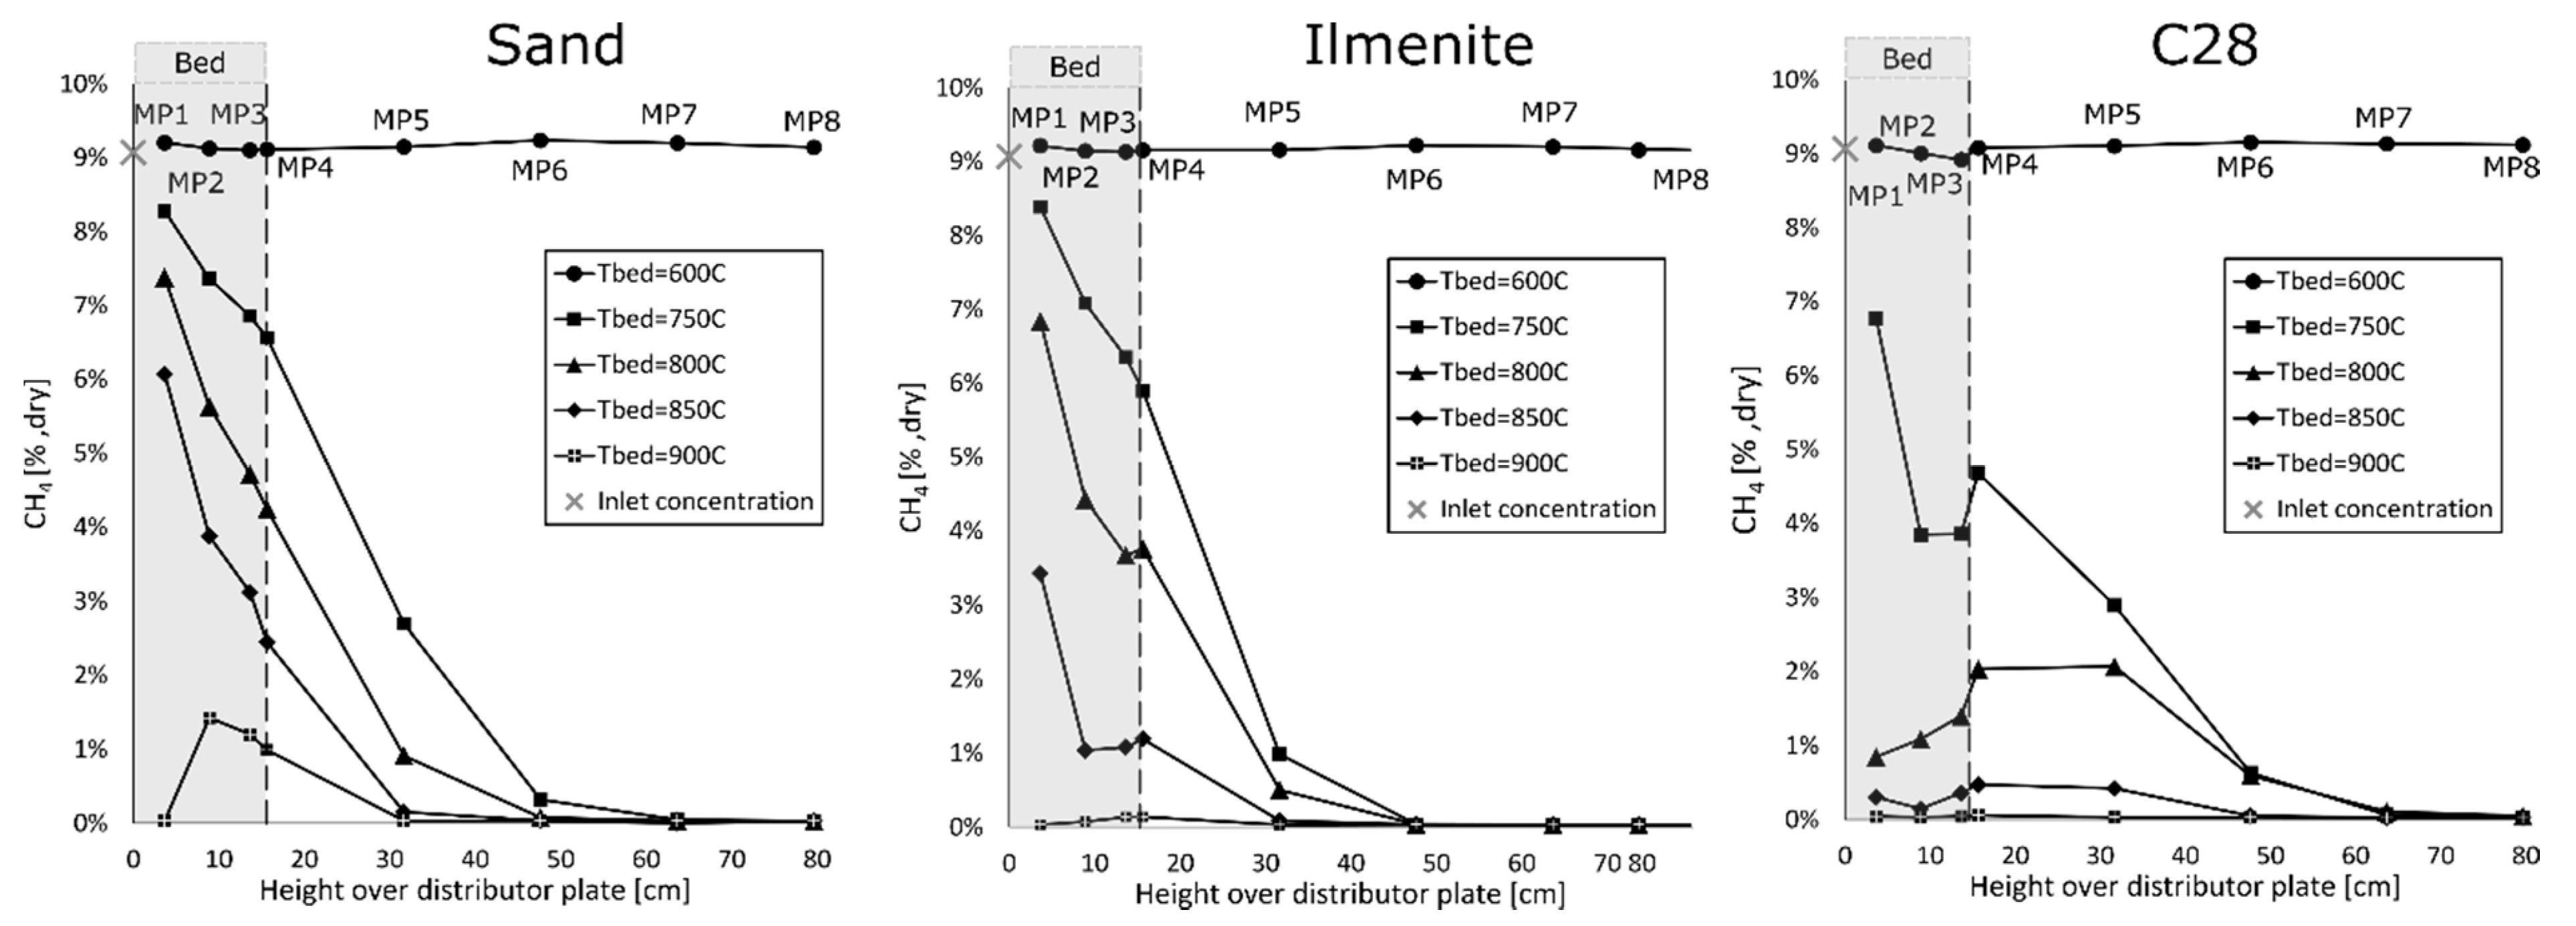
Figure 5, is that the methane concentration in the bed decreases with increasing bed temperature, thus displaying that more combustion of methane takes place in the lower part of the reactor at higher bed temperatures. This is expected since methane combustion is promoted by a higher temperature in general and, therefore, there is less unreacted methane in the freeboard. This results in a temperature drop in the freeboard when little or no unreacted methane is left in the flue gas (see Figure 4) and heat is instead transferred from the reactor towards the inside of the furnace, which was approximately 50–100 °C cooler than the targeted bed temperature.
At a bed temperature of 600 °C, there is almost no methane conversion taking place in any of the systems. When the bed temperature was increased further, ignition of the fuel took place in the lower part of the freeboard with a visible flame and audible sound, which occurred around 700 °C for all bed materials. At a bed temperature of 750 °C, a significant part of the methane appears to be burnt between MP4 and MP5, which is the lower part of the freeboard, which is in line with the observations in the temperature profile in Figure 4, where the temperature was more constant at 750 °C between MP4 and MP5 compared to higher bed temperatures. At higher bed temperatures, a clearer decrease in temperature was observed between these two measurement points. This could be due to almost no remaining unreacted methane being detected in the freeboard at bed temperatures > 750 °C, resulting in a flue gas with mostly inert compounds at MP6 or higher up in the freeboard. It can be noted that it was difficult to keep the wind box temperature below 500 °C in some cases and especially with ilmenite as a bed material. Based on the measured gas concentrations, it is, however, clear that ignition did not take place in the wind box.
In the experiments with C28 as bed material, it can be observed that the measured methane concentration is lower in the lower part of the bed (MP1-MP3) compared to just above the bed at MP4 and the measured concentration is almost the same at MP5 at a bed temperature of 800–850 °C. Some indications of similar character can be observed with ilmenite at a bed temperature of 800–850 °C. This does not occur with sand as the bed material, where the methane concentration is gradually reduced along the height of the reactor. This might seem surprising at first, but this is most likely explained by the gas–solid reactions with the oxygen carrier. As described earlier, it is probable that gas from the emulsion phase is sampled compared to gas in the bubble phase. In the systems with oxygen carrier materials, gas–solid reactions are likely to occur in the emulsion phase, where gas–solid contact is better. It could, therefore, be possible to obtain a higher methane conversion in the emulsion phase if the oxygen carrier has a high reactivity with the fuel gas (such as, for example, C28). At the top of the bed the gas from emulsion phase and bubble phase is mixed and the sampled gas in the freeboard can be expected to contain more equal quantities of gas from bubble and emulsion phase. This could, therefore, explain the increased methane concentration with the oxygen carriers at MP4-MP5, where gas from the bubble phase is expected to have a higher methane concentration. The increase in methane concentration is a result of the amount of gas in the bubble/emulsion phase and the gas conversion in each phase. Nevertheless, the results support the hypothesis that the gas–solid reaction takes place in the emulsion phase, which takes place to an especially high extent with C28 as the bed material.
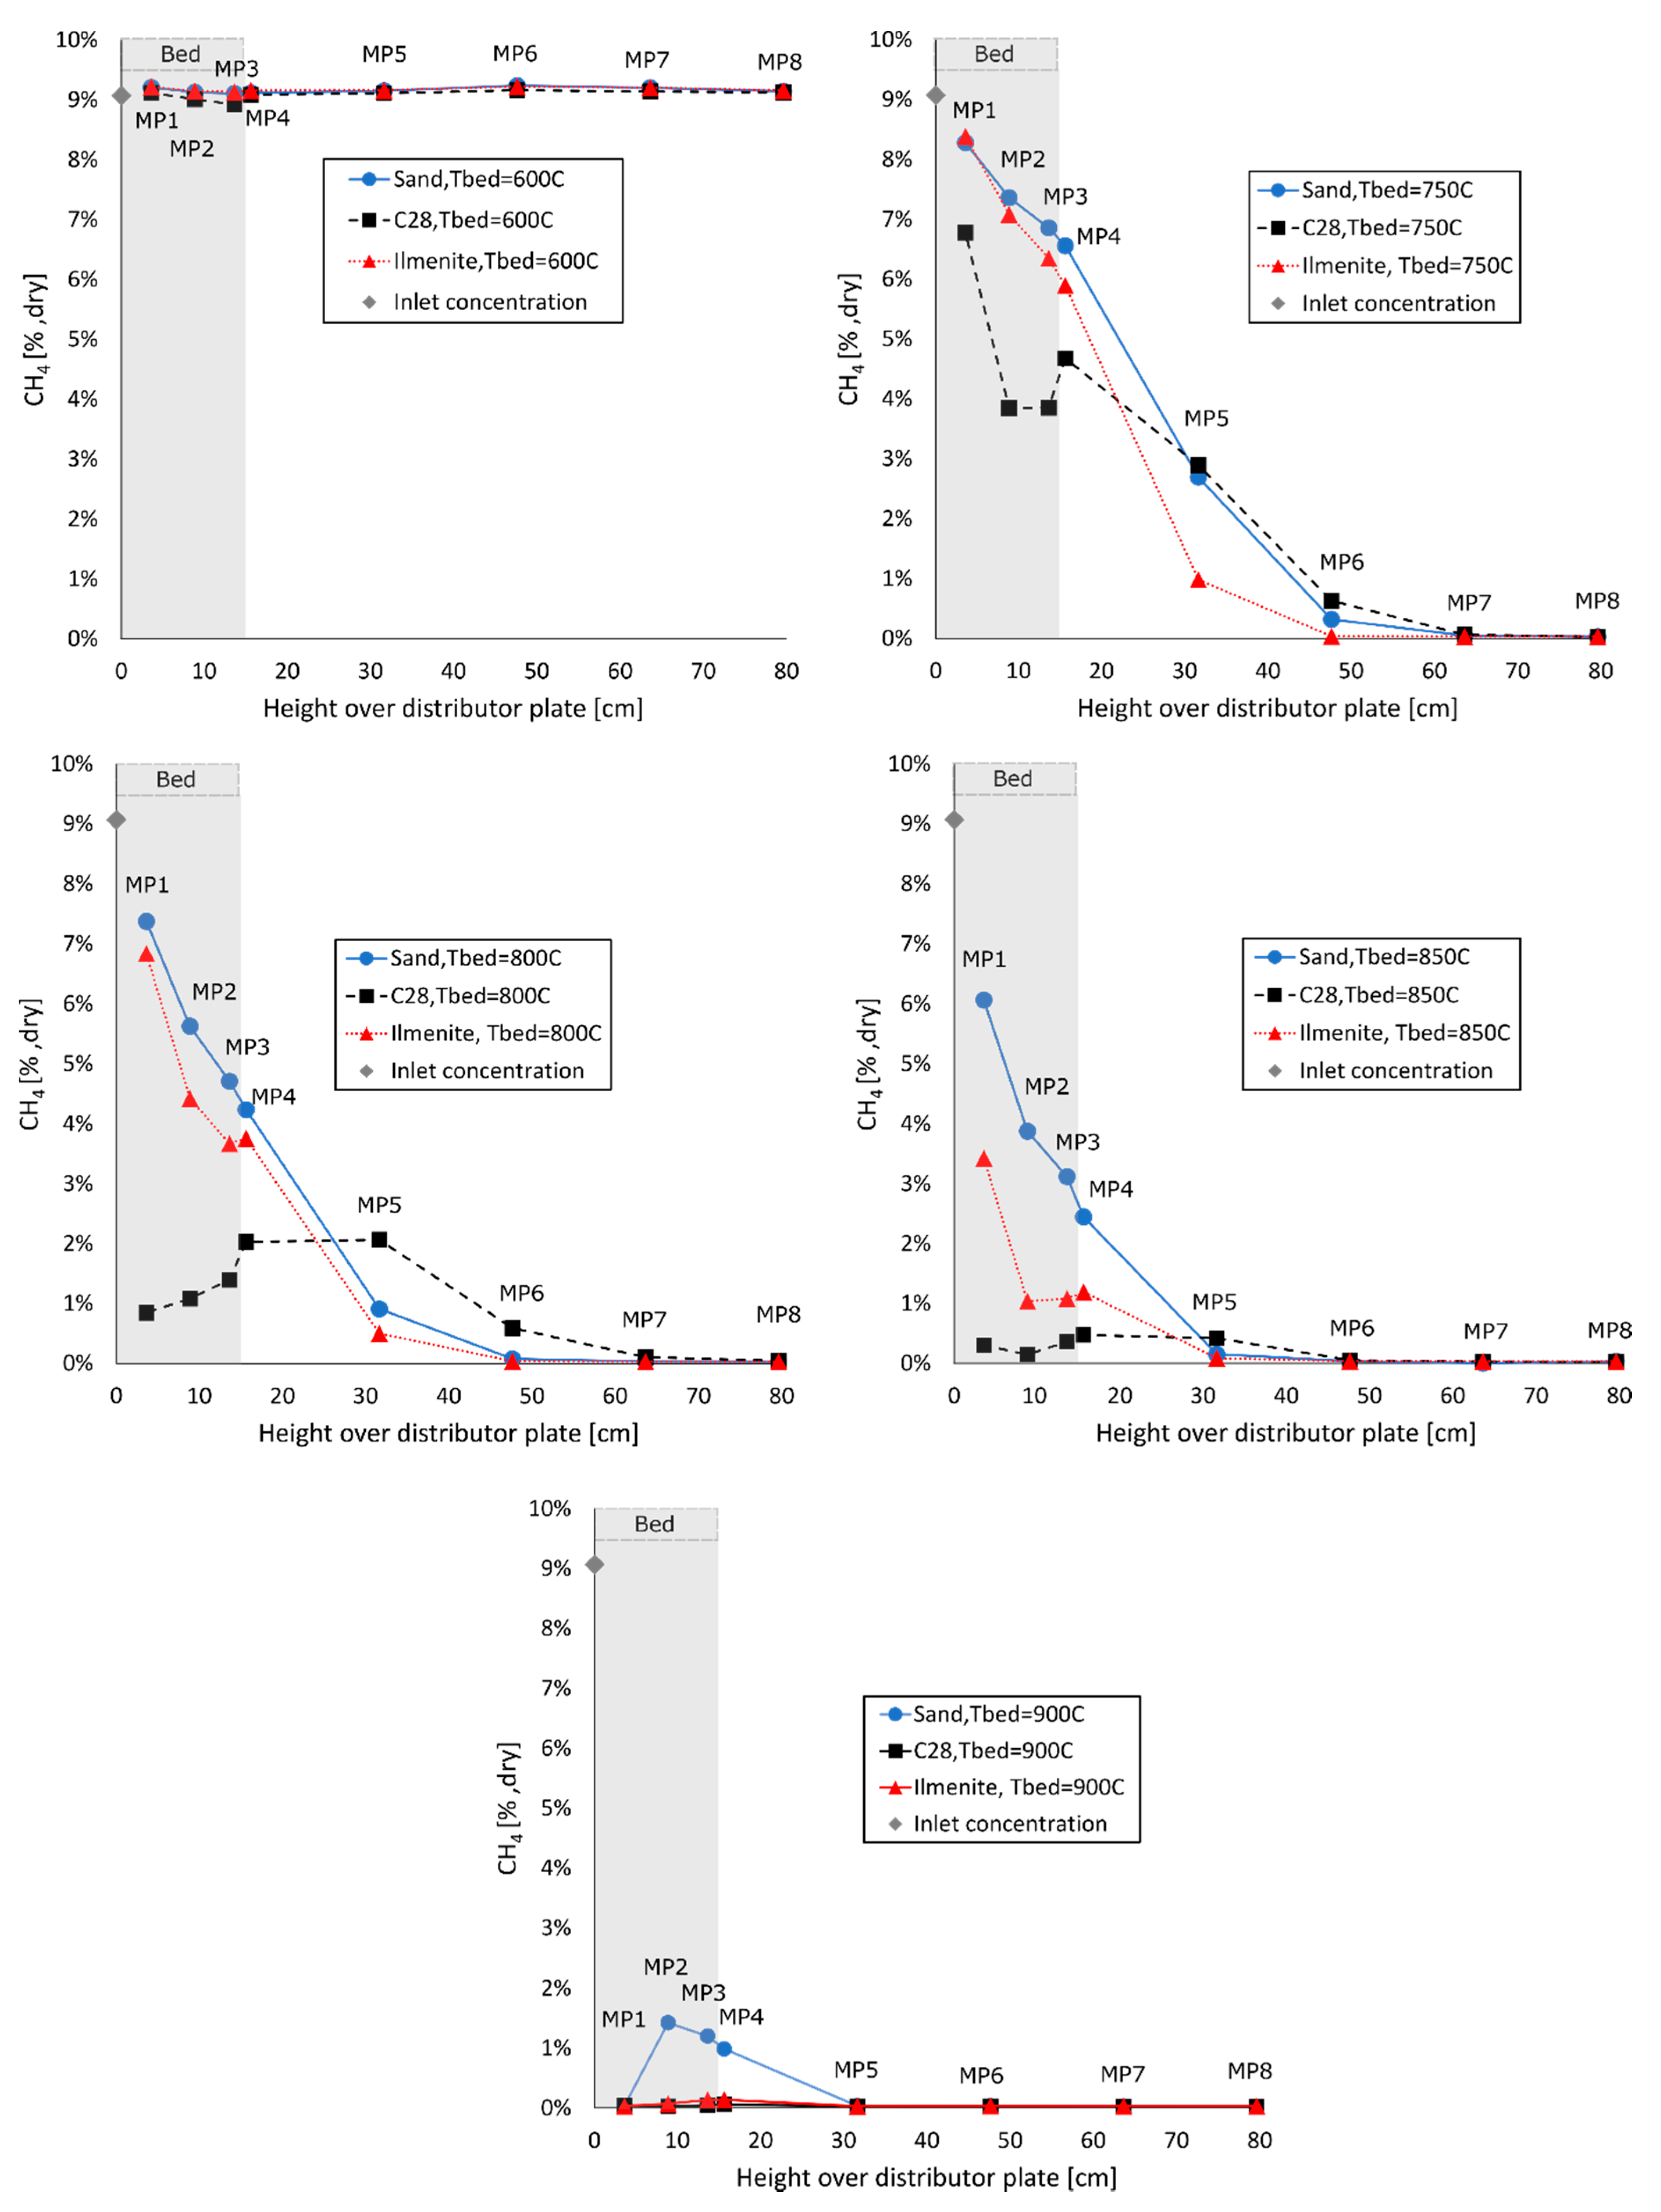
In order to simplify a comparison between the different bed materials, Figure 6 can be consulted, where the results for all bed materials are added together at the respective bed temperatures. At 600 °C, it can be observed in Figure 6 that the difference between the three materials is small, where little/no methane conversion is observed. At all other bed temperatures (750–900 °C), however, it can be observed that the methane concentration is overall lower in the bed, using ilmenite and C28 as bed materials, compared to the results with sand. The reason for this difference in gas conversion can be explained by the gas–solid reaction with the oxygen carrier, which only occurs in the system with ilmenite and C28. This reaction can, therefore, be considered as especially important to obtain a high methane conversion in the bed. It should be mentioned that the reaction with the bed material itself is endothermic but the reoxidation is exothermic, so the net heat release corresponds to the heat of combustion for methane. It should be mentioned that limitations in mass transport between the bubble and emulsion phase can have a significant impact on the comparison between sand and the oxygen carriers. In the extreme case that the mass transfer from the bubbles to the emulsion phase would be very poor, and if there are no bed particles present in the bubbles, the contact between fuel and bed material would be negligible. This would have resulted in identical fuel conversion for different kinds of bed material. It can be observed that this is not the case here. It is likely that gas–solid reactions occur in the emulsion phase, between fuel and oxygen carrier. Gas–solid reactions could, however, also take place as a result of particles present in the bubbles. It should also be noted that the degree of mixing in the fluidized bed, where the experiments take place, can affect the experimental results. Since the mixing of the fluidized bed can vary between different reactors, it is important to keep this in mind when evaluating the difference between different bed materials.
It is possible to estimate the degree of methane conversion based on the CH4 inlet concentration, the measured concentration of CH4 and the fact that 2 mol of steam is produced per mol CH4 according to Equation (8). At the highest tested bed temperature (900 °C), for example, the methane conversion is almost complete in the bed with C28 and ilmenite (corresponding to 99.7% and 99.3% methane conversion at MP2, respectively), whereas the measured methane conversion (based on the measured CH4 concentration) with sand was equal to 86.7%.
The trend is the same at 850 °C at the same measurement point, where the methane conversion was 98.7% for C28, 90.4% ilmenite and 61.7% for sand. This displays that almost 100% oxidation of the methane can be achieved in the bed in the presence of an oxygen carrier, which cannot be said when using sand, where a significant part of the combustion of methane takes place above the bed at these bed temperatures.
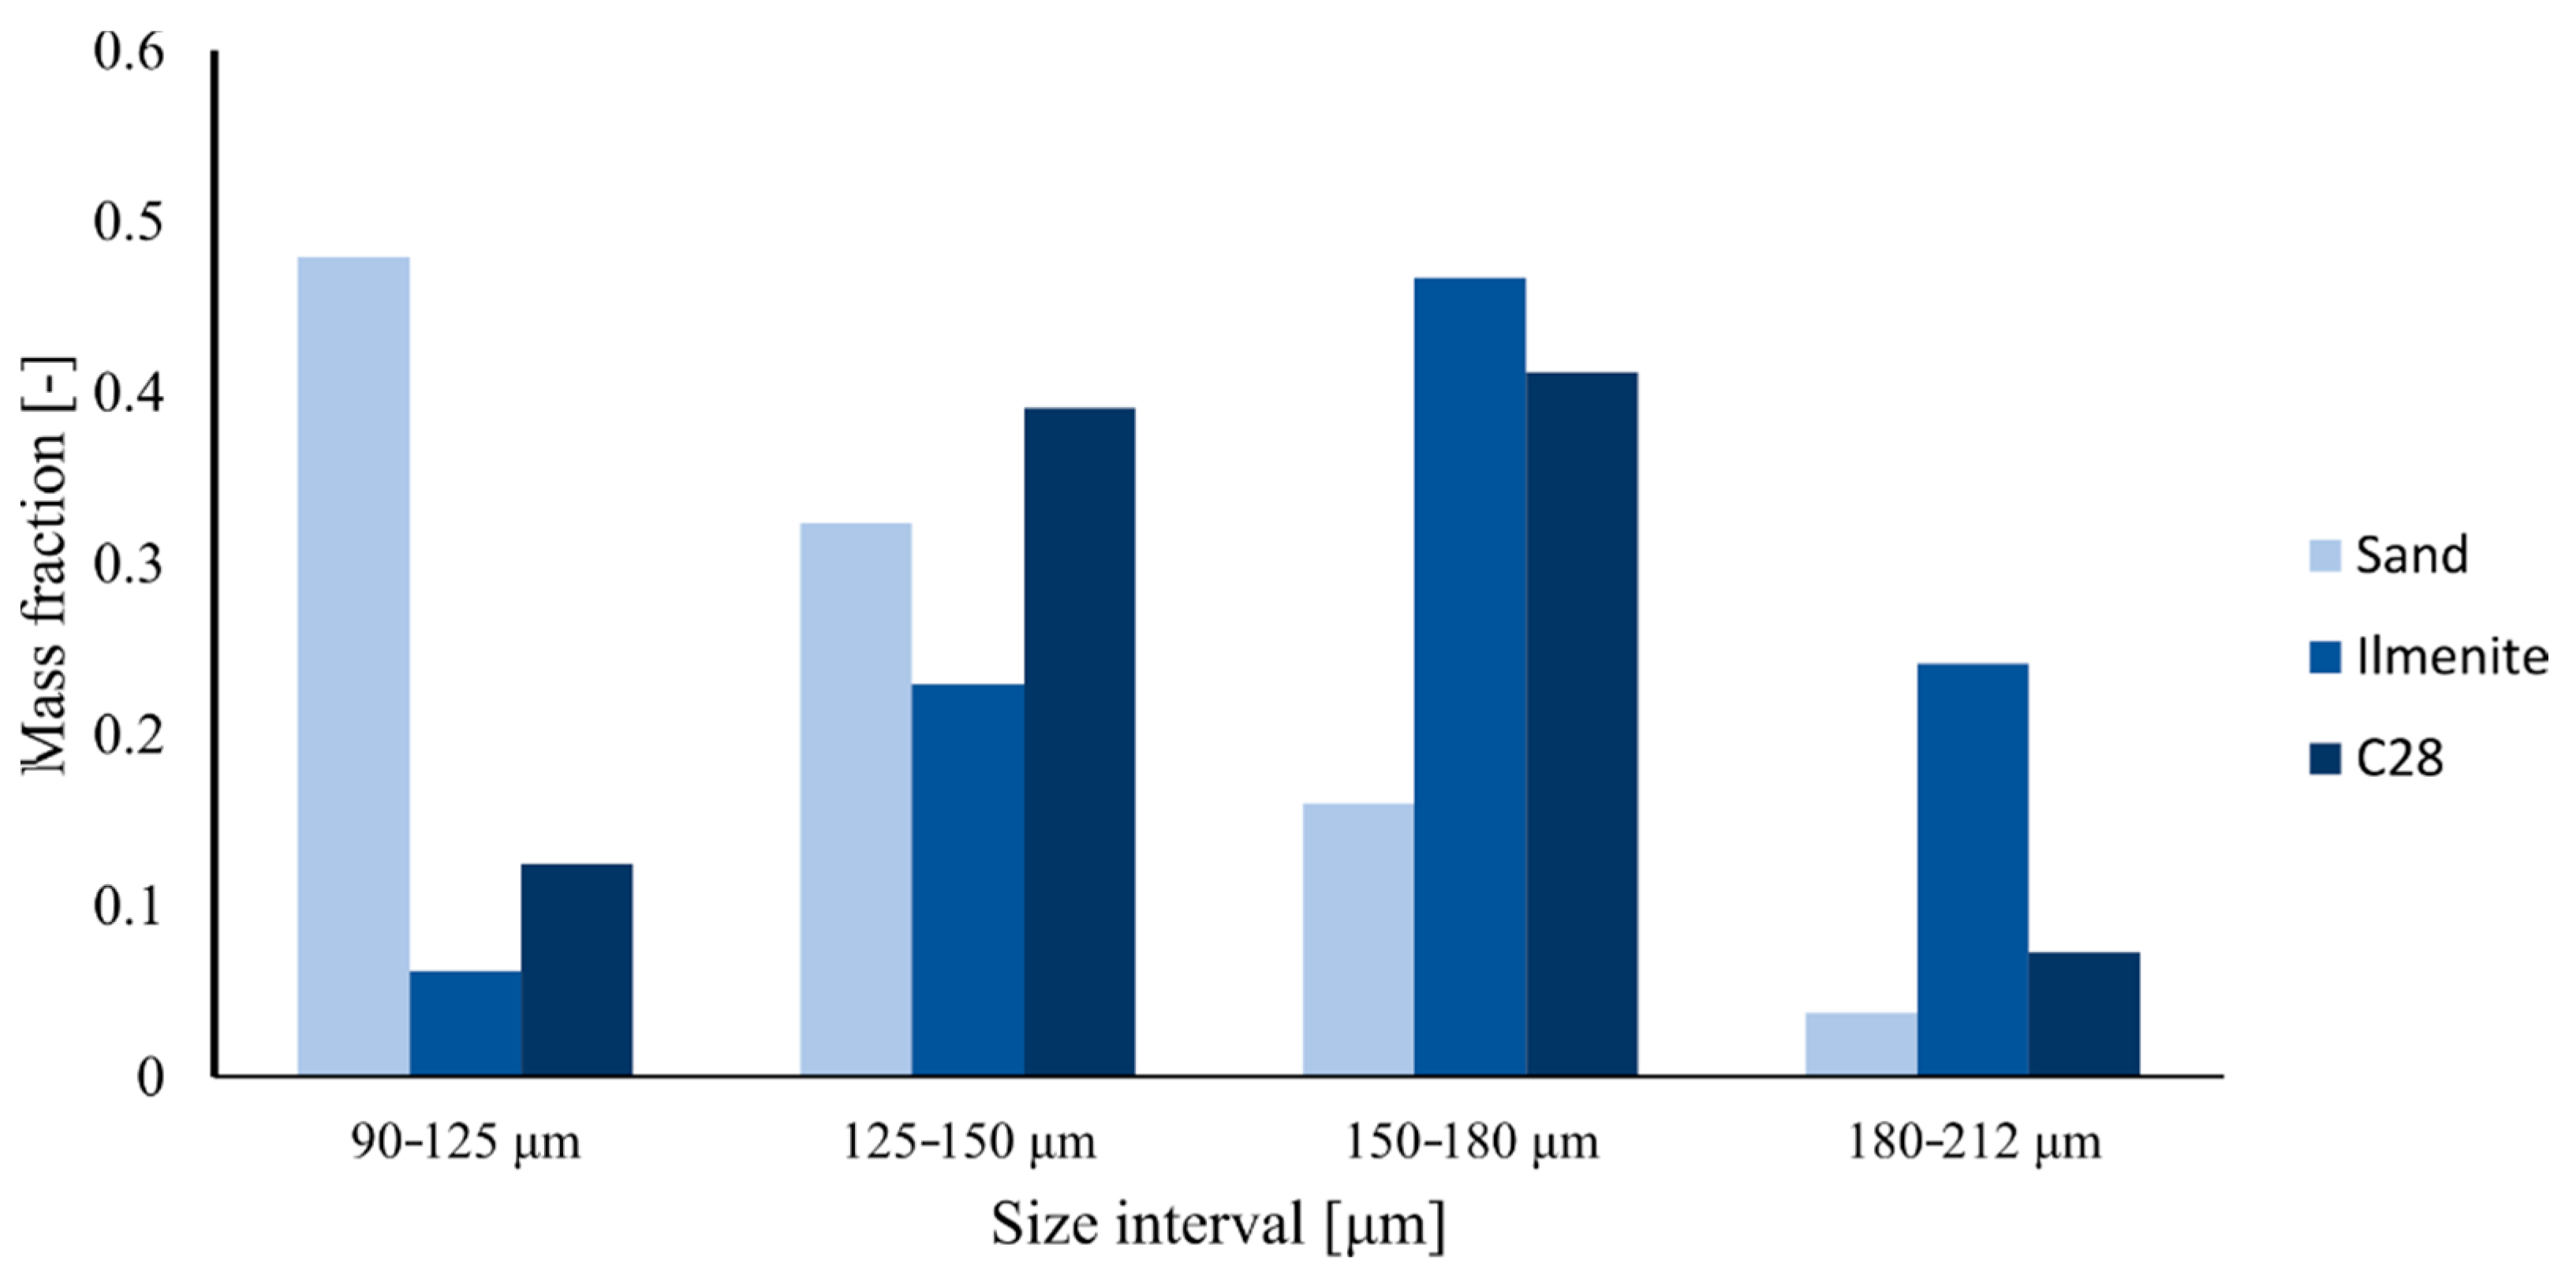
In the comparison between the bed materials, it should be mentioned that different bed masses are used which could have an influence on the result, where a larger specific bed inventory (see Table 3) could potentially result in a higher degree of fuel conversion. It is not possible to evaluate the effect of this in this experiment, but it should be mentioned that operation with C28 results in higher fuel conversion than ilmenite, but with a smaller specific bed inventory compared to ilmenite. Regarding the bed inventory, it should also be added that the pressure is overall higher in the bed and in the wind box in the system with ilmenite since the bed density is higher. This could cause more significant fluctuations in pressure where bursts of larger bubbles could pass through the bed.
In order to confirm that the converted methane is fully oxidized to CO2, and not converted to CO, the measured concentrations of CO2 and CO can be consulted. The measured CO2 concentrations confirm that changes in the CH4 concentration results in the opposite direction for the CO2 concentration. In cases where methane is completely converted, the concentration of CO2 is equal to the inlet concentration of CH4 at the inlet when taking into account the condensed steam, which does not reach the gas analyser. In the comparison between C28 and sand, it can, for example, be observed that the CO2 concentration is higher in the bed for all the measurement points in the bed temperature interval 750–900 °C. To summarize, it can be clearly be seen that more fuel conversion takes place in the bed with the two oxygen carrier materials compared to sand.
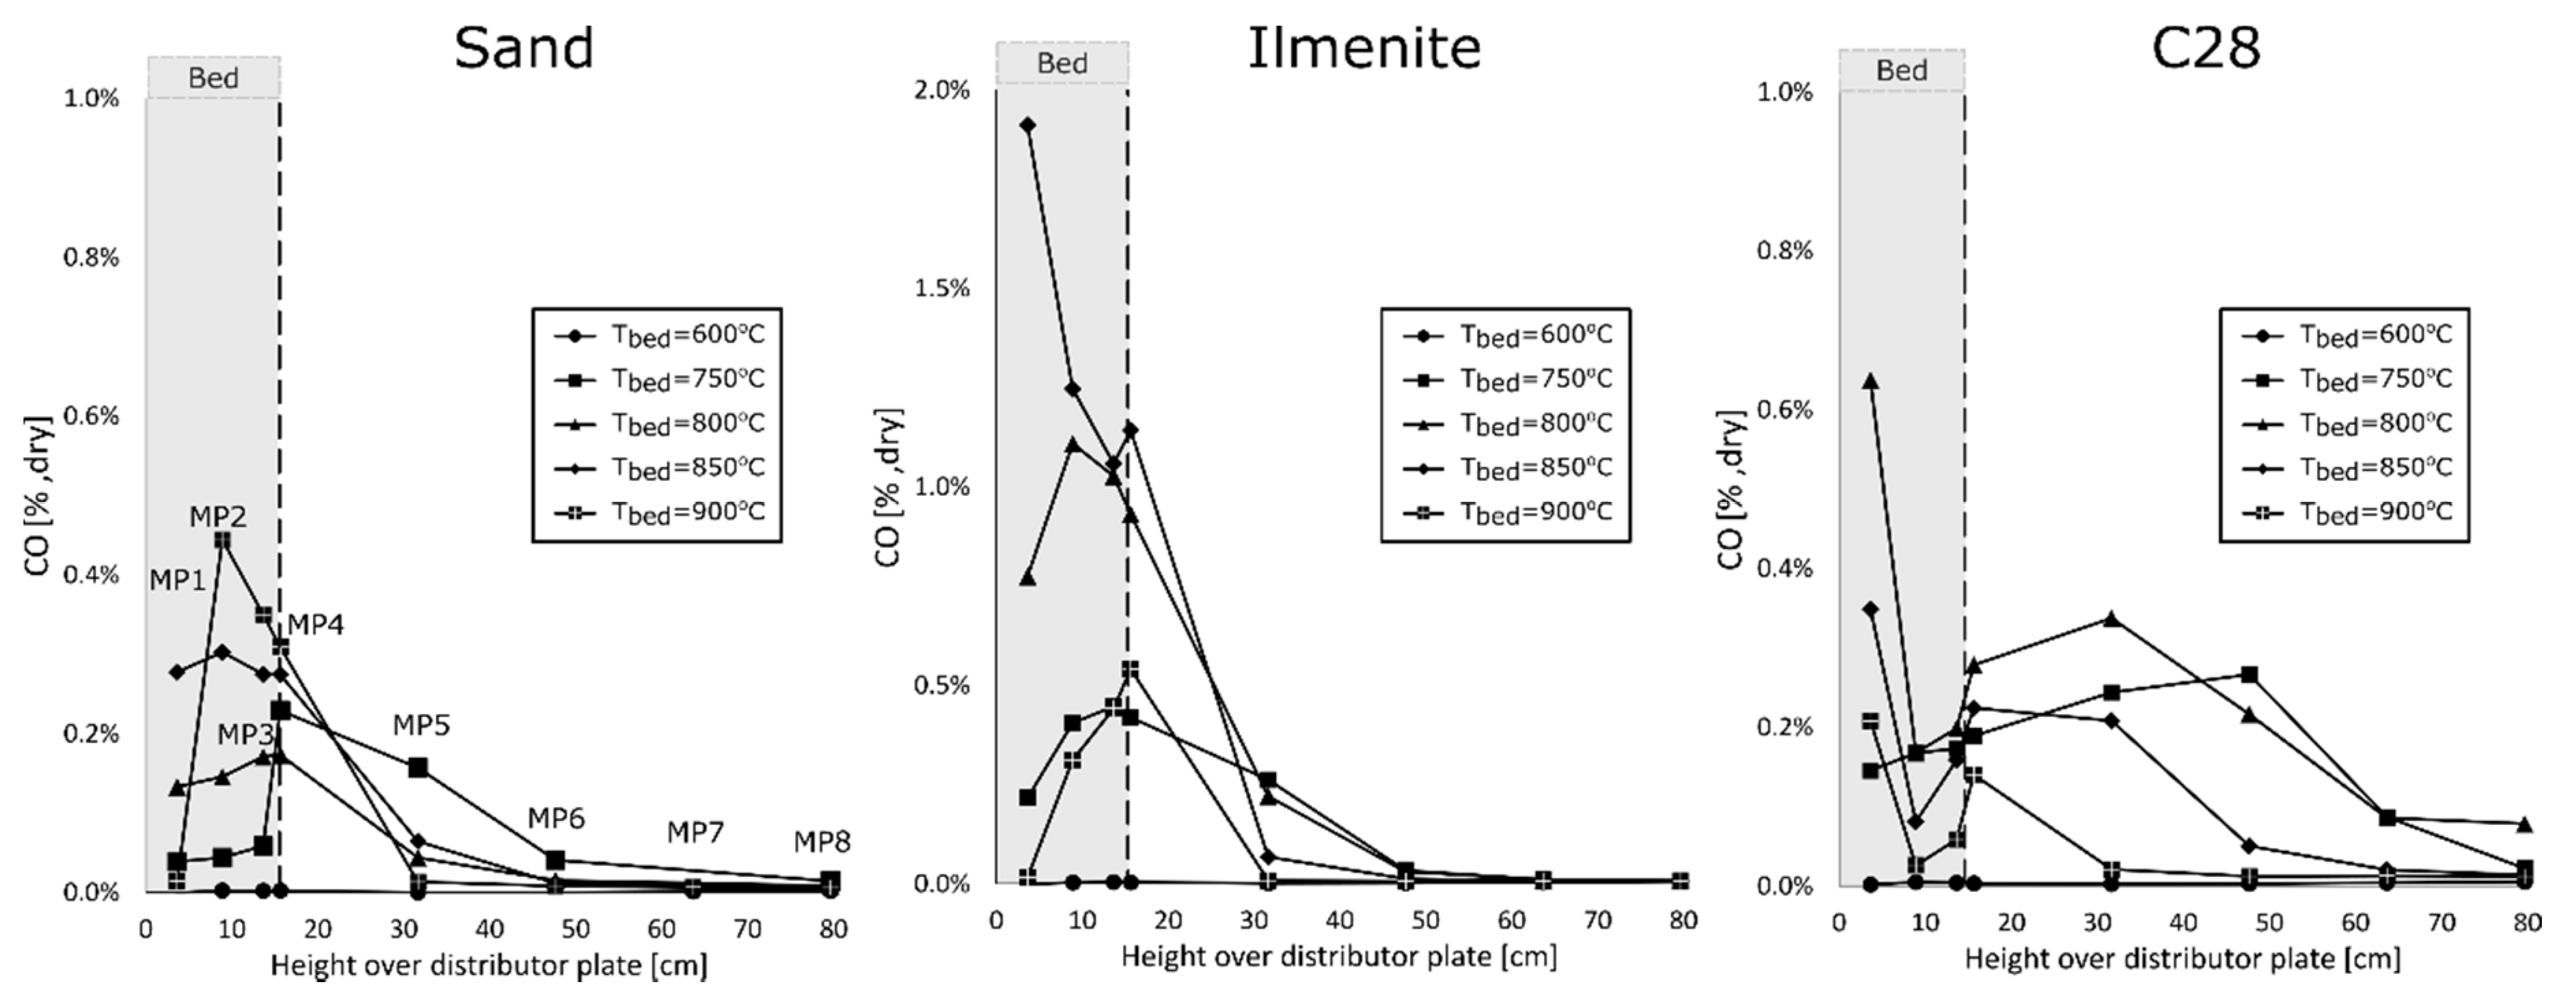
Some of the differences in methane conversion and CO2 formation can be explained by the CO concentration measurements (see Figure 7). It can be observed that the CO concentration in the bed is overall highest in the system with ilmenite as a bed material. The concentration of CO is overall low in the freeboard, especially with sand and ilmenite. In the bed with C28, the CO concentration is generally the lowest in the bed but the highest above the bed. It is apparent that some of the CH4 is converted to CO in the bed but that most of it is then converted to CO2 in the lower part of the freeboard. The CO formation is generally small for all bed materials at high temperature, which aligns well with the previous observations. It should also be mentioned that the measured H2 concentrations are overall low and have been neglected in this analysis.
In addition, the dependency on the air-to-fuel ratio was investigated where the ratio was varied between 1 to 1.2 for the three bed materials at 750 °C. The results are presented in Table 5. It can be observed that the air-to-fuel ratio had a limited impact on the conversion of methane in the bed in general for the three bed materials although some improvement in fuel conversion is observed when increasing the AFR. It can also be seen that the same trend with a lower methane concentration with ilmenite and C28 as a bed material compared to sand is observed at each measurement point for other air-to-fuel ratios within the tested interval with the exception of MP1, where the methane concentration was slightly lower with sand as a bed material compared to using ilmenite. It should be noted that the choice of bed temperature for the variation in the AFR could influence the results since the difference in fuel conversion between sand and the two oxygen carriers is observed to be more pronounced at higher bed temperatures.
It should be mentioned that the system with sand has a higher methane conversion in the freeboard than the system with C28. The results for sand and C28 presented in Table 4 show that the methane concentration is higher with C28 as bed material at MP5 even though more methane conversion takes place in the bed (see MP4). The same trend is observed when looking at the methane concentration at bed temperatures 800–850 °C.
This could potentially be caused by the fact that the concentration of the methane is lower in that region, which results in it being more difficult to have the fuel ignition taking place in the gas phase, compared to the system with sand, where the gas mixture is closer to stoichiometric conditions.
In addition to the results related to fuel conversion, the NO emissions were estimated, and the results are presented in Table 6. NO emissions from the process are based on the measured concentration of NO in the dry flue gas. Some NO2 is also likely present albeit in smaller concentration, typically NO2 is less than 5% of the total NOx [33] meaning that the NO concentration should be close to the NOx concentration in the furnace and at the flue gas stack. The data for MP7 with sand as a bed material at 850 °C are missing.
It can be observed that the measured concentrations of NO are overall low, especially at high temperature. It can also be observed that almost no NO at all is detected in the bed. It may seem contradictory at first that more NO is formed at a lower temperature, since the formation of thermal NOx is expected to be the dominating mechanism for NO formation, since no nitrogen is present in the fuel and no prompt NO can be expected to be formed in this oxygen-rich atmosphere. The tendency for higher NO formation at moderate temperatures could, however, be explained by knowing where in the bed, as well as how, the fuel conversion takes place. The highest NO concentrations are measured above the bed in the cases where a significant part of the methane fuel conversion takes place above the sand bed, i.e., at a bed temperature of 750 °C. This was also the temperature level where flames were most visible and the most audible and visible explosions took place above the bed, as observed from the top of the reactor. Fuel-NOx formation can be excluded as the fuel does not contain any nitrogen compounds, and since the system operates with excess oxygen, any significant prompt NOx formation is unlikely. However, the NO formation can be explained by local hotspots from uncontrolled flame combustion in the freeboard where the thermal inertia is low. Considering the composition of the gas mixture, a very significant increase in gas temperature is expected as the gas ignites. Since thermal NOx formation increases exponentially with temperature, the flame temperature should be controlled. In the bed, where the heat transfer between gas and solids, as well as the thermal inertia, is high, no hotspots are expected and NO formation is not expected, which is confirmed by low NO concentration in that zone for all bed materials regardless of the amount of fuel conversion in the bed. However, high fuel conversion in the bed gives less NO formation in the freeboard and, thus, lower overall emissions, which is also seen by the performed measurements.
The measured freeboard gas temperature is close to the temperature of the bed and, thus, is clearly lower than the temperature at which thermal NO formation takes place, according to the Zeldovich mechanism, where local temperatures of at least 1300 °C are required [34]. The dominating heat transfer mechanism to the thermocouple is radiation from reactor walls and the bed material, as well as direct heat transfer from the walls. With the short path lengths, the emissivity of gas radiation should be less than 0.05, and convection heat transfer from gas is also small. This would mean that local high gas temperatures are poorly visible in the measurement. Thus, the absence of a rise in temperature from MP4 to MP5 in Figure 4, despite significant fuel conversion taking place—Figure 5—could be explained by a combination of falling wall temperatures and poor heat transfer from the gas.
It should also be added that there is a difference between flames produced in a fluidized bed and flame combustion with a gas burner for example. There is no sustained flame in the fluidized bed and local measurements cannot be made to characterize the flame and determine local temperatures and gas compositions, but the work must rely on global measurements.
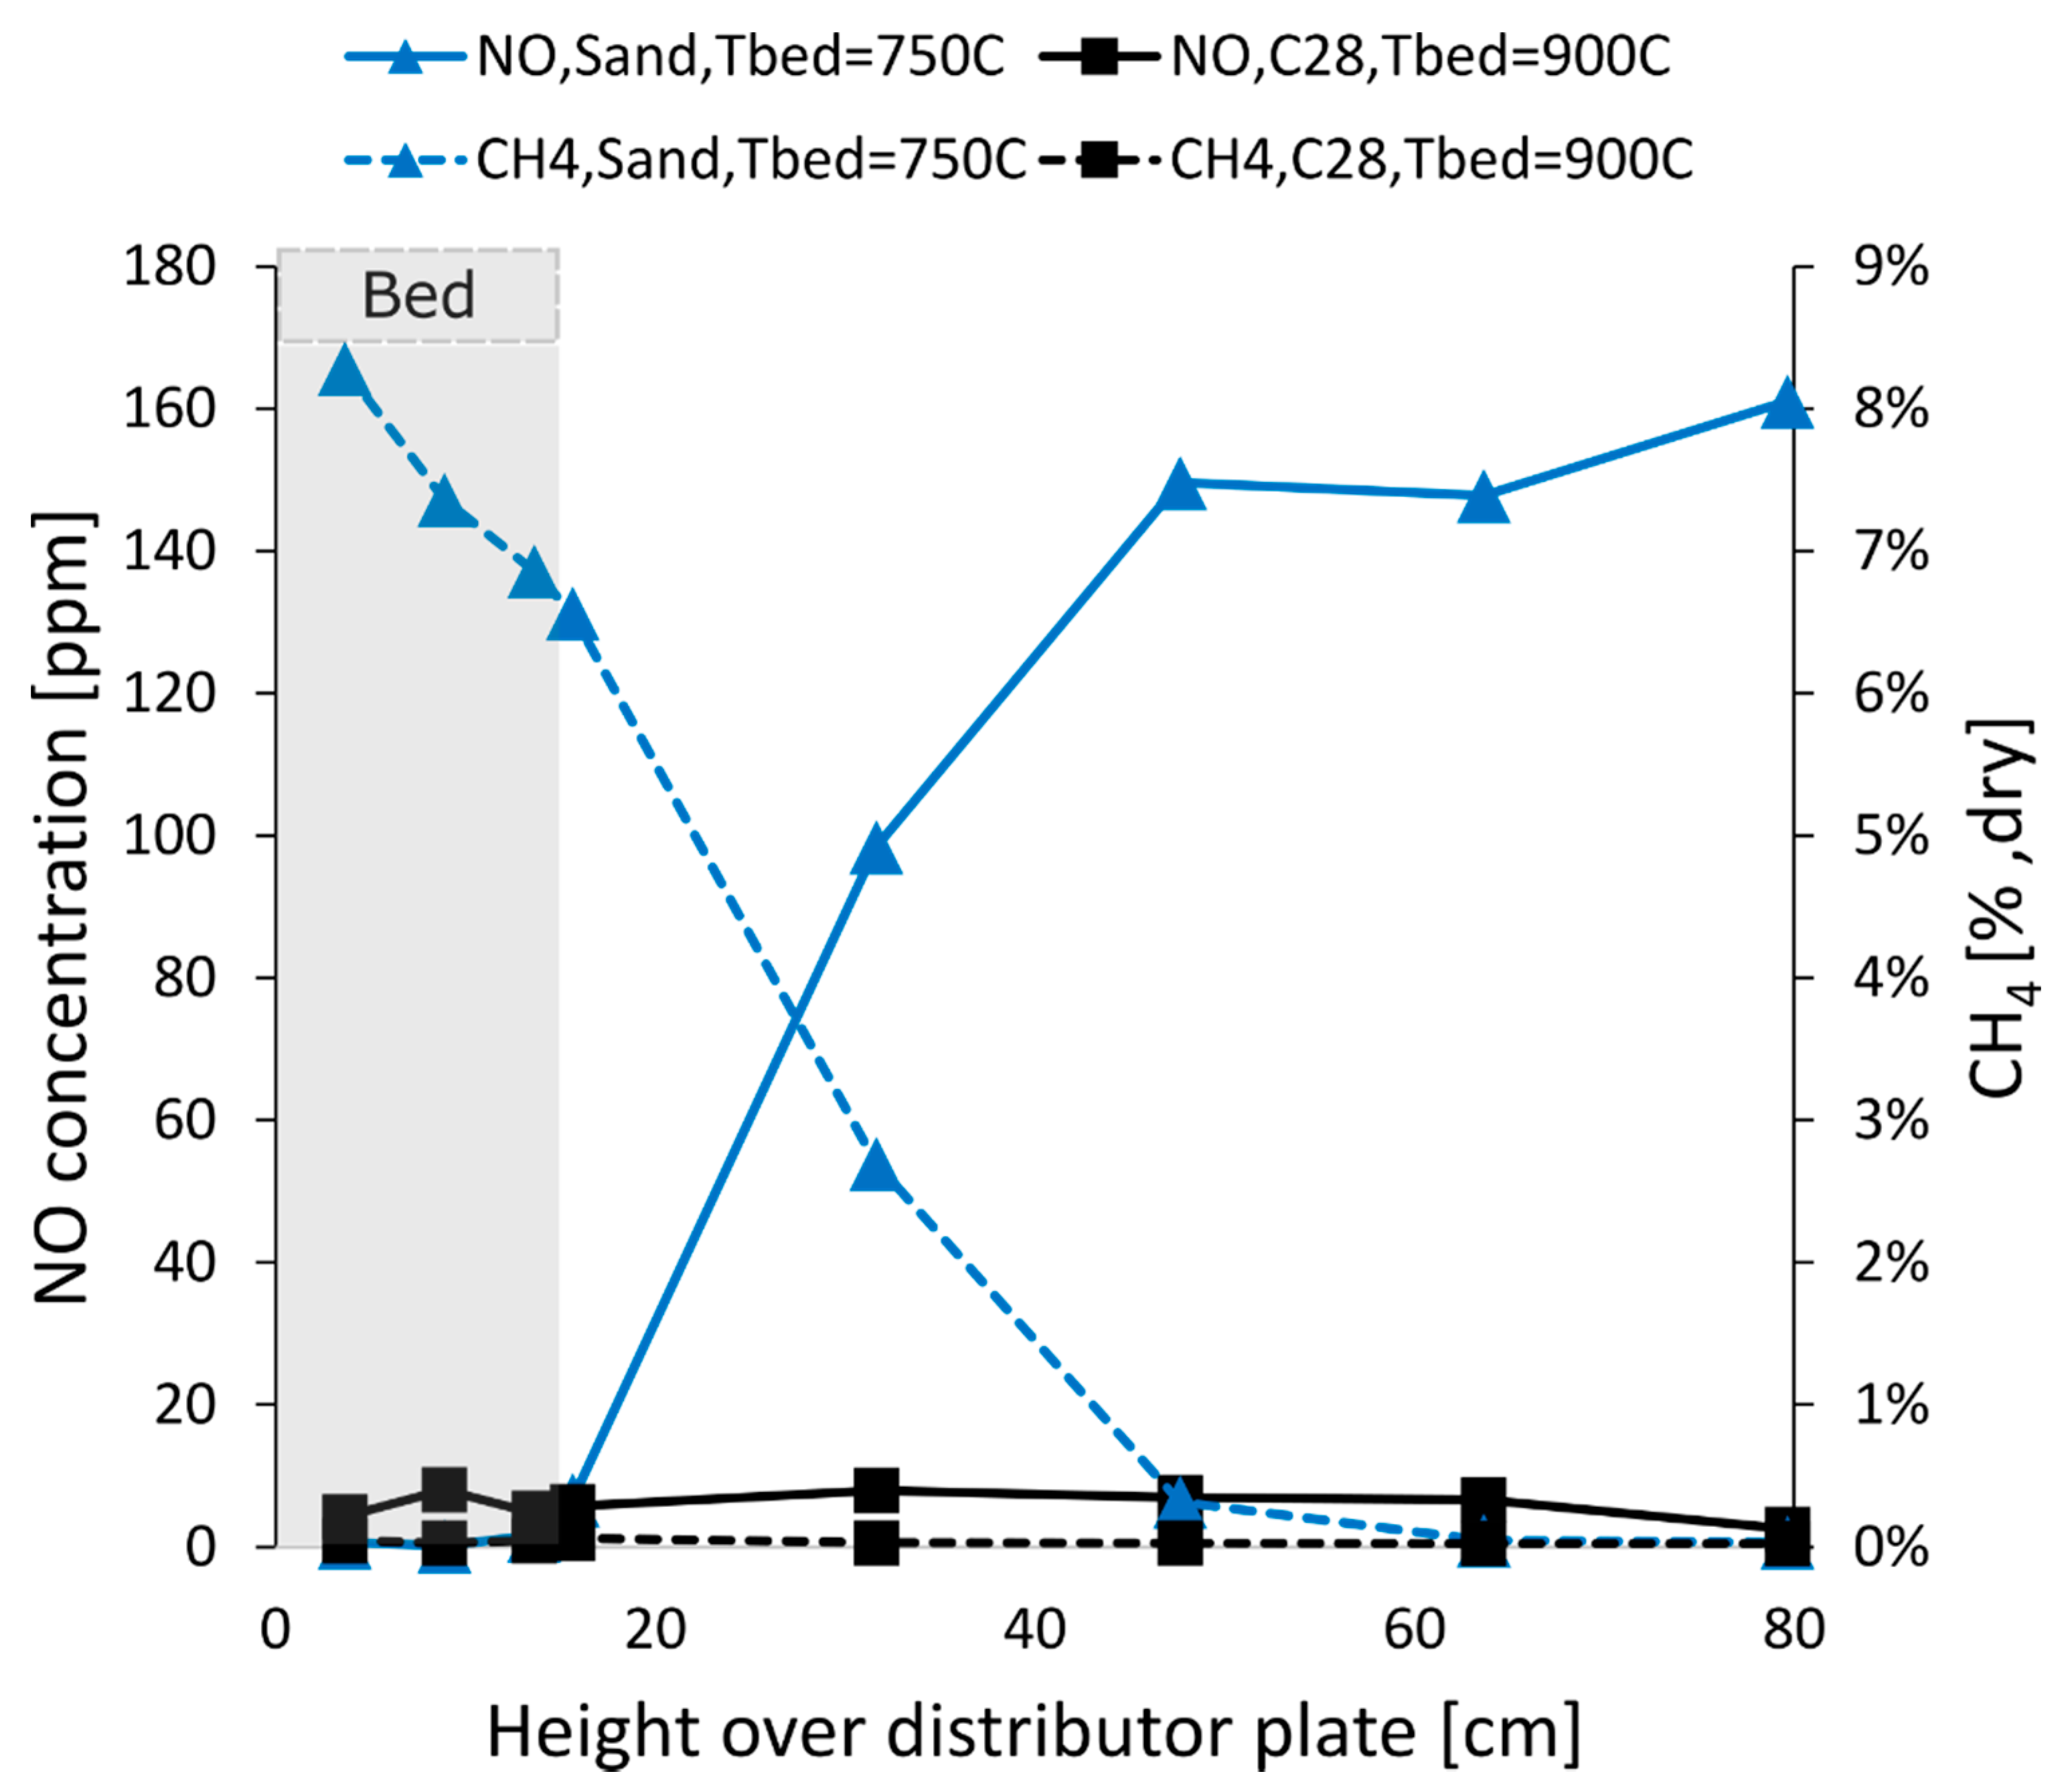
The difference between a system with flame combustion in the freeboard and a system with high in-bed fuel conversion is illustrated in Figure 7, where a comparison is made between the results in measured concentrations of NO and CH4 for sand at 750 °C and for C28 at 900 °C.
In Figure 8, it can be observed that, with sand at 750 °C, fuel conversion takes place mainly above the bed. This is obvious since the concentration of CH4 is reduced significantly between MP4 and MP5. Between the same measurement points, the NO concentration increases significantly. This could be compared with the experiment with C28 at 900 °C, where CH4 conversion takes place in the bed and almost no NO emissions are detected at any height in the reactor. The difference in the results between temperatures 750 and 900 °C can be further emphasized by observing Table 5 where the measured NO emissions are at least 79 ppm for all bed materials at MP8 at 750 °C, whereas no more than 11 ppm is detected at MP8 at 900 °C. This represents, therefore, a reduction in NO emissions by more than 93% compared to a case with flame combustion.
It can be observed that the measured concentration of NO is higher with ilmenite as a bed material than with sand at 750 °C and 800 °C. A similar amount of methane conversion appears to take place above the bed in those cases, so the reason could instead be connected to the availability of oxygen in the bed. In the bed with an oxygen carrier, oxygen is available both in gaseous and solid phase in the form of the oxygen carrier material, which could contribute to a higher risk of NO formation. When C28 is used as a bed material, the measured NO concentration is lower, however, and this could be explained by the fact that more fuel conversion takes place in the bed with this bed material, which means that less fuel conversion can take place above the bed and cause local hotspots where NO may be formed. It should also be mentioned that NO may be reduced by reacting with the oxygen carrier to form N2 (while the oxygen carrier is oxidized) but the reaction rate for this reaction may vary for different conditions.

3.2. Experiments with Off-Gas

The same bed materials (sand, ilmenite and C28) were also evaluated with PSA off-gas as a fuel at five different bed temperatures (600, 650, 700, 750, 800 °C). The data from the experiments using PSA off-gas as fuel are also presented in Tables S4–S7 in the supplementary material. The vertical temperature profile of the systems for the experiments can be observed in Figure 9. In the experiments with off-gas as fuel, the average bed height was 15.4 cm for sand, 15.6 cm for ilmenite and 14.6 cm for C28.
At high temperatures, it was difficult to keep the temperature in the wind box below the limit at which the gas mixture ignites in the wind box. This occurred for all bed materials when operating at a bed temperature of 800 °C and with C28 at 750 °C. In those cases, the wind box temperature was significantly higher and complete conversion of CH4, CO and H2 was observed at all measurement points, which is why these results were excluded from this article. The apparent reason for this taking place is that the cooling of the wind box was not sufficiently efficient to hinder ignition at these temperature levels. For these cases, it is observed that the fuel is almost completely converted already at MP1, which makes these cases irrelevant in the analysis. The temperature profiles overall look quite similar for the three bed materials, although some differences are seen in the freeboard.
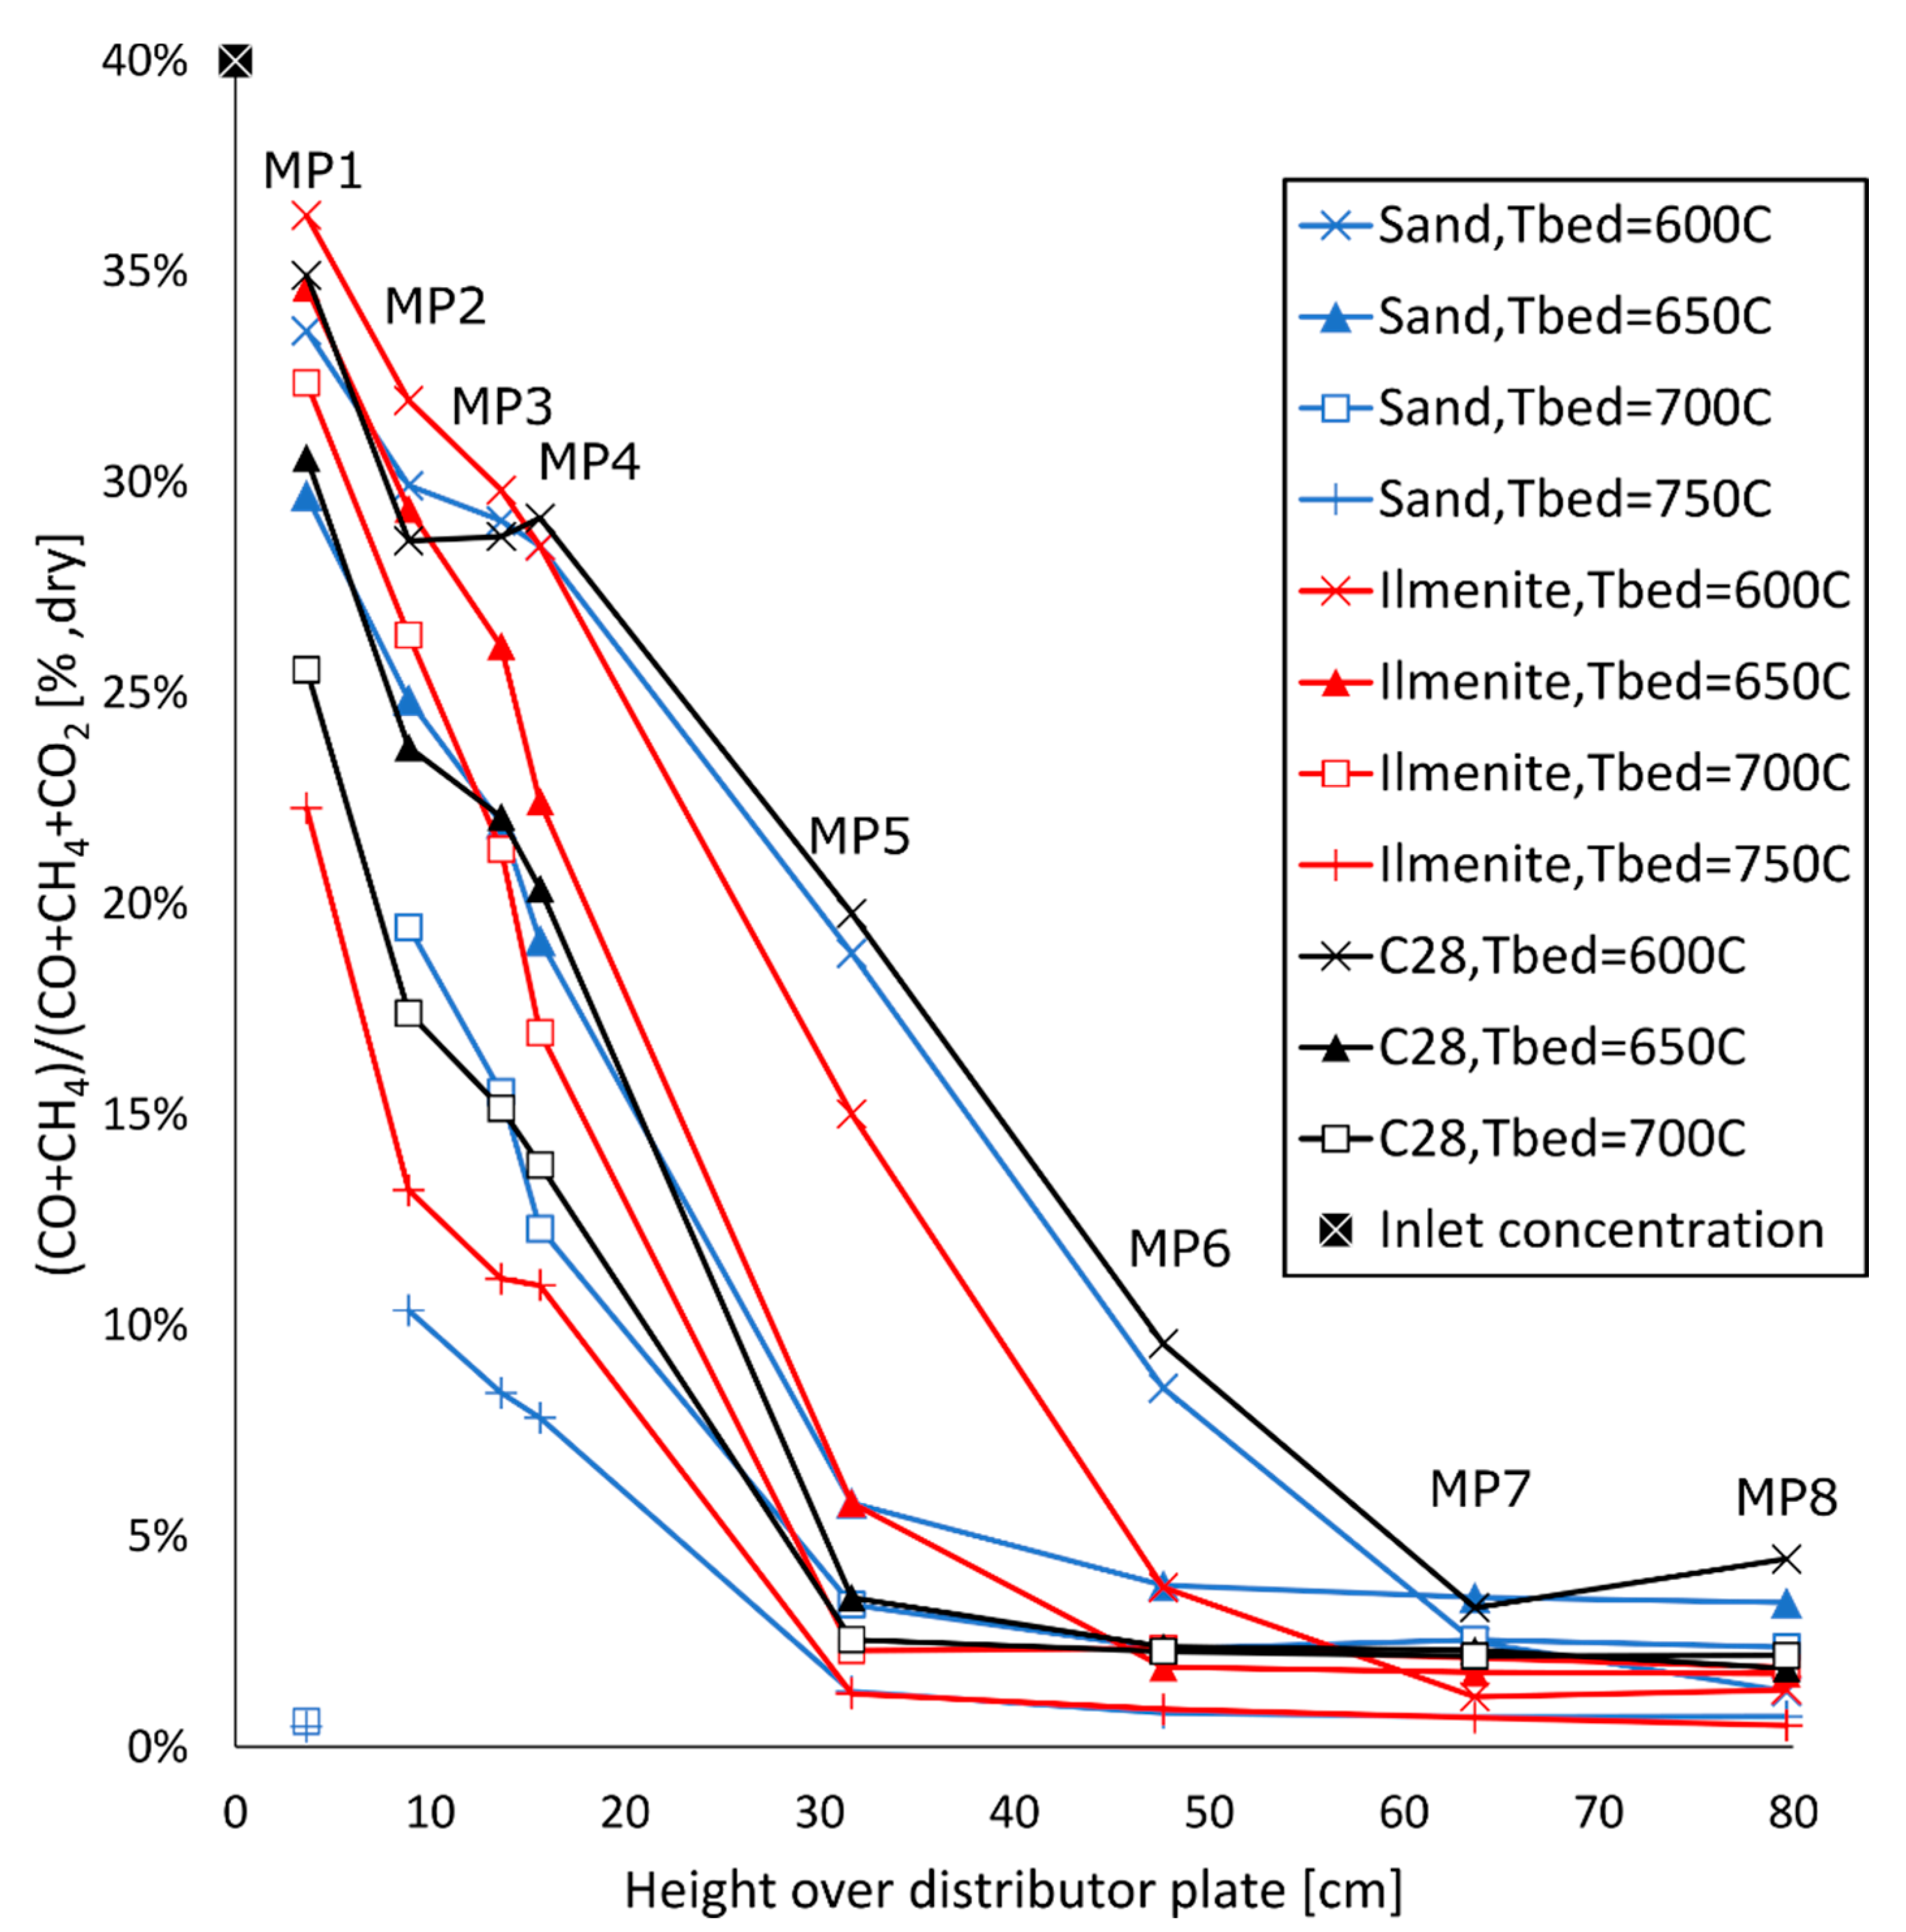
In order to get a better overview of the fuel conversion in the reactor, the gas concentration measurements of fuel gas components are evaluated. A first observation, which could be made from this data, is that very little/no hydrogen is measured during any of the experiments, which indicates that hydrogen reacts quickly in presence of oxygen, as could be expected. The focus was therefore to evaluate the concentrations of CO, CH4 and CO2 to monitor the fuel conversion in the system. The ratio of the measured concentration of unburnt carbon in the form of CO and CH4 in relation to the total measured carbon (CO, CH4 and CO2) as a measure of the gas conversion. The results are presented in Figure 10, where ratio at the inlet of 40% is also included.
It can be observed that part of the PSA off-gas is already burnt in the bed at a bed temperature of 600 °C with all bed materials. It is interesting to see that some fuel conversion takes place at these moderate temperatures, which are low in relation to optimal temperatures for OCAC operation. It can also be seen that a significant part of the fuel conversion takes place above the bed and almost all fuel is converted at MP5 ≥ 650 °C with all bed materials. Close to complete carbon conversion is observed at 700–750 °C at the top of the reactor with all three bed materials. The carbon conversion in the bed is also similar for the bed materials. The results in Figure 10 indicate overall small differences between the different bed materials. This suggests that the choice of bed material may not be so important to achieve high fuel conversion with PSA off-gas as fuel, as opposed to methane where there was a visible difference. At a bed temperature of 750 °C, for example, it is observed that the system with sand as a bed material has a lower content of unburnt carbon in the bed than the system with ilmenite at MP1-MP4. For sand at MP1 at bed temperatures of 700 and 750 °C, the measured concentration of CO2 indicates that almost complete fuel gas conversion takes place at the very bottom of the bed below MP1. This is, however, contradictory to the results from the results above this point, which are more in line with expectations and the rest of the results, which indicate that the result at MP1 for these two temperatures could be outliers. This is also the reason for the fact that these points are not connected with a line to the rest of the data at the respective bed temperatures.
The difference in concentrations of CO and CH4 is presented in Table 7. The ratio is 1 at the inlet.
In Table 6, it can be observed that the ratio is generally below 1 in the bed, thus indicating higher gas conversion of CO compared to CH4 in the bed, whereas the ratio is above 1 above the bed, where the ratio is especially high with sand. The ratio is higher above the bed because of significant methane conversion taking place above the bed, whereas the CO concentration is more constant over the height of the reactor. This highlights, once again, the difficulty to convert methane in the bed and motivates the focus on this compound in these experiments.
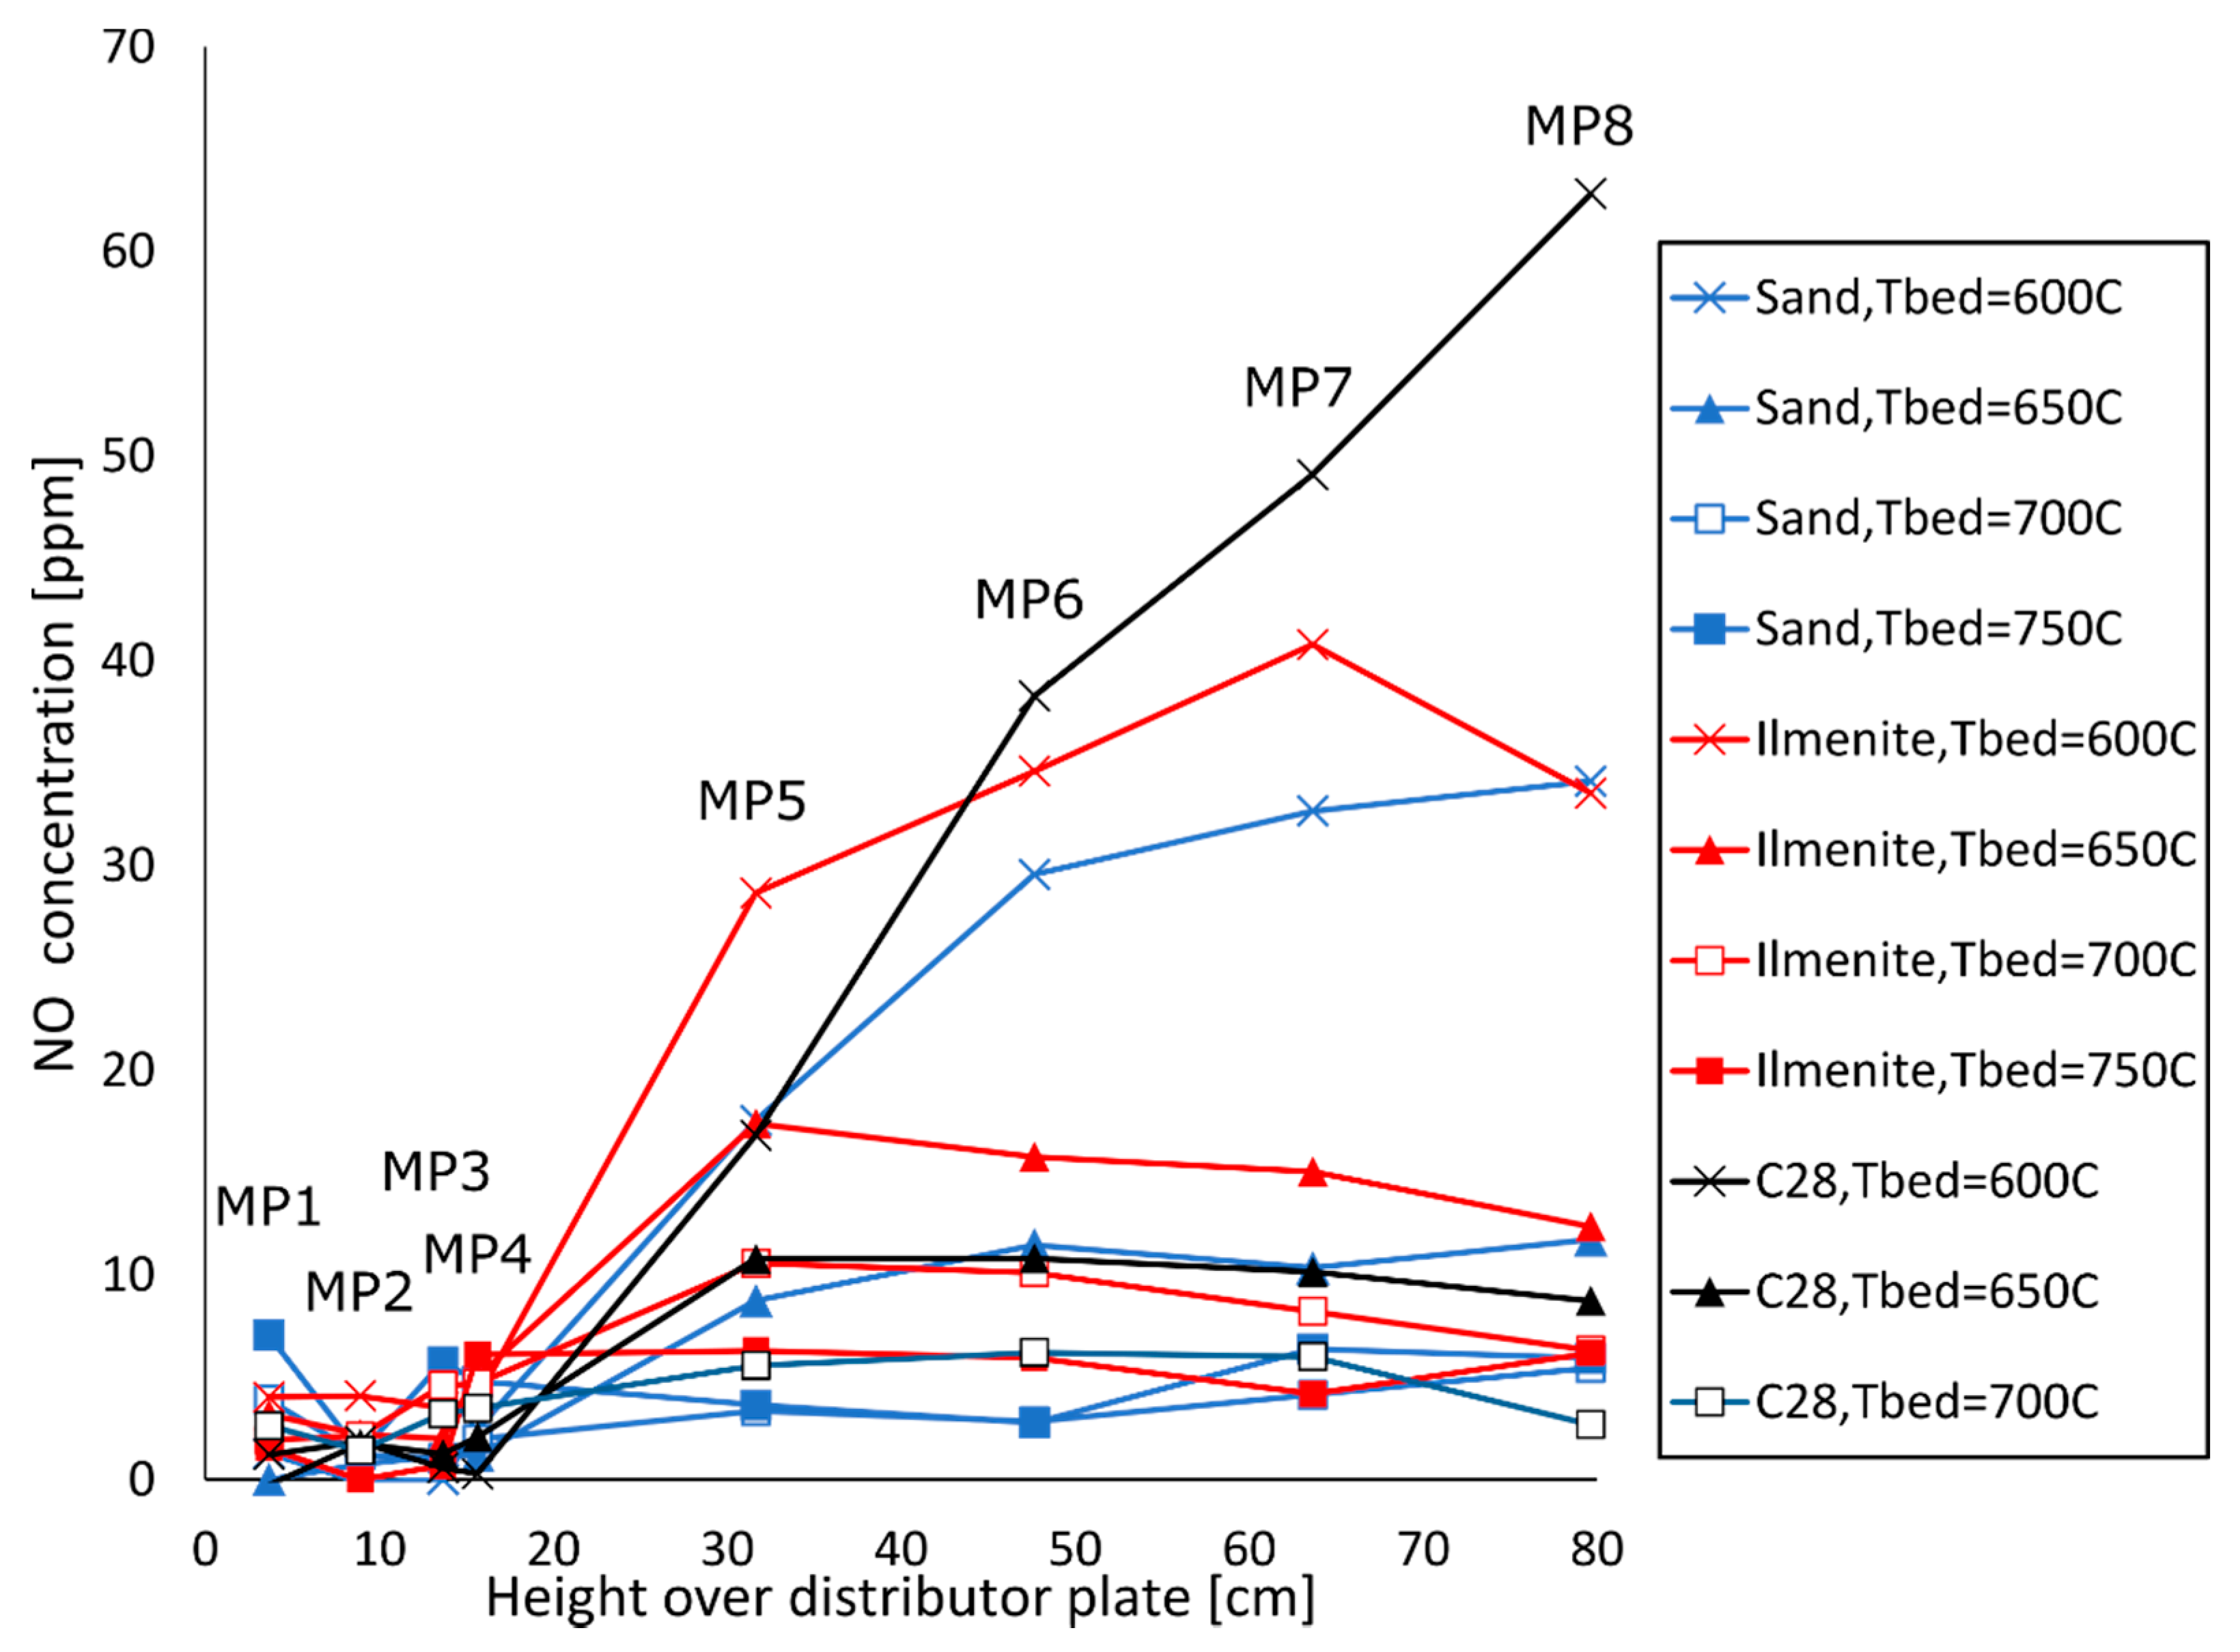
Based on overall results from this study, it should be possible to use a bubbling fluidized bed, operated in OCAC configuration, to convert the targeted fuel mix of PSA off-gas and light hydrocarbons, such as methane, in the dense bed. This could be important for the implementation of the proposed process application to use an OCAC-reactor as a heat source for steam reforming, where this kind of fuel mix is intended. The NO emissions were also monitored with PSA off-gas as fuel. The results are presented in Figure 11.
It can be observed that the NO emissions are overall low with all bed materials. The NO concentration is especially low in the bed and, in general at bed temperatures above 600°C. The system with C28 as a bed material results in slightly higher NO emissions overall than the other systems, which could be connected to the previously mentioned effect that the bed material could present more oxidizing conditions than sand, for example.
Combustion with low NO emissions is one of the key advantages considered when evaluating the possibility to integrate OCAC with SMR, instead of using the conventional SMR furnace with gas-fired burners. The conventional furnace operates with flame combustion, causing the significant formation of thermal NOx. With standard industrial gas burners and combustion in the presence of a flame, emissions corresponding to 100 ppm NOx can be expected [35]. The experimental results in this work indicate that operation with oxygen carriers as bed materials at high bed temperatures in OCAC configuration should enable fuel conversion in the bed without the presence of a flame and, thus, provide very low NOx formation.

4. Conclusions

A laboratory-scale bubbling fluidized bed with an approximate bed height of 15 cm was used for oxygen carrier aided combustion of methane and PSA off-gas. Three bed materials were compared—sand, rock ilmenite and a manufactured manganese-based perovskite material (C28)—at bed temperatures ranging from 600 °C to 900 °C. The gas conversion was monitored by using measurements of temperatures and gas composition over the length of the reactor. The results with methane showed that an improved in-bed fuel conversion could be achieved using oxygen carriers as bed materials instead of sand, where C28 showed the best results. This can be traced to the fact that the oxygen carriers enable improved contact between fuel and oxygen, due to the addition of an additional fuel conversion mechanism in the form of the gas–solid reaction between fuel and metal oxide. At a bed temperature of 900 °C, close to complete methane conversion was observed, 99.3–99.7%, with ilmenite and C28 as bed materials 9 cm from the distribution plate, whereas the result for sand was 86.7%. The oxygen carriers also showed significantly higher methane conversion at lower temperatures. A test where the air-to-fuel ratio was varied from 1 to 1.2 showed only a small improvement in methane conversion.
The experiments with PSA off-gas as fuel showed overall high gas conversion for all bed materials at moderate temperatures (600–750 °C), where only minor differences were observed between the bed materials. The suggestion to integrate OCAC with SMR plant is supported by the experimental results in this work, since:
  • High fuel conversion in the bed was detected with PSA off-gas and methane, especially at higher temperatures where close to complete gas conversion was observed.
  • Very limited NO emissions were observed with methane as fuel apart from cases where close to all of the fuel conversion took place above the bed. The emissions were especially low at high temperatures (< 14 ppm at a bed temperature 900 °C with all bed materials).
  • Almost no NO emissions at all were detected using PSA off-gas as fuel (< 11 ppm at bed temperatures > 700 °C with all bed materials).

Supplementary Materials

The following are available online at https://www.mdpi.com/2076-3417/11/1/210/s1, Table S1: Measured average temperatures at different measurement points operating with sand, C28 and ilmenite with methane as fuel. Table S2: Measured average concentrations of CH4 (%, dry) at different measurement points operating with sand, C28 and ilmenite with methane as fuel. Table S3: Measured average concentrations of CO (%, dry) at different measurement points operating with sand, C28 and ilmenite with methane as fuel. Table S4: Measured gas concentrations of CO (%, dry) at different measurement points for all three bed materials using PSA off-gas as fuel. Table S5: Measured gas concentrations of CH4 (%, dry) at different measurement points for all three bed materials using PSA off-gas as fuel. Table S6: Measured gas concentrations of CO2 (%, dry) at different measurement points for all three bed materials using PSA off-gas as fuel. Table S7: NO concentration (ppm, dry) at different measurement points with different bed materials and measurement points using PSA off-gas as fuel.

Author Contributions

Conceptualization, V.S. and M.R.; methodology, V.S. & M.R.; formal analysis, V.S.; investigation, V.S.; writing—original draft preparation, V.S.; writing—review and editing, V.S., M.R., T.M. and A.L.; visualization, V.S.; project administration, V.S.; funding acquisition, M.R. All authors have read and agreed to the published version of the manuscript.

Funding

The work was supported by the Swedish Energy Agency (project 40559-1-Heat to endothermic industrial processes with new efficient combustion method in fluidized bed) and Haldor Topsøe A/S.

Institutional Review Board Statement

Not applicable.

Informed Consent Statement

Not applicable.

Acknowledgments

Rustan Hvitt and Johannes Öhlin should be acknowledged for their support in the preparations and execution of the experiments.

Conflicts of Interest

The authors declare no conflict of interest.

Nomenclature

AFRAirAir-to-fuel ratio
BFBBubbling fluidized bed
C28Mn-based perovskite structure oxygen carrier material, CaMn0.775Mg0.1Ti0.125O3-δ
CFBCirculating fluidized bed
CLCChemical-looping combustion
FBHEFluidized bed heat exchanger
HHeight from distributor plate in reactor
IDInner diameter
INNOCUOUSEU financed project aimed at oxygen carrier development
MeMetal oxygen carrier
MFCMass flow controller
MPMeasurement point
NDIRNondispersive infrared sensor
NDUVNon-Dispersive Ultra Violet Spectroscopy
OCACOxygen carrier aided combustion
ODOuter diameter
PPressure
PSA off-gasStream of gases obtained from a pressure swing adsorption unit
SMRSteam methane reforming
umfMinimum fluidization velocity
utTerminal velocity
ΔTTemperature difference
εBFBVoidage in fluidized bed
εfixedVoidage in fixed bed (assumed to be equal to 0.4)
ρbedPoured bulk density of the bed
ρairAir density
ρpParticle density
j,k,x,yWhole numbers
thThermal

References

  1. Chadeesingh, D.R.; Hayhurst, A.N. The combustion of a fuel-rich mixture of methane and air in a bubbling fluidised bed of silica sand at 700 °C and also with particles of Fe2O3 or Fe present. Fuel 2014, 127, 169–177. [Google Scholar] [CrossRef]
  2. Dounit, S.; Hemati, M.; Steinmetz, D. Natural gas combustion in fluidised bed reactors between 600 and 850 °C: Experimental study and modelling of the freeboard. Powder Technol. 2001, 120, 49–54. [Google Scholar] [CrossRef]
  3. Blanksby, S.J.; Ellison, G.B. Bond Dissociation Energies of Organic Molecules. Acc. Chem. Res. 2003, 36, 255–263. [Google Scholar] [CrossRef]
  4. Ravi, M.; Ranocchiari, M.; van Bokhoven, J.A. The Direct Catalytic Oxidation of Methane to Methanol—A Critical Assessment. Angew. Chem. Int. Ed. 2017, 56, 16464–16483. [Google Scholar] [CrossRef] [PubMed]
  5. van der Vaart, D.R. Freeboard ignition of premixed hydrocarbon gas in a fluidized bed. Fuel 1988, 67, 1003–1007. [Google Scholar] [CrossRef]
  6. Loeffler, G.; Hofbauer, H. Does CO Burn in a Fluidized bed?—A Detailed Chemical Kinetic Modeling Study. Combust. Flame 2002, 129, 439–452. [Google Scholar] [CrossRef]
  7. Dennis, J.S.; Hayhurst, A.N.; Mackley, I.G. The ignition and combustion of propane/air mixtures in a fluidised bed. Symp. Combust. 1982, 19, 1205–1212. [Google Scholar] [CrossRef]
  8. Li, J.; Zhang, H.; Gao, Z.; Fu, J.; Ao, W.; Dai, J. CO2 Capture with Chemical Looping Combustion of Gaseous Fuels: An Overview. Energy Fuels 2017, 31, 3475–3524. [Google Scholar] [CrossRef]
  9. Thunman, H.; Lind, F.; Breitholtz, C.; Berguerand, N.; Seemann, M. Using an oxygen-carrier as bed material for combustion of biomass in a 12-MWth circulating fluidized-bed boiler. Fuel 2013, 113, 300–309. [Google Scholar] [CrossRef]
  10. Moldenhauer, P.; Gyllén, A.; Thunman, H. A Scale-Up Project for Operating a 115 MWth Biomass-Fired CFB boiler with Oxygen Carriers as Bed Material. In Proceedings of the 5th International Conference on Chemical Looping 2018, Park City, UT, USA, 24–27 September 2018. [Google Scholar]
  11. Lyngfelt, A. Oxygen carriers for chemical-looping combustion. In Calcium and Chemical Looping Technology for Power Generation and Carbon Dioxide (CO2) Capture; Fennell, P., Anthony, B., Eds.; Woodhead Publishing: Cambridge, UK, 2015; pp. 221–254. [Google Scholar]
  12. Lyngfelt, A.; Brink, A.; Langørgen, Ø.; Mattisson, T.; Rydén, M.; Linderholm, C. 11,000 h of chemical-looping combustion operation—Where are we and where do we want to go? Int. J. Greenh. Gas Control 2019, 88, 38–56. [Google Scholar] [CrossRef]
  13. Moldenhauer, P.; Hallberg, P.; Biermann, M.; Snijkers, F.; Albertsen, K.; Mattisson, T.; Lyngfelt, A. Oxygen-Carrier Development of Calcium Manganite–Based Materials with Perovskite Structure for Chemical-Looping Combustion of Methane. Energy Technol. 2020, 8, 2000069. [Google Scholar] [CrossRef] [Green Version]
  14. Mattisson, T.; Adánez, J.; Mayer, K.; Snijkers, F.; Williams, G.; Wesker, E.; Bertsch, O.; Lyngfelt, A. Innovative Oxygen Carriers Uplifting Chemical-looping Combustion. Energy Procedia 2014, 63, 113–130. [Google Scholar] [CrossRef] [Green Version]
  15. Hallberg, P.; Hanning, M.; Rydén, M.; Mattisson, T.; Lyngfelt, A. Investigation of a calcium manganite as oxygen carrier during 99 h of operation of chemical-looping combustion in a 10 kWth reactor unit. Int. J. Greenh. Gas Control 2016, 53, 222–229. [Google Scholar] [CrossRef]
  16. Jing, D. Innovative Oxygen Carriers for Chemical-Looping Combustion; Chalmers University of Technology: Gothenburg, Sweden, 2015. [Google Scholar]
  17. Abad, A.; García-Labiano, F.; Gayán, P.; de Diego, L.F.; Adánez, J. Redox kinetics of CaMg0.1Ti0.125Mn0.775O2.9−δ for Chemical Looping Combustion (CLC) and Chemical Looping with Oxygen Uncoupling (CLOU). Chem. Eng. J. 2015, 269, 67–81. [Google Scholar] [CrossRef] [Green Version]
  18. Hallberg, P.; Källen, M.; Jing, D.; Snijkers, F.; van Noyen, J.; Rydén, M.; Lyngfelt, A. Experimental Investigation of CaMnO3-δ Based Oxygen Carriers Used in Continuous Chemical-Looping Combustion. Int. J. Chem. Eng. 2014, 2014. [Google Scholar] [CrossRef]
  19. Källén, M.; Rydén, M.; Lind, F. Improved Performance in Fluidised Bed Combustion by the Use of Manganese Ore as Active Bed Material. In Proceedings of the 22nd International Conference on Fluidized Bed Combustion, Turku, Finland, 14–17 June 2015. [Google Scholar]
  20. Rydén, M.; Hanning, M.; Corcoran, A.; Lind, F. Oxygen Carrier Aided Combustion (OCAC) of Wood Chips in a Semi-Commercial Circulating Fluidized Bed Boiler Using Manganese Ore as Bed Material. Appl. Sci. 2016, 6, 347. [Google Scholar]
  21. Rydén, M.; Hanning, M.; Lind, F. Oxygen Carrier Aided Combustion (OCAC) of Wood Chips in a 12 MWth Circulating Fluidized Bed Boiler Using Steel Converter Slag as Bed Material. Appl. Sci. 2018, 8, 2657. [Google Scholar]
  22. Stenberg, V.; Spallina, V.; Mattisson, T.; Rydén, M. Techno-economic analysis of H2 production processes using fluidized bed heat exchangers with steam reforming—Part 1: Oxygen carrier aided combustion. Int. J. Hydrogen Energy 2020, 45, 6059–6081. [Google Scholar] [CrossRef]
  23. Stenberg, V.; Rydén, M.; Mattisson, T.; Lyngfelt, A. Exploring novel hydrogen production processes by integration of steam methane reforming with chemical-looping combustion (CLC-SMR) and oxygen carrier aided combustion (OCAC-SMR). Int. J. Greenh. Gas Control 2018, 74, 28–39. [Google Scholar] [CrossRef]
  24. Pans, M.A.; Abad, A.; de Diego, L.F.; García-Labiano, F.; Gayán, P.; Adánez, J. Optimization of H2 production with CO2 capture by steam reforming of methane integrated with a chemical-looping combustion system. Int. J. Hydrogen Energy 2013, 38, 11878–11892. [Google Scholar] [CrossRef] [Green Version]
  25. Ortiz, M.; Gayán, P.; de Diego, L.F.; García-Labiano, F.; Abad, A.; Pans, M.A.; Adánez, J. Hydrogen production with CO2 capture by coupling steam reforming of methane and chemical-looping combustion: Use of an iron-based waste product as oxygen carrier burning a PSA tail gas. J. Power Sources 2011, 196, 4370–4381. [Google Scholar] [CrossRef]
  26. Rydén, M.; Lyngfelt, A. Using steam reforming to produce hydrogen with carbon dioxide capture by chemical-looping combustion. Int. J. Hydrogen Energy 2006, 31, 1271–1283. [Google Scholar] [CrossRef] [Green Version]
  27. Engineering Toolbox. Fuels and Chemicals—Autoignition Temperature. 2003. Available online: https://www.engineeringtoolbox.com/fuels-ignition-temperatures-d_171.html (accessed on 13 July 2020).
  28. Linderholm, C.; Knutsson, P.; Schmitz, M.; Markström, P.; Lyngfelt, A. Material balances of carbon, sulfur, nitrogen and ilmenite in a 100kW CLC reactor system. Int. J. Greenh. Gas Control 2014, 27, 188–202. [Google Scholar] [CrossRef]
  29. Aronsson, J.; Krymarys, E.; Stenberg, V.; Mattisson, T.; Lyngfelt, A.; Rydén, M. Improved Gas–Solids Mass Transfer in Fluidized Beds: Confined Fluidization in Chemical-Looping Combustion. Energy Fuels 2019, 33, 4442–4453. [Google Scholar] [CrossRef]
  30. Wen, C.Y.; Yu, Y.H. A generalized method for predicting the minimum fluidization velocity. Aiche J. 1966, 12, 610–612. [Google Scholar] [CrossRef]
  31. Kunii, D.; Levenspiel, O. Fluidization Engineering, 2nd ed.; Butterworth-Heinemann: Boston, MA, USA, 1991. [Google Scholar]
  32. Sit, S.P.; Grace, J.R. Effect of bubble interaction on interphase mass transfer in gas fluidized beds. Chem. Eng. Sci. 1981, 36, 327–335. [Google Scholar] [CrossRef]
  33. Zevenhoven, R.; Kilpinen, P. Control of Pollutants in Flue Gases and Fuel Gases; Helsinki University of Technology: Espoo, Finland, 2004. [Google Scholar]
  34. Environmental Protection Agency. Nitrogen Oxides (NOx), Why And How They Are Controlled. EPA-456/F-99-006R; Research Triangle Park: Raleigh, NC, USA, 1999.
  35. Zhu, F.; Johnson, J.A.; Ablin, D.W.; Ernst, G.A. Efficient Petrochemical Processes: Technology, Design and Operation; Wiley-Blackwell: Hoboken, NJ, USA, 2019. [Google Scholar]
Figure 1. Schematic illustration of the BFB reactor system with gas sampling tubes to the left and the inclined tubes for the pressure transducers and thermocouples to the right, each corresponding to a certain measurement point (MP0 to MP8).
Applsci 11 00210 g001
Figure 2. Schematic illustration of the measurement points in the dense bed, splash zone and the lower part of the freeboard.
Applsci 11 00210 g002
Figure 3. Particle size distribution for used bed materials before operation.
Applsci 11 00210 g003
Figure 4. Measured temperatures at different measurement points (MP0–MP8) for five different bed temperatures (from 600 to 900 °C) for all three bed materials with methane as fuel.
Applsci 11 00210 g004
Figure 5. Measured gas concentration of CH4 (in %, dry) at different distances from the distributor plate and at different bed temperatures for all three bed materials. The grey area indicates the bed where the dotted line indicates the estimated bed height for the respective bed materials.
Applsci 11 00210 g005
Figure 6. Measured gas concentration of CH4 (in %, dry) at different distances from the distributor plate for all three bed materials where each subfigure presents a measurement at a certain bed temperature.
Applsci 11 00210 g006
Figure 7. Measured gas concentration of CO (in %, dry) at different distances from the distributor plate and at different bed temperatures for all three bed materials. The grey area indicates the bed where the dotted line indicates the estimated bed height for the respective bed materials.
Applsci 11 00210 g007
Figure 8. Measured dry concentrations of NO and CH4 for sand at 750 °C and at 900 °C with C28 as bed material at different heights from the distribution plate. The grey area indicates approximately where the bed is located.
Applsci 11 00210 g008
Figure 9. Measured temperatures at different measurement points (MP0–MP8) for five different bed temperatures (from 600 to 800 °C) for all three bed materials.
Applsci 11 00210 g009
Figure 10. Measured unburnt carbon (CO and CH4) in relation to total measured concentration of carbon (CO, CH4 and CO2) for all bed materials at different heights from the distribution plate.
Applsci 11 00210 g010
Figure 11. Measured concentrations of NO (in ppm, dry) for all bed materials at different heights from the distribution plate with PSA off-gas as fuel.
Applsci 11 00210 g011
Table 1. Measurement point (MP) positions in relation to the distributor plate.
Measurement PositionVertical Position (cm)
H8 (MP8)79.65
H7 (MP7)63.65
H6 (MP6)47.65
H5 (MP5)31.65
H4 (MP4)15.65
Targeted Hbed13.65 to 15.65
H3 (MP3)13.65
H2 (MP2)8.88
H1 (MP1)3.65
H0 (MP0, in windbox)−4.00
Table 2. Elemental composition of the used Baskarp sand and Norwegian rock ilmenite [28] given in wt-%. Balance is oxygen.
Element [wt-%]FeTiMgSiAlCaMnKCuTotal
Silica sand 0.35 42.302.59 0.891.66 47.80
Ilmenite36.4626.892.160.930.340.230.040.020.0167.27
Table 3. Experimental parameters for the used bed materials.
Position SandIlmeniteC28
Mean particle diameter (μm)130163149
Bulk density (kg/m3)136621891905
Minimum fluidization velocity umf (cm/s)0.541.371.00
Terminal velocity ut (cm/s)42.696.473.2
Solids inventory (g)85413691191
Fuel input (kW)0.820.820.82
Specific bed mass (kg/kWth)1.051.681.46
Table 4. Gas composition of PSA off-gas in vol-%.
Compound%
CH415
H225
CO15
CO245
Table 5. Methane concentration (%, dry) at different measurement points at different air-to-fuel ratios at 750 °C.
SandIlmeniteC28
AFR->11.051.11.211.051.11.211.051.11.2
MP80.05%0.03%0.03%0.03%0.05%0.03%0.03%0.03%0.05%0.03%0.03%0.02%
MP70.09%0.05%0.04%0.03%0.06%0.04%0.03%0.03%0.14%0.06%0.05%0.05%
MP60.53%0.32%0.26%0.19%0.12%0.04%0.04%0.04%1.02%0.63%0.43%0.31%
MP52.81%2.69%1.97%1.44%1.38%0.98%0.58%0.39%3.50%2.89%2.53%2.13%
MP46.87%6.56%5.79%5.24%6.51%5.90%5.37%4.69%5.18%4.68%4.58%4.24%
MP37.22%6.86%6.25%5.77%6.79%6.35%5.80%5.26%4.45%3.86%3.89%3.50%
MP27.73%7.36%6.82%6.26%7.61%7.08%6.69%6.17%4.20%3.85%3.82%3.51%
MP18.65%8.28%7.81%7.19%8.81%8.39%8.03%7.37%7.28%6.78%6.57%6.05%
Table 6. NO concentration (ppm, dry) at different measurement points with different bed materials and measurement points.
SandIlmeniteC28
600°C750°C800°C850°C900°C600°C750°C800°C850°C900°C600°C750°C800°C850°C900°C
MP801615125114255731743791053
MP7014851NA144239781643831477
MP601505124105246821163741067
MP5098472212422479164451878
MP4074510871132246
MP3021203650262445
MP2001002340351338
MP1010053340231114
Table 7. Measured concentration of CO (%, dry) divided by measured concentration of CH4 (%, dry) at different measurement points with different bed materials and measurement points.
SandIlmeniteC28
600 °C650 °C700 °C750 °C600 °C650 °C700 °C750 °C600 °C650 °C700 °C
MP81.84.94.92.51.92.63.71.60.82.63.2
MP71.35.34.22.41.52.73.52.31.12.12.7
MP61.04.23.92.71.12.23.22.90.91.62.5
MP50.92.12.52.60.82.12.32.20.81.22.1
MP40.60.40.30.40.60.50.61.00.60.50.5
MP30.50.30.20.30.50.50.50.80.60.40.4
MP20.50.30.20.20.60.50.40.70.50.30.2
MP10.70.52.01.60.80.70.70.90.80.60.4
Publisher’s Note: MDPI stays neutral with regard to jurisdictional claims in published maps and institutional affiliations.

