Article

The Selection of Strategic Alliance in IC Packaging and Testing Industry with DEA Resampling Comparative Evaluation

1
Department of Industrial Engineering and Management, National Kaohsiung University of Science and Technology, Kaohsiung 80778, Taiwan
2
Department of Information Management, Chihlee University of Technology, New Taipei City 22050, Taiwan
*
Authors to whom correspondence should be addressed.
Appl. Sci. 2021, 11(1), 204; https://doi.org/10.3390/app11010204
Submission received: 9 November 2020 / Revised: 22 December 2020 / Accepted: 23 December 2020 / Published: 28 December 2020

Abstract

:
Merger and acquisition (M&A) cases and the speed of horizontal integration have increased rapidly in the integrated circuit (IC) packaging and testing industry. Therefore, cooperation with suitable strategic alliance partner is a vital success factor for enterprises. This study proposes a “comparative evaluation” model that searches out appropriate strategic alliances on the basis of the resampling model acquired via data envelopment analysis (DEA). The realistic public data of 20 companies was collected from 2015 to 2019 in the IC packaging and testing industry. The super slacks-based measure model was used to evaluate the performance before alliance in the period from 2015 to 2019. The resampling past–present–future model was used to forecast the performance in 2020–2024. Afterward, a future strategic alliance for comparative evaluation of efficiency was established. The results of the alliance were divided into the groups “ineffective” and “effective”. The results show that 11 companies in the “effective” group achieved both improvements and 8 companies in the “ineffective” group achieved only unilateral improvements. The comparison model describes the efficiency of both sides simultaneously, not only from the perspective of the target but also from the perspective of the partner company. The evaluation model proposed in the study enables enterprises to find suitable alliance partners.

1. Introduction

The integrated circuit (IC) industry in Taiwan has stood a crucial position in the world. The IC packaging and testing industry accounts for 52% of global profits. The IC industry supply chain starts with IC design, then IC manufacturing, and finally IC packaging and testing. The IC supply chain is mainly composed of these three parts. IC packaging and testing are an important part of the semiconductor manufacturing process. Specifically, packaging is the process of protecting chips from external physical, chemical, and other environmental damage. The IC packaging and testing industry is downstream of the supply chain. According to a report released by Yole Développement [1], Taiwanese outsourced semiconductor assembly and test (OSATs) contributed to nearly 52% of revenue in 2018, and included some prosperous packaging and testing factories such as Advanced Semiconductor Engineering (ASE); Siliconware Precision Industries Co., Ltd. (SPIL); and Chipmos. IC packaging and testing processes are complex systems. Many complicated activities are involved in manufacturing—IC packaging and testing, material selection, and even responsibility for parts of a whole. Some efficient companies perform IC fabrication, packaging, and testing within a complete production line.
The IC packaging and testing industry is extremely competitive. The instances of mergers are growing rapidly. Two well-known merger cases are described below. Amkor (Amkor Technology, Tempe, AZ, USA) acquired a 100% stake in J-Devices and merged finances with J-Devices from 2016. J-Devices ranks first in the market for packaging and testing (OAST) in Japan and it has reached sixth place in the world. Amkor acquired J-Devices, in addition to expanding their business’ reach, because of concerns about its market for automotive chip sealing and ranging. After the merger with J-Devices (Usuki, Oita, Japan) was completed, Amkor not only consolidated its position in the market, but also occupied first place in the automotive chip packaging and testing market [2]. In 2018, ASE (Advanced Semiconductor Engineering, Inc., Kaohsiung City, Taiwan) and SPIL (Siliconware Precision Industries Co., Ltd., Taichung City, Taiwan) merged and became ASE Group (ASE Technology Holding Co., Ltd., Kaohsiung City, Taiwan), which was the largest packaging as well as the largest testing company in the world. This is most sensational merger case in the IC packaging and testing industry. For the financial results of the first quarter of 2020, revenue for the quarter was NTD 97.357 billion, an annual increase of 10% [3]. The IC packaging and testing industry may be observed to having developing in a fast vertical and horizontal integration across the last decade. As the competition in the IC industry is becoming more intense, finding a suitable strategic alliance has become one of the biggest concerns within large companies that can integrate partnerships in terms of mergers or acquisitions. Appropriate partners can promote the performance of both companies. Park [4] proposed that the failure of strategic alliances is due to opportunistic hazards, as each partner tries to maximize its individual benefit instead of collaborative benefit. Therefore, the performance enhancement of both parties can provide the willingness of enterprises to cooperate, which is a win–win situation. This “win–win situation” is necessary for the scientific and systematic methods evaluating business performance in order to form an appropriate partnership.
For the empirical study, 20 companies in the IC packaging and testing industry were selected as decision making units (DMUs). Having determined the input and output variables, we collected the historical data of these DMUs from 2015 to 2019. Then, the resampling method in data envelopment analysis (DEA) was employed to predict the future performance (data) from 2020 to 2024. Following this, the slacks-based measure model (Super-SBM) was applied to evaluate the past performance for these DMUs. The goal of the study was to pursue a new comparative evaluation for the future alliance by combining the resampling method in order to search for suitable partners and improve the operational efficiency of enterprises. At the same time, it provides a reference to enterprises in this competitive environment.
The study is organized as follows: Section 2 is the introduction, Section 2 is the literature review, Section 3 discusses materials and methodologies, and Section 4 is where empirical analysis and results are discussed. The last section is the conclusion, where findings are discussed.

2. Literature Review

2.1. Data Envelopment Analysis

In previous studies, Farrell [5] offered a model with multiple inputs and a single output for performance assessment. Charnes et al. [6] then proposed DEA (Data Envelopment Analysis), which is a non-parametric, data-oriented approach for measuring the performances of decision-making units (DMUs). The method analyzes and calculates the relative efficiency of the DMUs from multiple inputs and output factors. Tone [7] proposes an efficiency calculation on the basis of the slacks-based measure (SBM) of efficiency from data envelope analysis (DEA). The SBM model is based on the non-radial estimation method, taking into account the slacks with the introduced items at the same time, with the estimated efficiency value being between 0–1. In another paper, Tone [8] put forward the non-radial slacks-based measure of super-efficiency (Super-SBM), which is able to solve the problem when the SBM efficiency value of multiple decision-making units is the same as 1. Tone [9] has also proposed the resampling model. This model is based on the variations for gauging the confidence intervals of DEA scores. The research applied the past–present and past–present–future models to a dataset consisting of Japanese municipal hospitals. The past–present model uses past–present data to estimate the change in data applied to chronological weights, which is provided by the Lucas series (a type of Fibonacci sequence). The past–present–future model processes the future. The model aims to forecast the efficiency score in the future and the confidence interval of each DMU.
Wang and Le [10] propose an integrating gauge and forecast research procedure for solving the macroeconomic performance problem. The researchers applied two variants of the DEA resampling model, past–present and past–present–future to measure and predict the macroeconomic performance of developed countries and developing countries in Asia. Corrado lo Storto [11] suggests a two-stage process in DEA to solve the problem of evaluating and ranking advanced manufacturing technologies (AMTs). The proposed method is based on the several implemented DEA models computing cross-efficiency measurements for AMT facilities and the generation of a unique ranking of them by constructing a DEA-like indicator. The method offers the company management robust indications about the manufacturing technology to select. Kozmetsky [12] conducted a performance evaluation of the global semiconductor industry by the DEA method in 1998 through a series of comparative analyses based on company-level variables. Semiconductor companies in the United States, Japan, South Korea, and Taiwan have different comparative advantages in adopting multiple evaluation criteria employed. Moreover, these companies have become major competitors in this industry.

2.2. Strategic Alliance

Strategic alliances are layouts that assist the companies to implement more profitable and potential market presence in a restricted atmosphere. These companies born out of strategic alliance operate independently from two or more parent companies to undertake a mutually beneficial project [13]. As described by Chan et al. [14], activities of alliance can be partnerships between suppliers and buyers, outsourcing agreements, technical cooperation, joint research projects, shared new product development, shared manufacturing arrangements, joint distribution agreements, or cross-selling arrangements. The structure or goals of each enterprise will depend on the needs of the enterprise. Cravens et al. [15] divided strategic alliances into horizontal partnerships, excluding any form of equity exchange or creation of a new entity in a joint venture. Vanhaverbeke et al. [16] focused on the choice between mergers and acquisitions, and innovation-related alliances. The results show that in a series of strategic alliances, the possibility that one partner will eventually obtain another between two partners increases. Given that it was previously established directly, rather than indirectly established, once an indirect relationship is established, the possibility of establishing strategic alliance between companies will increase.
However, there are still disadvantages of alliance. Parkhe [17] proposed that trust plays a leading role in successful alliances. After the alliance, managers often lack trust in alliance partners because they seek to maximize the own interests. Park [4] introduced the two main reasons for the failure of alliances are due to inter-firm rivalry and management complexity. It is also one of the reasons why the company opposed the alliance in the beginning, because each partner tries to maximize the benefits individually of collaboration. Ahern [18] proposed a new hypothesis to describe the division of gains between targets and bidders in mergers. The targets have lower bargaining power when they are more defenseless to losses from a price war started by an acquirer in horizontal mergers. This led to opposition from the beginning of the alliance. Dissatisfaction with the alliance relationship is one of the main factors that leads to the breakdown of alliances [19].
Wang et al. [20] applied the Super-SBM model and gray theory to forecast the performances in the future to conduct the selection of alliance. The research used historical data from the 20 largest automobile companies in the world. The target decision-making unit (DMU) was Nissan Motor Co., Ltd. The results show that Renault and Daimler are two partners with potential interests for target in all of 19 alliances. Nguyen and Tran [21] established the alliance by combining gray theory and the Super-SBM model to analyze the efficiency before and after the alliance of the steel industry in Vietnam. The results showed that DMU4 (Pomina Steel corporation) is the most suitable partner for the target company. The study proposed a selection model that allows the target company to find the most feasible beneficial alliance partner. Zhang [22] selected six companies as DMUs, adopted the DEA model to analyze the reasons for the poor efficiency of DMU, understood the direction of improvement, and provided a reference for the stability of the alliance. Wang et al. [23] proposed a strategic alliance model that was a hybrid approach model combining gray forecasting with the Super-SBM model to evaluate and forecast the performance of 16 estate companies in Vietnam. The aim was to improve efficiency or the competitiveness for the target company.
Most of previous studies on strategic alliances focused on the performance of the target company combined with the common gray prediction. This study combined the above-mentioned literature discussion and adopted the resampling model to establish a new comprehensive comparison model of strategic alliances. In this study, strategic alliances are defined as “cooperation between independent companies to achieve higher operational performances.” Previous research has discussed strategic alliances constituting the driving force for successful startup and the revenue generation.

3. Materials and Methodologies

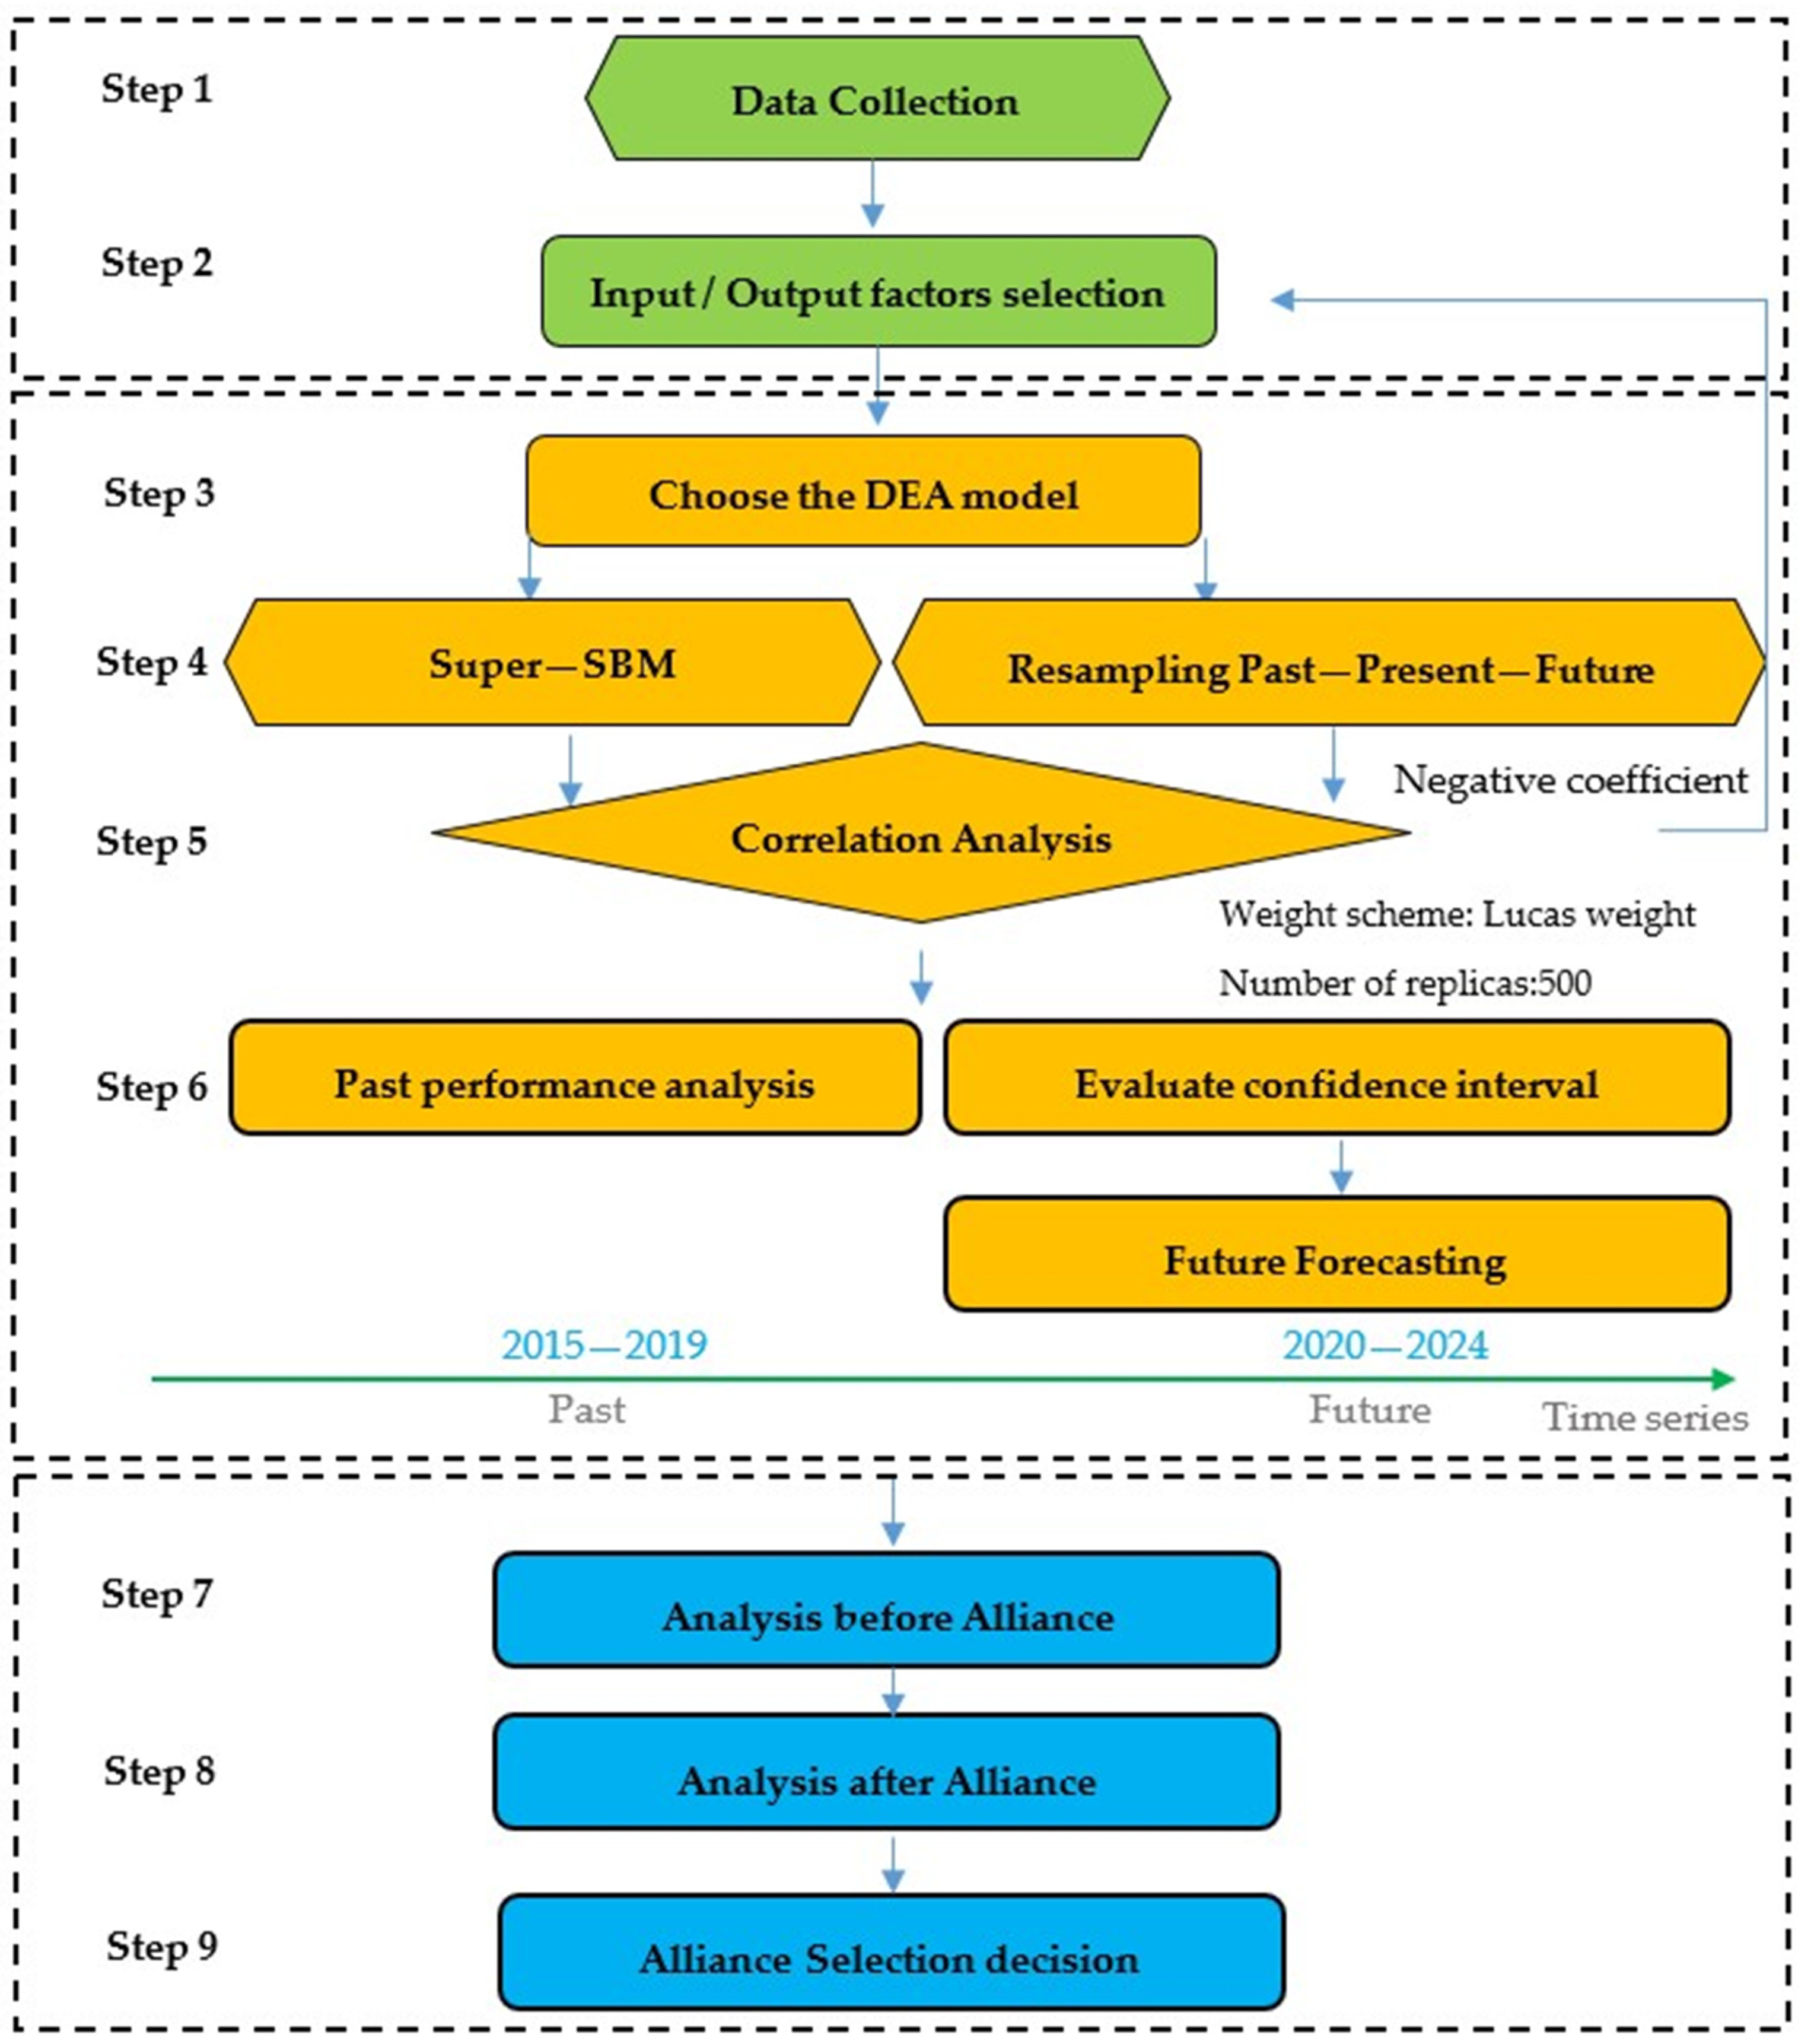
3.1. Research Development

In the study, the researchers applied the resampling model in DEA to establish a systematic forecast and evaluation approach. Figure 1 outlines how to access resampling in DEA through detailed steps to search for alliance partners. The steps involved in data collection and input–output selection constitute the initial work of the study. DEA is a linear programming method. It evaluates the efficiency of DMUs through a structure containing multiple inputs and outputs.
The DEA-Solver software is used for the calculation in the third step. The resampling model is applied to the calculation in Step 4. The correlation coefficient test is applied to check if the values between the input and output are correlated with one another in Step 5. If a negative coefficient appears, the value is deleted, and the process returns to Step 2 to recalculate until the requirement is met. In Step 6, the research uses the Super-SBM model to assess past performance in 2015–2019. Afterward, forecasting using the “Resampling” model is applied to predict data for the years 2020–2024. The results of the prediction are used in the DEA model to measure the efficiency of each DMU during and after the alliance.
The purpose of Step 7 is to calculate the past performance and compare the target company and the other 19 competitors. This is done by applying the resampling model to real data and by ranking the DMUs according to the efficiency acquired. Step 8 was conducted to establish a new alliance by combining the target DMU1 with the other 19 DMUs. After the merger, the new company is compared with the existing company. Suggestions are provided on the basis of the results of the analysis in this step, but they do not necessarily assume feasibility and proceed to further analysis in Step 9. In this step, the researcher carefully studies the candidate companies from different aspects to determine possible alliance methods.

3.2. Data Collection

Twenty IC packaging and testing public companies were exploited. All data were collected from the annual financial statements found in the market observation publishing system, and the collection period was from 2015 to 2019. Table 1 lists the companies that were exemplified. DMU1 ASE (Advanced Semiconductor Engineering, Inc., Kaohsiung city, Taiwan) was used as the target company. ASE is a provider of IC packaging and test services whose headquarters are located in Kaohsiung City, Taiwan. In a stressful and competitive environment, a strategic alliance is the best way to seek resources and to expand businesses.
By referring to the following related literature reviews in Table 2 and the factors of the operation of IC packaging and testing industry, and applying the opposite of DEA (testing correlation between input and output), the researcher decides to exploit four input (I) and two output (O) factors, which are (I) total asset, (I) operating expense, (I) R&D expenses, and (I) employees, and (O) revenue and (O) gross profit, respectively, which are all considered key financial indicators or measures of the performance of the industry directly because they are significant indicators to measure the performance of enterprises both in current and in future situations.

3.3. Nonradial Super Efficiency Model (Super-SBM)

Tone [8] introduced the non-radial slacks-based measure (SBM) of efficiency in 2001. This model is based on a non-radial estimation method, which also considers the difference between input and output items (slacks), and the estimated efficiency value is between 0 and 1. When the efficiency score is equal to 1, it means that this decision-making unit is on the frontier and is without slacks in input or output. The SBM model deals with n DUMs by the input ( m ) and output ( s ) with matrices X = ( X i j ) R m × n and Y = ( Y i j ) R s × n . First, let λ be a non-negative vector in R n . Second, the vectors s R m and s + R s represent the input excess and insufficient input and output factor, respectively. This model provides variable returns on the scale.
The program equation (Equation (1)) and restriction equation (Equation (2)) are presented below:
min ρ = 1 1 m i = 1 m s i / x i 0 1 + 1 s r = 1 s s i + / y i 0
subject to
x 0 = X λ + s , y 0 = Y λ s + , j = 1 n λ j = 1 λ 0 ,       s 0 ,     s + 0
The variables s + and s measure the distance between the input and output of the virtual unit and the evaluated unit. The numerator and denominator in the objective function measure the average distance between the input and output and the efficiency threshold.
In order solve the problem of the SBM efficiency value of multiple decision-making units being the same as 1, Tone [8] proposed a super-efficiency model for DMU efficiency ranking that is based on the SBM model. Let the optimal solution of SBM be ( p , λ n , s , s + ). If p , then DMU ( X 0 , Y 0 ) is SBM-efficient. The condition is equivalent to s = 0 and s + = 0 in any optimal solution, and there is no excessive input or output shortage.
The program equation (Equation (3)) and restriction equation (Equation (4)) are presented below:
min δ = 1 m i = 1 m x ¯ i / x i 0 1 s r = 1 s y ¯ r / y r 0
subject to
x ¯ j = 1 , 0 n λ j x j ,   y ¯ j = 1 , 0 n λ j y j , j = 1 n λ j = 1 y ¯ x 0 ,     y ¯ y 0 ,     y ¯ y ¯ y 0 ,     λ 0
The Super-SBM solves the problem when the SBM model maximum efficiency score is the same as 1. The denominator of program Equation (3) is set equal to 1. The objective function value that is equal to or greater than 1 will returned by the Super-SBM model. The higher the value obtained, the higher the efficiency of the DMU. It performs a more detailed ranking and has a better distinguishing effect. In summary, the SBM model is more suitable for grouping, which distinguishes whether DMU is on frontier rather than ranking due to the maximum efficiency score is 1.

3.4. Resampling Model

The data envelopment analysis calculations still produce some errors in measurement if not done meticulously. To eliminate the measurement errors in the results of data envelopment analysis, Simar and Wilson [29] proposed bootstrap methods for DEA efficiency estimators. It is believed that repeated sampling can obtain the most efficient sample allocations. However, they still have doubts about the method. Although bootstrapping is another resampling method, some observations are treated as resampling of the population, yet it is still impossible to discuss the characteristics of the data. Tone [9] proposed the resampling method named resampling past–present and resampling past–present–future that are based on the resample approach. The past–present model measures the confidence interval of the DEA score over the past and present period on the basis of the super slacks-based measure model (Super-SBM). The past–present–future model is extended to the past–present model. The resampling model mainly discusses input and output measurement error, where repeated sampling has eliminated some empirical distribution errors. This method can also predict the future efficiency of DMU. It can improve the accuracy of prediction better than gray prediction. Since the resampling method considers the characteristics of the data—the lower limit, the upper limit, or the reference weight—it largely eliminates outliers. Thus far, no research has proposed to establish strategic alliance with the resampling model.

3.4.1. Historical (Past–Present)

Let the historical setting of the input and output matrix be ( X t , Y t ) (t = 1,...,t), where t = 1 is the first period and t = t is the last period with X t = ( x 1 t ,…, x n t ) and Y t = ( y 1 t ,…, y n t ). The number of the DMU is n, and x j t R m and y j t R s are the input and output vectors of DMUj, respectively. In terms of the choice of a weighting scheme for historical data, we used the Lucas model to calculate the weight information of the past and the present [9] by setting the weight w t to period t and assuming the weight is rising in t . For this aim, the following Lucas number series ( l 1 , ..., l T ) (a variant of fibonacci series) was a candidate where we had
l t + 2 = l t + l t + 1 ( t = 1 , , T , T 2 ; l 1 = 1 , l 2 = 2 )
Let the sum be L = t = 1 T l t , and weight w t is defined by
w t = l t / L ( t = 1 , , T ) .
In this research, we let t = 5, we had w 1 = 0.0526, w 2 = 0.1053, w 3 = 0.1579, w 4 = 0.2632, and w 5 = 0.4211. Thus, the influence of the past period disappeared gradually.
Super-efficiency scores: applied historical data ( X t , Y t measure ) (t = 1,...,t) to gauge the confidence interval (CI) of the last period’s scores. First, the super-efficiency scores of the last period’s DMUs were evaluated [9]. Then, the CI of DMU was measured using the replicas from ( X t , Y t ) (t = 1,...,t) as follows.
Choice of the replication process and the number of replicas: The historical data ( X t , Y t ) (t = 1, ..., t) were regarded as discrete events with probability w t and cumulative probability:
W t = i = 1 t w i ( t = 1 , , T )
The process of replication based on bootstrapping was first introduced by Efron [30]. Bootstrapping refers to a collection of methods that randomly resample and replace the original sample. In the study, by applying a variant of Bayesian bootstrapping, the weighting scheme is composed of the Lucas number series-based weights w t because it is more suitable for resampling over a past–present time frame and considering the latest information will become more valuable. For a non-correlated and homoscedastic dataset, we can summarize the data generation process (DGP) in this study as follows. First, a random number of ϛ is drawn from the uniform distribution over the interval [0,1], no matter which cross-sectional data ( X t , Y t ) are used in order to resample W t 1 < ϛ < W t , where W 0 = 0. Repeat this process as many times as essential to generate the required number of the valid replicas.

3.4.2. Forecasting (Past–Present–Future Model)

Tone and Ouenniche [9] evaluate the efficiency scores of the future DMUs with their confidence intervals, and the “future” ( X t + 1 , Y t + 1 ) is forecasted by using “past–present” data ( X t , Y t ) ( t = 1 , , T ) .The forecasting and elaboration of the efficiency score of the forecast DMUs are demonstrated as follows: (1) set up h t ( t = 1 , , T ) as the observed historical data for a certain input/output of a DMU, and (2) forecast h T + 1 from h t (t = 1, ..., t).
There are three available forecasting engines for this purpose, which is shown below:
Trend analysis: a simple linear least squares regression.
Weight average: weight by Lucas number.
Average trend and Lucas weight average.
In this part, the “past-present” data ( X t , Y t ) (t = 1,...,t) is applied to predict the “future” ( X t + 1 , Y t + 1 ) and forecast the efficiency scores of the future DMUs along with their confidence intervals. To prevent repetition, hereafter it is necessary to discuss how the past–present time-based framework could be extended to the past–present–future context. Then, it is essential to forecast the future initially; to be more precise, given the observation of previous data ( x i , j t , x r , j t ), t = 1,...,T for a certain input i (I = 1,...,m) and r (r = 1,...,s) of a DMU j (j = 1,...,n), it is expected to forecast ( x i , j T + 1 , x r , j T + 1 ). It estimates the super-efficiency score of the “future” DMU ( X t + 1 , Y t + 1 ), utilizing the non-oriented super slacks-based measure model once these forecasts are acquired. Finally, given the past–present–future inter-temporal dataset ( X t , Y t ) (t = 1, ..., t + 1), we applied the resampling scheme proposed in the previous section and obtained confidence intervals.
The Lucas weight model forecasted the future data by the obtained dataset ( X t + 1 , Y t + 1 ). After that, the super-efficiency was used for the evaluation of the “future” DMU ( X t + 1 , Y t + 1 ). On this basis, the application can be found on the past–present–future period dataset ( X t , Y t ) (t = 1, ..., t + 1).

3.4.3. Fisher’s z Transformation

Calculating the correlation coefficient of two input (outputs and input vs. output) items of the data overall DMUs in the last period is one of the requirements of DEA to confirm that the factors are homogenous and isotonic. Afterward, its ζ% confidence interval, e.g., 95%, is calculated using Fisher’s z transformation [31]. It is a must that the resampled data are deleted if the corresponding correlation of the resampled data is out of range. The same process is performed for all inputs, output pairs, and input and output. Hence, resampling excludes improper sampling in which the input and output are unbalanced relative to the input and output of the previous period. The 95% confidence interval mentioned above is not mandatory. The narrower the interval, the closer the resampling is to the last cycle of data.

4. Empirical Results

4.1. Testing Replicas and Correlation

Table 3 illustrates the process of constructing replicas, and Table 4 and Table 5 evaluate correlation coefficients. Moreover, Table 3 displays the resampling results of 500 and 5000 replicas obtained with a 95% confidence interval. Nevertheless, the number of replicas depends on the number of inputs, outputs, and DMUs [9]. Thence, to check the variations of scores by increasing the number of replicas is necessary. In the study, the results from the data analysis show that the difference was insignificant.
The Pearson correlation coefficients are used to measure the isotonic relationship between input and output. Table 4 shows the average results of Pearson correlation coefficients obtained from the year 2013 to 2017. The correlation between input and output variables are positive and statistically significant at correlation. The Fisher 95% correlation matrix should be asymmetric and based on estimates of undistorted standard errors. Fisher 95% confidence intervals are presented in Table 5. The correlation coefficient is known to slightly underestimate the population correlation due to the asymmetrical being skewed toward zero of the distribution of correlation coefficient. The correlation coefficient implemented in the DEA model represents a linear relationship between input and output factors. The correlation coefficient i is between (−1) and (+1), and the closer the correlation is to (±1), the closer it is to a perfect linear relationship.

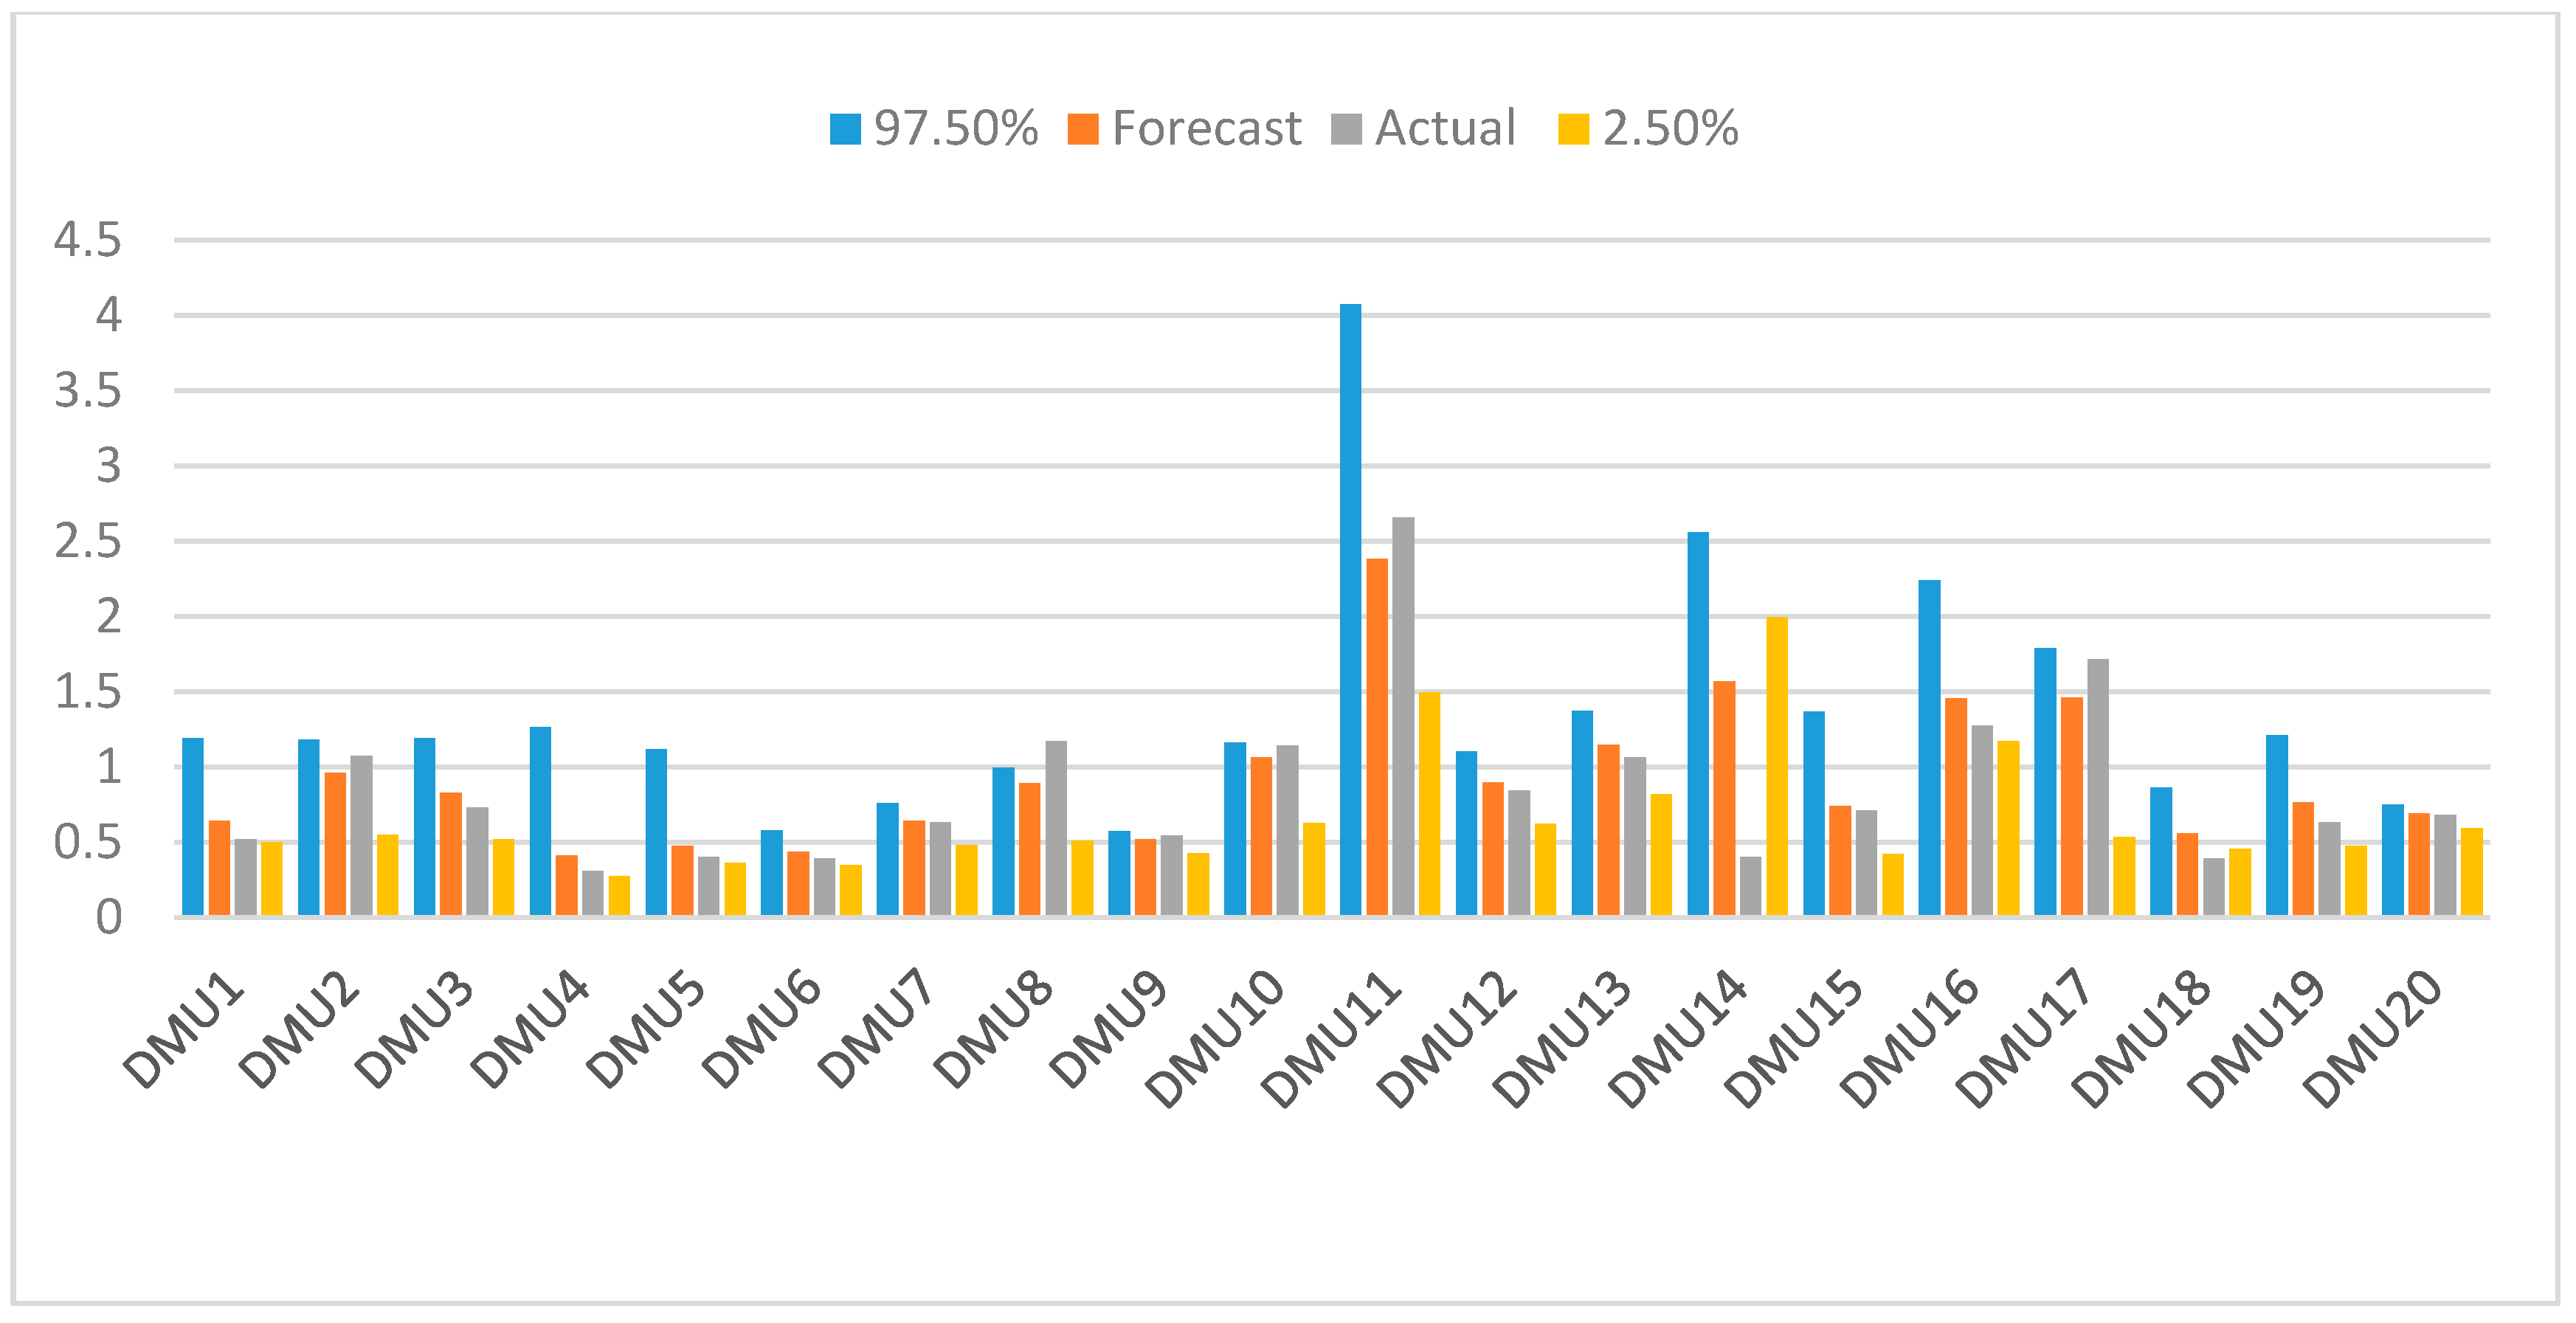
4.2. Past–Present–Future Framework

In this study, the period from 2015 to 2019 was used as the past–present data to predict the 2020 future data. The forecast DEA and confidence intervals from 2021 to 2024 are shown in Appendix Table A1. The prediction results of each DMU and the predicted score, confidence interval, and efficiency ranking in the year 2020 are listed in Table 6. DMU11 ranked first, having the highest efficiency score of 2.2826, with a confidence interval of (97.5–2.50%) 3.293 and 1.586 for predictive performance. The DMU14 ranked second, with a confidence interval (97.5–2.50%) of 2.675 and 0.363, and the average efficiency remaining at 1.635. DMU16 ranked third, while DMU17 ranked fourth, with the average efficiencies remaining at 1.459 and 1.441, respectively. The other three DMUs (DMU4, DMU5, DMU6) had low efficiency scores between 0.392–0.441. DMU4 was ranked last.
The results presented in Figure 2 and Table 6 reveal little difference between the forecast efficiency levels and actual efficiency levels. Among the 20 companies, the actual 2019 scores of 20 DMUs in the 95% confidence interval are included. Table 7 points out the results of a basic indicator in 2019 for the input/output of each DMU. Simultaneously, the authors added the actual Super-SBM score for 2019 to compare the real data and forecast data. The average of actual forecast over the 20 companies was 0.063 (6.3%). The difference between the forecast ranking and the actual ranking of most companies remained at a similar level to the actual. However, DMU4 dropped from the original 2nd place to 16th, and DMU8 rose from 9th to 4th.

4.3. Analysis before Alliance

Table 8 shows the changes in the efficiency of 20 IC packaging and testing companies from 2015 to 2019. The results of the efficiency before alliance are calculated by the Super-SBM model. The efficiency scores and rankings change to varying degrees each year. Comparing the results through the five-year average, we found the average score in 2017 to be the highest at 1.2887. The average for 2015 was the lowest at 1.2092.
The results of future efficiency and ranking before strategic alliance are shown in Table 9. The results show that DMU11 ranked first and had the best efficiency score of 2.2826. This was followed by DMU14 and DMU17, ranking second and the third, respectively. However, the target DMU1 ranked 15th. This ranking once again proved the target company needs to conduct strategic alliance to improve performance.

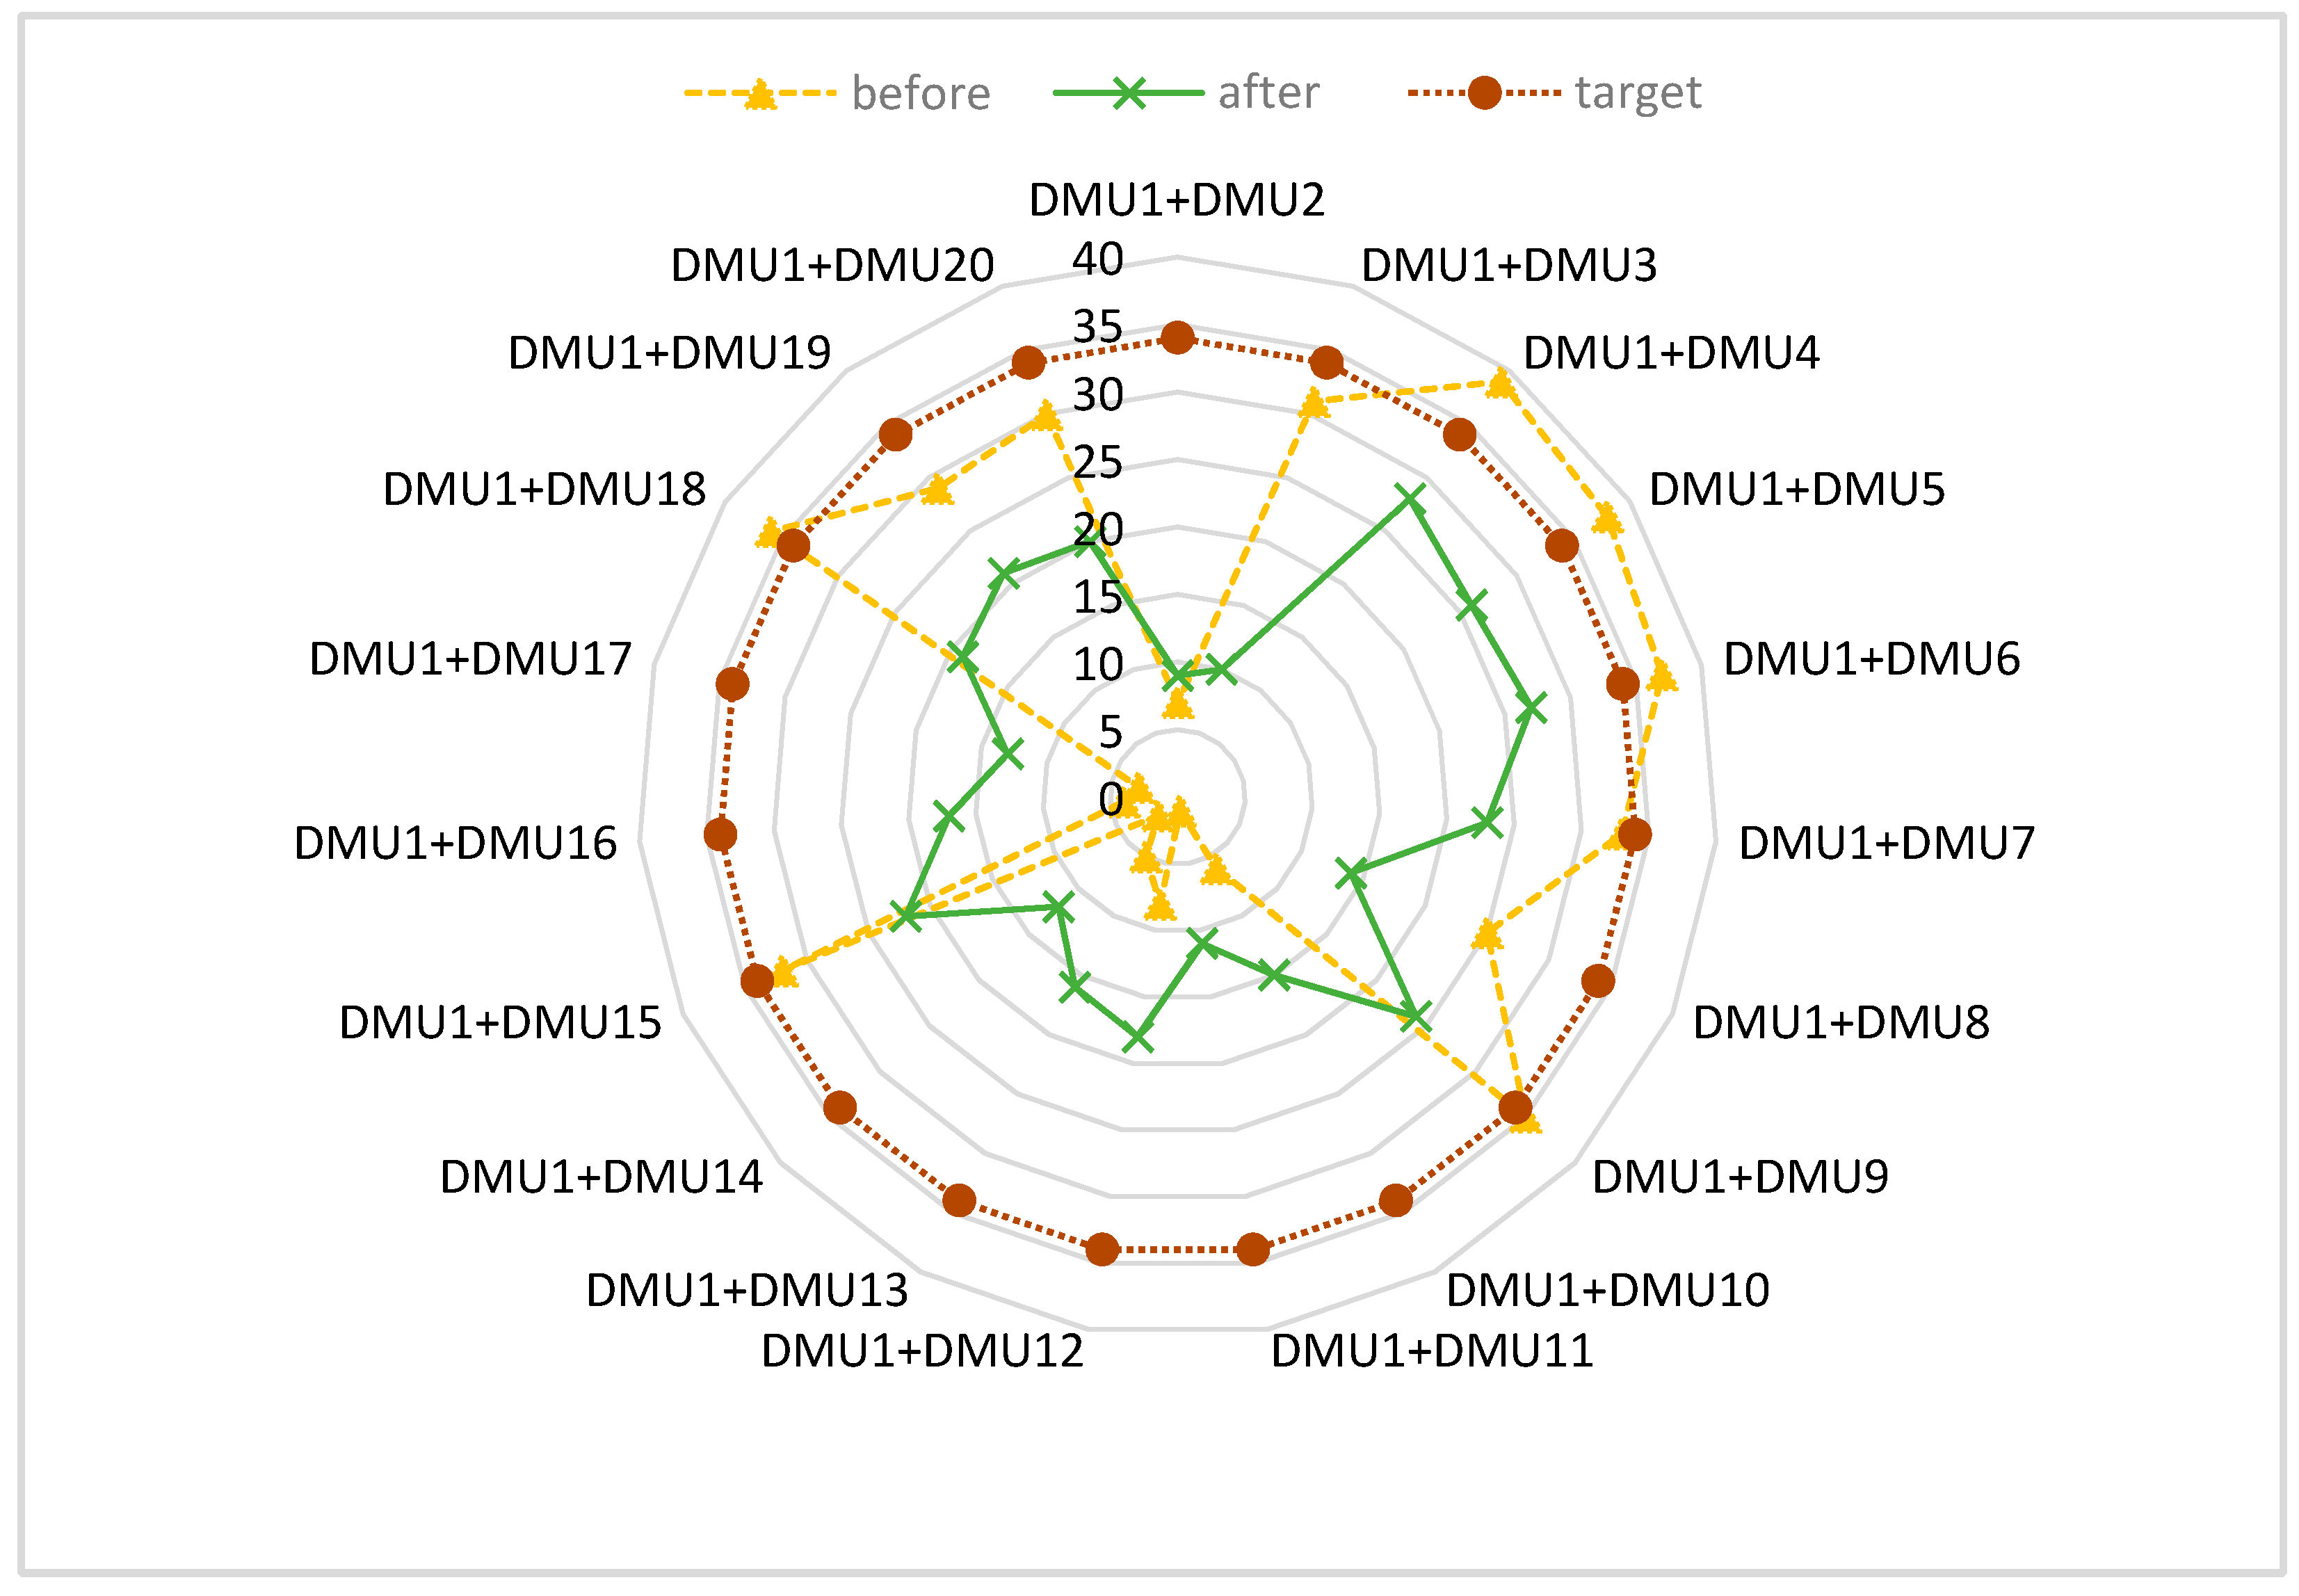
4.4. Analysis after Alliance

By combining DMU1 with the remaining DMUs, it formed 39 strategic alliances. The resampling model was selected to calculate the operating efficiency of 39 new DMUs and establish the strategic alliance efficiency comparative evaluation model. Table 10 shows the predicted strategic alliance rankings and scores for 2020–2024.
The results show that DMU1 + DMU2, DMU1 + DMU3, DMU1 + DMU11, and DMU1 + DMU14 are the most effective alliances (score > 1). The target company will have improvement when establishing an alliance with these companies. The target DMU ranked 34, with an average score of 0.615. DMU1 + DMU2, DMU1 + DMU3, DMU1 + DMU11, and DMU1 + DMU14 are effective alliances (score > 1). Therefore, the target company will be highly appreciated if they consider forming strategic alliances with these four candidates.

4.5. Alliance Selection Decision

The result of the strategic alliance revealed the effective change difference of the strategic alliance compared with the target DMU1. The research puts forward a “Comparative Evaluation” model = “the ranking of partner company (RP)”—“the ranking of the alliance (RA)”. The comparison is divided into two groups. The positive results of the comparison show that the league’s performance is better than the original league. The larger the comparison value, the higher the efficiency of the alliance group. On the contrary, a negative result means that the alliance is invalid. The result of “comparison” is presented in Table 11.
In order to establish the strategic alliance, we set the DMU1 (ASE) as the target company to establish strategic alliance with other companies in the same industry. After the establishment of strategic alliances, a total of 39 alliances were formed, and the specific results were divided into the groups “effective” or “ineffective”. There were 11 companies placed in the “effective” group, which can achieve dual progress (a “win–win situation”). These alliances can improve the performance of the target and partner companies simultaneously. The DMU3 is the best potential candidate for strategic alliances due to it having the greatest progress. There were eight companies placed in the “ineffective” group, including (DMU2, DMU10, DMU11, DMU14, DMU17, DMU12, DMU13, and DMU16). The alliance between DMU1 and DMU16 ranked 17th, which is indeed improved compared to the ranking of the target company. However, the ranking of the alliance partner (DMU16) dropped sharply from 4th to 17th, making it the lowest efficiency after the alliance. Those companies will be reluctant to cooperate with the target company because only the target company unilaterally aims to improve its operational performance while reducing its performance. The established alliances of the target and DMU2, DMU3, DMU11, and DMU14 were found to be the most effective alliances. However, only the alliance between DMU1 and DMU3 was in the “effective” group, which means that both efficiency and willingness to cooperate may be increased. As for the other three alliances marked as “ineffective”, they may only be willing to cooperate unilaterally, because the alliance increases the performance of the target company but the performance of the partner company declines.
The radar comparison chart in Figure 3 more obviously illustrates the change in the ranking of the above DMUs before and after alliance. In the radar chart, those points closer to the center are ranked higher. The green line was nearer to the center point than the yellow line in most DMUs. Combined with Table 10, there were 11 alliances in the “effective” group, i.e., DMU1 + DMU3, DMU1 + DMU18, DMU1 + DMU5, DMU1 + DMU4, DMU1 + DMU8, DMU1 + DMU9, DMU1 + DMU6, DMU1 + DMU7, DMU1 + DMU15, DMU1 + DMU20, and DMU1 + DMU19. The green point of these alliances was closer to the center than the yellow point in the radar chart. The alliances in the “ineffective” group were DMU1 + DMU2, DMU1 + DMU10, DMU1 + DMU11, DMU1 + DMU12, DMU1 + DMU14, DMU1 + DMU17, DMU1 + DMU13, and DMU1 + DMU16. The yellow point was closer to the center than the green point in the radar chart. Obviously, the efficiency of both the target and partners improved at the same time.
The previous studies usually required a combination of different methods—for example, the combination of DEA and gray models. The gray prediction model parameters are estimated by the least squares method, which will produce biased estimates when the system is disturbed. Even though the gray model can achieve a good prediction effect on less data and information, the shortcoming in the gray model is the background value, which is not sufficient. Gray prediction does not take the characteristics of data into account. However, resampling improves the accuracy of forecasting as the resampling method considers the characteristics of the data. Previous research focuses on the performance evaluation of the target company rather than partners. The Super-SBM model is suitable for more detailed efficiency rankings. The resampling past–present–future model extends the past–present (Super-SBM) model. Therefore, this study uses resampling to predict and establish alliances, which is an alternative method. On the basis of the above information, this research extended the basis of previous studies. Thus far, there is no research to establish strategic alliances with resampling prediction models. This study proposed a new comparative evaluation model for strategic alliances, not only from the perspective of the target company but also from the perspective of the partner company. Companies can compare the efficiency of both sides simultaneously. In short, the results and findings of the research also lead to new suggestions for strategic alliance.

5. Conclusions

This study put forward a comparative evaluation for a strategic alliance and combined it with the resampling model in the DEA. The study evaluated past performance before the alliance, and future efficiency after the alliance. For the empirical research, we selected 20 companies from the IC packaging and testing industry as DMUs. In addition, four inputs and two outputs were collected as variables, with the period of data collection being from 2015 to 2020. The Super-SBM model was used to measure the performance before the alliance in the period ranging from 2015 to 2019. The resampling past–present–future model was used to predict the performance in 2020–2024. The reasons that cause the failure of alliances are that each partner tries to maximize its individual benefit instead of their collaborative benefit. Furthermore, the results also show that only some of the alliances are beneficial, implying that prudence is still required when entering into strategic alliances. Suitable partnership of alliance is the key point of strategic alliance. Therefore, it is necessary to conduct a comprehensive comparison using a systematic approach.
Most of the previous studies cited in the second chapter only focused on the analysis of the target company, but this has overlooked the evaluation of the partners. The model proposed in the study and the method of combining resampling have never been discussed in previous studies. The study combined the above-mentioned literature discussion to carry out the extension, establishing a new comprehensive comparison model that combines resampling in order to forecast and evaluate the performance of strategic alliances. The proposed method provides a reference for enterprises in the future development strategies and competition.
The contributions of the study are summarized as follows:
  • The study conducted a new comparative evaluation of the IC packaging and testing industry. In the past, previous studies were scarce regarding the IC packaging and testing industry.
  • The study conducted an evaluation of the IC packaging and testing industry that considered the past, current, and future performance comprehensively, not only to comprehend the past performance of these companies, but also to predict future performance.
  • The study applied the resampling model in DEA to establish the strategic alliance instead of grey prediction, which was more commonly used. The resampling model can evaluate the past and present, as well as predict future performance. Compared with grey prediction, the resampling method reduces the influence of outliers and considers the characteristics of the data between various industries.
  • The previous studies on strategic alliances focus on the alliance performance of the target company, ignoring the cooperative company. This research provides a comparative evaluation model that can compare the performance between target and partners. It not only looks for progressive alliances, but also separates unilateral and dual progressive alliances.
The combination of resampling DEA and strategic alliance is a very rare model. Therefore, there are some restrictions. The choice of input and output variables does not seem to fully reflect the overall situation of the IC packaging and testing industry. Therefore, the limited number of DMUs and input/output variables may leave room for further discussion. More variables of input/output (such as liabilities, number of branches, EPS (Earnings Per Share), and R&D) can be discussed carefully, and a larger number of different factors can be evaluated in future research to ensure that these factors have the right influence on the industry and are useful for evaluating the company’s operational performance. This study mainly focused on the IC packaging and testing industry. When this method is applied to other industries, it is necessary that the input and output factors are reselected because of the different background values of different industries.
The research can be updated with new and more effective DEA models that predict the industry and discover more changes and important issues. Future research could examine new methods on the basis of this study, which can be done to benefit other types of industries.

Author Contributions

Conceptualization, C.-N.W.; data curation, Y.-C.P.; formal analysis, Y.-H.W.; investigation, M.-H.H.; methodology, C.-N.W. and Y.-C.P.; software, Y.-H.W.; validation, M.-H.H.; project administration, C.-N.W. All authors have read and agreed to the published version of the manuscript.

Funding

This research was partly supported by the National Kaohsiung University of Science and Technology, and MOST 109-2622-E-992-026 from the Ministry of Sciences and Technology in Taiwan.

Acknowledgments

The authors would like to express our gratitude to National Kaohsiung University of Science and Technology, Ministry of Sciences and Technology in Taiwan.

Conflicts of Interest

The authors declare no conflict of interest.

Abbreviations

The abbreviations and acronyms used in this article are listed below:
ICintegrated circuit
DEAdata envelopment analysis
FMSflexible manufacturing system
AMTadvanced manufacturing technologies
R&Dresearch and development
OSAToutsourced semiconductor assembly and test

Appendix A

Table A1. 2021–2024 forecast DEA and confidence intervals.
2021 2022 2023 2024
DMU97.50%DEAAvg2.50%Rank97.50%DEAAvg2.50%Rank97.50%DEAAvg2.50%Rank97.50%DEAAvg2.50%Rank
DMU11.1040.6210.6210.489151.10.6130.6250.512150.8380.610.6220.544150.8170.6140.6210.55215
DMU21.11.0541.0180.59871.0861.0571.0541.03471.0761.0581.0581.04271.0641.0561.0561.0497
DMU31.1760.7230.7650.587101.1570.7220.740.627111.1620.7250.7440.669110.7590.7270.7340.69211
DMU40.4250.3610.3620.29200.3950.360.360.324200.3860.3580.3590.334200.3760.3590.3580.34120
DMU50.5520.3840.4080.316190.4830.380.3870.34190.440.3720.3760.338190.3960.3720.3740.3519
DMU60.5660.4450.4340.336180.5170.4510.440.356180.4940.4550.4460.379180.4650.4550.4490.41118
DMU70.830.6540.6390.498140.7990.6480.6410.529140.7830.6510.6480.56140.7770.6560.6560.60314
DMU81.2410.9390.9290.59281.1810.9430.9290.60291.1460.9650.950.79991.1380.9710.9660.839
DMU90.5820.5250.5210.456160.5610.5250.5220.472160.5590.5280.5260.495160.5530.5280.5290.50816
DMU101.2071.1221.1060.68561.1951.1251.1271.06961.1791.1261.131.08361.1651.1261.1271.0996
DMU112.8352.3032.3271.82712.6742.2892.31.94612.6232.32.3132.04912.5172.2922.2952.1761
DMU121.1641.040.9290.61591.1221.0380.9680.65281.0981.0380.9980.69981.0891.0381.0330.868
DMU131.3491.1971.1621.02451.321.1911.1781.07451.2561.1811.1791.10151.2421.1811.1791.1045
DMU142.5981.6951.6280.3722.5171.691.6840.422.3451.6811.6380.40521.7361.6771.6480.4182
DMU151.3430.6930.7170.477120.9850.6950.6990.533130.8260.6990.6950.62130.7680.6990.70.65913
DMU162.1521.3851.421.15742.1131.3861.4091.22641.4591.3891.3921.27541.431.3841.3821.2914
DMU171.7571.4841.4620.69331.6591.4841.4791.32631.641.4961.4931.37831.6291.4871.4881.393
DMU180.7170.4740.5070.376170.6720.4750.4940.399170.5380.4730.4750.41170.5190.4740.4750.42217
DMU191.0790.7740.7440.488111.070.7770.760.597101.0520.7750.7690.663100.8090.7720.7690.68610
DMU201.0750.7330.70.547130.7810.730.7040.564120.7550.730.7150.585120.7450.7310.7260.67712

References

  1. Development, Y. Status of the Advanced Packaging Industry. 2019. Available online: Https://Yole-I-Micronews-Com.Osu.Eu-West-2.Outscale.Com/Uploads/2019/2007/Yole_Yd19030_Status-Of-The-Advanced-Packaging-Industry-12019_Sample.Pdf (accessed on 2 May 2020).
  2. Technology, A. Annual Report Pursuant to Section 13 Or 15(D). 2017. Available online: https://www.sec.gov/files/form10-k.pdf (accessed on 7 June 2020).
  3. Advanced Semiconductor Engineering Technology Holding Co., Ltd. 2020 Q1 Earnings Conference Call/Webcast. 2020. Available online: http://ir.aseglobal.com/html/ir_events_details.php?id=15032 (accessed on 7 June 2020).
  4. Park, S.H.; Ungson, G.R. Interfirm Rivalry and Managerial Complexity: A Conceptual Framework of Alliance Failure. Organ. Sci. 2001, 12, 37–53. [Google Scholar] [CrossRef]
  5. Farrell, M.J. The Measurement of Productive Efficiency. J. R. Stat. Soc. Ser. A (Gen.) 1957, 120, 253–290. [Google Scholar] [CrossRef]
  6. Charnes, A.; Cooper, W.W.; Rhodes, E. Measuring the Efficiency of Decision Making Units. Eur. J. Oper. Res. 1978, 2, 429–444. [Google Scholar] [CrossRef]
  7. Tone, K. Slacks-Based Measure of Efficiency. In Handbook on Data Envelopment Analysis; Springer: Berlin/Heidelberg, Germany, 2011; pp. 195–209. [Google Scholar] [CrossRef]
  8. Tone, K. A Slacks-Based Measure of Efficiency in Data Envelopment Analysis. Eur. J. Oper. Res. 2001, 130, 498–509. [Google Scholar] [CrossRef] [Green Version]
  9. Tone, K.; Ouenniche, J. Dea Scores’ Confidence Intervals with Past-Present and Past-Present-Future Based Resampling. Am. J. Oper. Res. 2016, 6, 121–135. [Google Scholar] [CrossRef] [Green Version]
  10. Wang, C.-N.; Le, A.L. Measuring the Macroeconomic Performance among Developed Countries and Asian Developing Countries: Past, Present, and Future. Sustainability 2018, 10, 3664. [Google Scholar] [CrossRef] [Green Version]
  11. Lo Storto, C. A Double-Dea Framework to Support Decision-Making in the Choice of Advanced Manufacturing Technologies. Manag. Decis. 2018, 56. [Google Scholar] [CrossRef]
  12. Kozmetsky, G.; Yue, P. Comparative Performance of Global Semiconductor Companies. Omega 1998, 2, 153–175. [Google Scholar]
  13. Bamford, J.D.; Gomes-Casseres, B.; Robinson, M.S. Mastering Alliance Strategy: A Comprehensive Guide to Design, Management, And Organization; John Wiley & Sons: Hoboken, NJ, USA, 2003. [Google Scholar] [CrossRef]
  14. Chan, S.H.; Kensinger, J.W.; Keown, A.J.; Martin, J.D. Do Strategic Alliances Create Value? J. Financ. Econ. 1997, 46, 199–221. [Google Scholar] [CrossRef]
  15. Cravens∗, D.W.; Shipp, S.H.; Cravens, K.S. Analysis of Co-Operative Interorganizational Relationships, Strategic Alliance Formation, and Strategic Alliance Effectiveness. J. Strateg. Mark. 1993, 1, 55–70. [Google Scholar] [CrossRef]
  16. Vanhaverbeke, W.; Duysters, G.; Noorderhaven, N. External Technology Sourcing Through Alliances or Acquisitions: An Analysis of The Application-Specific Integrated Circuits Industry. Organ. Sci. 2002, 13, 714–733. [Google Scholar] [CrossRef] [Green Version]
  17. Parkhe, A. Understanding Trust in International Alliances. J. World Bus. 1998, 33, 219–240. [Google Scholar] [CrossRef]
  18. Ahern, K.R. Bargaining Power and Industry Dependence in Mergers. J. Financ. Econ. 2012, 103, 530–550. [Google Scholar] [CrossRef]
  19. Hamel, G. Collaborate with Your Competitors and Win. Harv. Bus. Rev. 1989, 67, 133–139. [Google Scholar]
  20. Wang, C.-N.; Nguyen, X.-T.; Wang, Y.-H. Automobile Industry Strategic Alliance Partner Selection: The Application of a Hybrid Dea And Grey Theory Model. Sustainability 2016, 8, 173. [Google Scholar] [CrossRef] [Green Version]
  21. Nguyen, N.; Tran, T.-T. A Two-Stage Study of Grey System Theory and dea In Strategic Alliance: An Application in Vietnamese Fertilizing Industry. Int. J. Adv. Appl. Sci. 2018, 5, 73–81. [Google Scholar] [CrossRef]
  22. Yi, Z. Research of Strategic Alliance Stable Decision-Making Model Based on Rough Set and dea. Telkomnika Indones. J. Electr. Eng. 2013, 11, 7295–7301. [Google Scholar] [CrossRef]
  23. Wang, C.-N.; Hsu, H.-P.; Wang, J.-W.; Kao, Y.-C.; Nguyen, T.-P. Strategic Alliance for Vietnam Domestic Real Estate Companies Using A Hybrid Approach Combining Gm (1, 1) With Super Sbm Dea. Sustainability 2020, 12, 1891. [Google Scholar] [CrossRef] [Green Version]
  24. Hsu, L.-C. Using a Decision-Making Process to Evaluate Efficiency and Operating Performance for Listed Semiconductor Companies. Technol. Econ. Dev. Econ. 2014, 21, 1–31. [Google Scholar] [CrossRef] [Green Version]
  25. Chiu, C.-R.; Fang, C.-L.; Tsang, S.-S.; Chen, Y.-F. Performance Evaluation of The Semiconductor Industry Based on A Metafrontier Approach. Technol. Econ. Dev. Econ. 2018, 24, 825–843. [Google Scholar] [CrossRef] [Green Version]
  26. Wu, W.Y.; Tsai, H.J.; Cheng, K.Y.; Lai, M. Assessment of Intellectual Capital Management in Taiwanese Ic Design Companies: Using Dea and the Malmquist Productivity Index. RD Manag. 2006, 36, 531–545. [Google Scholar] [CrossRef]
  27. Lu, W.-M.; Hung, S.-W. Assessing the Performance of a Vertically Disintegrated Chain by The Dea Approach–A Case Study of Taiwanese Semiconductor Firms. Int. J. Prod. Res. 2010, 48, 1155–1170. [Google Scholar] [CrossRef]
  28. Wang, C.; Ho, H.T. The Selection Strategic Alliance Partner in Semiconductor Manufacturing Industry Based on Grey System and Dea. In Proceedings of the 2016 International Conference on Computational Intelligence and Applications (Iccia), Jeju, Korea, 27–29 August 2016; pp. 83–87. [Google Scholar]
  29. Simar, L.; Wilson, P.W. Sensitivity Analysis of Efficiency Scores: How to Bootstrap in Nonparametric Frontier Models. Manag. Sci. 1998, 44, 49–61. [Google Scholar] [CrossRef] [Green Version]
  30. Efron, B. Bootstrap Methods: Another Look at the Jackknife. In Breakthroughs in Statistics; Springer: Berlin/Heidelberg, Germany, 1992; pp. 569–593. [Google Scholar] [CrossRef]
  31. Fisher, R.A. On the Interpretation of Χ 2 from Contingency Tables, and the Calculation of P. J. R. Stat. Soc. 1922, 85, 87–94. [Google Scholar] [CrossRef]
Figure 1. Research development.
Applsci 11 00204 g001
Figure 2. The confidence interval, forecast score, and actual 2019 score forecast by Lucas model.
Applsci 11 00204 g002
Figure 3. Radar comparison chart.
Applsci 11 00204 g003
Table 1. List of decision making units (DMUs).
DMUSName of Companies
DMU1ASE
DMU2Amkor
DMU3Powertech Technology
DMU4Tongfu Microelectronics
DMU5Tianshuihuatian Microelectronics
DMU6UTAC
DMU7King Yuan Electronics
DMU8Chipbond Technology
DMU9Chipmos Technologies
DMU10Orient IC Electronics
DMU11SFA Semicon
DMU12AOI Electronics
DMU13Greatek Elec
DMU14Unisem Berhad
DMU15Sigurd Microelectronics
DMU16Formosa Advanced Technologies
DMU17Hana Micron
DMU18Walton Advanced Engineering
DMU19Ardentec
DMU20Tong Hsing
Table 2. List of input and output factors from previous studies.
Author(s)InputOutput
Hsu [24]total assets; operating expense; administrative
expenses; inventory
total revenue; net sales
Chiu et al. [25]fixed assets; employees; R&D expense; cost of salesnet sales; market value
Wu et al. [26]employees; R&D expense; patents; R&D employees;
operating cost
net sales; intellectual capital stocks; changes in intellectual capital stocks
Lu and Hung [27]assets; employees; equityrevenue; profit; EPS
Wang and Ho [28]fixed assets; cost of goods sold; R&D expense;
operating expense
net income; revenue;
retained earnings
Table 3. Comparisons of 5000 and 500 replicas (Fisher 95%) for the period of 2015 to 2019.
DMU5000 Replica500 ReplicaDifference
97.50%DEA2.50%97.50%DEA2.50%97.50%2.50%
DMU11.1510.6450.4651.1540.6450.4580.003−0.007
DMU21.1061.0510.5691.1071.0510.5540.001−0.015
DMU31.20.7370.5541.2190.7370.5420.019−0.012
DMU40.570.3740.2670.5850.3740.2690.0150.002
DMU51.1310.4090.2911.1520.4090.2710.021−0.020
DMU60.5990.4450.3280.5780.4450.322−0.021−0.006
DMU71.0720.6570.4671.0420.6570.456−0.030−0.012
DMU81.2520.9310.5491.2840.9310.5260.032−0.023
DMU90.5910.5390.4430.5950.5390.4340.005−0.008
DMU101.2531.1210.5261.2351.1210.512−0.018−0.014
DMU113.2932.1041.5863.1692.1041.569−0.124−0.017
DMU121.1761.0430.5621.1711.0430.568−0.0050.006
DMU131.3981.1960.8551.3871.1960.812−0.011−0.044
DMU142.6751.7050.3652.6641.7050.365−0.0110
DMU151.4410.6920.3921.4040.6920.393−0.0370.002
DMU162.311.41.1442.251.41.127−0.060−0.018
DMU171.8751.3810.5411.9011.3810.5390.026−0.002
DMU181.2520.5290.3511.2820.5290.3530.030.002
DMU191.140.7770.471.1510.7770.4550.011−0.015
DMU201.0950.7310.511.0930.7310.513−0.0020.004
Table 4. Average of Pearson correlation coefficients of inputs and outputs from 2015 to 2019.
TAOERDEPREVGP
TA10.9880.9890.9750.9960.991
OE0.98810.9750.9820.9930.981
RD0.9890.97510.9570.9820.973
EP0.9750.9820.95710.980.968
Rev0.9960.9930.9820.9810.993
GP0.9910.9810.9730.9680.9931
Table 5. Lower/upper bounds of Fisher 95% confidence for the correlation matrix.
Lower Bounds
TAOERDEPREVGP
Upper boundsTA 0.9720.9720.9360.990.987
OE0.9958 0.9370.9610.9840.971
RD0.99580.99 0.8930.9540.938
EP0.99020.9940.983 0.9490.925
Rev0.99840.9980.9930.992 0.989
GP0.9980.9960.990.9880.998
Table 6. 2020 forecast data by Lucas, data envelopment analysis (DEA) score, and ranking.
DMUForecast DEA and Confidence IntervalForecast Data by Lucas Case
97.50%DEAAverage2.50%Rank(I)TA(I)OE(I)RD(I)Ep(O)Rev(O)GP
DMU11.1510.6450.6390.4661516,090.44974.17504.1585,30211,887.871962.93
DMU21.1151.0520.960.56974514.61414.11112.8332,8504071.86680.56
DMU31.1970.7370.8290.559103301.57124.0758.2112,938.842062.03411.7
DMU40.570.3740.3920.267202028.84126.2476.9411,015.951023.05148.62
DMU51.1380.4090.4410.286181712.4892.2847.9713,182.531047.08117.46
DMU60.6010.4490.4360.332191485.05153.3915.2810,519.37752.67138.4
DMU71.0720.6570.6450.467141604.8988.2630.195999.16735.18202.36
DMU81.2380.9310.9040.54581267.0649.6313.584803.68616.51179.86
DMU90.5920.5390.5160.444171097.4849.38315996.63622.33120.35
DMU101.2491.1211.0770.5196543.5329.368.626307.26527.5840.24
DMU113.2932.1042.3671.5861574.4521.241.71677.37449.9640.15
DMU121.1761.0430.90.5659499.1934.4811.712429.84395.7878.95
DMU131.4121.1961.140.8435614.2514.56.563039.74388.4599.38
DMU142.6751.7051.6350.3632431.3943.923.186791.79318.11135.09
DMU151.4260.6920.7430.39212678.2823.568.642933.74286.4582.92
DMU162.3061.41.4591.143414.636.322.652402291.9851.54
DMU171.8741.3811.4410.5414530.8136.965.61834.05383.9565.57
DMU181.240.5290.5570.34816552.8912.972.262825.95259.2718.82
DMU191.140.7770.760.4711571.6428.1410.512225.11257.3681.35
DMU201.0970.7310.6840.51213424.8323.213.563030.37247.9458.44
Table 7. Forecast DEA scores, actual (2019), and confidence interval by Lucas weighted model.
DMU97.50%Forecast 2019Actual 20192.50%
AverageRankAverageRank
DMU11.18840.6423140.76120.499
DMU21.18110.960371.476280.5485
DMU31.1920.8281101.4438100.5184
DMU41.26340.408200.4299200.2746
DMU51.11520.4751180.5423180.363
DMU60.5770.4346190.4607190.3484
DMU70.75870.6386150.6852130.4789
DMU80.99430.892891.4383110.5101
DMU90.5720.5168170.5694160.4224
DMU101.15791.064361.220150.6235
DMU114.07072.381712.889221.4945
DMU121.10290.895781.122460.6215
DMU131.37121.143651.074740.8151
DMU142.55751.56921.392711.9958
DMU151.36670.7365120.75170.4198
DMU162.23691.453241.392731.168
DMU171.78841.457231.83990.5341
DMU180.86220.5594161.4692150.4537
DMU191.21150.7629110.7323140.4722
DMU200.74990.6895131.069570.5915
Table 8. Efficiency and ranking before strategic alliance.
DMU20152016201720182019
DMU10.84450.8830.91250.7830.76
DMU21.19891.38941.07861.51271.4762
DMU31.24131.25331.20581.17361.4438
DMU40.3710.47080.55710.52980.4299
DMU50.54930.61530.72920.61480.5423
DMU61.65210.46392.90010.69710.4607
DMU70.7231.05541.07610.63020.6852
DMU80.79830.79731.32190.85741.4383
DMU90.72170.62640.55240.59240.5694
DMU101.31581.20061.09451.19611.2201
DMU112.53222.76632.51892.58612.8892
DMU121.18271.12461.08761.04591.1224
DMU131.14371.23341.19991.23491.0747
DMU143.62292.87243.29272.96551.3927
DMU150.83520.87481.40450.68750.75
DMU161.62041.52871.4242.30441.3927
DMU171.30451.49491.16281.70851.839
DMU180.80220.65980.70850.71231.4692
DMU191.05950.72510.77810.87350.7323
DMU200.66540.71640.76991.02421.0695
AVG1.20921.13761.28871.18651.1379
Table 9. Future efficiency and ranking before strategic alliance.
DMUAverageRankDMUAverageRank
DMU112.28261DMU200.730511
DMU141.68392DMU30.72612
DMU171.48273DMU150.697913
DMU161.3874DMU70.653714
DMU131.18475DMU10.61515
DMU101.12526DMU90.52816
DMU21.05617DMU180.476717
DMU121.03868DMU60.452218
DMU80.96029DMU50.376919
DMU190.77410DMU40.360220
Table 10. Efficiency and ranking after strategic alliance.
RankDMUAverageRankDMUAverage
1DMU112.282621DMU1 + DMU190.9765
2DMU141.683922DMU1 + DMU150.9746
3DMU171.482723DMU1 + DMU70.9729
4DMU161.38724DMU1 + DMU90.9698
5DMU131.184725DMU80.9602
6DMU101.125226DMU1 + DMU50.9564
7DMU21.056127DMU1 + DMU60.9484
8DMU121.038628DMU1 + DMU40.9348
9DMU1 + DMU21.034529DMU190.774
10DMU1 + DMU31.025330DMU200.7305
11DMU1 + DMU111.004731DMU30.726
12DMU1 + DMU141.004332DMU150.6979
13DMU1 + DMU170.997733DMU70.6537
14DMU1 + DMU80.995634DMU10.615
15DMU1 + DMU100.994135DMU90.528
16DMU1 + DMU130.993236DMU180.4767
17DMU1 + DMU160.990237DMU60.4522
18DMU1 + DMU120.987238DMU50.3769
19DMU1 + DMU180.978439DMU40.3602
20DMU1+DMU200.9784
Table 11. The effective and ineffective alliance partnerships.
DMURPRAComparison
Effective
DMU1 + DMU3311021
DMU1 + DMU18361917
DMU1 + DMU5382612
DMU1 + DMU4392811
DMU1 + DMU8251411
DMU1 + DMU9352411
DMU1 + DMU6372710
DMU1 + DMU7332310
DMU1 + DMU15322210
DMU1 + DMU20302010
DMU1 + DMU1929218
Ineffective
DMU1 + DMU279−2
DMU1 + DMU10615−9
DMU1 + DMU11111−10
DMU1 + DMU12818−10
DMU1 + DMU14212−10
DMU1 + DMU17313−10
DMU1 + DMU13516−11
DMU1 + DMU16417−13
Publisher’s Note: MDPI stays neutral with regard to jurisdictional claims in published maps and institutional affiliations.

