Article

Characterization of Magnetite–Silica Magnetic Fluids by Laser Scattering

by
Elena N. Velichko
1,*,
Elina K. Nepomnyashchaya
1,*,
Kamil G. Gareev
2,
Javier Martínez
3 and
Marco C. Maicas
3
1
Institute of Physics, Nanotechnology and Telecommunications, Peter the Great St. Petersburg Polytechnic University, 195251 Saint Petersburg, Russia
2
Department of Micro and Nanoelectronics, Saint Petersburg Electrotechnical University “LETI”, 197376 Saint Petersburg, Russia
3
Institute for Optoelectronics and Microtechnologies (ISOM), Universidad Politécnica de Madrid, 28040 Madrid, Spain
*
Authors to whom correspondence should be addressed.
Appl. Sci. 2021, 11(1), 183; https://doi.org/10.3390/app11010183
Submission received: 28 November 2020 / Revised: 19 December 2020 / Accepted: 24 December 2020 / Published: 27 December 2020
(This article belongs to the Special Issue Nanocomposite Materials: Synthesis, Properties and Applications)

Abstract

:
The paper is concerned with structural, morphological and magnetic properties of magnetite-silica magnetic fluids. The granulometric composition of the magnetic fluids was investigated by scanning and transmission electron microscopy, the phase composition was studied by X-ray diffraction and reflection high-energy electron diffraction, and magnetic properties were studied by vibrating sample magnetometry. In order to reveal the particle size distribution, dynamic light scattering and a proposed modification of depolarized dynamic light scattering were employed. The shape and dimensions of magnetic nanoparticles and also their aggregates are described. While the aspect ratio for the aggregates was 0.5–0.99, individual nanoparticles had an average aspect ratio of 0.9 and were nearly spherical. The sedimentation stability of a diluted magnetic fluid was also investigated. When the fluids were diluted 200 times, the stability was partially lost, and the nanoparticles aggregated, thereby forming clusters, and precipitated.

1. Introduction

Magnetic fluids have been the subject of scientific research for a long time [1] and are used in various fields of engineering, including mechanical engineering, mining, and electronics [2,3], as well as in medical diagnostics [4] and sensing devices [5,6,7]. The main qualities that a magnetic fluid must possess are aggregate and sedimentation stability, saturation magnetization, and biocompatibility (when used in medicine). An important difference between technical requirements to magnetic fluids used in these areas is the concentration of magnetic particles in their compositions. Typical concentrations used in alternating magnetic field sensors should be up to 370 mg/mL and higher [8], in the preparation of polymer composites for electromagnetic shielding they should be 20–80 mg/mL [9], to use acoustic properties of magnetic fluids the concentration should be 10–40 mg/mL [10], for the separation of nonmagnetic particles the concentration should be up to 10 mg/mL [11], as the fuel additive concentrations less than 2 mg/mL are used [12], and for the use as a contrast agent for magnetic resonance imaging the concentration should be less than 1 mg/mL [13]. For such a variety of applications [14], the original magnetic fluids are usually diluted 200 or more times, which can cause violation of the colloidal solution stability.
In the case of high aggregate stability of a magnetic fluid in the ultrawide range of concentrations of magnetic particles, the sol–gel method [15] may be used. As shown in [16], the study of diluted magnetic fluids prior to their use requires the analysis of particle size distribution using optical methods, including dynamic light scattering (DLS) [17].
The conventional DLS [18] method does not allow analyzing the shape of magnetic particles, which necessitates the use of additional research methods, such as scanning and transmission electron microscopy. To study the sizes of nonspherical nanoparticles in diluted magnetic fluid it is possible to use the promising depolarized dynamic light scattering (DDLS) method.
Despite the fact that the DDLS method has been known for at least 30 years, it remains relevant in the study of colloidal particles. In [19], the method was applied to distinguish nearly monodisperse hematite spindles with an average length of 280 nm and a minor axis of 57 nm, coated with a layer of silica of variable thickness, which revealed the particle aspect ratio between 5 and 2. Characterization of optically anisotropic round Au nanoparticles and determination of the number-averaged size distribution and polydispersity was presented in [20]. The authors of [21] confirmed the colloidal stability of Au nanoparticles coated with polyvinylpyrrolidone via steric repulsion even under high salt conditions by the DDLS method. The size and shape of the magnetic nanoparticles were studied using DDLS in [22]. One of the main problems of studying the parameters of single magnetic nanoparticles by optical methods is the aggregation of nanoparticles in dilute magnetic fluids.
In this article, we propose the use of an original modification of the DDLS method to obtain data not only on the size and shape distribution of aggregates in a magnetic fluid, but also on individual magnetic particles directly. It is expected that this method will be promising for studying the structural and morphological properties of nanoparticles in dilute liquids.

2. Materials and Methods

2.1. Synthesis of Magnetic Fluid

The magnetic fluid was obtained by the original method in accordance with patent RU2639709 [23]. Ferric chloride (NevaReaktiv, Ltd., Saint Petersburg, Russia) and ferrous sulfate (NevaReaktiv, Ltd., Saint Petersburg, Russia) were taken in amounts of 2 g and 1 g, respectively, and dissolved in distilled water in a volume of 50 mL. Then, 5 mL of a 25% aqueous solution of ammonia (NevaReaktiv, Ltd., Saint Petersburg, Russia) and 1 mL of tetraethylorthosilicate (LenReactiv, JSC, Saint Petersburg, Russia) were added to the solution, which was then sonicated using an ultrasonic bath UZV-2.8 (Sapphire, Moscow, Russia) for 30 min. After this, the obtained solution was purified from an excess of ammonia with a fivefold wash with magnetic separation using a Nd-Fe-B magnet N35 (Magnets and Systems, Ltd., Saint Petersburg, Russia). The solution was then redispersed using a Vibra-Cell VCX-130 ultrasound dispenser (Sonics & Materials, Newtown, Connecticut, USA) at a probe oscillation amplitude of 100% for 10 min. The initial magnetic fluid had a concentration of 30 mg/mL, and the sample diluted 200 times had a concentration of 0.15 mg/mL.

2.2. Assessment of Physical Characteristics of Magnetic Fluid

The study of the granulometric composition of magnetic fluids was performed with scanning electron microscopy (SEM) and transmission electron microscopy (TEM). JSM-5800 (JEOL Corp., Tokyo, Japan) and JEM-1400 (JEOL Corp., Tokyo, Japan) microscopes were used, respectively. The phase composition of dried magnetic fluid was analyzed with X-ray diffraction (XRD) by using a diffractometer D2 Phaser (Bruker, Billerica, Massachusetts, USA) and with reflection high-energy electron diffraction (RHEED) by using an electronograph EMR-102 (SELMI JSC, Sumy, Ukraine) with an automated registration system and software developed at Saint Petersburg Electrotechnical University “LETI” at an accelerating voltage of 75 kV. The software package for radiograph analysis PDXL-2 (Rigaku, Tokyo, Japan) and X-ray diffractogram database PDF-2 (International Center for Diffraction Data, 2011) were used for spectra processing. The magnetic properties were measured with vibrating sample magnetometry (VSM) by using a 7400-S Series instrument (LakeShore Cryotronics, Inc., Westerville, Ohio, USA) at room temperature. A comparative analysis of the particle size distribution was conducted with the method of dynamic light scattering (DLS) with the help of a Photocor Mini device (Photocor, Ltd., Moscow, Russia). To study sizes and shapes of individual nanoparticles, a method based on the classical dynamic light scattering, depolarized dynamic light scattering (DDLS), was proposed.

2.3. DLS-Based Original Experimental Technique

In dynamic light scattering, time dependences of the scattering intensity fluctuations caused by the Brownian motion of macromolecules in solution are measured. That allows one to measure the diffusion coefficients of different kinds: translational and rotational movements and internal dynamics [24].
Scattering from independent particles in solution can be represented as a sum of contributions from individual scatterers. When irradiation with polarized light is used, the scattered radiation will consist of polarized (polarization vector is perpendicular to the scattering plane: VV) and depolarized (polarization vector in the scattering plane: VH) components [25]:
E s V V = j E j = j A V V j e i φ j e i ω 0 t ,
E s V H = j E j V H = j A j V H e i φ j e i ω 0 t ,
where AjVV and AjVH are the amplitudes of the polarized and depolarized components of the scattered light from the jth scattering element, and φj are the corresponding phases. If we take φ = 0 at the origin, then
φ j = ( k 0 k s ) · r j = q · r j ,
where q is the scattering wave vector, k0 and ks are the wave vectors of the incident and scattered waves (Figure 1), and rj is the scatterer position. Since the frequency of scattered radiation is shifted relative to the original frequency insignificantly, then |k0|≈|ks|, and the magnitude of the scattered light can be written as [26]
| q | = | k 0 k s | 2 | k 0 | sin ( θ 2 ) = 4 π n 0 λ 0 sin ( θ 2 ) ,
where θ is the scattering angle, λ0 is the light wavelength in the medium, and n0 is the refractive index of the medium (in this case, the solvent). Thus, the polarized and depolarized components of the scattered radiation can be rewritten as
E s V V = j A V V j e i q r j ( t ) e i ω 0 t ,
E s V H = j A j V H e i q r j ( t ) e i ω 0 t ,
When isotropic particles in the classical DLS method are considered, only the polarized component Es is measured and analyzed. To process the scattering signal, we calculate an autocorrelation function
G ( 1 ) ( τ ) = < E S * ( t ) E s ( t + τ ) > .
G(1)(τ) is called an autocorrelation function of the first kind. In real experiments, square-law detectors (photoelectron multipliers) are typically used. These detectors capture fluctuations of the scattered radiation intensity rather than of the field. In this case, an autocorrelation function of the second kind is calculated as
G ( 2 ) ( τ ) = < E S * ( t ) E s ( t ) E S * ( t + τ ) E s ( t + τ ) > .
In the case when the scattered light is a Gaussian random process, the autocorrelation function of the second kind will be related to the autocorrelation function of the first kind by the Siegert relation [26]
G ( 2 ) ( τ ) = | G ( 1 ) ( τ ) | 2 + 1 .
This relationship makes it easy to go from the measured G(2)(τ) to G(1)(τ) and continue to work with it. For N identical spherical scatterers, the positions of which are not correlated, we can rewrite the autocorrelation function in the following form [27]:
G ( 1 ) ( τ ) = N | A | 2 < e i q ( r ( τ ) r ( 0 ) ) > e i ω 0 τ .
For free and isotropic diffusion, this expression is simplified as
G ( 1 ) ( τ ) = N | A | 2 < e q 2 D T τ > e i ω 0 τ ,
where DT is the diffusion coefficient, which, according to the Stokes–Einstein formula, is defined as follows:
D T = k B T / 6 π η R .
Here, η is the viscosity of the medium, kB is the Boltzmann constant, T is the temperature, and R is the hydrodynamic radius of scatters.
These considerations are sufficient to determine the diffusion coefficients and the sizes of particles in the equilibrium state. In addition, we can observe the aggregation of the particles with each other. This allows us to qualitatively characterize the dynamics and evaluate the composition of the solution. In order to study the parameters of nanoparticles in solution in more detail, it is necessary to take into account rotational diffusion.
If we depart from the spherical approximation and assume that the scattering amplitudes depend on the orientation of the particles in space A(t) = A0 + A1(t), where A1(t) is a variable component and A0 is a constant, the expression for the autocorrelation function is rewritten in the following form:
G V V ( 1 ) ( τ ) = N A 0 2 e q 2 D T τ + N < A 1 ( 0 ) A 1 ( τ ) > e q 2 D T τ .
In this expression, the first term is responsible for the ordinary translational diffusion, and the second term is usually determined by rotational diffusion [28]. For the objects with rotational symmetry (cylinders, ellipsoids), the autocorrelation function of the polarized scattering component (VV) takes the form
G V V ( 1 ) ( τ ) = N A 2 [ B 0 e q 2 D T τ + B 2 e ( q 2 D T + 6 D R ) τ + ] e i ω 0 τ = S 1 ( q , R ) e q 2 D T τ + S 2 ( q , R ) e ( q 2 D T + 6 D R ) τ ,
where S1(q,R) and S2(q,R) are the scattering amplitudes; R in this equation stands for the particle size (length or radius). The angular dependence of S1(q,R) and S2(q,R) components leads to the following observation: in small angles (under our conditions θ < 60°), only translational motion contributes significantly to the signal [29]. As the detection angle increases, the contribution of the rotational motion increases. According to some authors, angular scattering dependencies should be measured in order to separate the rotational motion from the translational [30] one. In our study, in order to evaluate simultaneously the coefficients of translational and rotational diffusion, it is proposed that the autocorrelation function of the depolarized scattering component be measured additionally:
G V H ( 1 ) ( τ ) = N < A 1 D e p ( 0 ) A 1 D e p ( τ ) > e ( q 2 D T + 6 D R ) τ = S V H ( q , R ) e ( q 2 D T + 6 D R ) τ .
It is seen that the component exclusively responsible for the translational motion is absent in this function. Thus, the measurement of angular dependences is avoided, and one is limited to measuring the polarized and depolarized components. In the experimental calculation of normalized autocorrelation functions, expressions (12) and (13) can be rewritten as [31]
G V V ( 1 ) ( τ ) = S V V ( q , R ) e ( Γ 1 + Γ 2 ) τ ,
G V H ( 1 ) ( τ ) = S V H ( q , R ) e Γ 2 τ ,
where
Γ 1 = q 2 D T ,
Γ 2 = q 2 D T + 6 D R .
The values of the diffusion coefficients depend on the scatterer shape. We can write them for ellipsoids with the half-axes Ra and Rb [32]:
D T = k B T 6 π η R a F ( R a , R b ) , F ( R a , R b ) = 1 1 ( R b R a ) 2   ln ( 1 + 1 ( R b R a ) 2 R b R a )
D R = k B T 8 π η R a 3 ( 2 ( R b R a ) 2 ) F ( R a , R b ) 1 1 ( R b R a ) 4 .
This method of determining the shape of nanoparticles is called DDLS. It found application in studying the parameters of nanorods in a liquid [33], but due to the complexity of the interpretation of experimental data, it is still not widely used.
In this paper, we propose the following scheme for measuring the polarized and depolarized components of scattered light (Figure 1). As a source of radiation, we used a single-mode solid-state laser module with a power of 2.5 mW and a wavelength of 650 nm. The diaphragm was used to reduce the laser beam size. The radiation was focused by the aspheric short-focus lens built into the module. The calculated caustic length in the solution amounted to 5 mm. The scattered radiation was registered under the 90° angle and was transferred to the photomultiplier by means of an optical fiber. The diaphragms and the aperture of the single-mode optical fiber determined the angle of view for the scattered radiation. The photomultiplier with built-in amplifier H11706-01 (Hamamatsu) was used. The signal for the photomultiplier was digitized by the analog-to-digital converter at a frequency 50 MHz and processed with a computer. The sampling frequency should not be less than 40 kHz for nanoparticle size evaluation, which is explained by the typical value of Doppler shift equal to 1–20 kHz in scattered signals. In this study, the 50 MHz sampling frequency was used to increase the accuracy of depolarization-related measurements. The voltage resolution of the converter was equal to 0.03 mV. Discussion about signal-to-noise ratio provided by the described spectrometer and the parameters of the main elements are provided in [34]. To separate polarized and depolarized components, two polarizers were added. The scattered signal was registered for two positions of the output rotating polarizer-analyzer: vertical polarization (VV component) and horizontal polarization (VH component). The input polarizer was always in a vertical polarization position.
The calculation of the autocorrelation functions and the selection of the parameters of their approximation were carried out with the help of the program based on the Tikhonov regularization method, a detailed description of which can be found in [35]. Autocorrelation functions were observed during 100 s accumulation time. Each autocorrelation function was averaged from 50 realizations.

3. Results and Discussion

3.1. Physical Characteristics of Magnetic Fluid

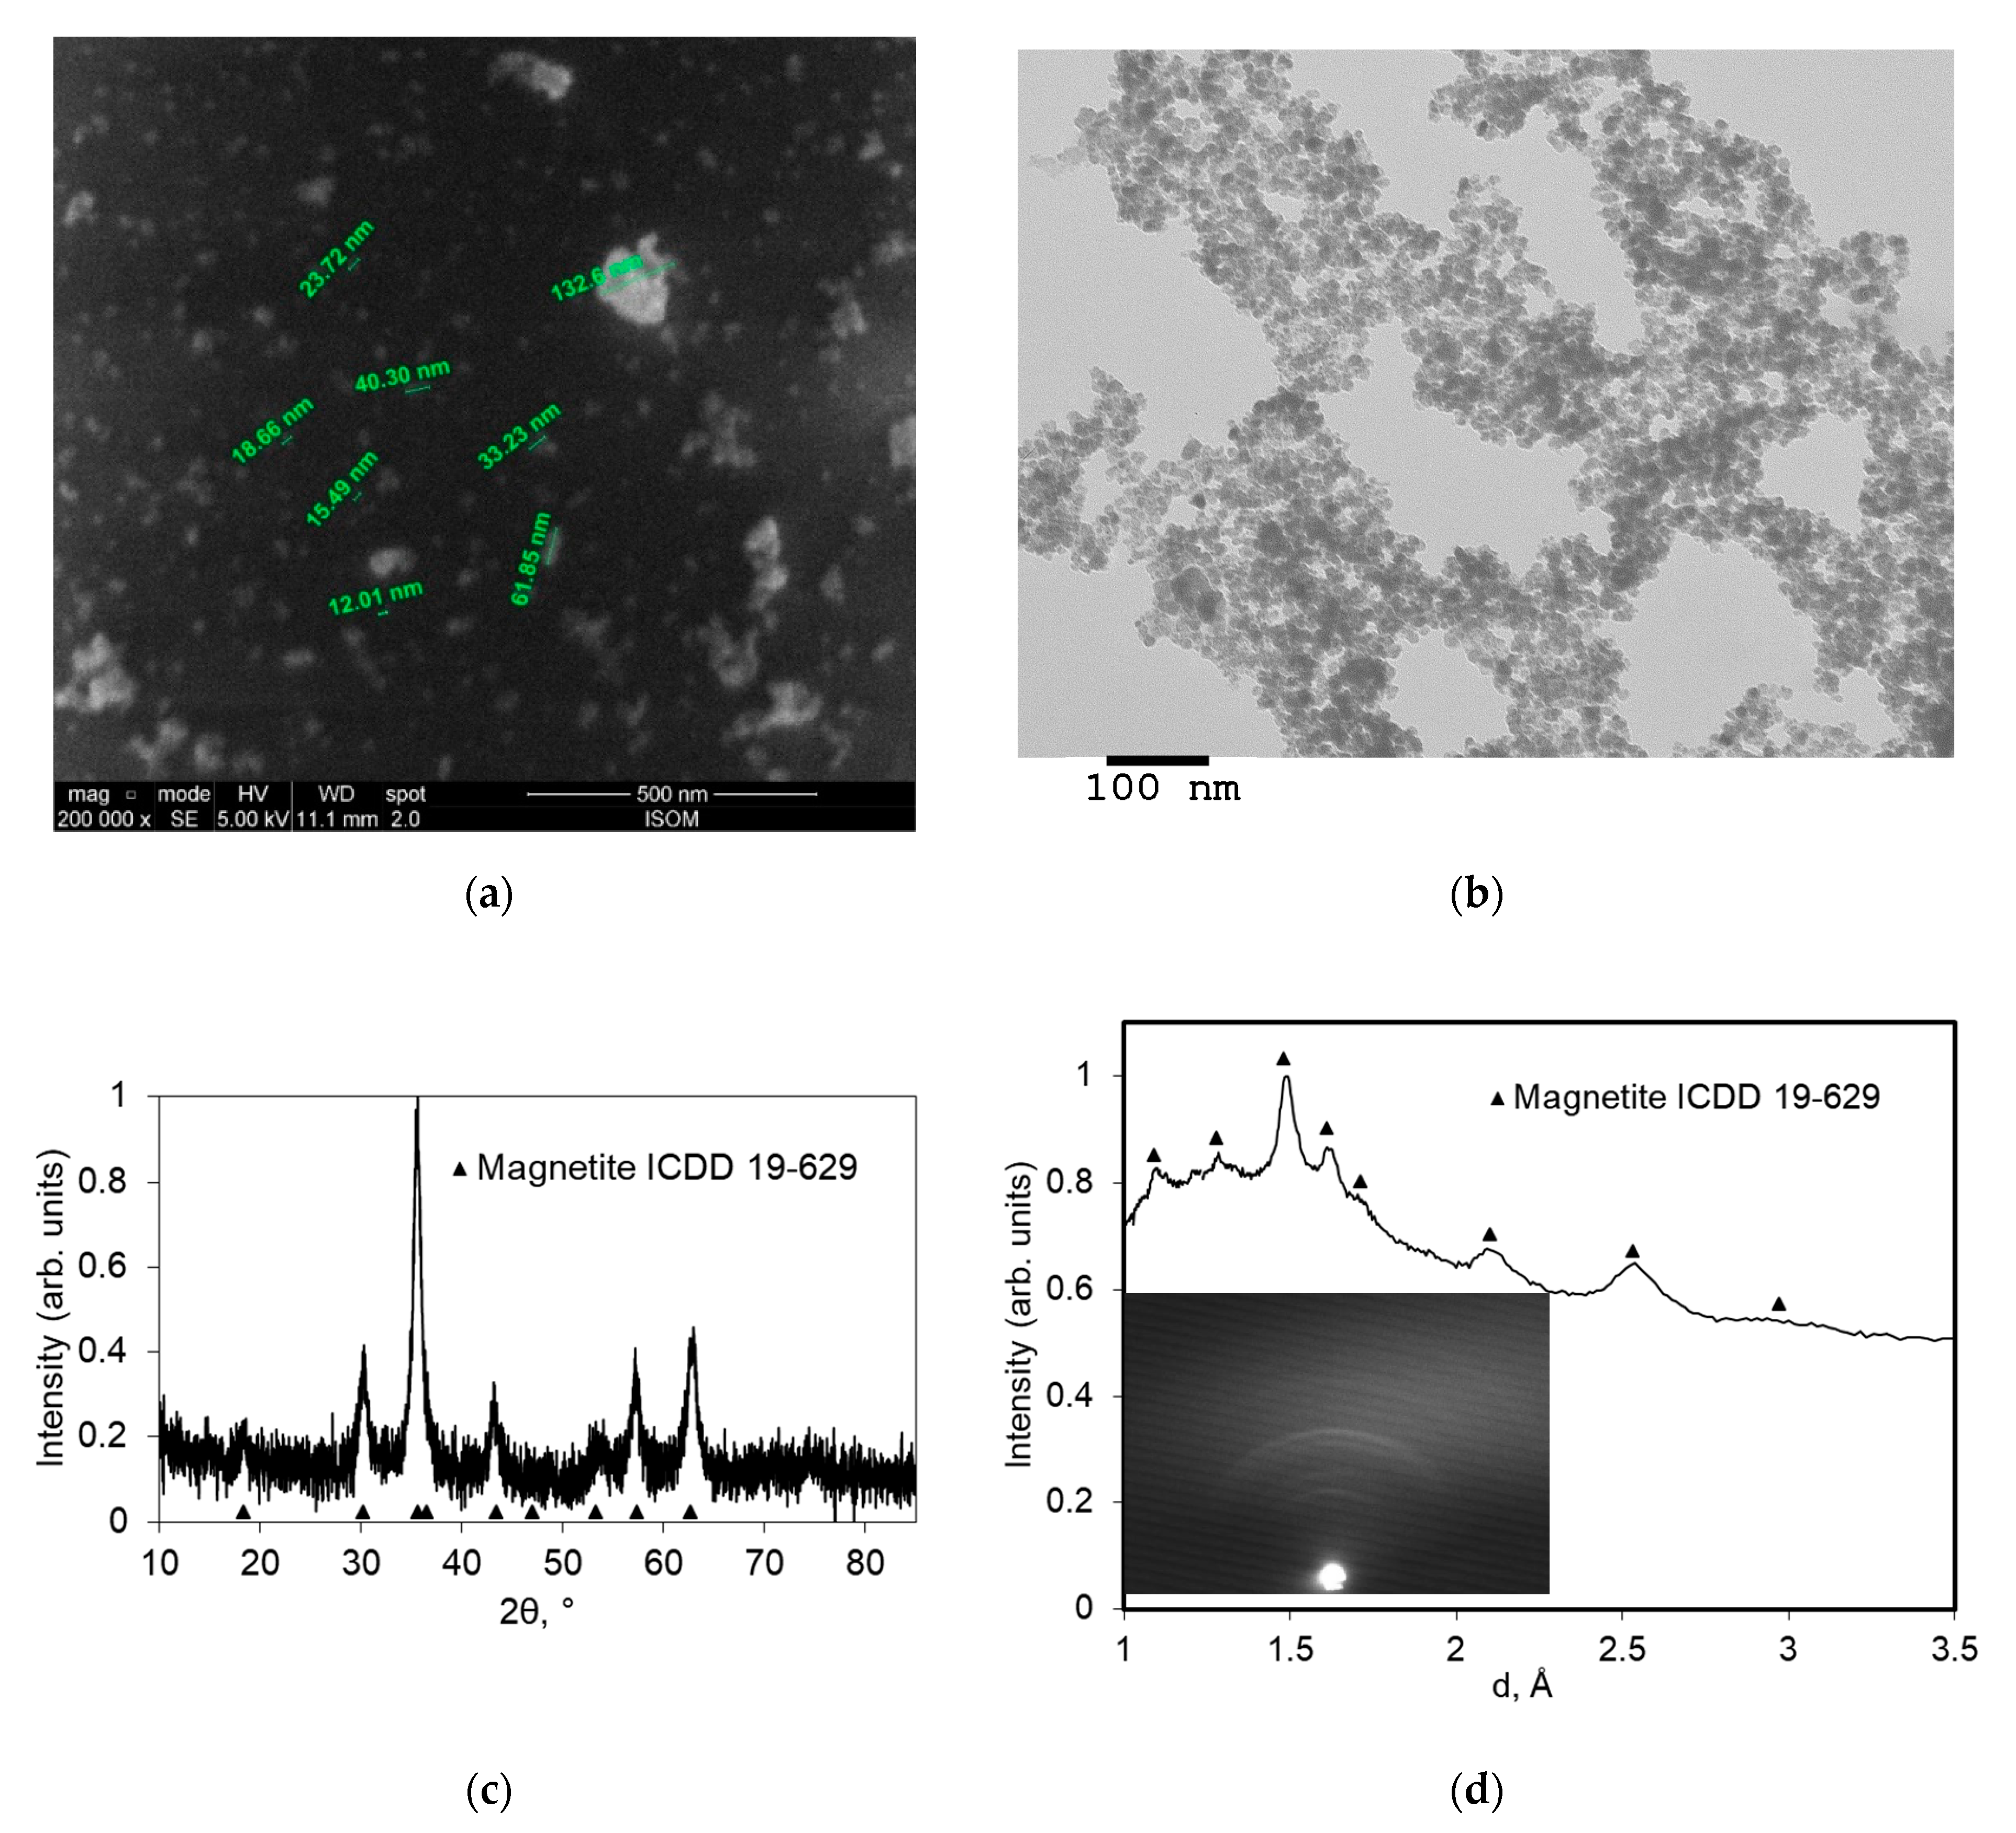
Analysis of the SEM and TEM images of a sample obtained from a magnetic fluid diluted 200 times (Figure 2a,b) by drying its droplet on the substrate showed the presence of both fine particles with dimensions of the order of 10 nm and their aggregates with dimensions of up to about 100 nm. XRD and RHEED data (Figure 2c,d) confirmed the presence of only one crystalline phase of magnetite. The obtained results are in good agreement with the earlier data [16,36,37] on the magnetite–silica colloidal particles. The particle sizes in the magnetic fluid correspond to a stable colloidal solution with a high zeta potential (at least 30 mV [37]). The large objects observed in Figure 2a,b may be aggregates formed during dilution and further drying of a droplet of magnetic fluid on the substrate. The loss of stability upon dilution is presumably associated with the complex (in comparison with Coulomb repulsion) mechanisms of stabilization of the silica-based colloids [38,39]. This effect is expected to be weaker upon substantial dilution [40].
The authors investigated the possibility of using the obtained magnetite–silica nanoparticles in medicine as a negative contrast agent for magnetic resonance imaging [13]. For this reason, the stability of colloidal solutions of low concentration (about 0.1 mg/mL) was also studied with a change in ionic strength [37] (since nanoparticles have to be injected intravenously only in an isotonic buffer solution) and when exposed to a constant magnetic field [13,37]. Despite the achievement of high stability (according to the sedimentation analysis data [13] and zeta potential measurements [37]) in distilled water, an increase in the ionic strength of a solution or a high magnetic field led to a loss of stability within several hours, which limits the possibility of using the obtained nanoparticles in vivo due to the high probability of thrombosis.
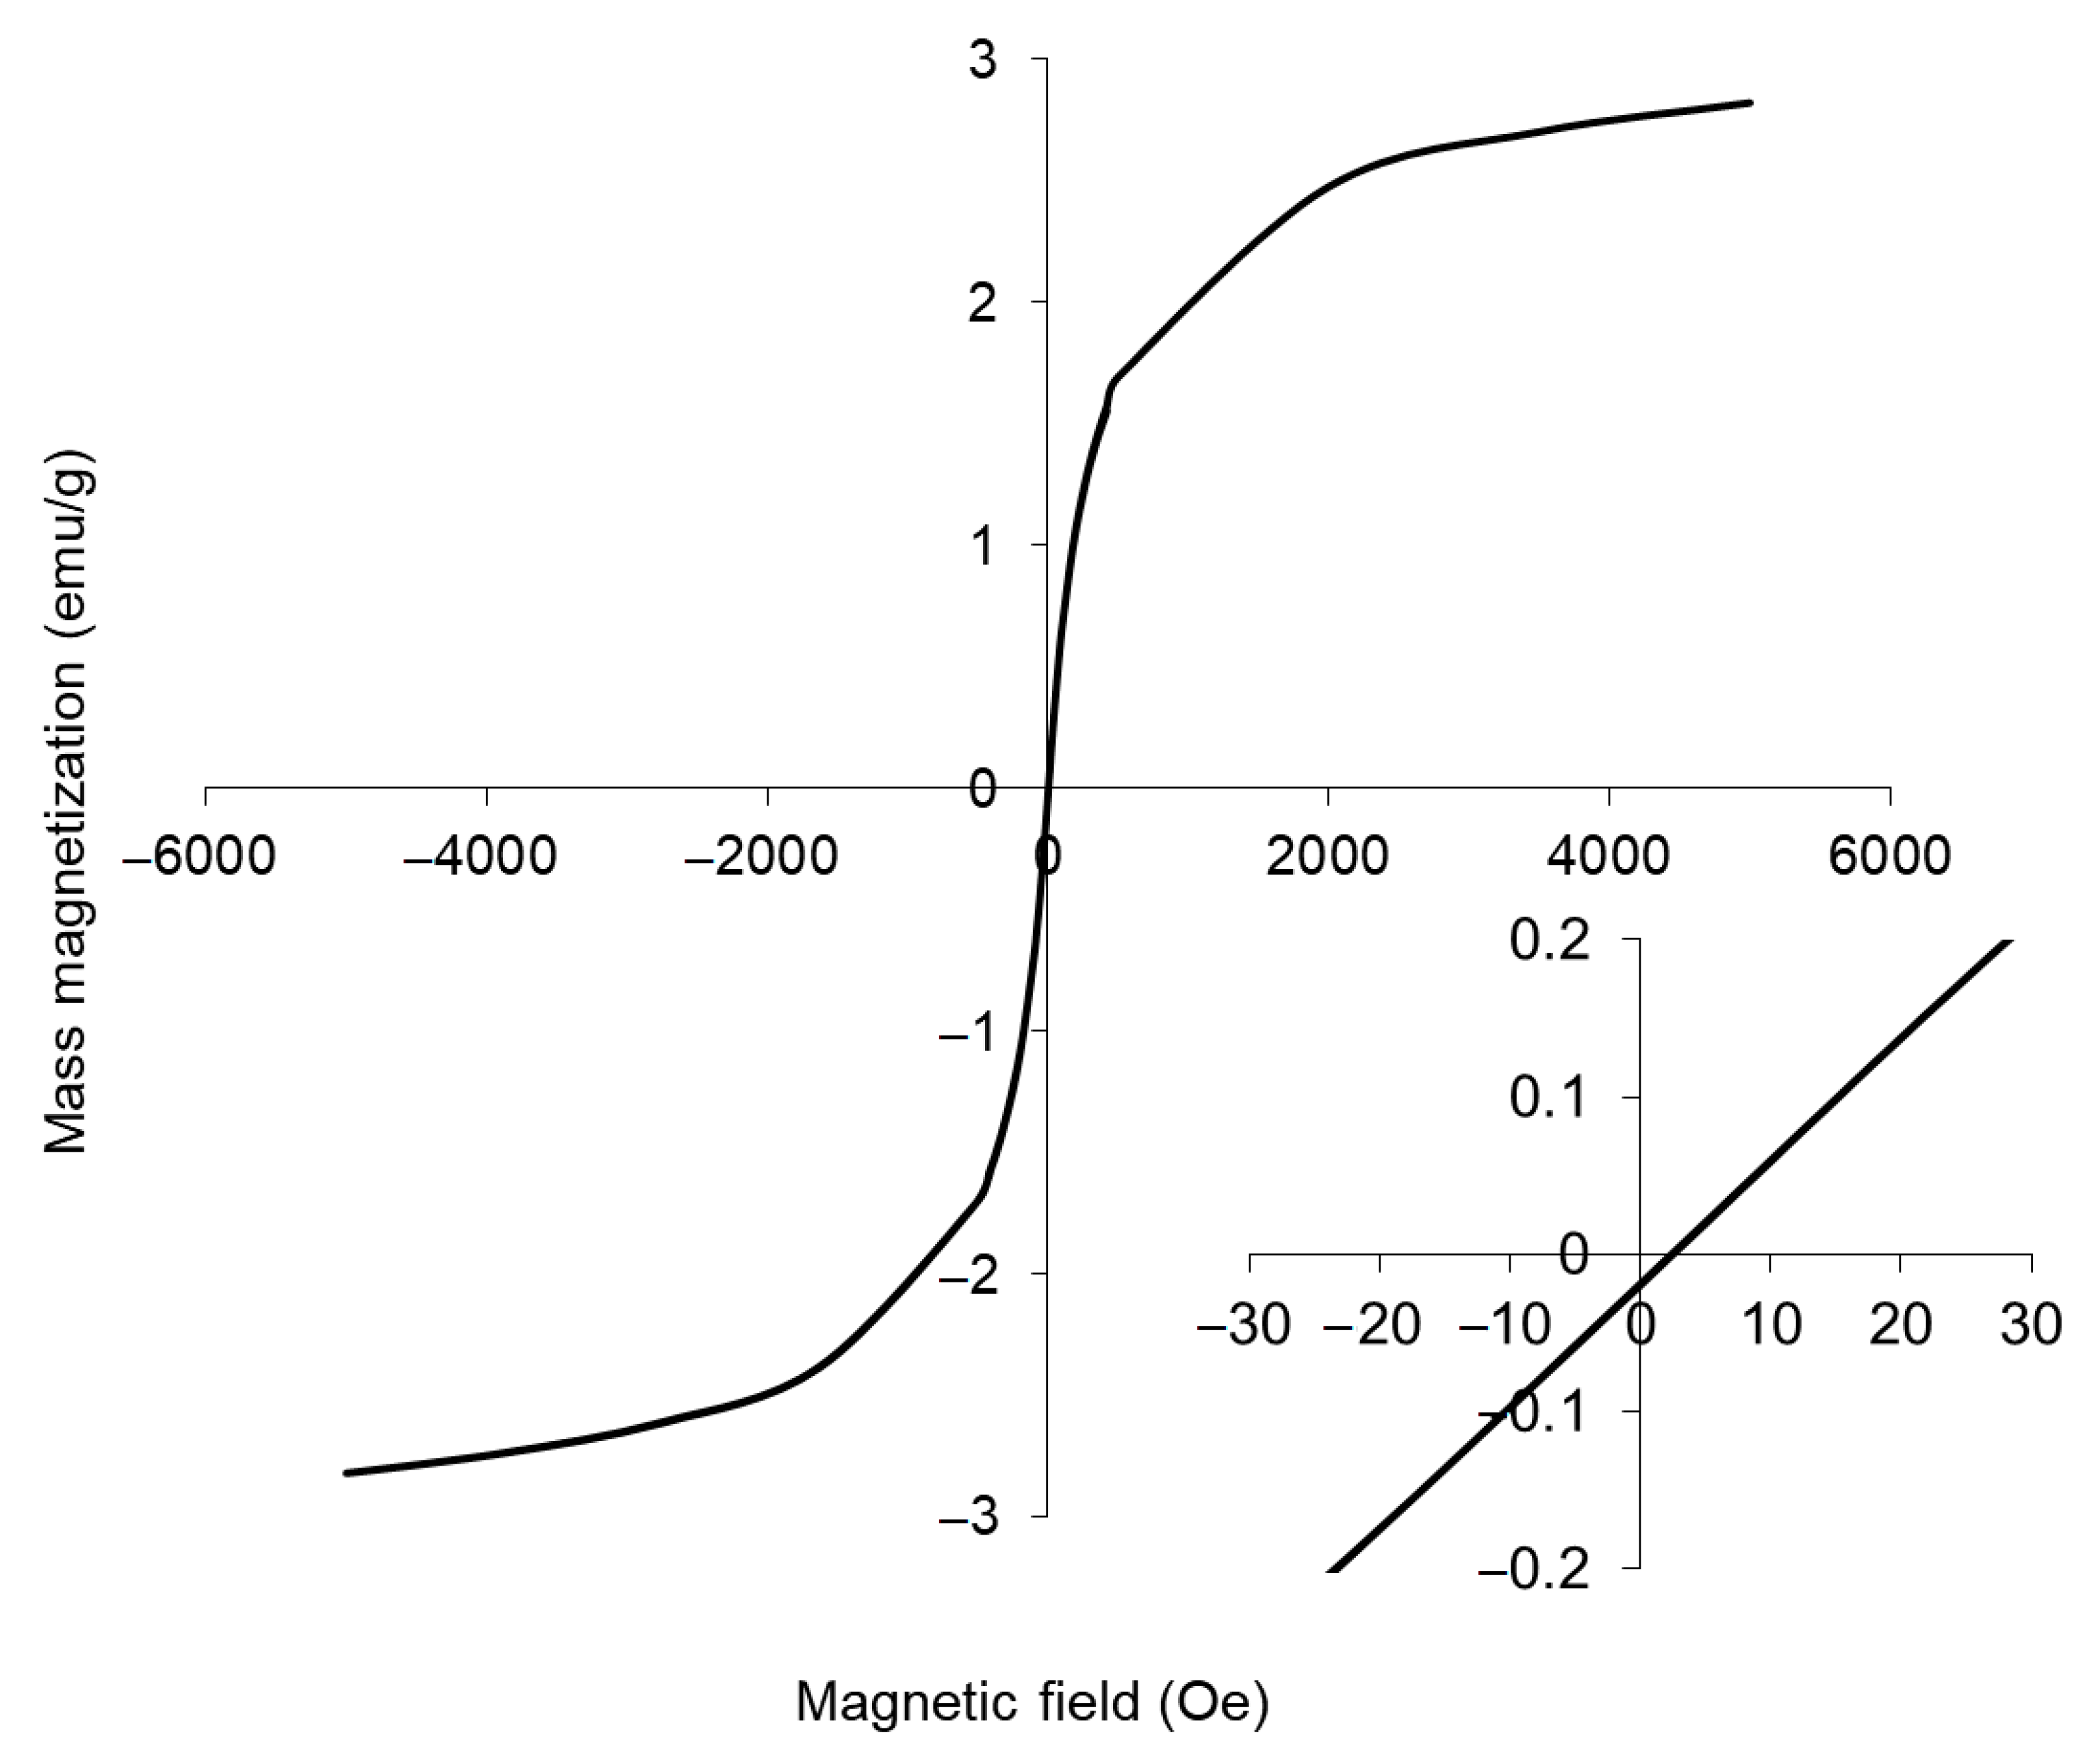
According to the results obtained with the VSM technique for a liquid sample (Figure 3) the saturation mass magnetization of the undiluted magnetic fluid with a concentration of 30 mg/mL is 2.8 emu/g. As was shown in [23], the saturation mass magnetization of a dried sample is 60 emu/g. The difference between the saturation mass magnetization of a dried sample and the saturation mass magnetization of pure magnetite, presumably, may be due to its partial oxidation to maghemite [41], as well as the presence of a nonmagnetic phase of silicon dioxide in the composition of particles. The resulting sample contains superparamagnetic nanoparticles, since the shape of the magnetization curve is described by the Langevin law [42]. The anhysteretic curve shows the absence of magnetostatic interaction between individual particles [36] and also points to the dimensions of magnetic particles less than 25 nm [43].
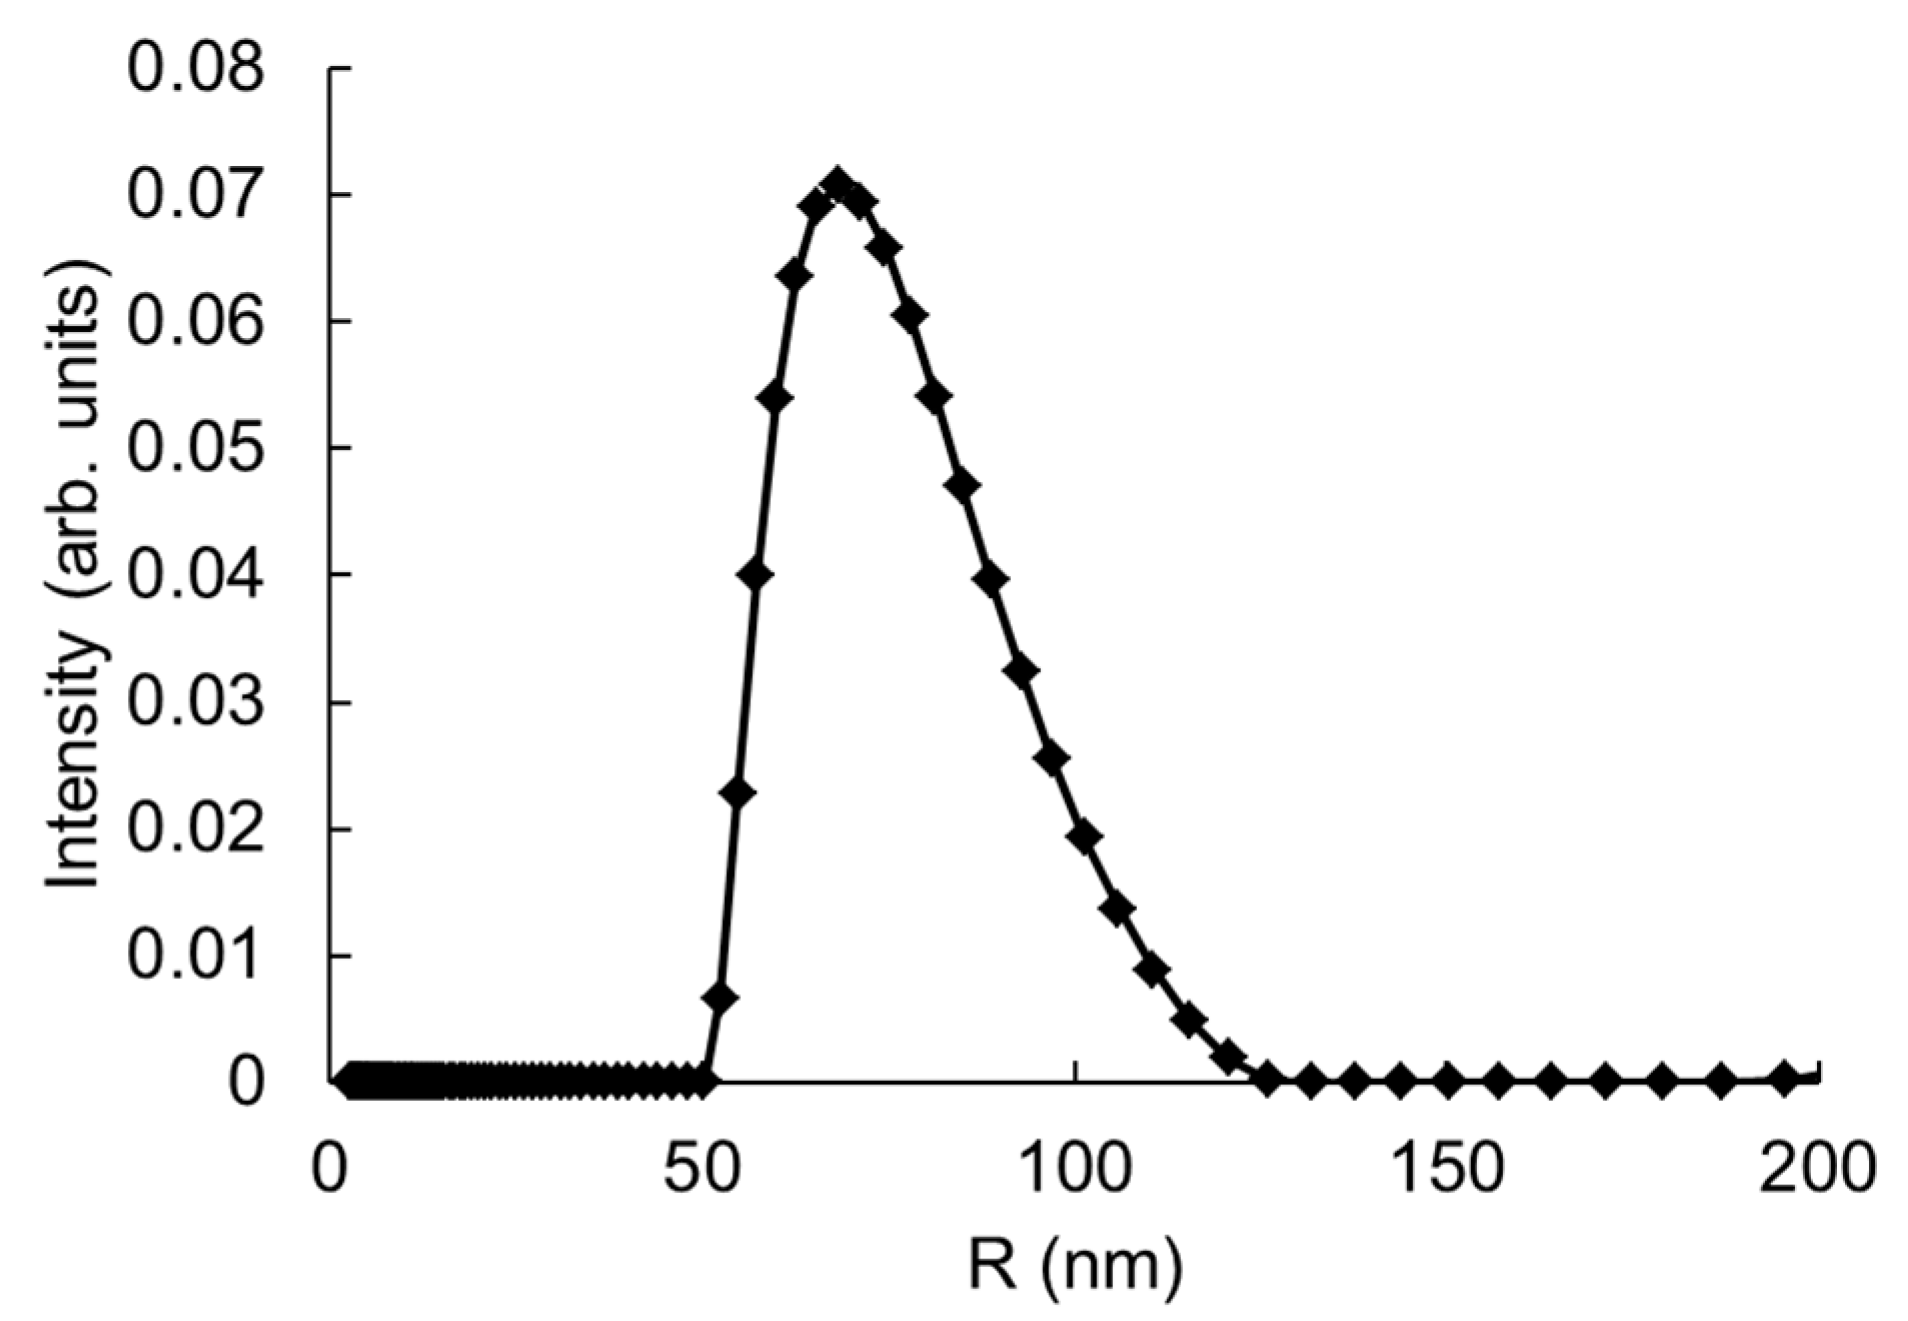
Thus, it can be assumed that particle dimensions greater than 50 nm observed in Figure 2 are aggregates. The particle size distribution in magnetic fluid diluted 200 times obtained with conventional DLS is shown in Figure 4. According to these data, scatterers with a radius of about 70 nm make the largest contribution to the scattering, which also points to the presence of aggregates in a magnetic fluid (IR6, where I is the scattered light intensity and R is the scatterer size). Due to the fact that the intensity of light scattering at the aggregates is much higher [41], measurement with the Photocor Mini does not allow us to distinguish the signal from individual nanoparticles. The y axis represents the light scattering intensity I (R) in relative units, which is proportional to particle concentration. The x axis represents the size R of particles.

3.2. DLS-Based Original Experimental Data

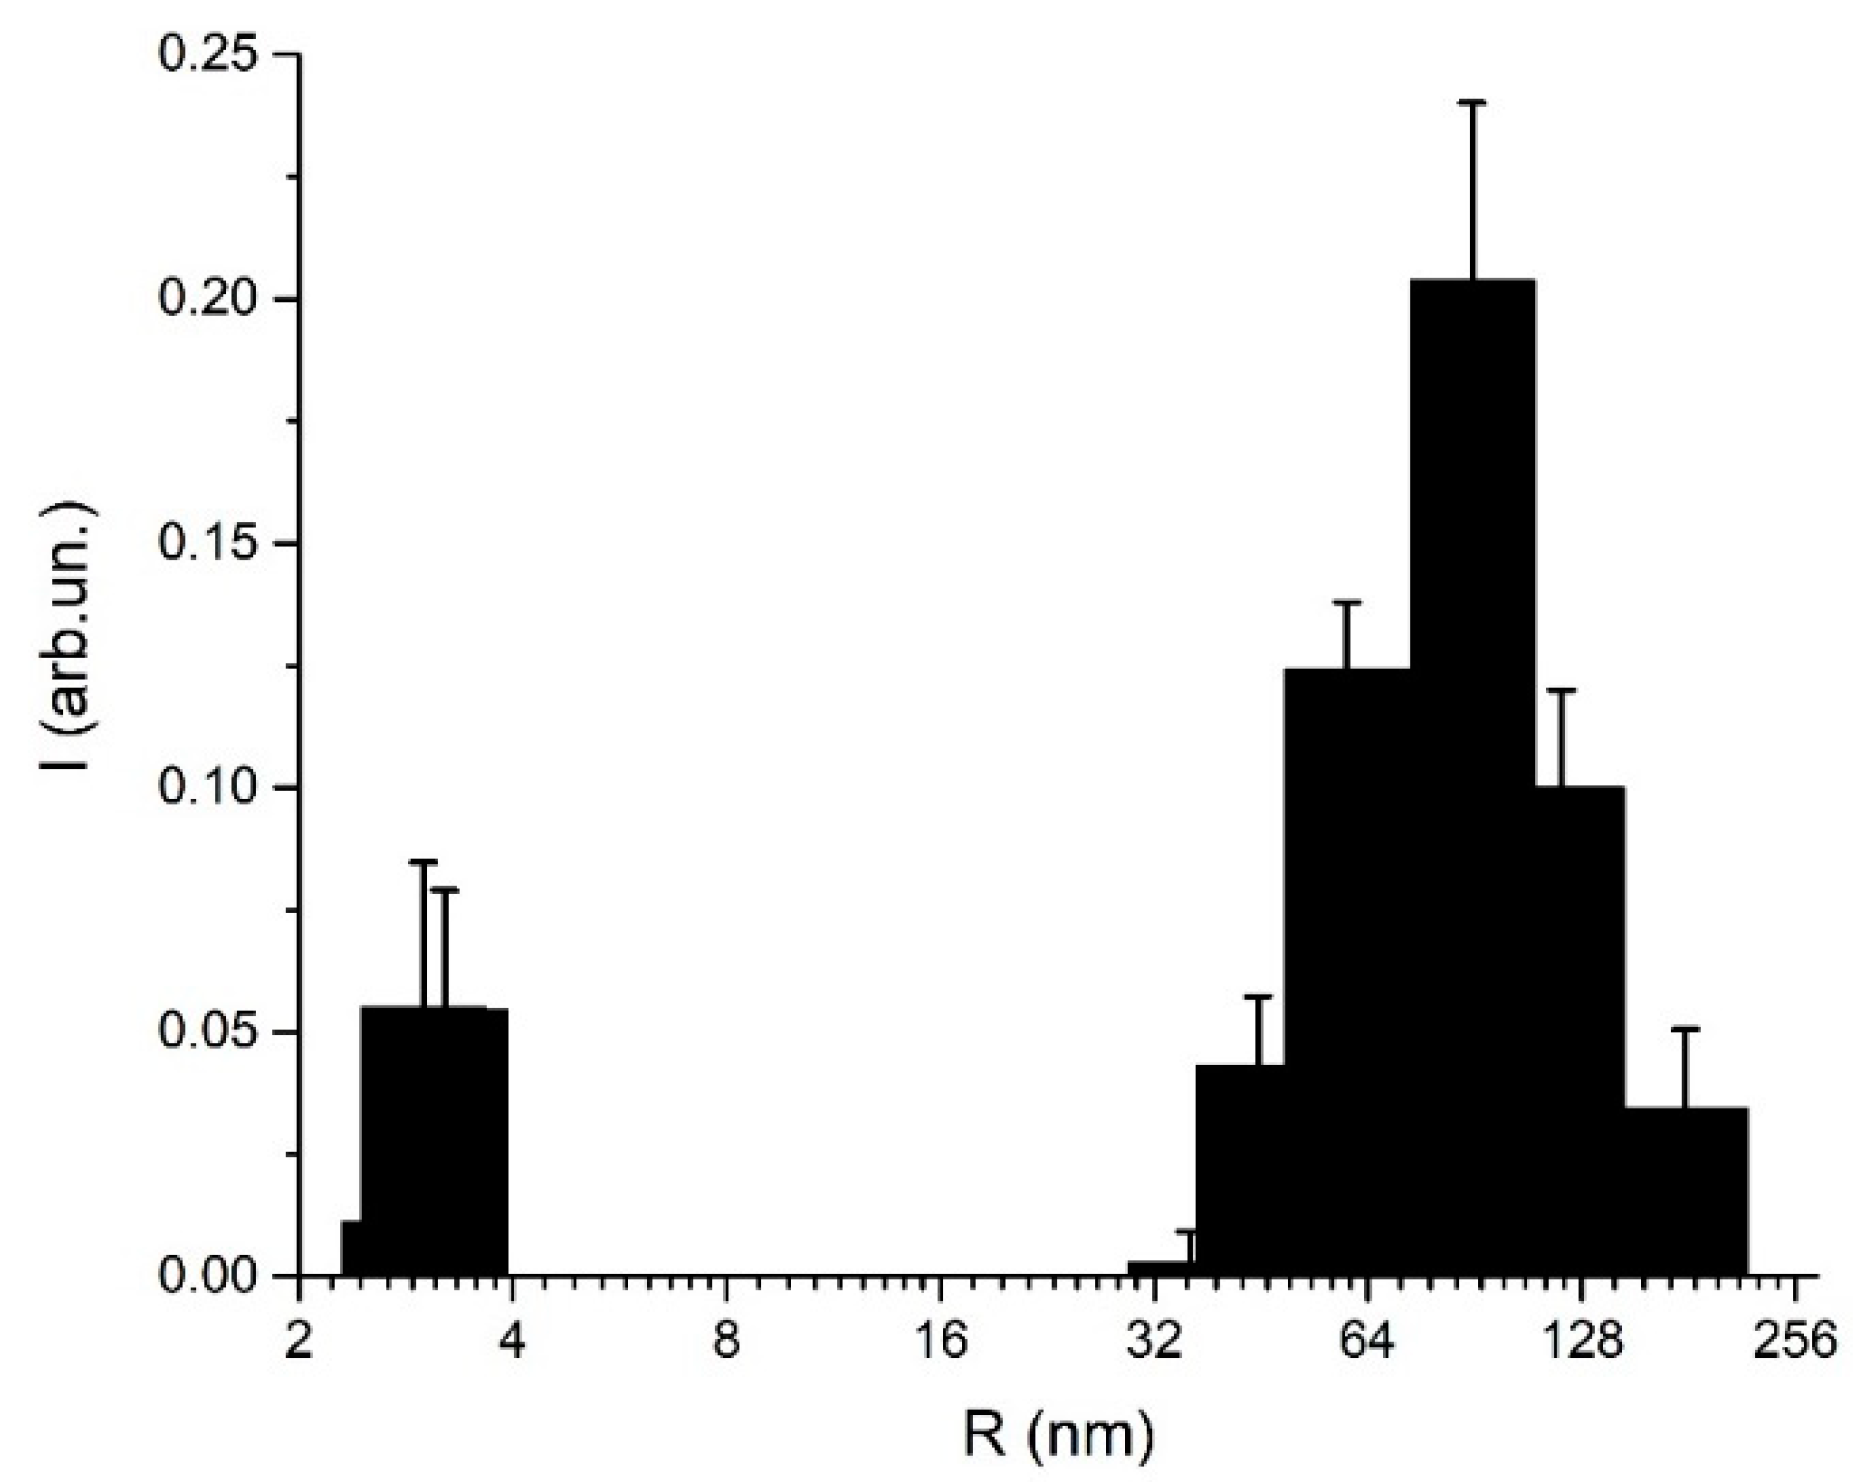
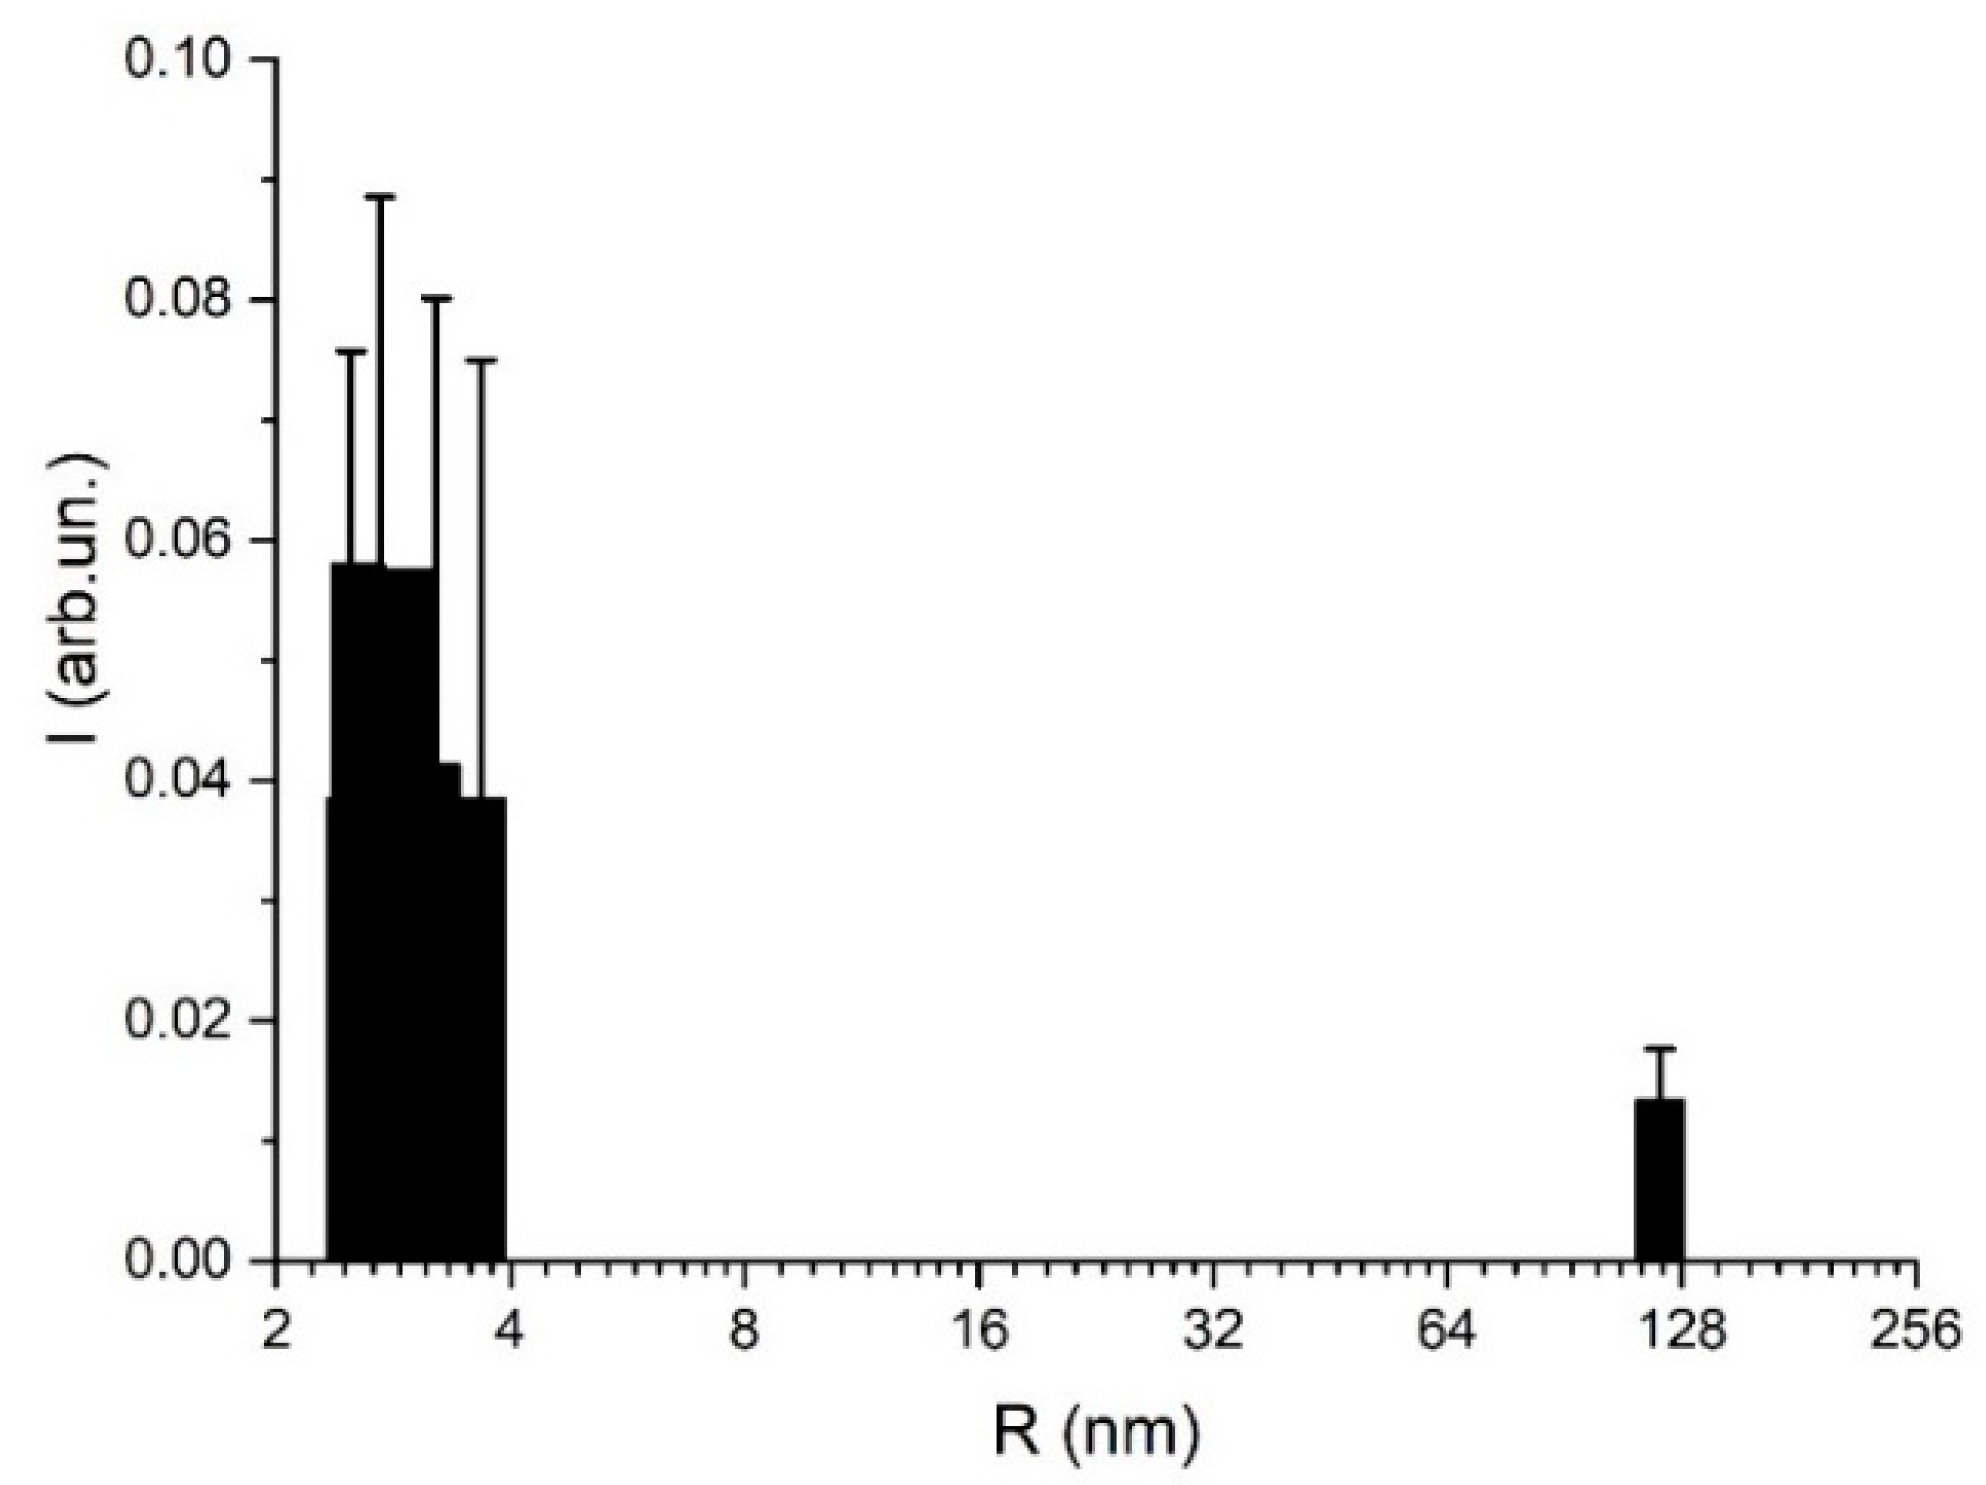
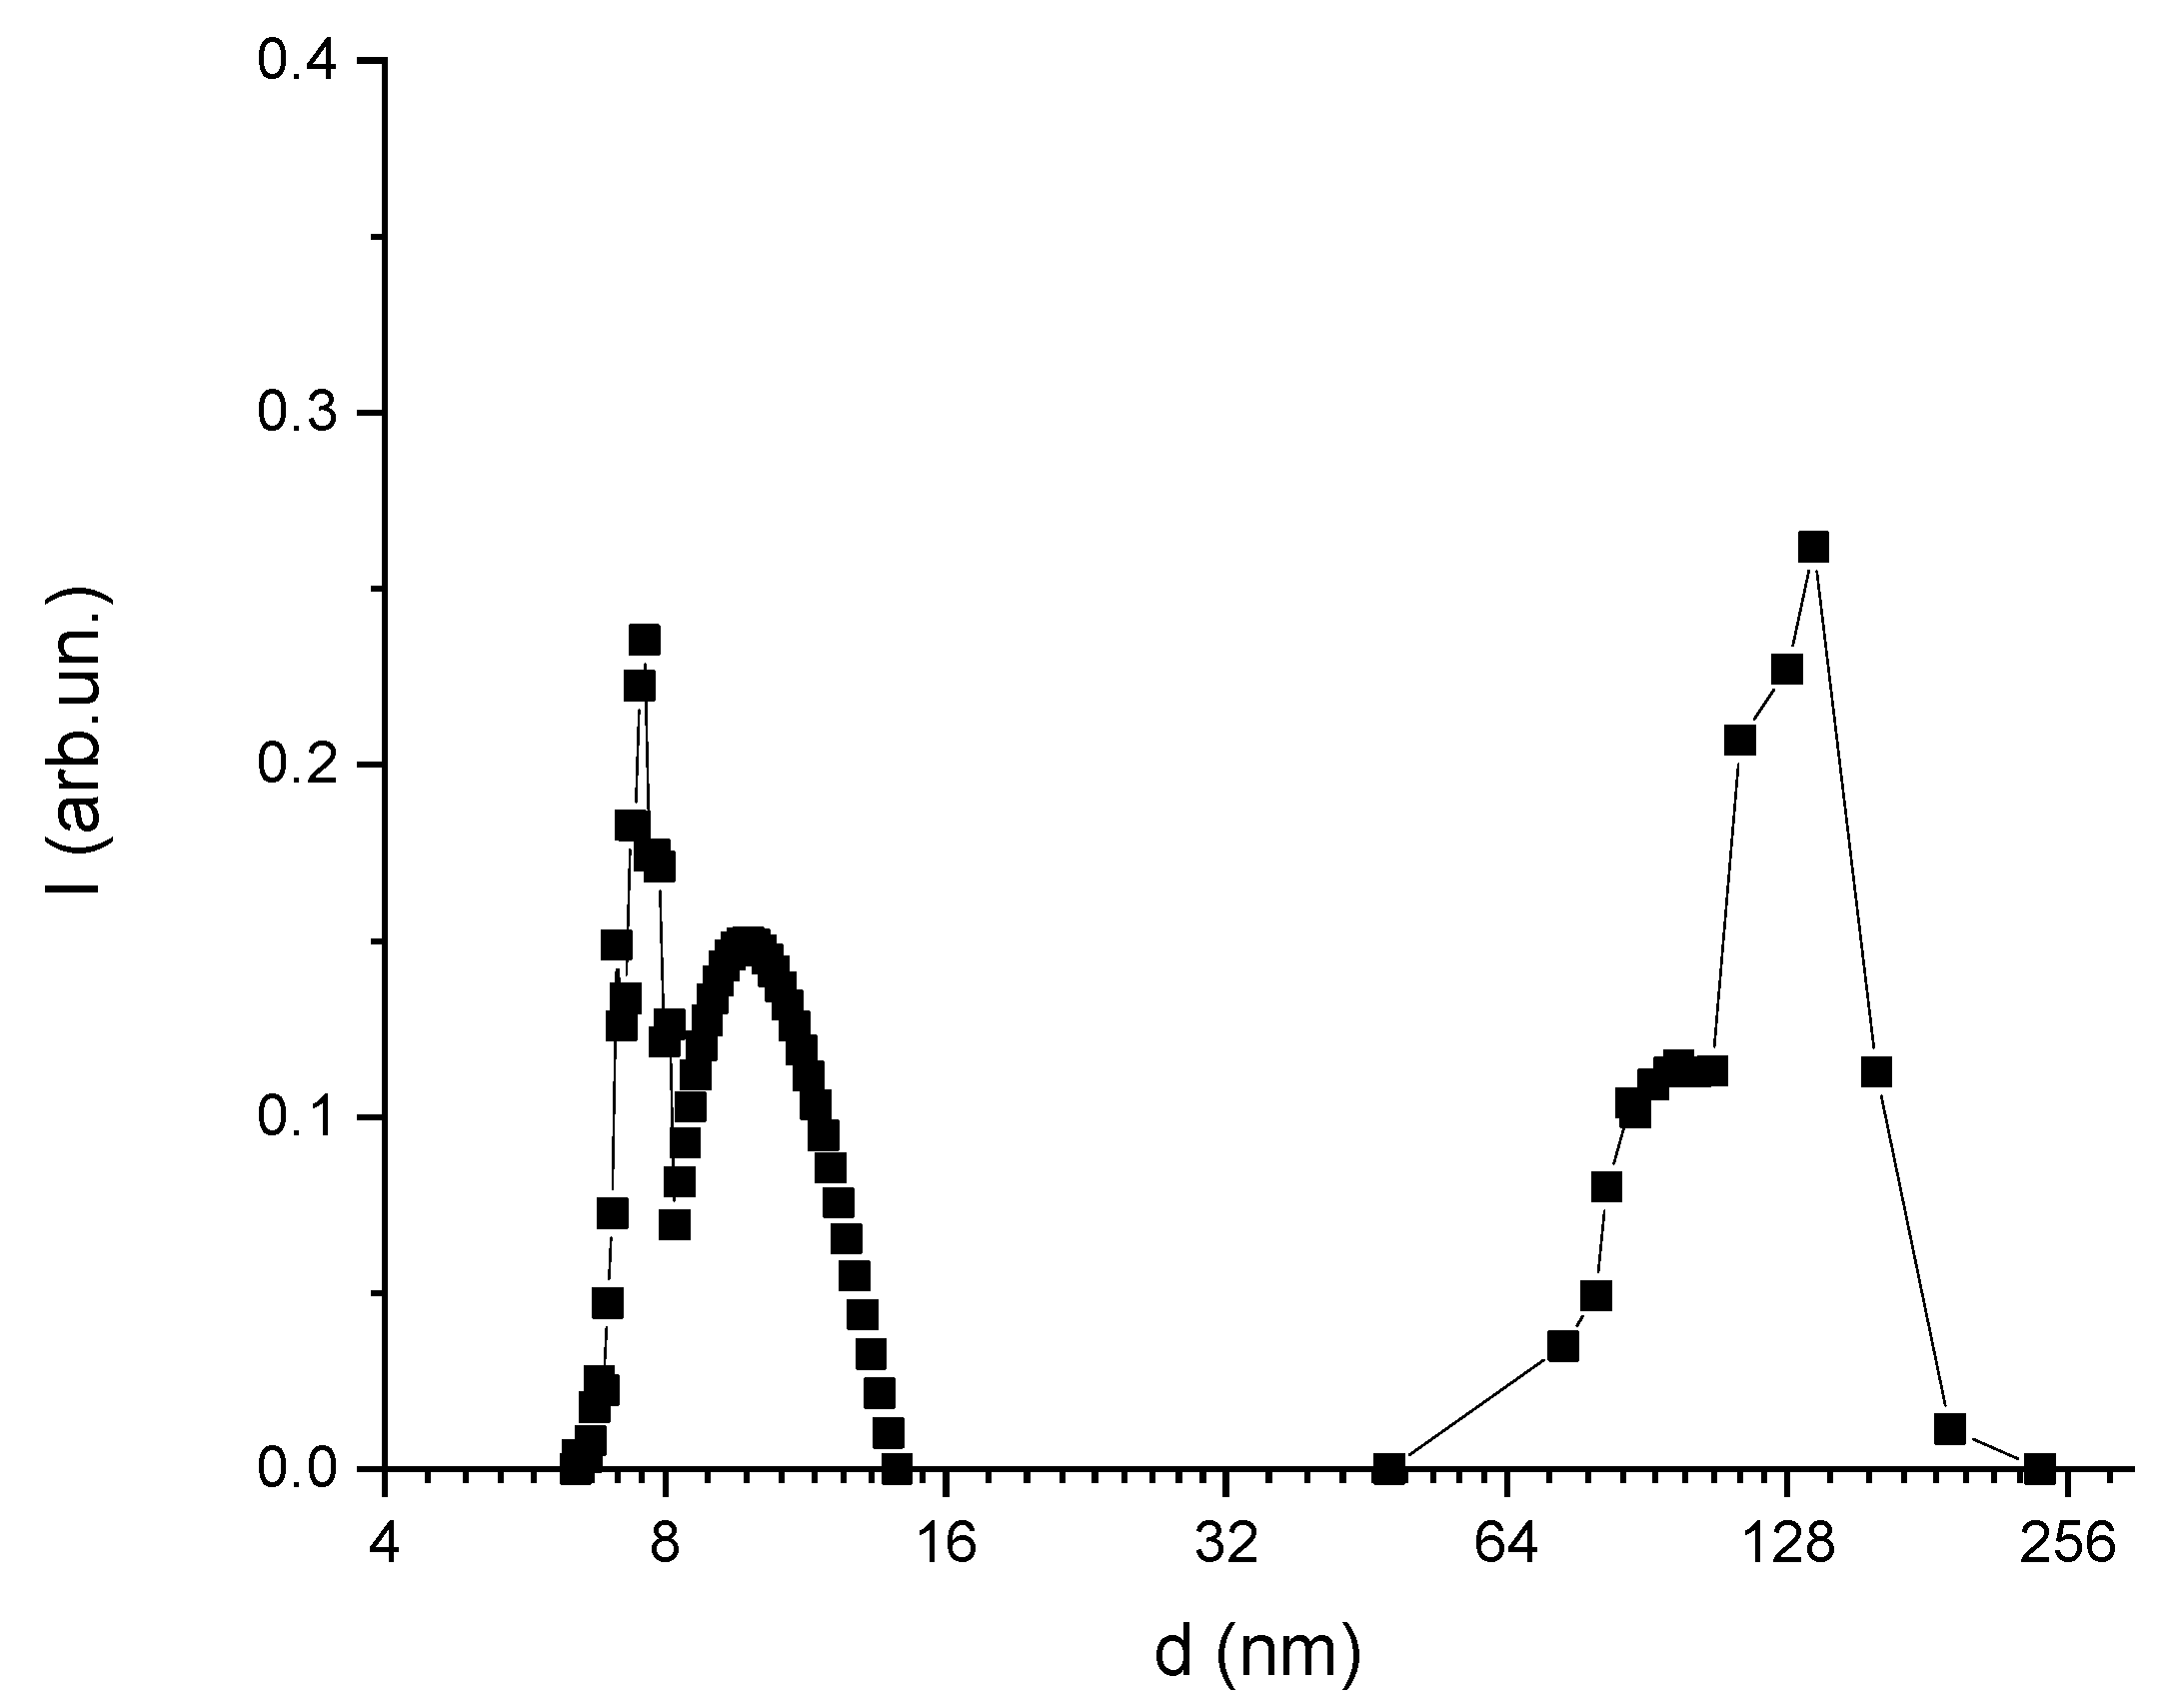
With the help of the DLS-based original experimental technique [44], the particle size distribution in a similar sample of a magnetic fluid diluted 200 times was obtained. The first experiments were performed without taking polarization into account. The result is shown in Figure 5. The y error was calculated as the confidence interval (CI) computed at the 95% confidence level for M = 10 (number of independent measurements). We detected the presence of both aggregates with dimensions of the order of 70 nm (radius) and individual particles with dimensions of about 4 nm in the solution.
Thus, it can be argued that when the initial magnetic fluid is diluted, there is a loss of aggregation stability, as a result of which aggregates of large sizes (more than 50 nm) are formed. The absence of this kind of aggregates in the initial solution is evidenced by its stability: undiluted magnetic fluid does not form a precipitate, while the diluted sample is partially precipitated after 5 days. The resulting solution after natural sedimentation was measured using a DLS-based original experimental technique again. The results are presented in Figure 6. There was a nearly complete loss of large aggregates from the solution, while the concentration of individual nanoparticles remained unchanged.
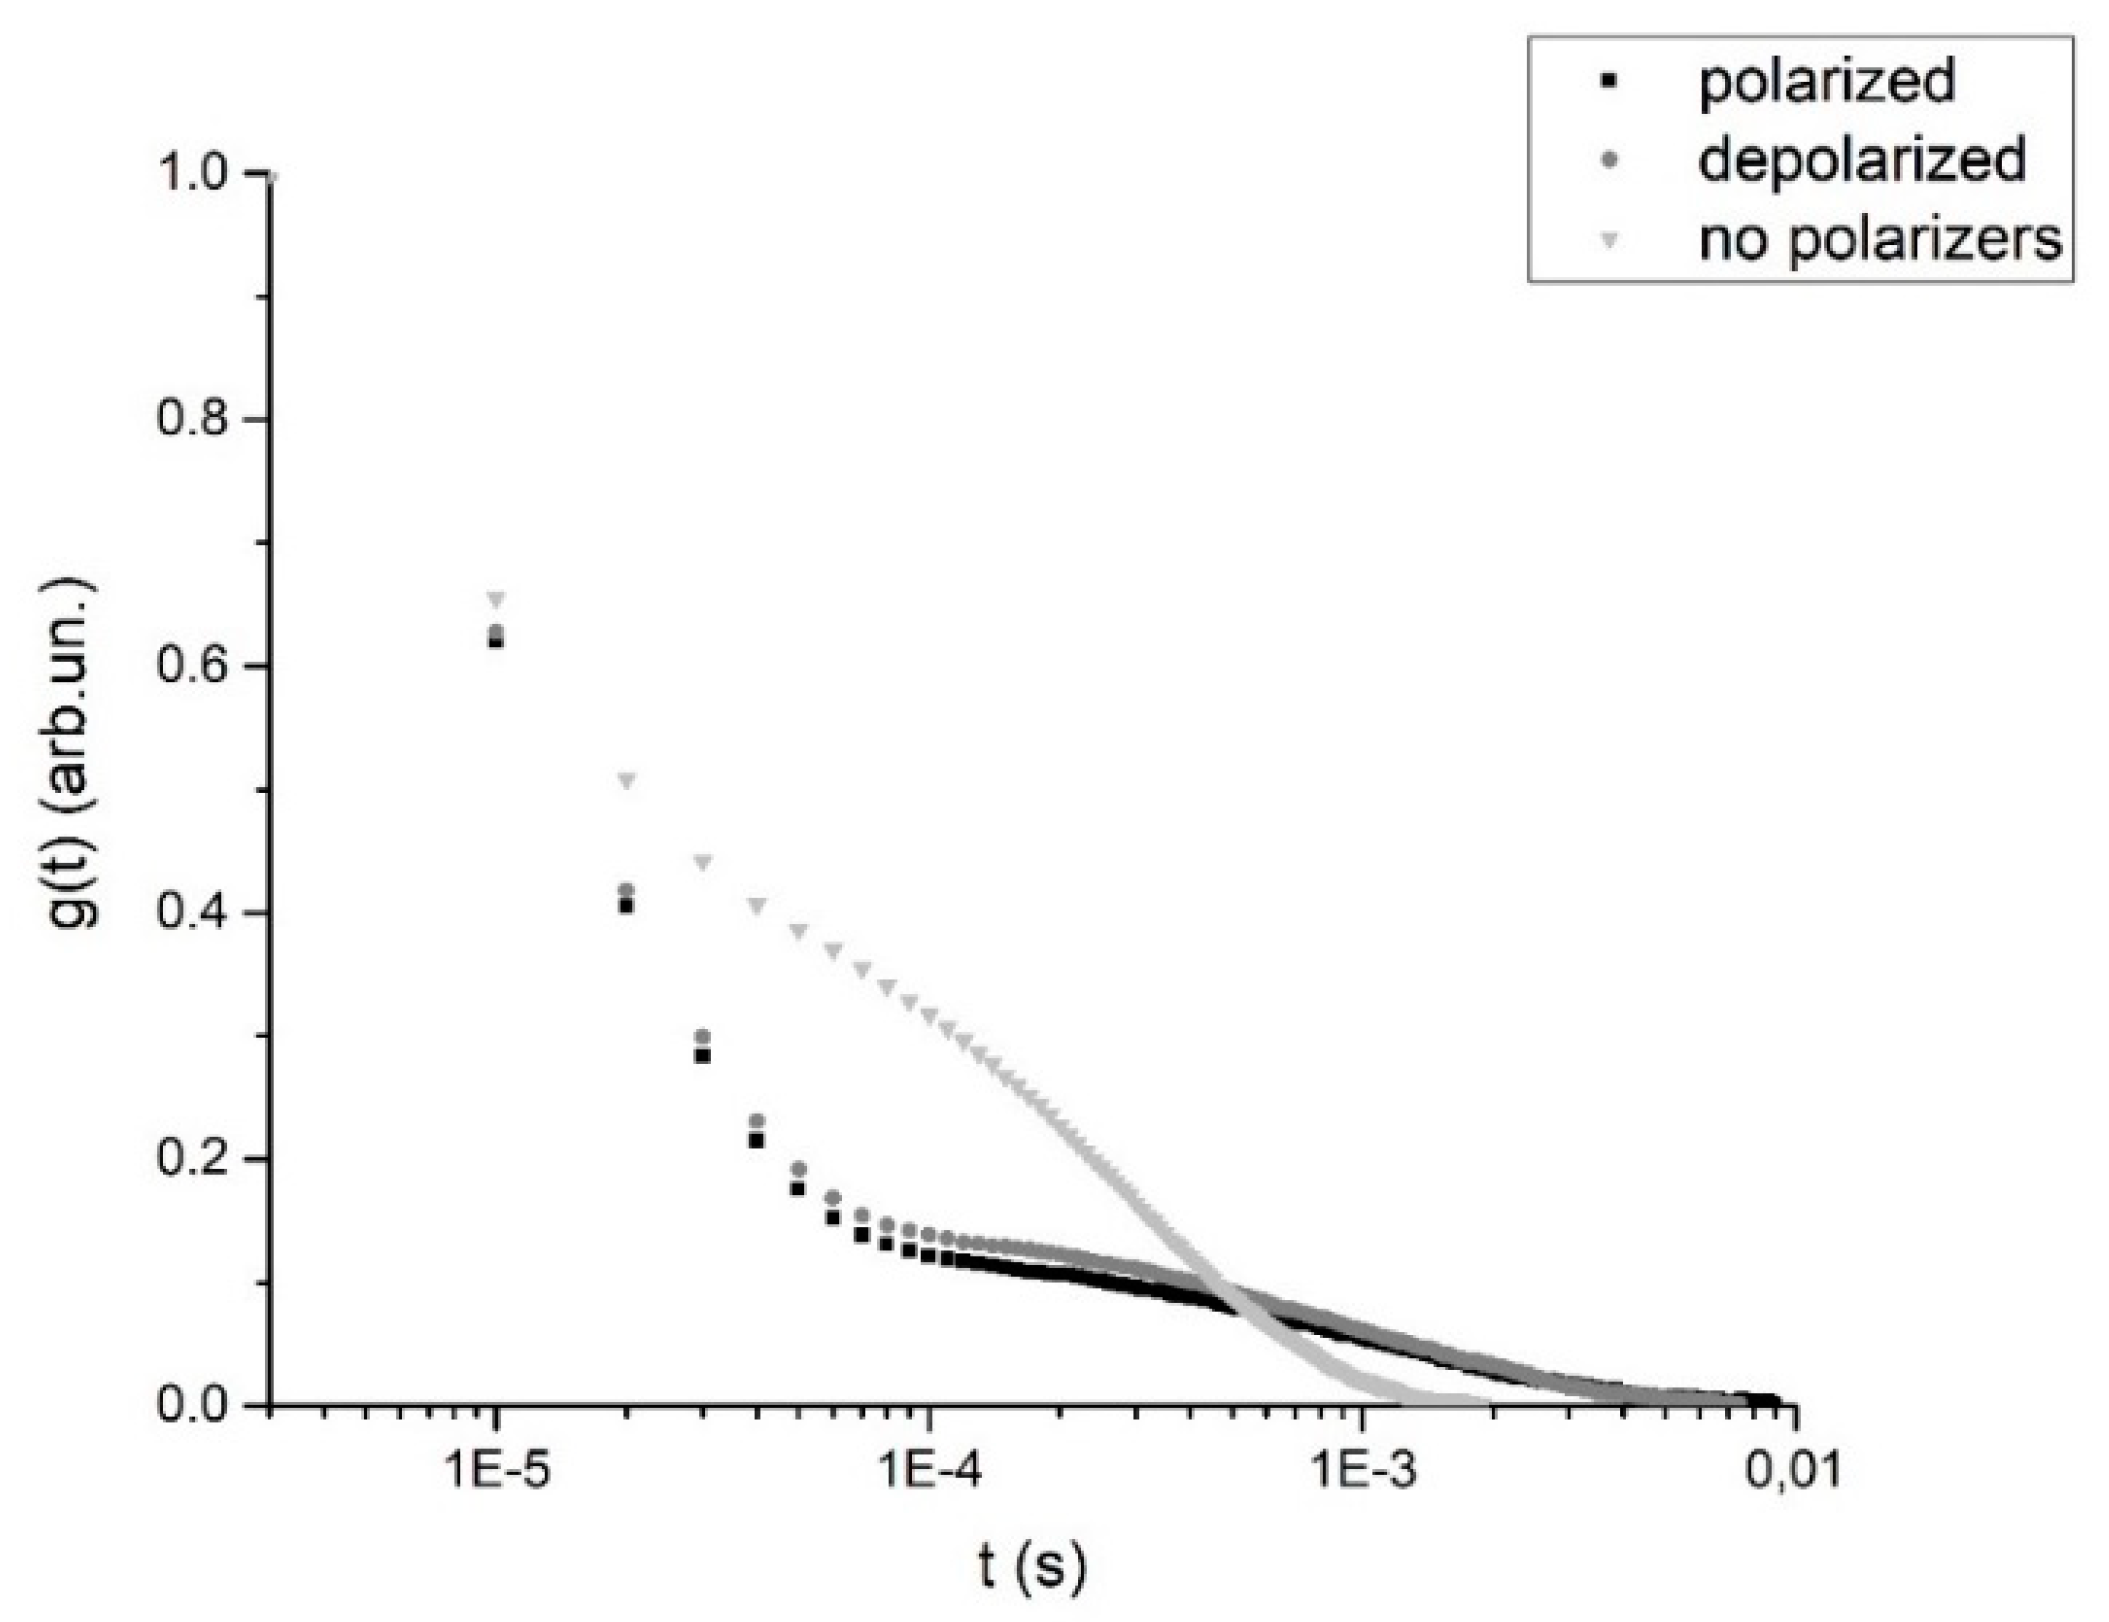
The next step was the characterization with the DDLS method. The autocorrelation functions of scattered light were measured for two positions of the rotating polarizer VV and VH. The results are presented in Figure 7. These functions were measured for the magnetic fluid diluted 200 times at 1 h after dilution (as in Figure 5).
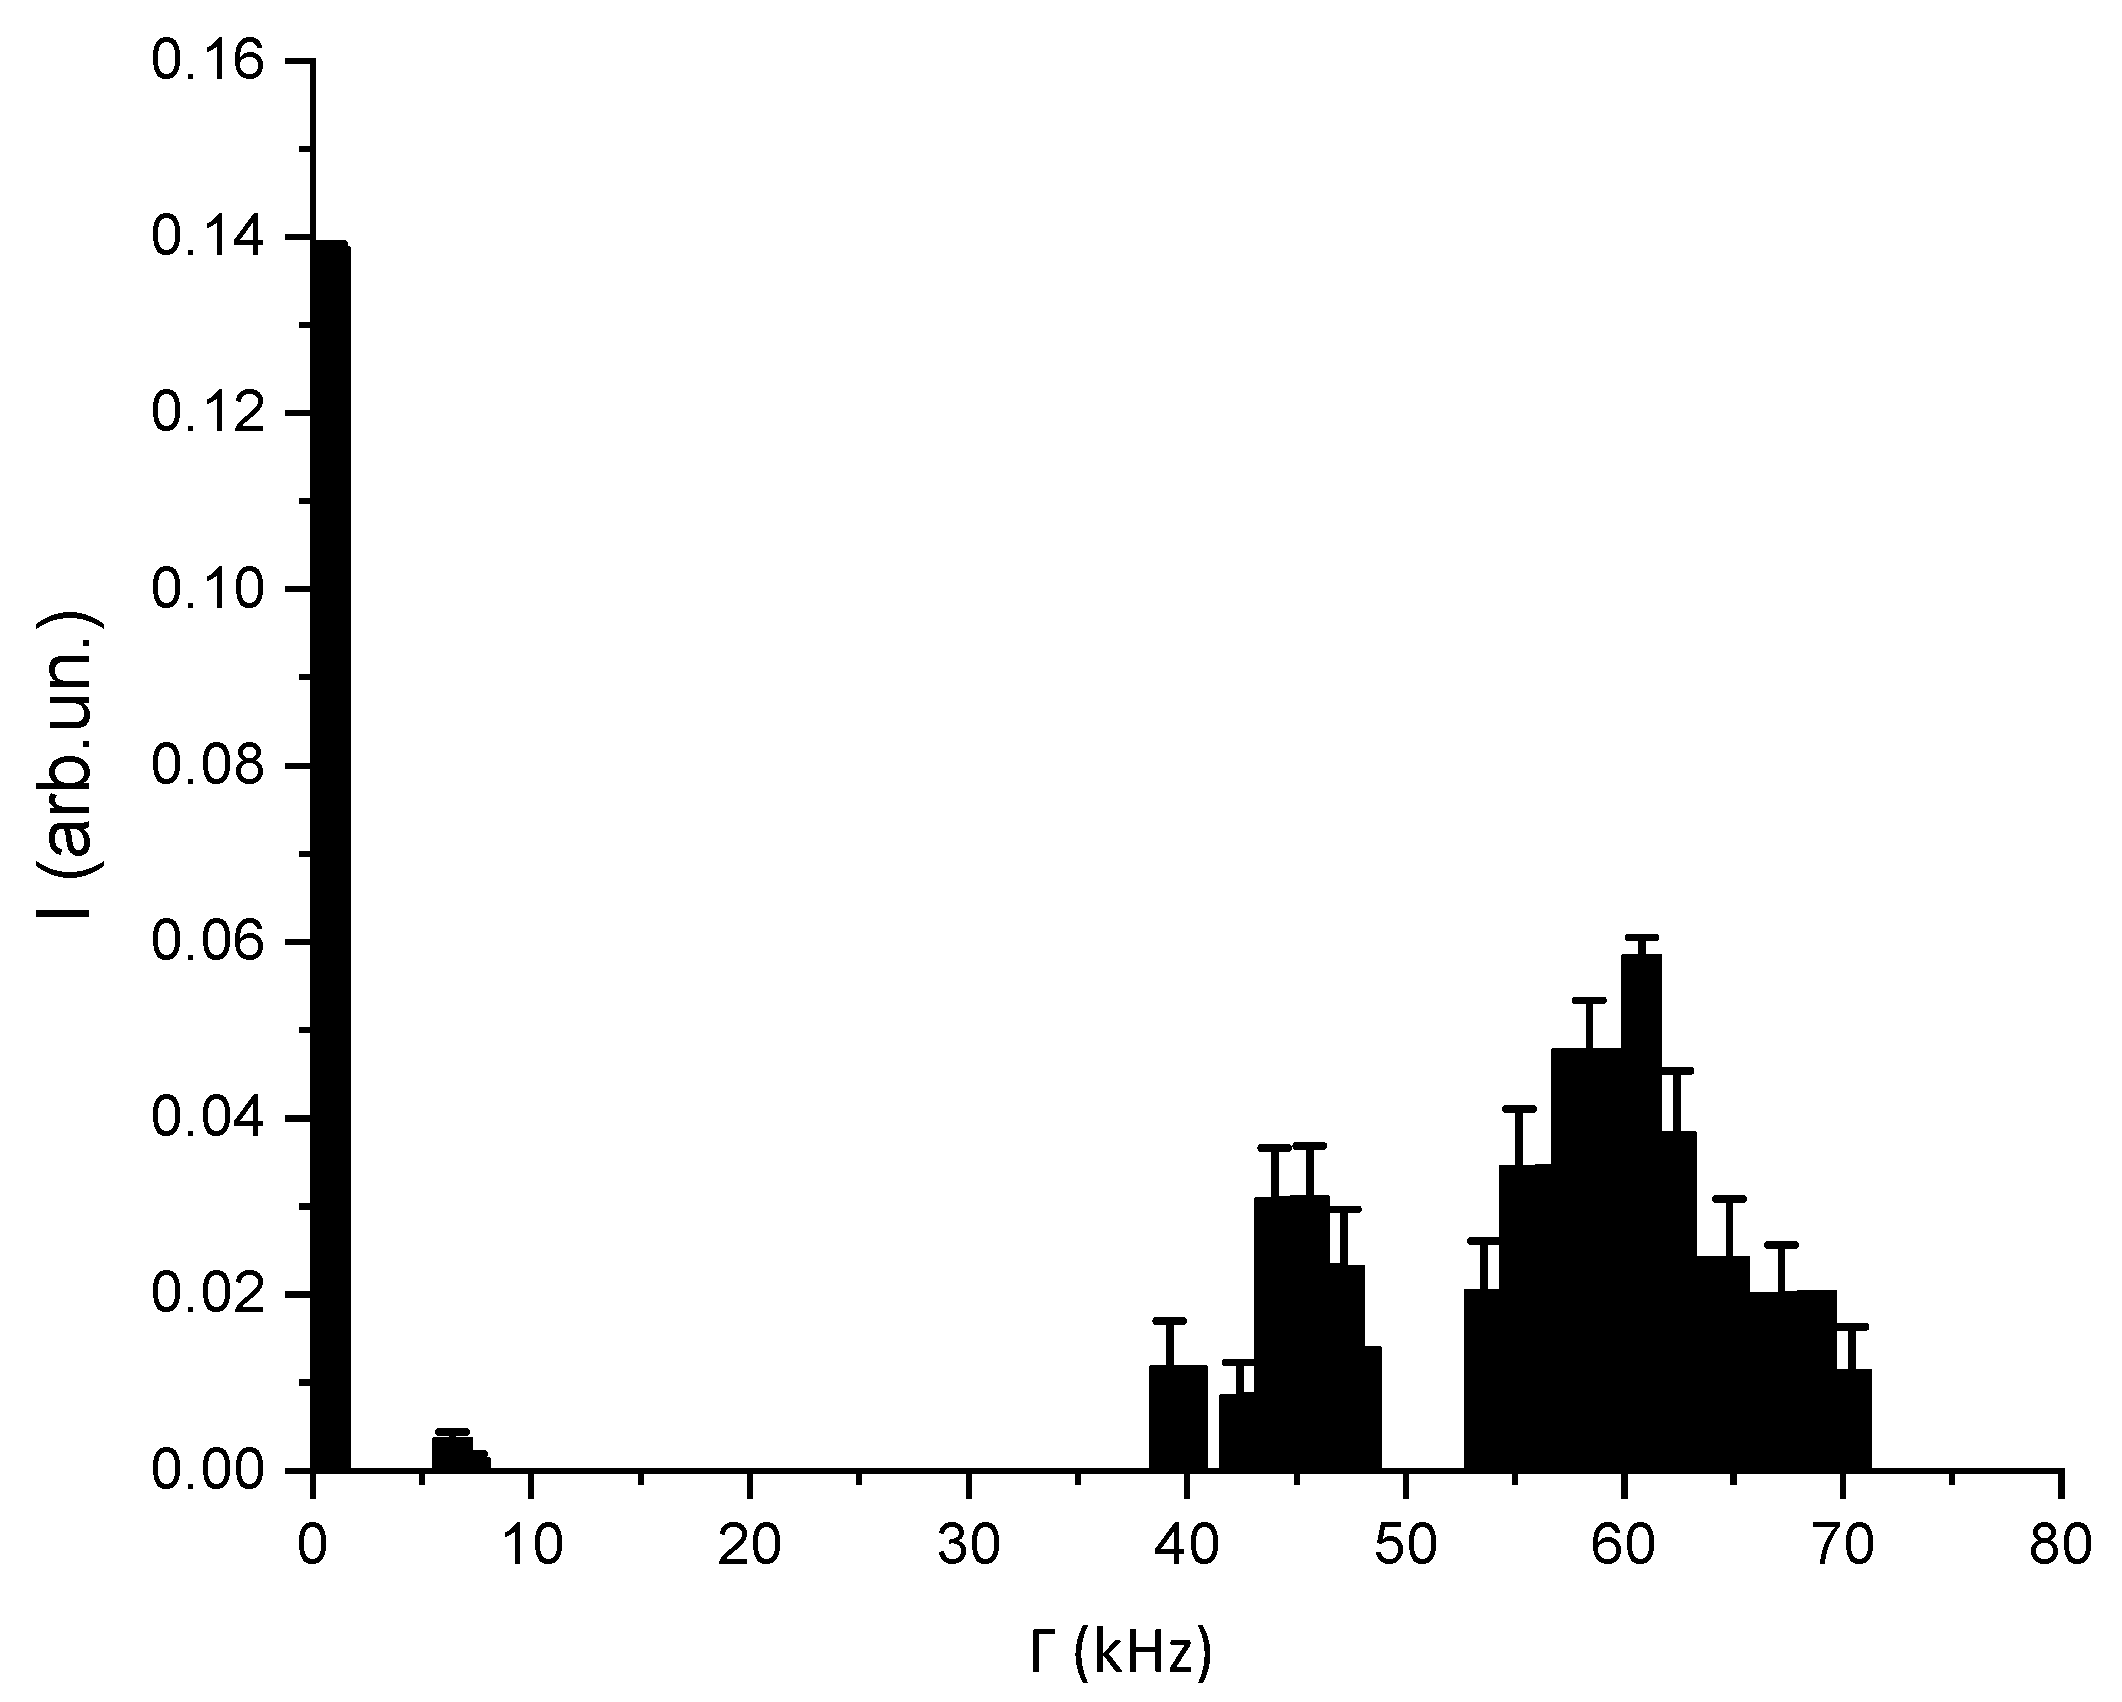
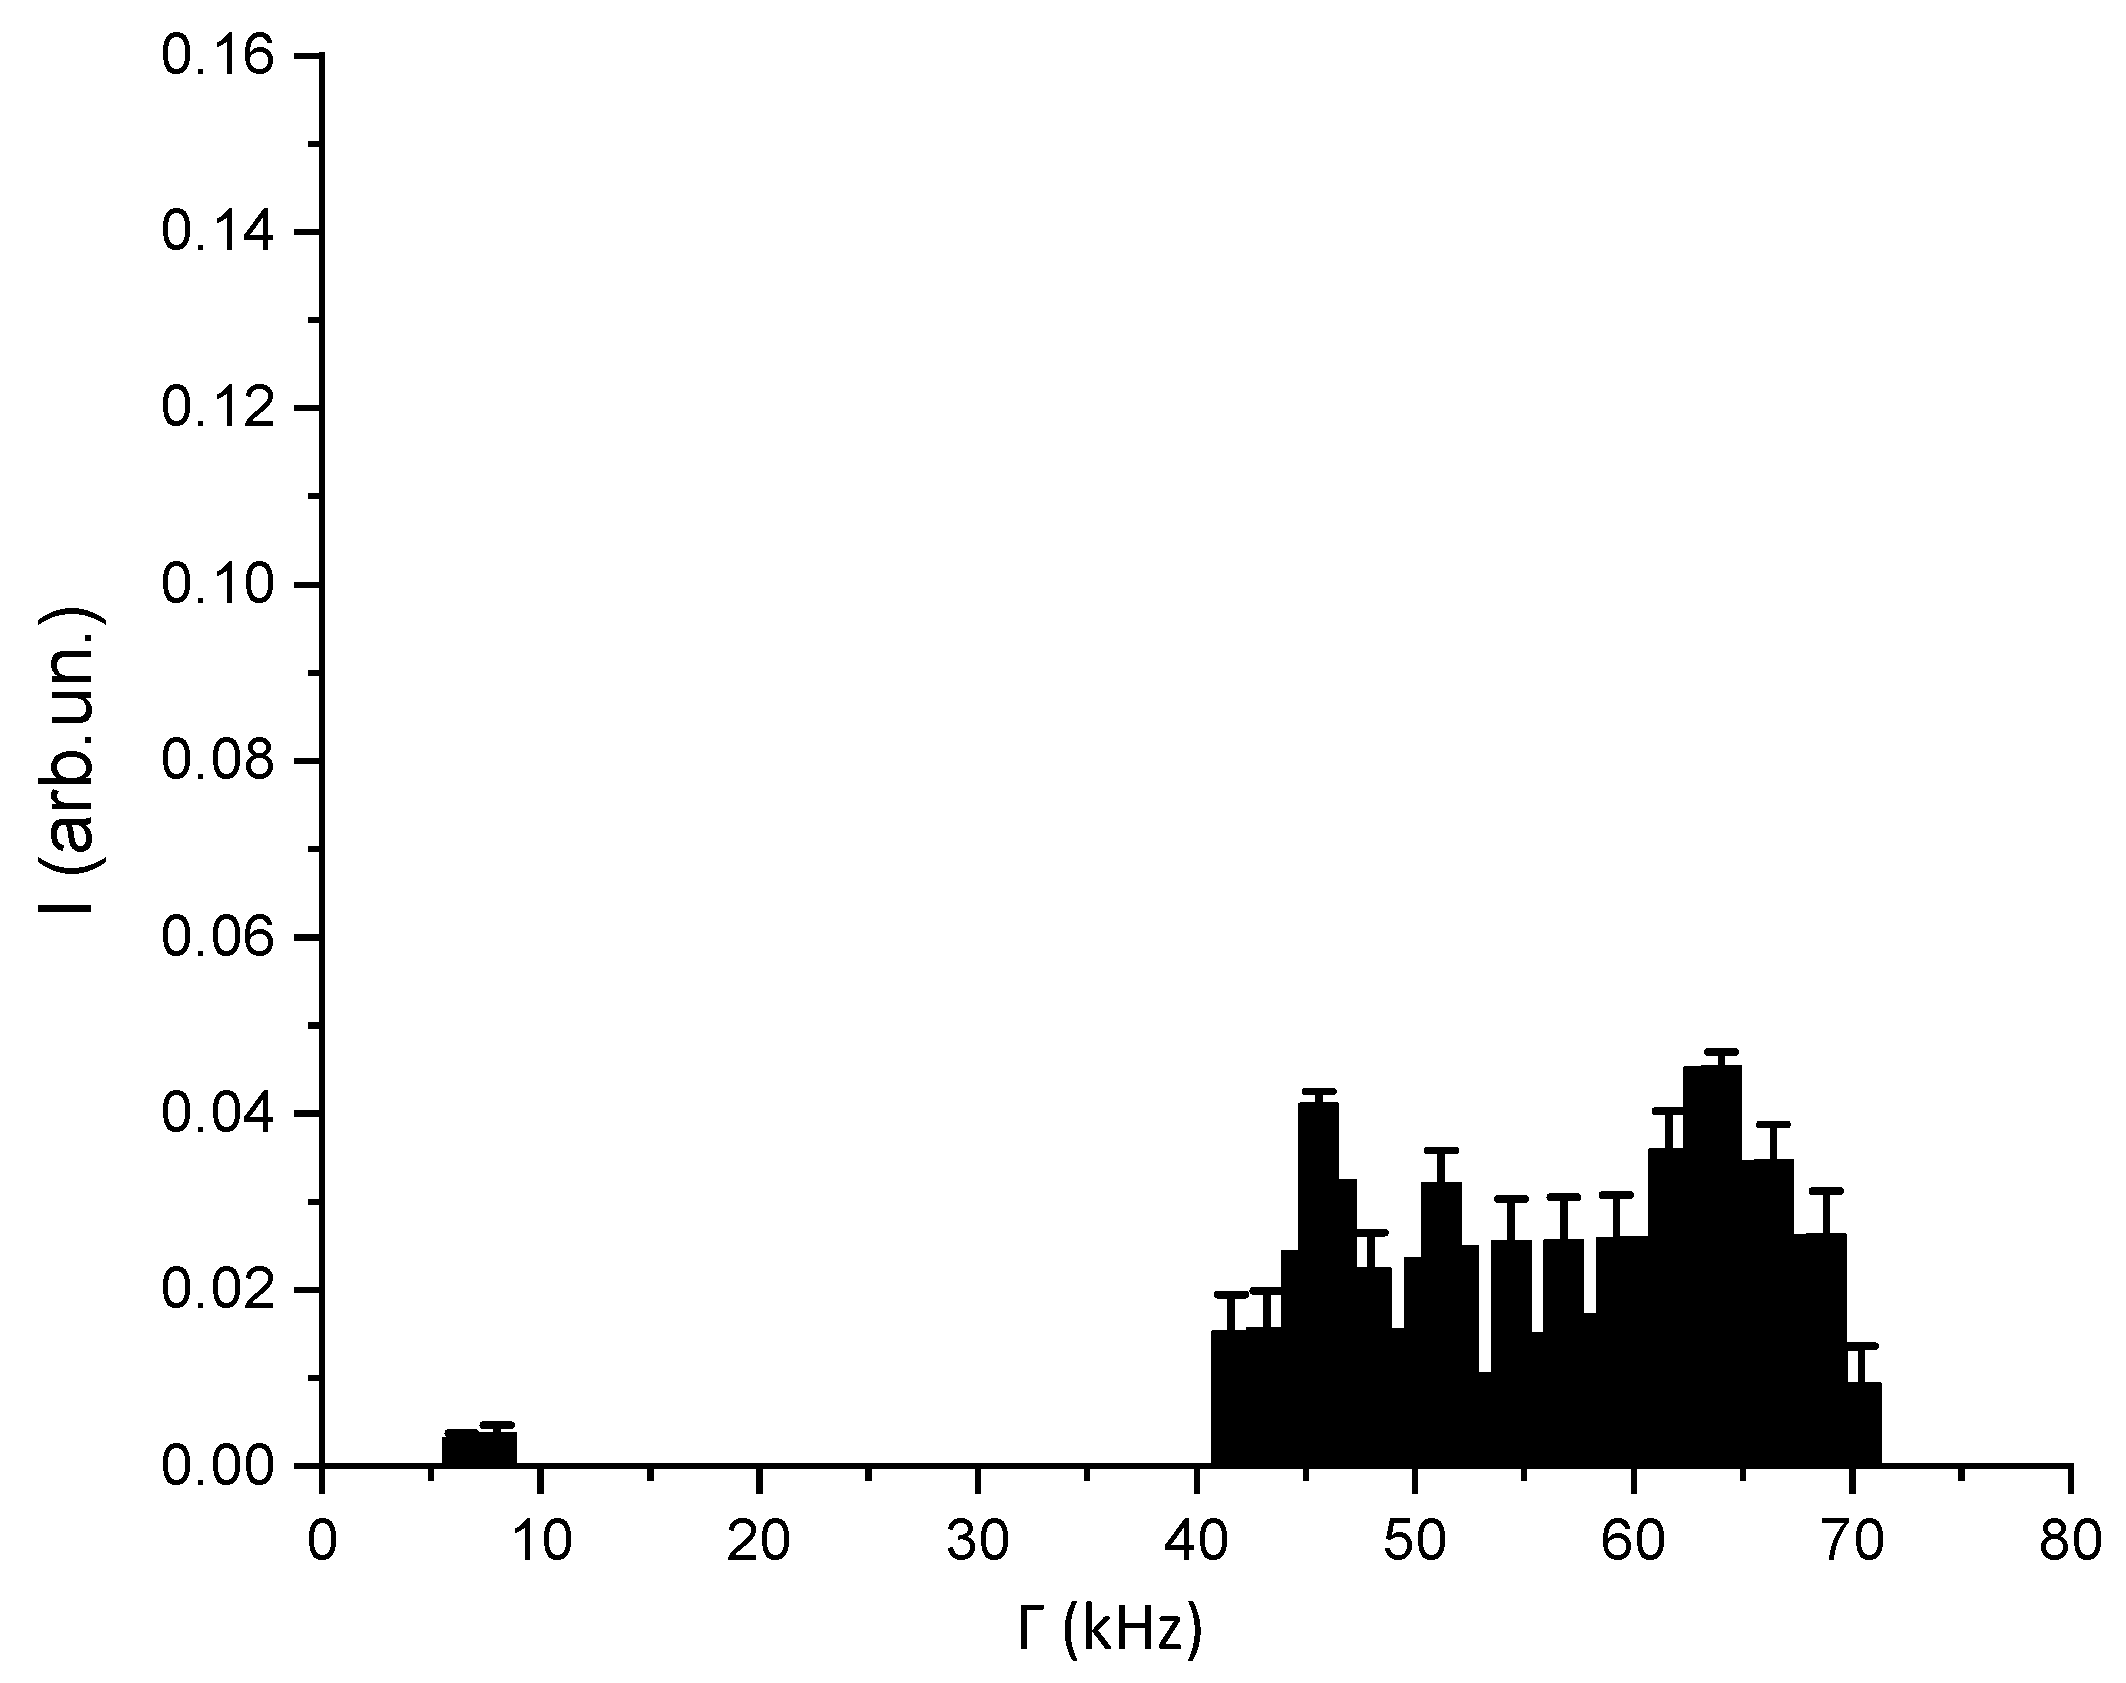
The similarity of the autocorrelation functions for the polarized and depolarized scattering components is evidence of the presence of unexpressed particle nonsphericity, while the difference between these functions and the classical autocorrelation curve shows that the representation of scatterers in the form of spheres for a given solution is not completely justified. Using the program based on Tikhonov regularization for processing experimental data for the polarized and depolarized components [34,35], the parameters ΓVV = Γ1 + Γ2 and ΓVH = Γ2 were calculated using Equation (14). The results are shown in Figure 8 and Figure 9.
The obtained values of the Γ1 and Γ2 indices for the polarized and depolarized components of the scattered light were used to calculate the translational and rotational diffusion coefficients for aggregates of magnetic particles and for single nanoparticles through simple Equation (15). We employed the iterative nonlinear squares method to calculate the DT and DR distributions for each Γ1 and Γ2 combination.
It was decided to present the magnetic particles in the form of ellipsoids. The radii of the semi-axes of the ellipsoids were calculated using Equation (16).
The final conclusion about the nonsphericity of nanoparticles was made from the results of the calculation of the aspect ratio ε = db/da, where da = 2Ra and db = 2Rb. The results are shown in Table 1 and Figure 10. We detected that both aggregates consisted of several nanoparticles (the first row in Table 1) and single particles (the second row in Table 1). In the table, we present intervals of detected particle sizes measured at the level of one-half of maximal scattering intensity in the peak. The error was calculated as the confidence interval computed at the 95% confidence level for M = 10.
As shown in Figure 10, the sizes of magnetic nanoparticles and their aggregates are presented by several peaks, each of which stands for da and db for aggregates and single particles. These separate peaks demonstrate a nonspherical shape of nanoparticles and their aggregates.

4. Conclusions

The optical, structural, phase composition, and magnetic properties of the magnetite-silica magnetic fluid synthesized from a ferric chloride and ferrous sulfate aqueous solution were investigated.
The granulometric composition of the magnetic fluid was studied by scanning and transmission electron microscopy. The magnetic fluid particles were found to be superparamagnetic with sizes of about 10 nm. SEM analysis and measurements of magnetic characteristics without a preliminary dilution or drying were performed for the first time. The phase composition was evaluated by X-ray diffraction and reflection high-energy electron diffraction, and magnetic properties were studied by vibrating sample magnetometry.
To study the shape parameters of the particles, the authors developed an improved method of dynamic light scattering—DDLS. The DDLS method we proposed was used to investigate coefficients of rotational and translational diffusion of single magnetic nanoparticles and their aggregates for the first time.
Longitudinal and transverse radii of the particle semi-axes were calculated on the assumption that the particle shape was ellipsoidal. The aspect ratio for the aggregates calculated by the DDLS method was 0.5–0.99, while individual nanoparticles were nearly spherical (the average aspect ratio was 0.9).
The results of the study made it possible to describe the shape and sizes of magnetic nanoparticles, as well as their aggregates. The sedimentation stability of the diluted magnetic fluid was also investigated. It was found that when the liquid was diluted 200 times, it partially lost its stability, and the nanoparticles aggregated and formed clusters about 140 nm in size. Further research will be focused on revealing the exact concentration boundaries of the sedimentation stability of the magnetic fluid. The proposed DDLS method can be applied in studies of structural and morphological properties of nanoparticles not only in diluted magnetic fluids but also in a number of metallic as well as biological fluid solutions.

Author Contributions

E.N.V., Conceptualization, Supervision, Writing—Review & Editing, Funding Acquisition; E.K.N., Methodology, Writing—Original Draft, Investigation; K.G.G., Resources, Writing—Review & Editing, Validation, Investigation; J.M., Resources; M.C.M., Resources, Writing—Review & Editing. All authors have read and agreed to the published version of the manuscript.

Funding

The work was supported by State assignment for basic research (Project No. FSEG-2020-0024).

Institutional Review Board Statement

Not applicable.

Informed Consent Statement

Not applicable.

Data Availability Statement

The data that support the finding of this research are not publicly available due to confidentiality constraints.

Conflicts of Interest

The authors declare no conflict of interest.

References

  1. Shliomis, M.I. Magnetic fluids. Soviet Phys. Uspekhi 1974, 17, 153–169. [Google Scholar] [CrossRef]
  2. Taketomi, S.; Shimbun, S. Magnetic Fluids—Principle and Application; Nikkan Kogyo Shinbun: Tokyo, Japan, 1988. [Google Scholar]
  3. Klimchitskaya, G.L.; Mostepanenko, V.M.; Nepomnyashchaya, E.K.; Velichko, E.N. Impact of magnetic nanoparticles on the Casimir pressure in three-layer systems. Phys. Rev. B 2019, 99, 45433. [Google Scholar] [CrossRef] [Green Version]
  4. Rinck, P.A. Magnetic Resonance in Medicine: The Basic Textbook of the European Magnetic Resonance Forum; Blackwell Scientific Publications: Oxford, UK, 1993. [Google Scholar]
  5. Li, Y.; Pu, S.; Zhao, Y.; Zhang, R.; Jia, Z.; Yao, J.; Li, X. All-fiber-optic vector magnetic field sensor based on side-polished fiber and magnetic fluid. Opt. Express 2019, 27, 35182–35188. [Google Scholar] [CrossRef] [PubMed]
  6. Wei, F.; Liu, D.; Mallik, A.K.; Farrel, G.; Wu, Q.; Peng, G.D.; Semenova, Y. Magnetic Field Sensor Based on a Tri-Microfiber Coupler Ring in Magnetic Fluid and a Fiber Bragg Grating. Sensors 2019, 19, 5100. [Google Scholar] [CrossRef] [Green Version]
  7. Peng, J.; Jia, S.; Bian, J.; Zhang, S.; Liu, J.; Zhou, X. Recent Progress on Electromagnetic Field Measurement Based on Optical Sensors. Sensors 2019, 19, 2860. [Google Scholar] [CrossRef] [Green Version]
  8. Oda, S.; Kitamoto, Y. Relationship between ion concentration of ferrofluid and response signals of magnetic nanoparticles against ac magnetic fields. AIP Adv. 2017, 7. [Google Scholar] [CrossRef] [Green Version]
  9. Alam, J.; Riaz, U.; Ahmad, S. Effect of ferrofluid concentration on electrical and magnetic properties of the Fe3O4/PANI nanocomposites. J. Magn. Magn. Mater. 2007, 314, 93–99. [Google Scholar] [CrossRef]
  10. Skumiel, A.; Józefczak, A.; Hornowski, T.; Łabowski, M. The influence of the concentration of ferroparticles in a ferrofluid on its magnetic and acoustic properties. J. Phys. D Appl. Phys. 2003, 36, 3120–3124. [Google Scholar] [CrossRef]
  11. Hejazian, M.; Nguyen, N.T. Magnetofluidic concentration and separation of non-magnetic particles using two magnet arrays. Biomicrofluidics 2016, 10. [Google Scholar] [CrossRef] [Green Version]
  12. Sabet Sarvestany, N.; Farzad, A.; Ebrahimnia-Bajestan, E.; Mir, M. Effects of magnetic nanofluid fuel combustion on the performance and emission characteristics. J. Dispers. Sci. Technol. 2014, 35, 1745–1750. [Google Scholar] [CrossRef]
  13. Bogachev, Y.V.; Chernenco, J.S.; Gareev, K.G.; Kononova, I.E.; Matyushkin, L.B.; Moshnikov, V.A.; Nalimova, S.S. The Study of Aggregation Processes in Colloidal Solutions of Magnetite-Silica Nanoparticles by NMR Relaxometry, AFM, and UV-Vis-Spectroscopy. Appl. Magn. Reson. 2014, 45, 329–337. [Google Scholar] [CrossRef]
  14. Yerin, C.V.; Vivchar, V.I. Ellipsometry of magnetic fluid in a magnetic field. J. Magn. Magn. Mater. 2020, 498, 166144. [Google Scholar] [CrossRef]
  15. Brinker, C.; Scherer, G. Sol-Gel Science: The Physics and Chemistry of Sol-Gel Processing; Academic Press: Cambridge, MA, USA, 2013. [Google Scholar]
  16. Toropova, Y.G.; Golovkin, A.S.; Malashicheva, A.B.; Korolev, D.V.; Gorshkov, A.N.; Gareev, K.G.; Afonin, M.V.; Galagudza, M.M. In vitro toxicity of FemOn, FemOn-SiO2 composite, and SiO2-FemOn core-shell magnetic nanoparticles. Int. J. Nanomed. 2017, 12, 593–603. [Google Scholar] [CrossRef] [PubMed] [Green Version]
  17. Levin, A.D.; Nikitin, M.P.; Alenichev, M.K.; Drozhzhennikova, E.B.; Grigorenko, V.G.; Ringaci, A.S.; Andreeva, I.P. Nano-biosensors based on dynamic light scattering. Opt. Methods Insp. Charact. Imaging Biomater. IV 2019, 11060, 110600Y. [Google Scholar]
  18. Ashikhmin, V.S. Photocor Mini User Manual; Photocor: Moscow, Russia, 2017. [Google Scholar]
  19. Martchenko, I.; Dietsch, H.; Moitzi, C.; Schurtenberger, P. Hydrodynamic Properties of Magnetic Nanoparticles with Tunable Shape Anisotropy: Prediction and Experimental Verification. J. Phys. Chem. B 2011, 115, 14838–14845. [Google Scholar] [CrossRef]
  20. Geers, C.; Rodriguez-Lorenzo, L.; Urban, D.; Kinnear, C.; Petri-Fink, A.; Balog, S. A new angle on dynamic depolarized light scattering: Number-averaged size distribution of nanoparticles in focus. Nanoscale 2016, 8, 15813–15821. [Google Scholar] [CrossRef] [Green Version]
  21. Moore, T.L.; Urban, D.A.; Rodriguez-Lorenzo, L.; Milosevic, A.; Crippa, F.; Spuch-Calvar, M.; Balog, S.; Rothen-Rutishauser, B.; Lattuada, M.; Petri-Fink, A. Nanoparticle administration method in cell culture alters particle-cell interaction. Sci. Rep. 2019, 9, 900. [Google Scholar] [CrossRef]
  22. Gan Jia Gui, N.; Stanley, C.; Nguyen, N.-T.; Rosengarten, G. Ferrofluids for heat transfer enhancement under an external magnetic field. Int. J. Heat Mass Transf. 2018, 123, 110–121. [Google Scholar] [CrossRef]
  23. Gareev, K.G.; Rejnyuk, A.V.; Testov, D.O.; Luchinin, V.V.; Moshnikov, V.A. Method of Producing Magnetic Fluid. Russian Federation Patent 2,639,709, 22 December 2017. [Google Scholar]
  24. Levin, A.D.; Shmytkova, E.A.; Khlebtsov, B.N. Multipolarization Dynamic Light Scattering of Nonspherical Nanoparticles in Solution. J. Phys. Chem. C 2017, 3070, 3077. [Google Scholar] [CrossRef]
  25. Nepomnyashchaya, E.; Aksenov, E.; Velichko, E. Molecular dynamics as studied by laser correlation spectroscopy. In Proceedings of the 2017 Progress in Electromagnetics Research Symposium, St. Petersburg, Russia, 22–25 May 2017; pp. 3556–3562. [Google Scholar]
  26. Stetefeld, J.; McKenna, S.A.; Patel, T.R. Dynamic light scattering: A practical guide and applications in biomedical sciences. Biophys. Rev. 2016, 8, 409–427. [Google Scholar] [CrossRef]
  27. Pecora, R. Doppler shifts in light scattering from pure liquids and polymer solutions. J. Chem. Phys. 1964, 40, 1604–1614. [Google Scholar] [CrossRef]
  28. Berne, B.J.; Pecora, R. Dynamic Light Scattering; John Wiley: New York, NY, USA, 1976. [Google Scholar]
  29. Lehner, D.; Lindner, H.; Glatter, O. Determination of the translational and rotational diffusion coefficients of rodlike particles using depolarized dynamic light scattering. Langmuir 2000, 16, 1689–1695. [Google Scholar] [CrossRef]
  30. Shetty, A.M.; Wilkins, G.M.H.; Nanda, J.; Solomon, M.J. Multiangle depolarized dynamic light scattering of short functionalized single-walled carbon nanotubes. J. Phys. Chem. C 2009, 113, 7129–7133. [Google Scholar] [CrossRef]
  31. Escobedo-Sánchez, M.A.; de La Cruz-Burelo, H.A.; Arauz-Lara, J.L.; Haro-Pérez, C.; Rojas-Ochoa, L.F. Study of translational and rotational dynamics of birefringent colloidal particles by depolarized light scattering in the far- and near-field regimes. J. Chem. Phys. 2015, 143, 044902. [Google Scholar] [CrossRef]
  32. Quirantes, A.; Ben-Taleb, A.; Delgado, A.V. Determination of size/shape parameters of colloidal ellipsoids by photon correlation spectroscopy. Colloids Surf. A Physicochem. Eng. Asp. 1996, 119, 73–80. [Google Scholar] [CrossRef]
  33. Bossert, D.; Natterodt, J.; Urban, D.A.; Weder, C.; Petri-Fink, A.; Balog, S. Speckle-Visibility Spectroscopy of Depolarized Dynamic Light Scattering. J. Phys. Chem. B 2017, 121, 7999–8007. [Google Scholar] [CrossRef] [Green Version]
  34. Nepomnyashchaya, E.; Velichko, E.; Kotov, O. Determination of Noise Components in Laser Correlation Spectroscopic Devices for Signal-to-Noise Ratio Estimation. In Proceedings of the 2019 IEEE International Conference on Electrical Engineering and Photonics (EExPolytech), St. Petersburg, Russia, 17–18 October 2019. [Google Scholar]
  35. Nepomnyashchaya, E.; Velichko, E.; Aksenov, E. Inverse problem of laser correlation spectroscopy for analysis of polydisperse solutions of nanoparticles. J. Phys. Conf. Ser. 2016, 769, 012025. [Google Scholar] [CrossRef] [Green Version]
  36. Kharitonskii, P.V.; Gareev, K.G.; Ionin, S.A.; Ryzhov, V.A.; Bogachev, Y.V.; Klimenkov, B.D.; Kononova, I.E.; Moshnikov, V.A. Microstructure and magnetic state of Fe3O4-SiO2 colloidal particles. J. Magn. 2015, 20, 221–228. [Google Scholar] [CrossRef] [Green Version]
  37. Vezo, O.S.; Gareev, K.G.; Korolev, D.V.; Kuryshev, I.A.; Lebedev, S.V.; Moshnikov, V.A.; Sergienko, E.S.; Kharitonskii, P.V. Aggregate stability and magnetic characteristics of colloidal FemOn–SiO2 particles obtained by sol–gel method. Phys. Solid State 2017, 59, 1008–1013. [Google Scholar] [CrossRef]
  38. Tohver, V.; Smay, J.E.; Braem, A.; Braun, P.V.; Lewis, J.A. Nanoparticle halos: A new colloid stabilization mechanism. Proc. Natl. Acad. Sci. USA 2001, 98, 8950–8954. [Google Scholar] [CrossRef] [Green Version]
  39. Mo, S.; Shao, X.; Chen, Y.; Cheng, Z. Increasing entropy for colloidal stabilization. Sci. Rep. 2016, 6, 36836. [Google Scholar] [CrossRef] [PubMed] [Green Version]
  40. Watarai, H.; Memon Sakurai, S.S. Critical Detection of Agglomeration of Magnetic Nanoparticles by Magnetic Orientational Linear Dichroism. Langmuir 2020, 36, 12414–12422. [Google Scholar] [CrossRef] [PubMed]
  41. Gareev, K.G. Interaction of Nanocomposites Based on the FemOn–SiO2 System with an Electromagnetic Field in an Ultra-Wide Frequency Range. Magnetochemistry 2020, 6, 24. [Google Scholar] [CrossRef]
  42. Coey, J.M.D. Magnetism and Magnetic Materials; Cambridge University Press: Cambridge, UK, 2010; ISBN 978-0-521-81614-4. [Google Scholar]
  43. Kirschvink, J.; Jones, D.; MacFadden, B. Magnetite Biomineralization and Magnetoreception in Organisms: A New Biomagnetism; Plenum Press: New York, NY, USA, 1985. [Google Scholar]
  44. Nepomnyashchaya, N.; Velichko, E. Modification of laser correlation spectroscopy method for analyzing polydisperse nanoparticle suspensions. St. Petersburg Polytech. Univ. J. Phys. Math. 2019, 44, 73–87. [Google Scholar] [CrossRef]
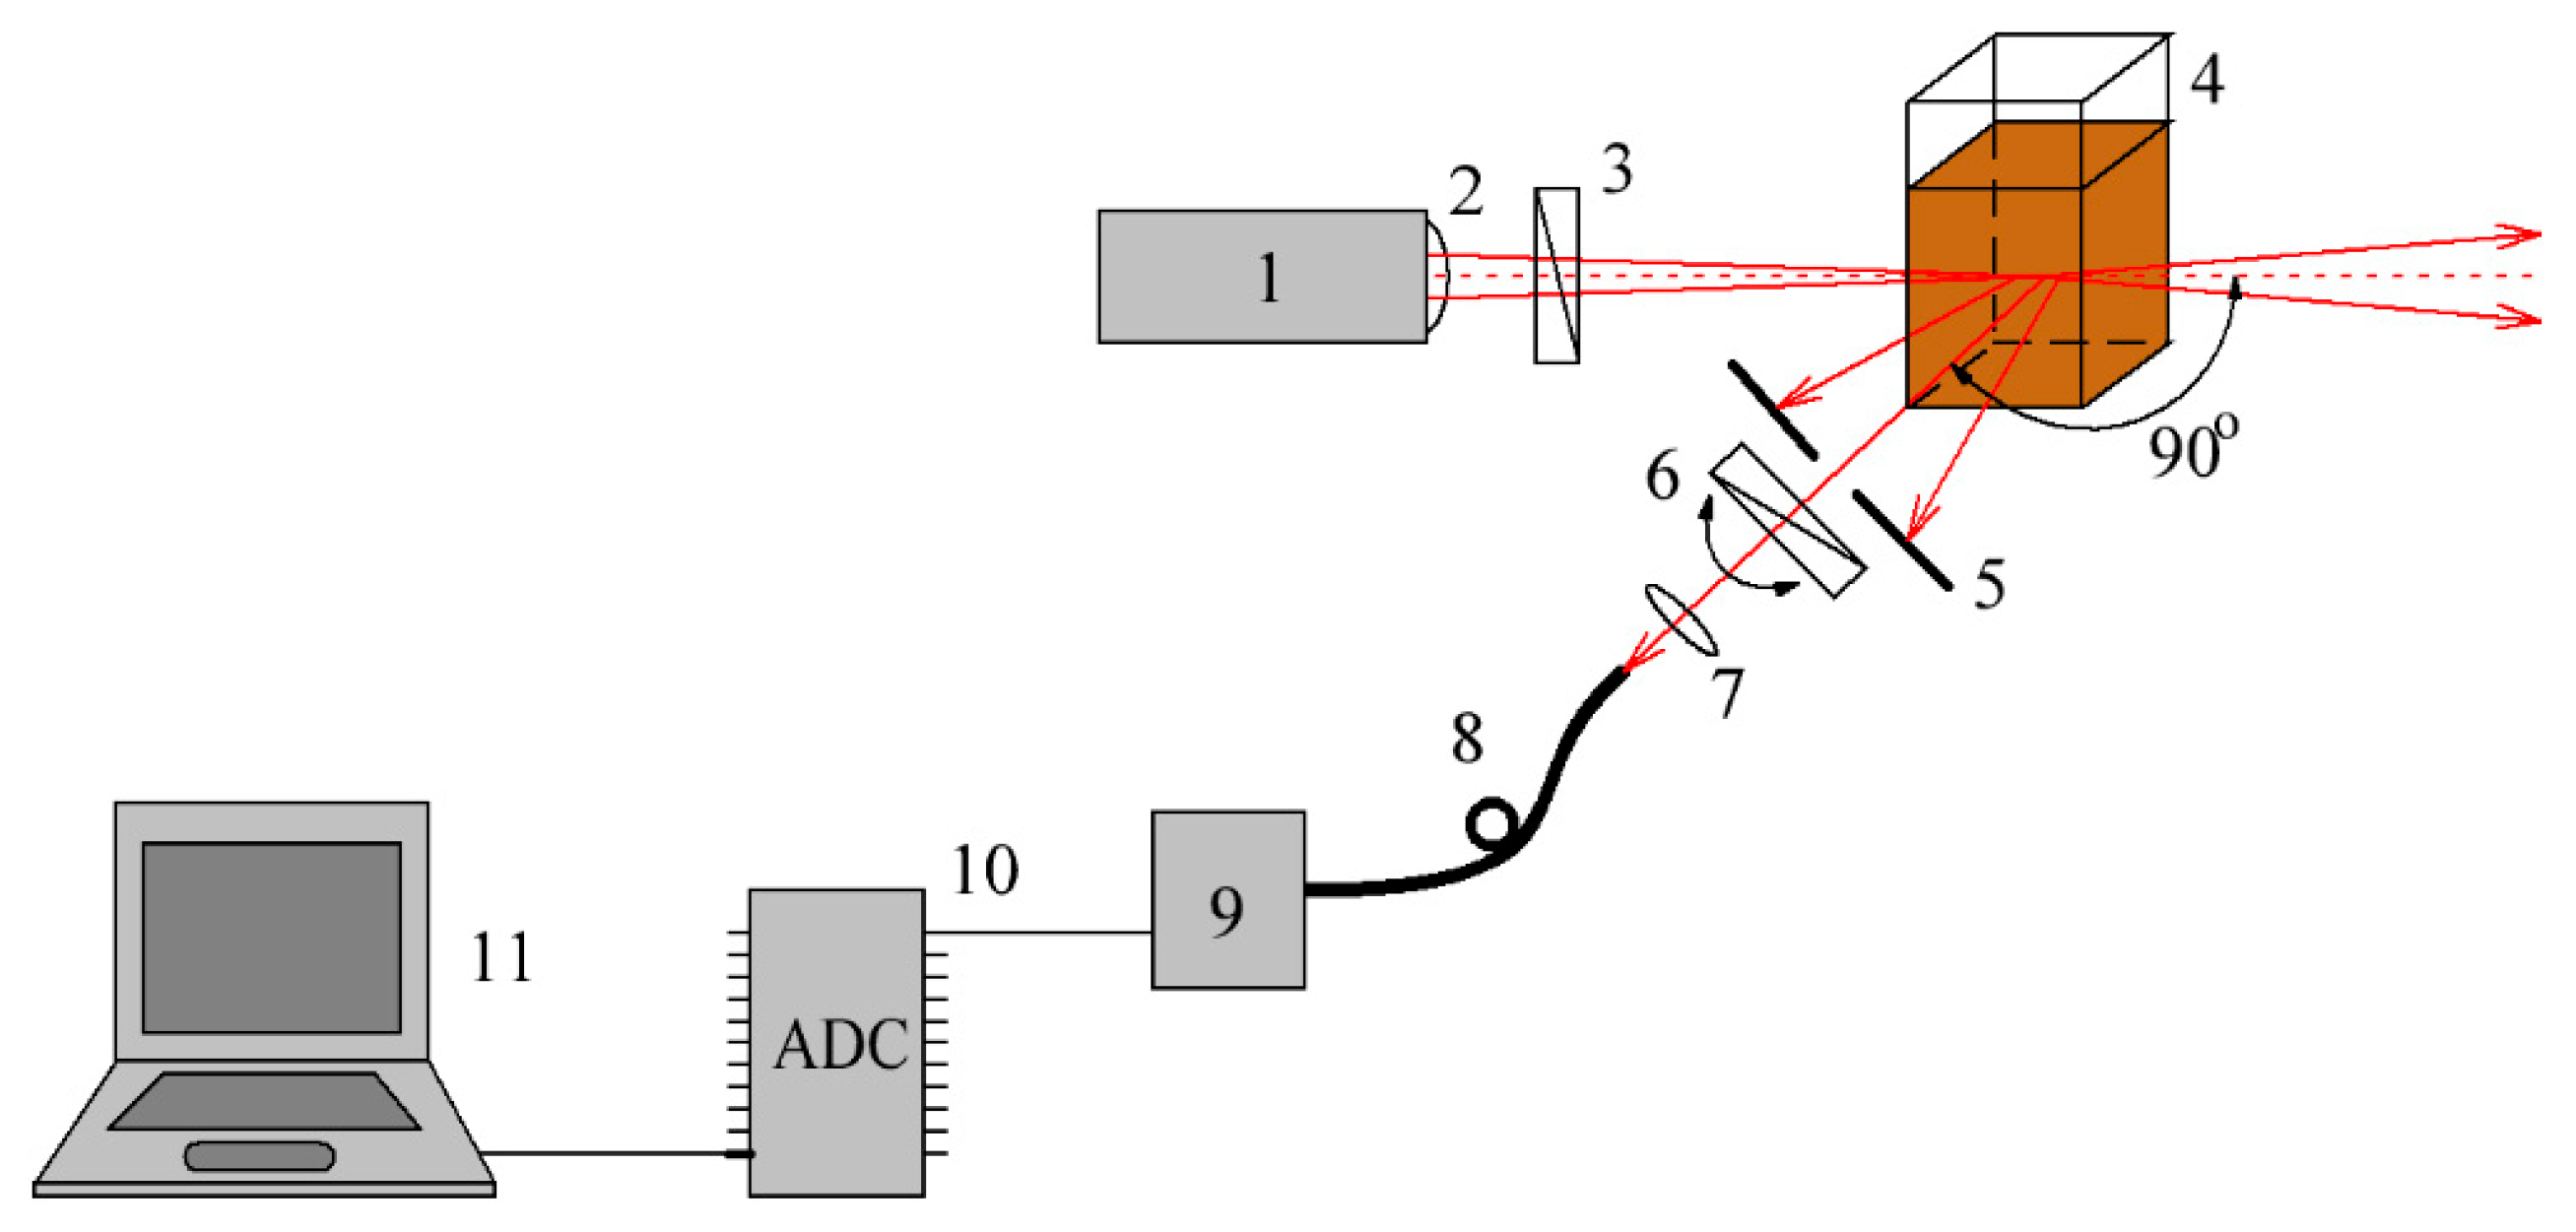
Figure 1. Laser correlation spectrometer. 1—laser radiation source; 2—aspherical focusing lens; 3—input polarizer; 4—cuvette with the fluid studied; 5—output diaphragms; 6—output rotating polarizer; 7—focusing lens; 8—optical fiber; 9—photomultiplier; 10— analog-to-digital converter; 11—computer.
Applsci 11 00183 g001
Figure 2. Physicochemical properties of dried magnetic fluid: (a) scanning electron microscopy image; (b) transmission electron microscopy image; (c) X-ray diffraction pattern; (d) reflection high-energy electron diffraction pattern.
Applsci 11 00183 g002
Figure 3. Magnetization reversal curve of the liquid sample of magnetic fluid with a concentration of 30 mg/mL.
Applsci 11 00183 g003
Figure 4. Particle size distribution obtained by conventional DLS technique.
Applsci 11 00183 g004
Figure 5. Experimental distribution of particle sizes in magnetic fluid 24 h after dilution. Data are displayed as mean ± CI, M = 10.
Applsci 11 00183 g005
Figure 6. Experimental distribution of particle sizes in magnetic fluid 5 days after dilution. Data are displayed as mean ± CI, M = 10.
Applsci 11 00183 g006
Figure 7. Autocorrelation functions of scattered light for polarized scattered light (VV), depolarized scattered light (VH), and without output rotating polarizer.
Applsci 11 00183 g007
Figure 8. Calculation of ΓVV = Γ1 + Γ2 for VV polarization. Data are displayed as mean ± CI, M = 10.
Applsci 11 00183 g008
Figure 9. Calculation of ΓVH = Γ2 for VH polarization. Data are displayed as mean ± CI, M = 10.
Applsci 11 00183 g009
Figure 10. Sizes of nanoparticles in a magnetic fluid calculated using the theory of polarization scattering.
Applsci 11 00183 g010
Table 1. Results of the depolarized dynamic light scattering (DDLS) method.
DT (µm2/s)DR (1/s)da (nm)db (nm)ε
(2.8 ± 0.2)–(3.5 ± 0.3)(700 ± 64)–(1060 ± 100)(146 ± 14)–(188 ± 18)(86 ± 8)–(140 ± 1.2)(0.55 ± 0.04)–(0.96 ± 0.04)
(58.0 ± 5.6)–(80.0 ± 7.5)(4.0 ± 0.3) × 105–(6.0 ± 0.5) × 105(8.2 ± 0.7)–(10.0 ± 0.9)(7.0 ± 0.6)–(9.4 ± 0.8)(0.85 ± 0.04)–(0.90 ± 0.09)
Publisher’s Note: MDPI stays neutral with regard to jurisdictional claims in published maps and institutional affiliations.