Article

Distribution of Growth-Inhibiting Bacteria against the Toxic Dinoflagellate Alexandrium catenella (Group I) in Akkeshi-Ko Estuary and Akkeshi Bay, Hokkaido, Japan

1
Graduate School of Fisheries Sciences, Hokkaido University, 3-1-1 Minato-cho, Hakodate, Hokkaido 041-8611, Japan
2
Department of Botany, National Museum of Nature and Science, 4-1-1 Amakubo, Tsukuba, Ibaraki 305-0005, Japan
3
Lake Biwa Museum, 1091 Oroshimo-cho, Kusatsu, Shiga 525-0001, Japan
*
Author to whom correspondence should be addressed.
Appl. Sci. 2021, 11(1), 172; https://doi.org/10.3390/app11010172
Submission received: 22 October 2020 / Revised: 19 December 2020 / Accepted: 21 December 2020 / Published: 27 December 2020
(This article belongs to the Special Issue Advanced Harmful Algal Bloom Control and Sustainable Water Supply)

Abstract

:
The distribution of growth-inhibiting bacteria (GIB) against the toxic dinoflagellate Alexandrium catenella (Group I) was investigated targeting seagrass leaves and surface waters at the seagrass bed of Akkeshi-ko Estuary and surface waters of nearshore and offshore points of Akkeshi Bay, Japan. Weekly samplings were conducted from April to June in 2011. GIBs were detected from surface of leaves of the seagrass Zostera marina in Akkeshi-ko Estuary (7.5 × 10⁵–4.7 × 10⁶ colony-forming units: CFU g−1 wet leaf) and seawater at the stations in Akkeshi Bay (6.7 × 100–1.1 × 10³ CFU mL−1). Sequence analyses revealed that the same bacterial strains with the same 16S rRNA sequences were isolated from the surface biofilm of Z. marina and the seawater in the Akkeshi Bay. We therefore strongly suggested that seagrass beds are the source of algicidal and growth-inhibiting bacteria in coastal ecosystems. Cells of A. catenella were not detected from seawaters in Akkeshi-ko Estuary and the coastal point of Akkeshi Bay, but frequently detected at the offshore point of Akkeshi Bay. It is suggested that A. catenella populations were suppressed by abundant GIBs derived from the seagrass bed, leading to the less toxin contamination of bivalves in Akkeshi-ko Estuary.

1. Introduction

The toxic dinoflagellate Alexandrium catenella (Miozoa, Dinophyceae) (Group I, formerly A. tamarense and toxic [1]) is known to produce strong neurotoxins similar to pufferfish (Takifugu rubripes, etc.) and cause paralytic shellfish poisoning (PSP) of edible bivalves (Patinopecten yessoensis, Crassostrea gigas, Ruditapes philippinarum, etc.) through the food chain in coastal seas. The danger of PSP to human health makes it a serious threat in bivalve aquaculture industries worldwide [2,3]. Occurrences of shellfish poisoning and the resultant harvesting closures have been reported in the farming of bivalves such as oysters and scallops. Hokkaido Island provides the largest production of scallops in Japan, and the incidents of paralytic shellfish poisonings in Hokkaido are frequent and have a long history [4].
Akkeshi-ko Estuary (area, 32.31 km2) is located in the eastern part of Hokkaido, and paralytic shellfish toxins in bivalves have only rarely been confirmed in the estuary during the monitoring by the local government of Hokkaido Prefecture. The most notable property of Akkeshi-ko Estuary is the existence of a large-scale seagrass bed that covers approximately 11–25 km2 of the area (Nakaoka, personal communication).
Bacteria that have the ability to kill microalgae have been isolated from the leaves of seagrass (Zostera marina), and those bacteria were observed to be present in huge densities [5,6,7,8,9,10]. These prior investigations were conducted mainly targeting red tide algae, for example, the raphidophytes Chattonella antiqua, C. marina, C. ovata, Heterosigma akashiwo, and Fibrocapsa japonica, and the dinoflagellates Karenia mikimotoi, Margalefidinium (=Cochlodinium) polykrikoides, and Heterocapsa circularisquama. These effective bacteria usually belong to α-proteobacteria, β-proteobacteria, and the phylum Bacteroides [9]. Although the existence of growth-inhibiting bacteria against the toxic dinoflagellate Alexandrium spp. has been reported [11,12,13,14,15], the reported bacteria in these studies [11,12,13,14,15] do not have strong activities. There are only a few studies on the isolation of bacteria with strong growth-inhibiting activities or on their existing densities in nature [8,10,16]. In addition, there have been no studies on the dynamics of growth-inhibiting bacteria together with the distribution and temporal fluctuations of A. catenella. We conducted the present study to understand the distribution and the composition of growth-inhibiting bacteria against the toxic dinoflagellate A. catenella in Akkeshi-ko Estuary and Akkeshi Bay, eastern Hokkaido. We also investigated the reasons why shellfish poisoning has rarely occurred in the Akkeshi-ko Estuary.

2. Materials and Methods

2.1. Sampling

Samples were collected every Wednesday morning from 21 April to 29 June 2011 at Akkeshi-ko Estuary and Akkeshi Bay in Hokkaido, Japan (Figure 1). Sampling stations were set at the central part of Akkeshi-ko Estuary (Stn. 1, mean depth of 1 m, at the center of the seagrass field), at the inner part of the Akkeshi Bay (Stn. 2, mean depth of 5.8 m), and at the southern mouth part of Akkeshi Bay (Stn. 3, mean depth of 23.4 m). The survey vessels used were “Etopirika” (Stn. 1) and “Misago” (Stns. 2, 3), which belong to Akkeshi Marine Station, Field Science Center for the Northern Biosphere, Hokkaido University.
Water temperature and salinity were measured from the surface to near the bottom using a CTD (conductivity, temperature, depth) water quality meter (AAQ1186s-Pro, Alec Electronics Co., Tokyo, Japan), and samples of surface seawater were collected at all stations. The seagrass samples were collected at Stn. 1. The collected samples of seawater and seagrass were stored in polypropylene bottles sterilized with autoclaving and were brought back to the laboratory.

2.2. Observation of Phytoplankton

Seawater samples (250 mL) were fixed with glutaraldehyde with a final concentration of 1% and concentrated to 50 mL by gravity precipitation. The concentrated sample (0.1 mL) was placed on a glass slide, and phytoplankton were identified and counted under an inverted microscope (200× to 600× magnification). For the detection and counting of thecate dinoflagellates, calcofluor staining was employed [17]. The stained sample (0.5 mL) was taken on a glass slide, and thecate dinoflagellates were observed and counted under blue light excitation with an inverted epifluorescence microscope.

2.3. Enumeration and Cultivation of the Bacteria in the Seawater Samples

Collected seawater samples were serially diluted 10−1 to 10−3 with filtered and autoclaved seawater, and 1 mL of diluted samples was filtered using sterilized nucleopore filters (pore size 3.0 µm). The obtained filters were placed on an ST10−1 marine agar plate (0.05 g yeast extract, 0.5 g trypticase peptone, and 15 g agar in 1 L seawater [18]) and incubated in order to culture particle-associated bacteria (PAB), i.e., the >3 µm fraction. The filtrates of 0.1 mL were spread on ST10−1 agar medium using a sterilized conlarge bar (bacteria spreader), and these were cultured as free-living bacteria (FLB), i.e., the <3 µm fraction.
Triplicate plates were prepared for each dilution level of the PAB and FLB samples, and the formed colonies were counted after incubation in the dark at 25 °C for 2 weeks. The numbers of culturable bacteria were calculated from the obtained colony count values and the dilution level. Untreated seawater samples and the FLB seawater samples at all three stations were fixed with 25% glutaraldehyde at a final concentration of 1%, stored in the dark at 4 °C, and used for the direct count of bacteria (see Section 2.5 below).

2.4. Enumeration and Cultivation of the Bacteria on the Leaves of Seagrasses

The collected seagrass (Zostera marina) leaves were put into a sterile bottle (500 mL volume) and sterilized filtered seawater (200 mL) was added. The bottle was then vigorously shaken 500 times by hand to detach the bacteria and biofilm from the surface of the leaves. The suspension seawater in the bottle was diluted 10−1 to 10−4 with sterilized filtered seawater, and 0.1 mL of each dilution sample was spread on an ST10−1 agar plate.
Triplicate plates were prepared for each dilution level, and the colonies formed were counted after incubation at 25 °C in the dark for 2 weeks. The wet weights of the leaves were measured to calculate the densities of bacteria per gram wet weight of Z. marina leaves. A portion of the suspension seawater sample was placed in a centrifuge tube, fixed with 25% glutaraldehyde at a final concentration of 1%, and stored in a dark place at 4 °C. The portion was later used for the direct counting of bacteria.

2.5. Direct Count of the Bacteria

The total bacteria were counted in the samples of untreated seawater, FLB seawater, and biofilm suspension from seagrass leaves fixed with glutaraldehyde and stored in a refrigerator. The samples were stained with DAPI at a final concentration of 1.0 µg mL−1 for 5 min and then collected on a nucleopore filter (pore size 0.2 µm). Nucleopore filters were stained overnight in advance in 0.2% Sudan Black B solution in 50% ethanol solvent [19,20]. The filter was sealed with a cover slip using non-fluorescent immersion oil.
At least 10 microscopic fields of the total bacteria were observed and enumerated to obtain their abundance values; a Nikon ECLIPSE 80i upright epifluorescence microscope (Nikon, Tokyo, Japan) with a 100× objective and 10× eyepiece was used for this purpose. The total number of PAB was calculated by subtracting the number of total FLB from the total bacteria in the untreated seawater sample. The total number of bacteria per gram attached to Z. marina leaves was calculated using the wet weight of the seagrass leaves.

2.6. Screening of the Growth-Inhibiting Bacteria against A. catenella (Group I)

An axenic strain of the toxic dinoflagellate A. catenella (Group I) isolated from Osaka Bay (provided by Dr. Keigo Yamamoto, Research Institute of Environment, Agriculture and Fisheries, Osaka Prefecture) was maintained in modified SWM-3 medium [21,22] under the following conditions: temperature of 15 °C, the light intensity of 50 µmol photons m−2 s−1, and the photo cycle of 14 h light:10 h dark. Well-grown A. catenella cultures were inoculated into sterilized disposable 48-well microplates (with the cell density of 103 cells mL−1). Bacterial colonies that formed on agar plates from the PAB and FLB fractions of seawater and from the biofilm of seagrass leaves were randomly selected; small amounts of the colonies were picked up using a sterilized toothpick, and they were inoculated to the A. catenella culture in each well of the microplate. The densities of bacteria added to the algal culture by this procedure were approximately 105–106 cells mL−1 [10,23]. As a control, the algal culture was set up without the addition of bacteria.
The co-cultures were incubated for 2 weeks under the culture conditions of A. catenella, prior to microscopic observations of each well to check for A. catenella mortality or morphological changes. Bacteria that killed all A. catenella cells were determined as algicidal bacteria. The growth-inhibiting bacteria were considered the bacteria that did not entirely kill A. catenella but the numbers of dinoflagellate cells in the wells decreased or hardly proliferated from the beginning of the co-culture experiment. For each sample, 48 randomly selected bacterial strains were tested, and the percentage of tested bacterial strains showing growth-inhibiting activity was multiplied by the number of viable bacteria to calculate the density of the growth-inhibiting bacteria (colony forming units: CFU) against A. catenella.

2.7. 16S Ribosomal RNA Gene Sequencing of Bacteria

The isolated growth-inhibiting bacteria were grown in ST10−1 liquid medium, and bacterial cells in 200 µL culture were collected by centrifugation (2000× g for 5 min.) followed by twice washings with phosphate-buffered saline (PBS). After removing the supernatant from the sample, 100 µL of GITC buffer was added and the obtained suspension was stored at −80 °C overnight. Bacterial DNA was extracted by heating in a 70 °C water bath for 1 h. The 16S ribosomal RNA (rRNA) gene was amplified by polymerase chain reaction (PCR) using GeneAmp PCR System 9700 (Applied Biosystems, Foster City, CA, USA). The PCR reaction solution was composed of template 1.0 µL universal primers of bacteria 8F (AGAGTTTGATCCTGGCTCAG) and 0.875 µL 1492R (GGTTACCTTGTTACGACTT) or 1525R (AAAGGAGGTGATCCAGCC) [24,25]. Ampdirect Plus 12.5 µL (Shimadzu), MQ 9.625 µL, and KAPA 3G Plant DNA Polymerase (Nippon Genetics Co. Ltd., Tokyo, Japan) 0.125 µL, respectively. The initial denaturizing at 95 °C for 10 min was followed by 45 cycles at 95 °C for 20 s, 53 °C for 15 s, and 72 °C for 45 s, and the final extension time at 72 °C was 2 min. PCR products were checked using 1% agarose gel electrophoresis. To purify DNA template strands, PCR products were purified with AMpure XP (Beckman Coulter, Inc., Brea, CA, USA) and sequencing was conducted using an ABI PRISM 3130xl genetic analyzer (Applied Biosystems).
The obtained sequences were assembled using Chromas PRO (Technelysium Pty Ltd., Tewantin, Australia) and searched relative species employing Basic Local Alignment Search Tool (BLAST) of NCBI (http://blast.ncbi.nlm.nih.gov/Blast.cgi). Phylogenetic and molecular evolutionary analyses for obtained sequences were conducted using MEGA 5 software [26]. Alignments were checked manually. The phylogenetic trees were drawn by maximum-likelihood (ML) and neighbor joining (NJ), and bootstrapping values for each tree were generated using 1000 replicates. The nucleotide sequences of 16S rDNA for 54 isolates were deposited in the DDBJ/EMBL/GenBank databases with accession numbers LC465489 to LC465542.

3. Results

3.1. Water Environments and Seagrass Bed

Figure 2 illustrates the changes in water temperature and salinity at the surveying points during the survey period. The surface water temperature at Stn. 1 in Akkeshi-ko Estuary showed the lowest value of 3.9 °C on 21 April, the first day of this study, and it then gradually rose and reached the maximum of 15.7 °C on 23 June (Figure 2a). The salinity had a relatively high value 29.8 on 21 April, but the lowest value of 23.0 was recorded the next week (Figure 2b). After that, the salinity gradually ascended and remained stable in the range of 28.6 to 30.0 after 25 May.
The surface water temperature at Stn. 2 fluctuated in the range of 3.1 °C (21 April) to 14.8 °C (23 June, Figure 2c). The salinity varied from 27.0 on 27 April to 30.9 on 23 June (Figure 2d). Regarding the water temperature at the 5 m depth, the lowest value (3.0 °C) was recorded on May 6 and the highest value (8.7 °C) was on June 8 (Figure 2c). The salinity at the 5 m depth fluctuated between 29.8 on 23 June and 32.4 on 30 June (Figure 2d). The differences in water temperature between the surface layer (0 m) and the 5 m depth were 2.7–8.6 °C, and the differences in salinity were more pronounced with a maximum difference of 8.4 (27 April, Figure 2d).
The water temperature of the surface layer (0 m) at Stn. 3 (at the mouth of Akkeshi Bay) was in the range between 2.4 °C (21 April) and 12.1 °C (29 June, Figure 2e). The surface salinity showed values between 30.6 (12 May) and 32.2 (8 June, Figure 2f). At the 20 m depth of this station, the water temperature showed the lowest temperature of 1.7 °C on 27 April and the highest at 5.9 °C on 15 June (Figure 2e). The salinity of the 20 m depth tended to be stable and was within the range from 32.3 (21 April) to 32.7 (29 June, Figure 2f). The differences in water temperature between the surface layer (0 m) and the 20 m depth were 2.4–7.1 °C. The differences in salinity between the surface and the bottom were very small at Stn. 3 compared to Stn. 2.
Concerning the seagrass Z. marina at Stn. 1 in Akkeshi-ko Estuary, the lengths of the leaves were <1 m on 21 April, and the growth tips of the leaves did not reach the sea surface. The leaves had become longer and reached the sea surface on the last observation day (29 June). Biofilms developed especially on the surface of the leaves that reached the sea surface, and large amounts of microorganisms including diatoms were confirmed in the biofilms.

3.2. Fluctuations of Phytoplankton

Figure 3 illustrates the changes in the total cell counts and the taxon composition of phytoplankton in the surface water samples at Stations 1–3. The total numbers of phytoplankton cells at Stn. 1 were 4.7 × 10⁴–2.0 × 10⁶ cells L−1 (Figure 3a). The centric diatoms Chaetoceros spp. and Thalassiosira spp. (Bacillariophyta) appeared at high densities at Stn. 1 during April before the growth of Z. marina, but these groups became minor in May and thereafter. The occurrences of Euglenoids were more frequent at Stn. 1 (Figure 3). Pennate diatoms became predominant from the second week of May, accounting for a maximum of 99% of the phytoplankton community (3rd week of June). The increase in pennate diatoms appeared to be coincident with the growth of Z. marina. The appearance of dinoflagellates was confirmed at this station, and most of them were heterotrophic Protoperidinium spp. (Miozoa, Dinophyceae). The toxic dinoflagellate A. catenella (Group I) was not confirmed.
At Stn. 2, the total cell numbers of phytoplankton fluctuated within a relatively low-density range at 2.7 × 10⁴–5.0 × 10⁵ cells L−1 (Figure 3b). The taxonomic composition varied greatly. The centric diatoms predominated (13–50%) in April, and then the ratios of Euglenoid and pennate diatoms increased in May (42–97%). The appearance of the genus Alexandrium was not confirmed at Stn. 2.
The total numbers of phytoplankton cells at Stn. 3 fluctuated over a wide range at 7.8 × 10⁴–1.6 × 10⁶ cells L−1 (Figure 3c). The proportion of pennate diatoms and Euglenoids increased slightly from April to May and decreased thereafter. Centric diatoms were overall predominant throughout the survey period, and most of them were Chaetoceros spp. At this station, the most important point was the appearance of A. catenella with a confirmed presence 7 times out of 11 samplings, and the detected maximum cell density reached 1.0 × 10³ cells L−1 (Figure 4).

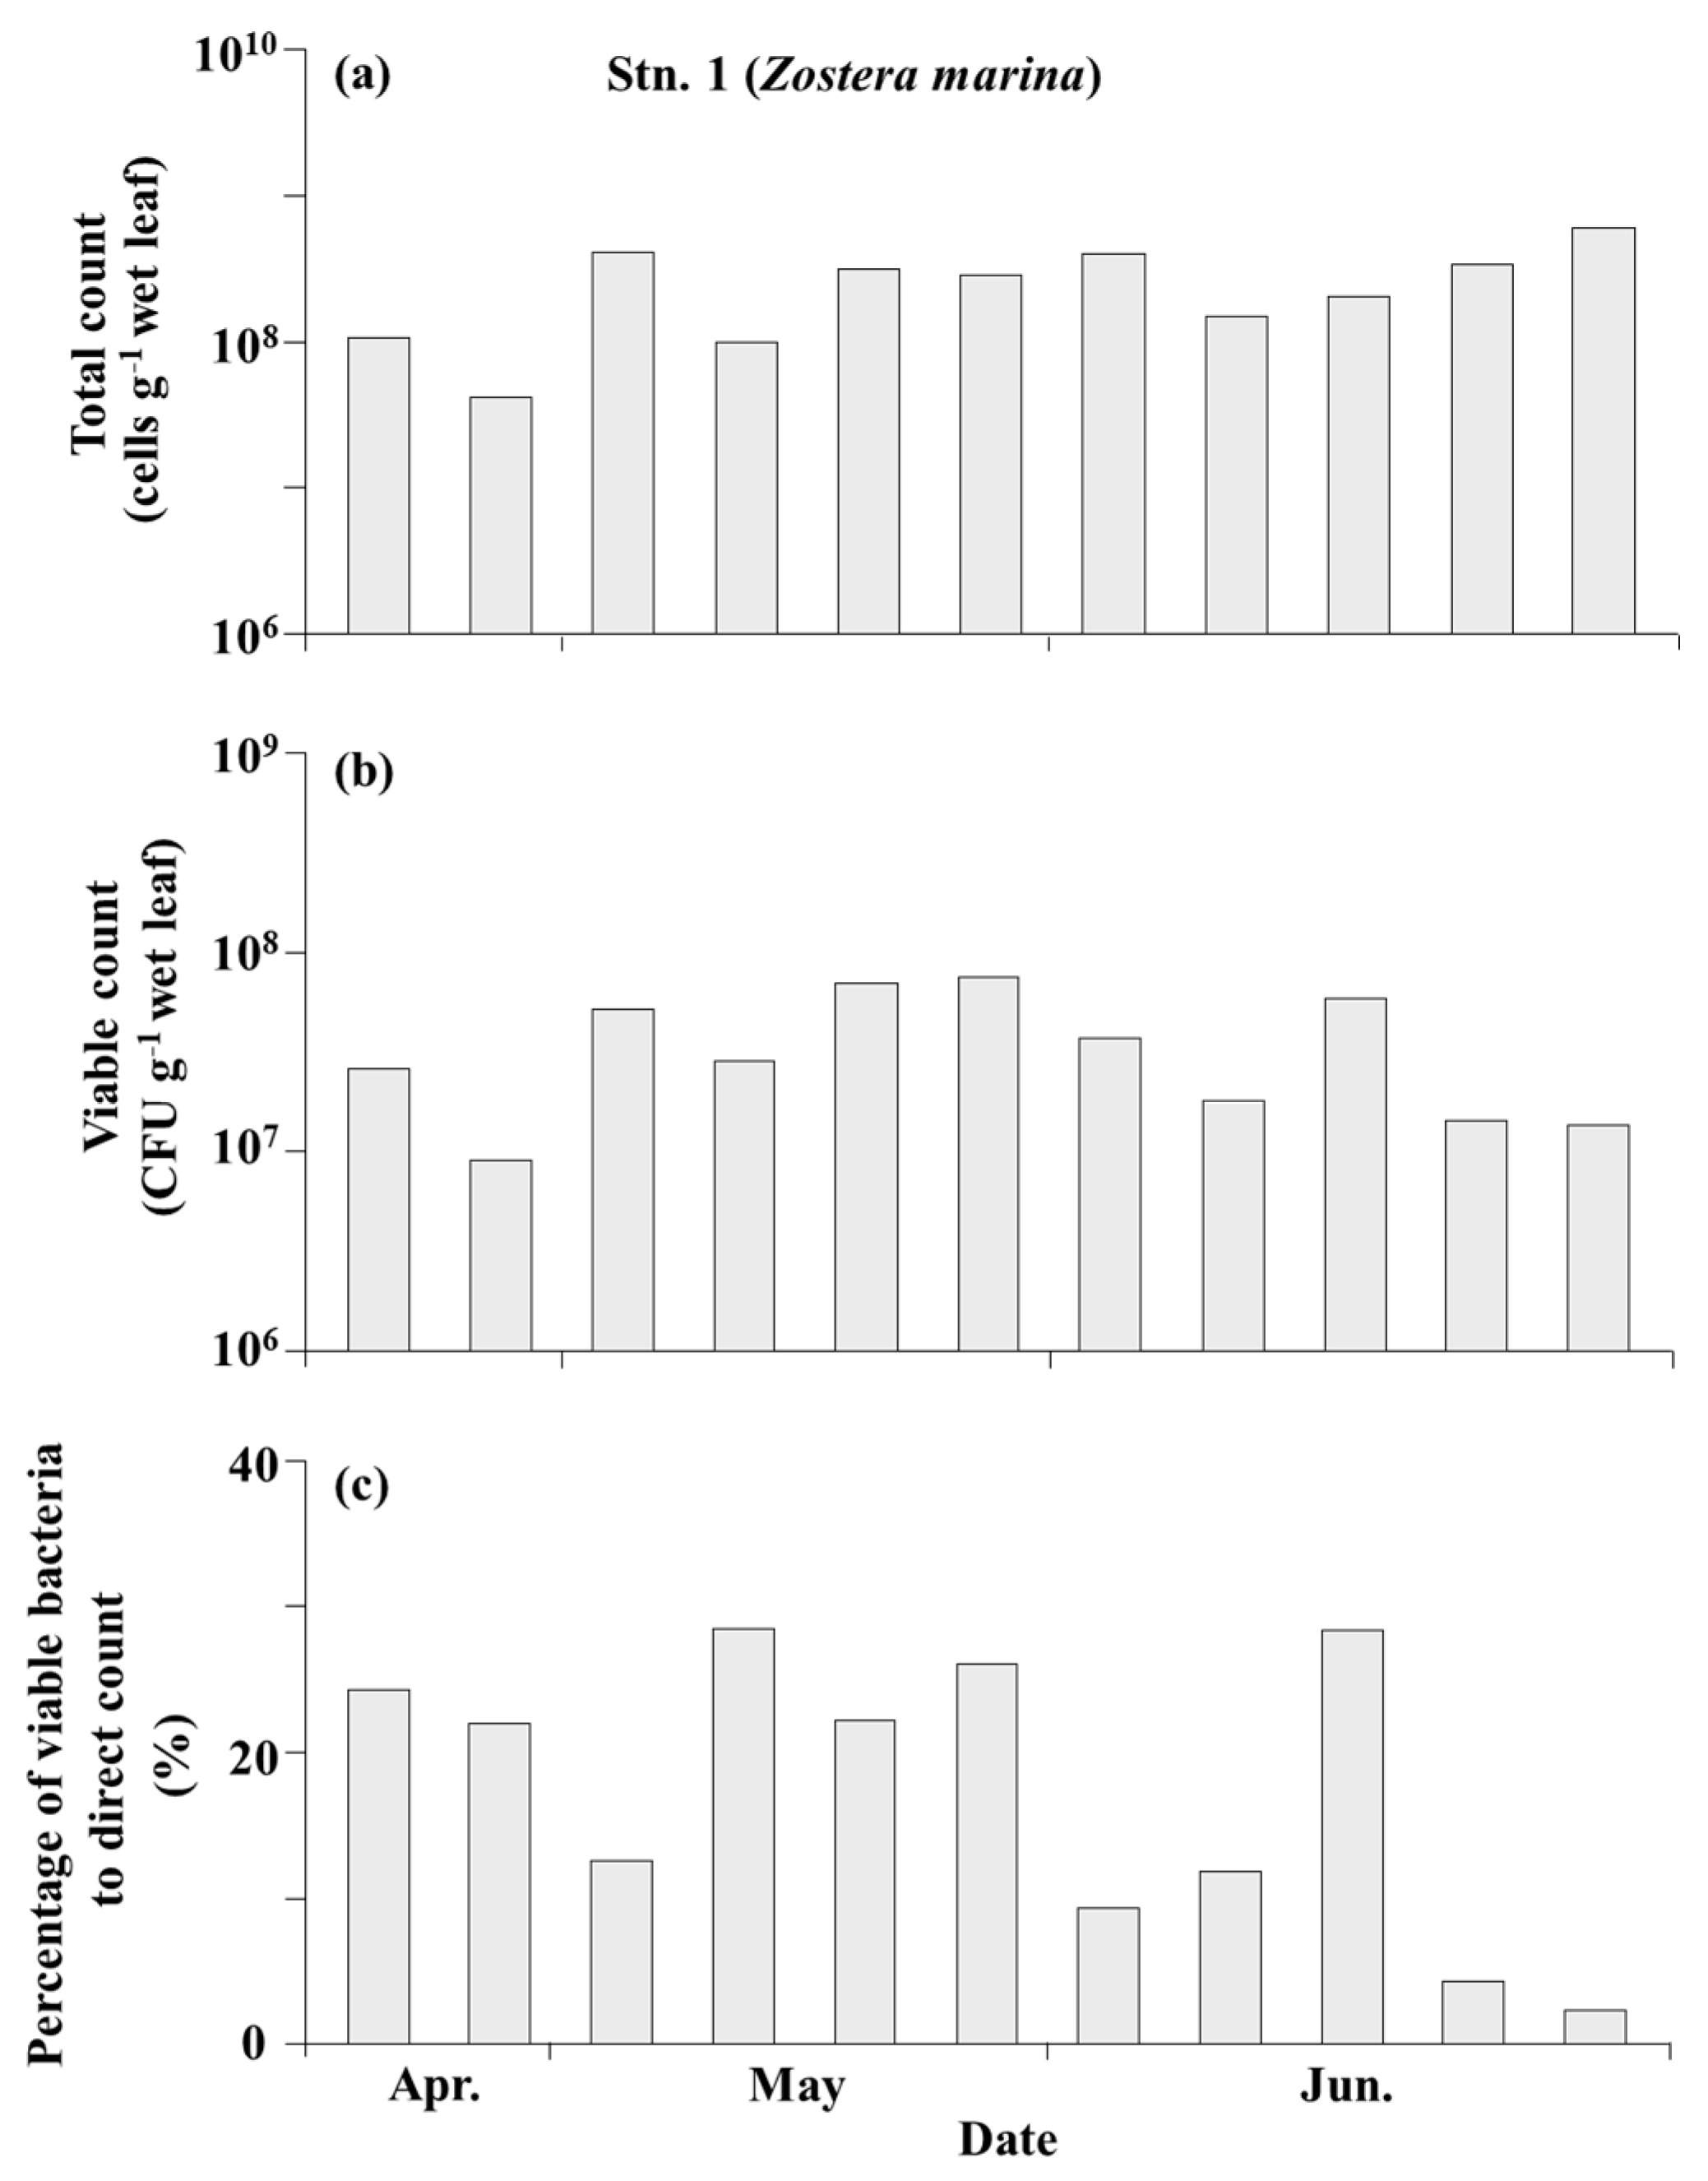
3.3. Bacteria on the Seagrass Leaves

Figure 5 presents the total numbers of bacteria and the culturable bacteria per unit wet weight of the seagrass leaves collected at Stn. 1 and their proportions of the total bacteria (%). The direct counts of bacteria ranged from 4.1 × 10⁷ to 6.0 × 10⁸ cells g−1 wet leaf (Figure 5a). The lowest value was detected on 27 April, and the highest value was observed on 29 June. The culturable bacteria were in the range of 9.1 × 10⁶ to 7.5 × 10⁷ CFU g−1 wet leaf (Figure 5b). The ratios of the number of culturable bacteria to the total bacteria were 2.26–28.8% (Figure 5c), which is higher than the values obtained for the seawater samples at Stn. 1 (described later; see Figure 6).

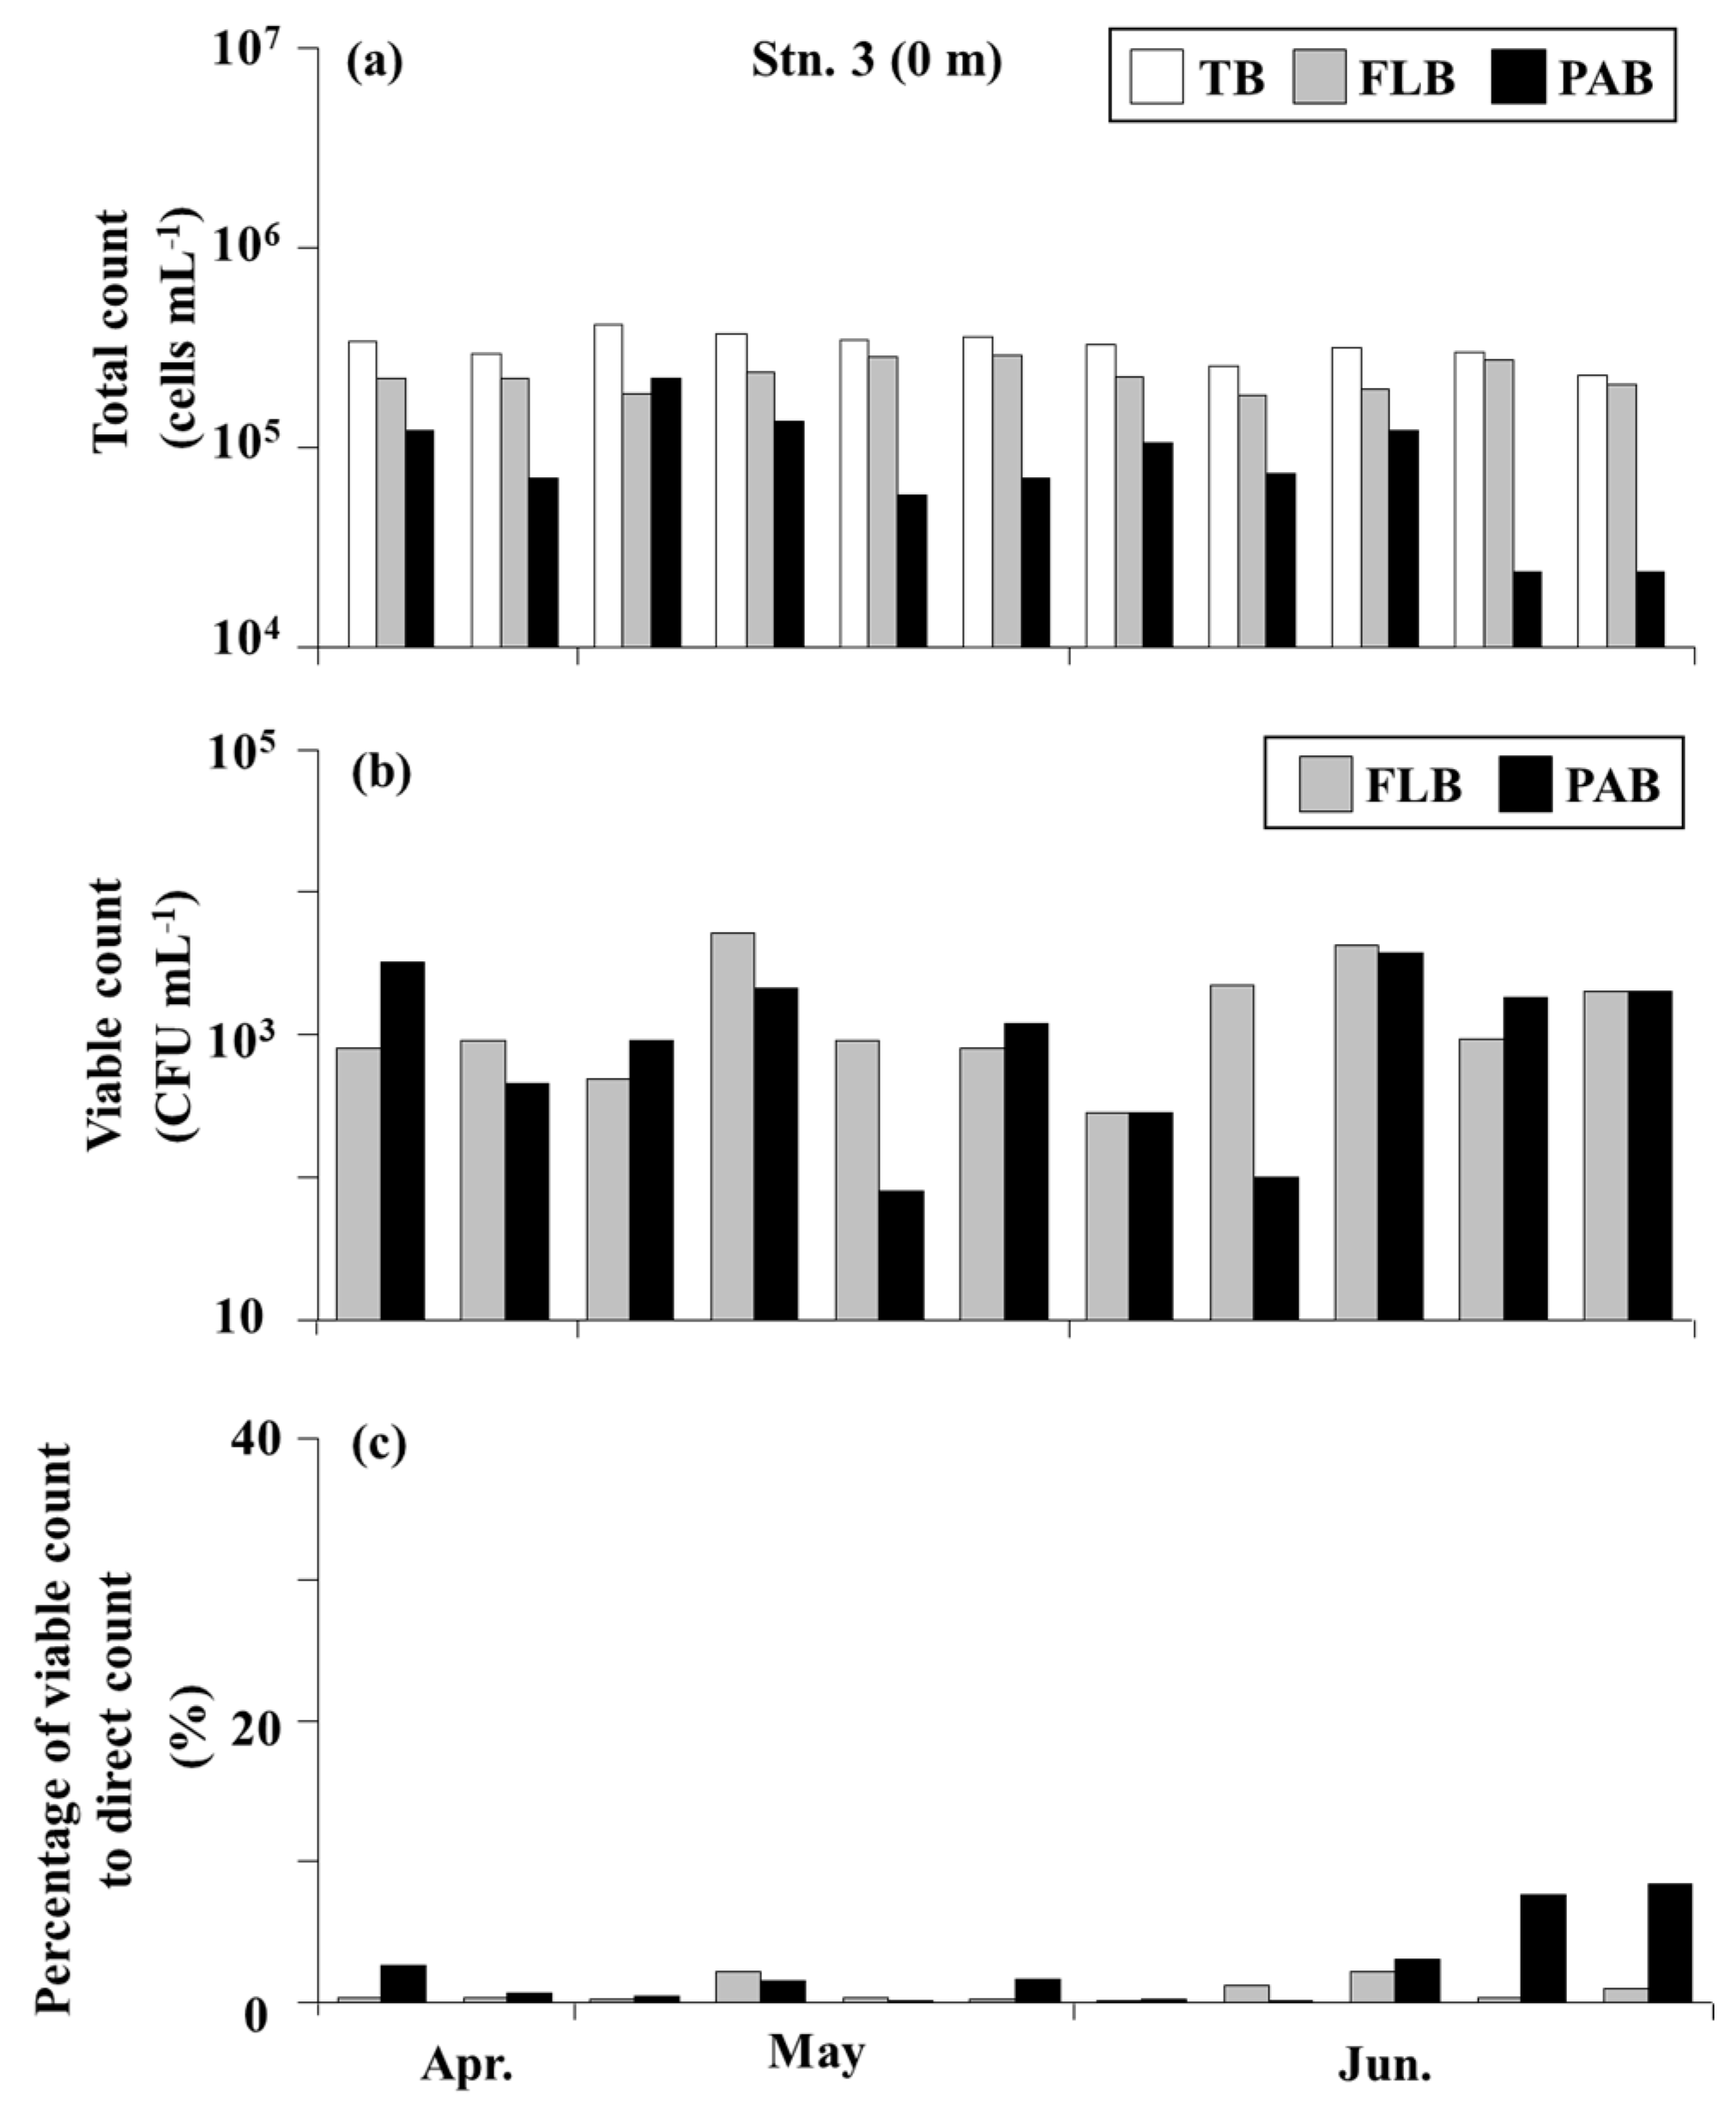
3.4. Bacteria in the Seawater

Figure 6 describes the fluctuations of bacteria at Stn. 1, presenting the total number (direct count (DC)), free-living bacteria (DC of FLB, the <3 µm fraction), particle-associated bacteria (DC of PAB, the >3 µm fraction), the culturable bacteria (viable count (VC)), and their proportions (%) to the total number. The total counts (DC) of bacteria ranged from 5.4 × 10⁵ to 3.0 × 10⁶ cells mL−1 (Figure 6a). The lowest value was recorded on 2 June, and the highest value was recorded on 8 June.
The densities of FLB were between 3.9 × 10⁵ and 1.5 × 10⁶ cells mL−1. The numbers of PAB were 6.1 × 10⁴–1.6 × 10⁶ cells mL−1. The densities of FLB exceeded those of PAB in nine of the 11 surveys (the exceptions were the May 18 and June 8 surveys). Concerning the numbers of culturable bacteria at Stn. 1 for FLB and PAB, the densities of FLB were 8.8 × 10²–2.0 × 10⁴ CFU mL−1 and those of PAB were 4.0 × 101–3.7 × 10³ CFU mL−1, showing wide fluctuations (Figure 6b). FLB exceeded PAB in 10 surveys (the exception was 2 June). The proportion of culturable bacteria to the total bacteria showed relatively low values of 0.11–1.93% for FLB and 0.01–1.37% for PAB (Figure 6c).
Figure 7 shows the densities of bacteria in the surface waters at Stn. 2. The total counts (DC) of bacteria ranged from 3.9 × 10⁵ to 1.9 × 10⁶ cells mL−1 (Figure 7a). The direct counts of FLB were between 3.8–8.0 × 10⁵ cells mL−1, and those of PAB were 5.1 × 10³–1.1 × 10⁶ cells mL−1. In particular, the PAB densities were characterized by low values after June. The density of PAB exceeded the density of FLB only once, on 18 May. Concerning the numbers of culturable bacteria (VC), the FLB densities were 1.0 × 10²–1.3 × 10⁴ CFU mL−1 and the PAB densities were 2.1 × 10²–6.5 × 10³ CFU mL−1 (Figure 7b). The FLB fraction of the culturable bacteria tended to be higher in density than PAB. The proportion of viable bacteria to the total number of bacteria was 0.03–2.18% in FLB and 0.19–22.91% in PAB (Figure 7c).
Figure 8 presents the surface seawater results from the offshore point of Stn. 3. The total counts of bacteria were very stable, showing values in the narrow range of 2.3–4.1 × 10⁵ cells mL−1 (Figure 8a). The direct counts of FLB were 1.8–2.9 × 10⁵ cells mL−1 and that counts of PAB were 2.4 × 10⁴–2.2 × 10⁵ cells mL−1, respectively. FLB showed higher densities except on 6 May. Regarding the numbers of culturable bacteria, those of FLB were 2.8 × 10²–5.1 × 10³ CFU mL−1, and those of PAB were 8.0 × 101–3.8 × 10³ CFU mL−1. The values at Stn. 3 were generally lower than those at the other two stations (Figure 8b). The percentages of culturable bacteria to the direct counts of bacteria were 0.12–2.17% for FLB and 0.13–8.35% for PAB. The PAB fractions were higher than the FLB fractions (Figure 8c).

3.5. Bacteria that Inhibit the Growth of A. catenella (Group I)

To examine the growth-inhibiting activities against A. catenella (Group I), we carried out co-culture experiments with an axenic A. catenella strain using the bacteria isolated from the seawater and the surface of the seagrass leaves. No bacteria possessing algicidal activity were detected, but growth-inhibiting bacteria were detected. A. catenella increased the cell densities in the control wells with no addition of bacteria during the 2-week culture period (Figure 9a,b). On the other hand, swimming cells of A. catenella were not found in the wells showing growth-inhibiting activity by bacteria, and all cells sank to the bottom of the wells (Figure 9c). In addition, most of the A. catenella cells had escaped from the theca (Figure 9d).
Growth-inhibiting bacteria on the leaves of Z. marina collected in Akkeshi-ko Estuary were detected in 7 of the 11 surveys, and the densities were 7.5 × 10⁵–4.7 × 10⁶ CFU g−1 wet weight (Figure 10a). In seawater samples at the same station, growth-inhibiting bacteria were detected three times for FLB and four times for PAB during the entire survey period (Figure 10b). The densities of FLB with growth-inhibiting activity were 1.9 × 10²–7.9 × 10² CFU mL−1, and those of PAB were 6.7 × 100–6.0 × 10² CFU mL−1.
The results in the surface water at Akkeshi Bay (Stn. 2) were 1.9 × 101–1.1 × 10³ CFU mL−1 for FLB (6 detections) and 1.7 × 101–4.3 × 10² CFU mL−1 for PAB (5 detections, Figure 10c). Offshore at Stn. 3, growth-inhibiting bacteria were detected only once on 8 June from the FLB with the value of 1.5 × 10² CFU mL−1 (Figure 10d). On the other hand, PAB were confirmed five times, and the densities were 1.1 × 101–6.4 × 10² CFU mL−1. Growth-inhibiting bacteria were more frequently detected in the fraction of PAB than FLB at Stn. 3 in offshore.

3.6. The 16S rRNA Gene Sequence Analyses of the Bacteria

The phylogenetic trees constructed by 16S rRNA gene analyses (~1300 bp) of 54 strains of growth-inhibiting bacteria against A catenella (Group I) are provided in Figure 11, Figure 12, Figure 13 and Figure 14. These strains include the class α-proteobacteria (10 strains, 18.5%, Figure 11), β-proteobacteria (one strain, 1.9%, Figure 11), γ-proteobacteria (18 strains, 33.3%, Figure 12), the Cytophaga-Flavobacterium-Bacteroidetes (CFB) group (23 strains, 42.6%, Figure 13), Actinobacteria (one strain, 1.9%), and Firmicutes (Bacillus sp.) (one strain, 1.9%, Figure 14). As the major groups among them, α-proteobacteria, γ-proteobacteria, and the CFB group accounted for high proportions and were the main taxa.
Table 1 summarizes the bacterial strains showing homology of ≥98.7% with previously reported bacterial strains. Multiple strains of growth-inhibiting bacteria isolated from different sources were related to the same closest bacterial relative. For example, the strains AK1, AK2, and AK 21 were related to Zobellia laminariae with the homologies of 100%, 100%, and 99.92%, respectively. Strains AK1 and AK2 were isolated from seawater at Stn. 3, and AK21 was obtained from the surface of a leaf of the seagrass Zostera marina collected at Stn. 1.

4. Discussion

4.1. Hydrological Parameters

Akkeshi-ko Estuary is a lagoon with a maximum depth of 9 m [27]. Several rivers flow into the estuary. The Bekanbeushi River accounts for 98.8% of the total water flow into Akkeshi-ko Estuary [28]. The basin area of Bekanbeushi River is 447 km2. The common flow rate is estimated to be ~10 billion kg week−1, and it doubles to ~20 billion kg week−1 during the snow-melting season [28]. The hydrological environment of Stn. 1 located in the central part of Akkeshi-ko Estuary thus showed a tendency of low-salinity conditions due to the influence of the increased water from the Bekanbeushi River during the snow-melting season (Figure 2b).
Station 2 was located at the inner part of Akkeshi Bay, and it tended to show low salinity (Figure 2d). The phytoplankton taxa were dominated by Euglenoids and pennate diatoms from April to early June (Figure 3b). Pennate diatoms were reported to be more dominant than centric diatoms in Akkeshi-ko Estuary [29]. Station 2 is located in coast of Akkeshi Bay close to the mouth of Akkeshi-ko Estuary where the estuarine waters flow out and have significant impacts.
A thermocline was observed in Akkeshi Bay at a depth of ~5 m [30,31], and a similar phenomenon was observed at Stn. 3. The seawater from the open ocean and the estuarine water are mixed at Stn. 3, and the influence of open ocean water was thought to be rather strong (Figure 2e,f).

4.2. Total Bacteria and Culturable Bacteria

Total counts of approximately 106−107 cells mL−1 of bacteria exist in coastal seawater [33], and 105−106 cells mL−1 exist in open sea [34]. In the present study, the total counts of bacteria were 5.4 × 10⁵–3.0 × 10⁶ cells mL−1 at Stn. 1, 3.9 × 10⁵–1.9 × 10⁶ cells mL−1 at Stn. 2, and 2.3 × 10⁵–4.1 × 10⁵ cells mL−1 at Stn. 3 (Figure 6a, Figure 7a and Figure 8a). These results are not significant deviations from the reported values. Comparing the direct counts of FLB and PAB at each station, the FLB tended to exceed the PAB on the whole at all three stations (Figure 6a, Figure 7a and Figure 8a). It is speculated that PAB are attached to particles and utilize the relatively rich organic matter of detritus, whereas FLB uptake dissolved oligotrophic organic matter in seawater [35].
In the previous studies conducted in Akkeshi Bay, the reported densities of culturable bacteria were 102–104 CFU mL−1 [30]. In the present study, the values of culturable bacteria were detected within that range (Figure 6b, Figure 7b and Figure 8b). In Akkeshi-ko Estuary (Stn. 1), FLB tended to be more abundant than PAB. However, the densities and/or proportions (%) of PAB tended to exceed those of FLB at Stns. 2 and 3. It is considered that heterotrophic bacteria can exist as FLB at areas with relatively higher concentrations of dissolved organic matter such as Akkeshi-ko Estuary, and that the proportion of PAB increased as the stations went offshore with less dissolved organic matter.
A review noted that the proportions of culturable bacteria to the total counts of bacteria were 0.001−0.1% in seawater of the open ocean [36]. These proportions were reported to be higher in coastal waters [37,38]. For example, in seawater of Maizuru Bay, Japan, the total counts of bacteria were 105–106 cells mL−1 and culturable bacteria were 104–105 CFU mL−1 [37]. In the surface waters along the Adriatic coast, the proportions of culturable bacteria to the total counts of bacteria were 0.1–22% [38].
In other environments such as Lake Biwa, the culturable bacteria were 1.7 × 10³–1.0 × 10⁵ CFU mL−1 when the total bacteria were 1.3 × 10⁶–1.4 × 10⁷ cells mL−1. In the Yodo River, the only river flowing out from Lake Biwa, the total culturable bacteria were 7.1 × 10⁴–1.4 × 10⁶ CFU mL−1, and the total direct counts of bacteria were 2.5 × 10⁶–4.0 × 10⁷ cells mL−1 [39]. It is reasonable to have the highest ratio of 22.91% of culturable bacteria to total counts in the Akkeshi Bay area with high productivity (Figure 7c, PAB). The proportions of culturable bacteria to the direct counts of bacteria attached to the surface of the seagrass leaves were >20% in six of the 11 surveys (Figure 5c). Similar results (1–20%) were reported for bacteria in the biofilm on the surface of reed stems in lakes in Ohnuma Quasi-National Park, Hokkaido, Japan [40]. It thus seems that many bacteria possess high viability due to the organic matter provided by the leaves of seagrass.
In general, most of the heterotrophic bacteria in natural environments are unculturable on agar media, and this is one of the major issues that has long been unsolved in microbiology [41]. In the present study, growth-inhibiting bacteria were cultured and isolated using ST10−1 agar medium, and the bacteria were limited to those that can be cultured using this medium.

4.3. Distribution of Growth-Inhibiting Bacteria against A. catenella (Group I)

Bacteria that inhibit the growth of A. catenella (Group I) were detected from the surface of the seagrass (Z. marina) leaves of Akkeshi-ko Estuary (Stn. 1) with a maximum density of 4.7 × 10⁶ CFU g−1 wet leaf (Figure 10a). It is reported that growth-inhibiting bacteria against A. catenella attached to seagrasses, and the maximum density was 7.5 × 10⁷ CFU g−1 wet leaf collected from the biofilm of Z. marina at the center of Padilla Bay in Puget Sound, Washington, U.S.A. [10]. The density of the growth-inhibiting bacteria was 1.8 × 10⁸ CFU g−1 wet leaf from the surface of Z. japonica leaves at the same location, and 6.9 × 10⁵ CFU g−1 wet thallus from the biofilm on the surface of Ulva lactuca collected at Cattle Point in Puget Sound. Growth-inhibiting bacteria against A. catenella were also detected at densities of 4 × 10⁴–1 × 10⁶ g−1 wet weight from the seaweeds Laminaria japonica, Corallina pilulifera, and Ulva pertusa at Shinori Coast, Hakodate, Japan [16]. The existence of growth-inhibiting bacteria on seagrasses and seaweeds thus appears to be common in coastal seas.
Herein, PAB isolated from seawater in seagrass beds (Stn. 1) were detected at the maximum density of 6.0 × 10² CFU mL−1 and FLB were detected at the maximum density of 7.9 × 10² CFU mL−1 as growth-inhibiting bacteria (Figure 10b). There have been very few investigations [10,16] of the distribution and abundance of growth-inhibiting bacteria against A. catenella in nature. The density of 4.1 × 10³ CFU mL−1 of growth-inhibiting bacteria against A. catenella was obtained in the seawater of Holmes Harbor, Puget Sound [10]. Approximately 1 × 10²–2 × 10³ cells mL−1 of growth-inhibiting bacteria against A. catenella were detected in the seawater of the seaweed bed of Shinori Coast in Hakodate, Hokkaido, Japan [16]. The densities of growth-inhibiting bacteria obtained from Akkeshi-ko Estuary and Akkeshi Bay are slightly lower than those studied in Puget Sound [10], but they are similar to the values reported from Shinori Coast, Japan [16]. It should be noted that the existence of growth-inhibiting bacteria with high frequency was confirmed in the present study.
Our comparison of FLB and PAB as growth-inhibiting bacteria in seawater revealed that the densities of PAB tended to exceed those of FLB at Stn. 3, located offshore (Figure 10d). PAB were defined as bacteria that attach to particles and use the particles as a nutrient source, and they defined FLB as bacteria that use dissolved organic matter as a nutrient source [35]. The activity of PAB in terms of thymidine incorporation rate was revealed to be 10–100 times higher than that of FLB [35]. It is reported that there are larger numbers of algicidal bacteria against red tide flagellates in the fraction of PAB than that of the FLB category in seawater samples collected at approximately 20 km off Himeji in the Seto Inland Sea of Japan [42]. Considering the previous reports and this study’s findings, we speculate that the greater part of growth-inhibiting bacteria are in the PAB fraction. We also speculate that when PAB are detached from the particles they had attached themselves to, they would become FLB and presumably reach an inactivated state within a short time.
Gene sequence analyses of 16S rRNA were carried out herein for the obtained strains of growth-inhibiting bacteria. Some of these bacteria from seawater were found to be the same types of bacteria isolated from the surface of the seagrass Z. marina. For example, the strains AK28 (Stn. 1, leaf), AK41 (Stn.1, leaf), and AK45 (Stn. 1, FLB) were closely related to Sulfitobacter sp. strain MBEF04 of the class α-proteobacteria, with homologies of 100%, 99.56%, and 100%, respectively (Figure 11). As these three strains were isolated from Stn. 1 and showed very high homologies, they are highly likely to be the same species. A similar presumption is possible for the strains AK34 (Stn. 1, leaf, homology 99.79%), AK52 (Stn. 1, PAB, homology 99.79%), and AK53 (Stn. 1, FLB, homology 99.59%), which all have base sequences close to that of Alteromonas sp. KT1101 belonging to the class γ-proteobacteria (Figure 12). In the CFB group, the strains AK1 (Stn. 1, leaf), AK2 (Stn. 3, PAB), and AK21 (Stn. 3, PAB) are related to Zobellia laminariae (the homologies were 100%, 100%, and 99.92%, respectively), and the strains AK15 (Stn. 2, FLB), AK29 (Stn. 1, leaf), and AK49 (Stn. 1, PAB) are closely related to Lewinella persicus with 100% homology for each strain (Figure 13).
As described above, several strains of growth-inhibiting bacteria showed the same 16S rRNA gene sequences, and these strains were isolated from seagrass leaves and the seawater outside Akkeshi-ko Estuary. These results strongly suggest that the seagrass area is one of the significant habitats of growth-inhibiting bacteria against A. catenella in the coastal area. The same situation was reported about the algicidal bacteria against the fish-killing raphidophyte Chattonella antiqua (Ochrophyta, Raphidophyceae) from the seagrass (Z. marina) leaves and surrounding seawater in the Seto Inland Sea, Japan [43]. The distribution of three strains of algicidal bacteria Alteromonas sp., i.e., strains S, K, and D [44], against the above mentioned raphidophyte C. antiqua was investigated in the seagrass bed and surrounding sea area in Japan’s Seto Inland Sea, and the study revealed the abundant existence of these algicidal bacteria in seawater from the seagrass bed compared to the seawater of the surrounding area [45]. This report suggested that the seagrass bed was a major source of algicidal Alteromonas strains to the surrounding sea area.
The action of algicidal bacteria on red tide plankton is roughly divided into two types, i.e., the direct attack type (mainly the phylum Bacteroides) and the algicidal substance-producing type [46,47]. Algicidal/growth-inhibiting substances are thought to be involved in the algicidal/growth-inhibiting processes. As the algicidal substances, serine protease [48], prodigiosin [49], isatin [50], questiomycins [51], etc. were identified. These chemicals would be of the focus of interest for the investigations on understanding the basic mechanisms of controlling HABs.

4.4. 16S rRNA Gene Sequence Analyses of Growth-Inhibiting Bacteria against A. catenella (Group I)

The taxonomic groups of A. catenella (Group I) growth-inhibiting bacteria isolated in this study were the CFB group (42.6%), class γ-proteobacteria (33.3%), class α-proteobacteria (18.5%), class β-proteobacteria (1.9%), and Actinobacteria and Firmicutes (3.7%). Regarding the results of the 16S rRNA gene analyses of algicidal and growth-inhibiting bacteria isolated from coastal water, most of those bacteria reportedly belonged to the class α-proteobacteria, the class γ-proteobacteria, and the CFB group [9]. Total 718 heterotrophic bacterial strains were collected from Akkeshi Bay and were identified to be Pseudomonas spp. in the class γ-proteobacteria, Achromobacter spp. in the class β-proteobacteria, and Flavobacterium spp. in the CFB group, and the results noted that these three genera accounted for 80% of the total bacterial strains identified [30].
Concerning the class β-proteobacteria, one strain of AK23 (Stn. 2, FLB) was isolated, and it is in a taxonomic group with many reports of its existence in freshwater. The most closely related strain was the β-proteobacterium strain TEG17 (97.68% homology), which is the strain of freshwater origin. The strain AK23 of β-proteobacterium was isolated on May 18. This date is within the period with much snowmelt water flowing into Akkeshi-ko Estuary through Bekanbeushi River. The presence of the strain of growth-inhibiting bacteria of freshwater origin at the station in the north of Akkeshi Bay during the snowmelt period suggests that there may be a supply of growth-inhibiting bacteria against microalgae including the toxic dinoflagellate A. catenella not only from the seagrass bed but also from the Bekanbeushi River.

4.5. The Distribution and Density of Microalgae

Toxic dinoflagellate A. catenella (Group I) cells were frequently detected from the surface water at Stn. 3 offshore (Figure 4) but were not confirmed at Stn. 1 or Stn. 2 during the investigation period. The distribution of phytoplankton was previously investigated in Akkeshi-ko Estuary [29], and it is consistent with the present findings that pennate diatoms predominated and few centric diatoms were observed, dinoflagellates were few, and no A. catenella cells were detected. It was reported that the cysts of A. catenella decreased from the offshore of Akkeshi Bay toward the inner bay, and very few were at points close to the strait in Akkeshi-ko Estuary; no cysts were detected at the other three stations in Akkeshi-ko Estuary [52]. It is thus presumed that the survival and completion of the life cycle of A. catenella are difficult in Akkeshi-ko Estuary after the invasion from Akkeshi Bay due to the existence of growth-inhibiting bacteria. The absence of paralytic shellfish poisoning (PSP) in Akkeshi-ko Estuary is presumably attributable to the relatively abundant existence of the growth-inhibiting bacteria provided by the large-scale seagrass beds.
Pennate diatoms were dense in the seawater at Stn. 1 with the large-scale seagrass beds. Abundant pennate diatom cells on the surface of seagrass leaves are thought to detach to float in the surrounding seawater. In the seagrass beds in Dongdae Bay, Korea, the average density of phytoplankton is reported to be 2.1 × 10⁴ cells L−1 and the minimum is 6.0 × 10² cells L−1 [53]. These values appear to be very low and showed the same tendency as the present study’s data. The culture experiments [54] were conducted to investigate the interaction of Zostera spp. and phytoplankton, and the obtained result was a significant suppression of the growth of the phytoplankton.
The densities of phytoplankton were reported to be low at seagrass beds and high at a no-seagrass area in southern Australia [55]. It is recently reported that the eelgrass habitat studied is consistently associated with a marked reduction in dinoflagellate abundance both within the beds and for ≤15 m contiguously outside the beds, relative to nearby sites without eelgrass [56]. At an offshore area of Osaka Bay, Seto Inland Sea, the densities of the centric diatoms in the seawater showed higher values about 10–1000 times than those in the seawater from the seagrass bed [6]. In the Akkeshi-ko Estuary, the chlorophyll a amounts were found to be low in seawater in the Akkeshi-ko Estuary despite sufficient nutrient conditions, due to the supply of nutrients through the inflow of Bekanbeushi River, and an intense spring bloom was confirmed in Akkeshi Bay before the growth of Z. marina [57].
In the present study, the survey was conducted 1×/week, and it was revealed that the phytoplankton densities in seawater were clearly lower in the seagrass beds than in the outer area of Akkeshi Bay. We thus propose the following hypothesis. Growth-inhibiting bacteria on the surface of seagrasses in Akkeshi-ko Estuary are released into the seawater, and these bacteria suppress the growth of phytoplankton, leading to the decrease of plankton abundance. It is reasonable to speculate that planktonic-centric diatoms predominated in seawater at Stn. 1 in Akkeshi-ko Estuary at the first observation in April when the seagrass had not started to grow (Figure 3). The fluctuations of bacteria that affect the growth of diatoms should be examined in future studies.

5. Conclusions

The occurrences of harmful algal blooms spread widely due to the eutrophication in coastal areas [58,59], the introduction of causative organisms by human activities such as ballast water and juvenile transfer [60,61], and climate change [62]. Focusing on changes in the number of red tide occurrences and seagrass areas, it is pointed out that the increase in the red tide incidents and the decrease in seagrass fields coincided in the Seto Inland Sea [5]. It was reported that in a coastal area of the southwestern Mediterranean, the decline of seagrass beds and the onset of a toxic dinoflagellate A. minutum bloom began simultaneously [63]. It can thus be presumed that the loss of seagrass beds leads to the increase of HAB occurrences due to land reclamation in coastal areas and the devastation of the coastal environments.
Seagrass communities are sensitive to environmental changes and are highly vulnerable ecosystems [64]. The scale of seagrass beds could quickly decline due to climate change and the artificial devastation of coastal environments [65,66]. The present findings revealed a potential ability of seagrass beds to suppress the occurrences of toxic blooms of the dinoflagellate A. catenella (Group I). The importance of seagrass beds should be included when promoting sound bivalve aquaculture industries. It will be of great significance to restore and/or create seagrass beds in order to maintain rich coastal environments from the viewpoint of the Satoumi concept [67], because doing so is expected to prevent not only the occurrence of harmful red tides [9], but also toxic blooms, together with the conservation of biodiversity and productivity.

Author Contributions

Y.O. wrote the manuscript. A.T. supported the phylogenetic analysis. Y.O., A.Y., and I.I. conceived and designed the experiments. All authors participated in discussions and review of the manuscript. All authors have read and agreed to the published version of the manuscript.

Funding

This investigation was supported by a JSPS Research Fellowship (JP242350). The part of this work was supported by JSPS KAKENHI Grant Number JP20K20573.

Data Availability Statement

The molecular sequences of 16S rDNA obtained in this study are available in DDBJ with accession numbers LC465489 to LC465542.

Acknowledgments

We express our deep appreciation to Masahiro Nakaoka, Director of Akkeshi Marine Station, Field Science Center for Northern Biosphere, Hokkaido University, and the engineers Shoichi Hamano and Hidenori Katsuragawa of Akkeshi Marine Station. We are grateful to Tomonori Isada of the station, and Natsuki Hasegawa of the Japan Fisheries Research and Education Agency for their helpful advice on Akkeshi-ko Estuary and Akkeshi Bay. We also thank Yasuhide Nakamura of Hokkaido University (currently Shimane University) and Yuka Mohri of the Department of Botany, National Museum of Nature and Science for their kind cooperation in the molecular analyses of the 16S rRNA gene sequences of the bacteria.

Conflicts of Interest

The authors declare no conflict of interest.

References

  1. Prud’homme van Reine, W. Report of the Nomenclature Committee for Algae: 15. Taxon 2017, 66, 191–192. [Google Scholar] [CrossRef] [Green Version]
  2. Imai, I.; Fukuyo, Y.; Hiroishi, S. Advanced Researches on Shellfish Poisonings: Current Status and Overview; Kouseisha-Kouseikaku: Tokyo, Japan, 2007. (In Japanese) [Google Scholar]
  3. Anderson, D.M.; Alpermann, T.J.; Cembella, A.D.; Collos, Y.; Masseret, E.; Montresor, M. The globally distributed genus Alexandrium: Multifaceted roles in marine ecosystems and impacts on human health. Harmful Algae 2012, 14, 10–35. [Google Scholar] [CrossRef] [PubMed] [Green Version]
  4. Shimada, H. Biological oceanographic study on method for predicting the occurrence of paralytic shellfish toxin along the Okhotsk Sea coast off Hokkaido. Sci. Rep. Hokkaido Fish Res. Inst. 2018, 93, 1–49. (In Japanese) [Google Scholar]
  5. Imai, I.; Yamamoto, T.; Ishii, K.I.; Yamamoto, K. Promising prevention strategies for harmful red tides by seagrass beds as enormous sources of algicidal bacteria. In Proceedings of the 5th World Fisheries Congress, Tokyo, Japan, 20−25 October 2008. 6c_0995_133. [Google Scholar]
  6. Imai, I.; Yamamoto, T.; Ishii, K.I.; Inaba, N.; Yamamoto, K. Prevention of harmful algal blooms by algicidal bacteria associated with eelgrasses. J. Water Waste 2016, 58, 295–300. (In Japanese) [Google Scholar]
  7. Imai, I.; Inaba, N.; Sakami, T. Environmentally friendly strategies for the prevention of harmful algal blooms using algicidal bacteria associated with seagrass beds. In Marine and Fresh-Water Harmful Algae; Proença, L.A.O., Hallegraeff, G.M., Eds.; Intergovernmental Oceanographic Commission of UNESCO: Florianópolis, Brazil, 2017; pp. 160–165. [Google Scholar]
  8. Onishi, Y.; Mohri, Y.; Tuji, A.; Ohgi, K.; Yamaguchi, A.; Imai, I. The seagrass Zostera marina harbors growth-inhibiting bacteria against the toxic dinoflagellate Alexandrium tamarense. Fish. Sci. 2014, 80, 353–362. [Google Scholar] [CrossRef]
  9. Imai, I. Interactions between harmful algae and algicidal and growth-inhibiting bacteria associated with seaweeds and seagrasses. In Marine Protists Diversity and Dynamics; Ohtsuka, S., Suzaki, T., Horiguchi, T., Suzuki, N., Not, F., Eds.; Springer: Tokyo, Japan, 2015; pp. 597–619. [Google Scholar]
  10. Inaba, N.; Trainer, V.L.; Onishi, Y.; Ishii, K.I.; Willie-Echieverria, S.; Imai, I. Algicidal and Growth-inhibiting bacteria associated with seagrass and macroalgae beds in Puget Sound WA, USA. Harmful Algae 2017, 62, 136–147. [Google Scholar] [CrossRef]
  11. Amaro, A.M.; Fuentes, M.S.; Ogalde, S.R.; Venegas, J.A.; Suàerz-Isla, A.B. Identification and characterization of potentially algal-lytic marine bacteria strongly associated with the toxic dinoflagellate Alexandrium catenella. J. Eukaryotic Microbiol. 2005, 52, 191–200. [Google Scholar] [CrossRef]
  12. Su, J.Q.; Yang, X.R.; Zheng, T.L.; Tian, Y.; Jiao, N.Z.; Cai, L.Z.; Hong, H.S. Isolation and characterization of a marine algicidal bacterium against the toxic dinoflagellate Alexandrium tamarense. Harmful Algae 2007, 6, 799–810. [Google Scholar] [CrossRef]
  13. Su, J.; Yang, X.; Zhou, Y.; Zheng, T. Marine bacteria antagonistic to the harmful algal bloom species Alexandrium tamarense (Dinophyceae). Biol. Control 2011, 56, 132–138. [Google Scholar] [CrossRef]
  14. Wang, B.X.; Zhou, Y.Y.; Bai, S.J.; Su, J.Q.; Tian, Y.; Zheng, T.L.; Yang, X.R. A novel marine bacterium algicidal to the toxic dinoflagellate Alexandrium tamarense. Lett. Appl. Microbiol. 2010, 51, 552–557. [Google Scholar] [CrossRef]
  15. Bai, S.J.; Huang, L.P.; Su, J.Q.; Tian, Y.; Zheng, T.L. Algicidal effects of a novel marine actinomycete on the toxic Dinoflagellate Alexandrium tamarense. Curr. Microbiol. 2011, 62, 1774–1781. [Google Scholar] [CrossRef] [PubMed]
  16. Imai, I.; Kawaguchi, M.; Inaba, N.; Yamamoto, K. Biological control of toxic and noxious algal blooms with environment friendly strategies. Kaiyo Mon. 2020, 52, 217–226. (In Japanese) [Google Scholar]
  17. Fritz, L.; Triemer, R.E. A rapid simple technique utilizing calcofluor white M2R for the visualization of dinoflagellate thecal plates. J. Phycol. 1985, 21, 662–664. [Google Scholar] [CrossRef]
  18. Ishida, Y.; Eguchi, M.; Kadota, H. Existence of obligatory oligotrophic bacteria as a dominant population in South China Sea and the West Pacific Ocean. Mar. Ecol. Prog. Ser. 1986, 30, 197–203. [Google Scholar] [CrossRef]
  19. Zimmermann, R.; Iturriaga, R.; Becker, B.J. Simultaneous determination of the total number of aquatic bacteria and the number of thereof involved in respiration. Appl. Environ. Microbiol. 1978, 36, 926–935. [Google Scholar] [CrossRef] [Green Version]
  20. Imai, I. Size distribution, number and biomass of bacteria in intertidal sediments and seawater of Ohmi Bay, Japan. Bull. Jpn. Soc. Microb. Ecol. 1987, 2, 1–11. [Google Scholar] [CrossRef] [Green Version]
  21. Chen, L.C.M.; Edelstein, T.; McLachlan, J. Bonnemaisonia hamifera Hariot in nature and in culture. J. Phycol. 1969, 5, 211–220. [Google Scholar] [CrossRef]
  22. Imai, I.; Itakura, S.; Matsuyama, Y. Selenium requirement for growth of a novel red tide flagellate Chattonella verruculosa (Raphidophyceae) in culture. Fish. Sci. 1996, 62, 834–835. [Google Scholar] [CrossRef] [Green Version]
  23. Imai, I.; Kido, T.; Yoshinaga, I.; Ohgi, K.; Nagai, S. Isolation of Microcystis-killer bacterium Agrobacterium vitis from the biofilm on the surface of the water plant Egeria densa. In Proceedings of the 14th International Conference on Harmful Algae, Crete, Greece, 1–5 November 2010; pp. 150–152. [Google Scholar]
  24. Turner, S.; Pryer, K.M.; Miao, V.P.R.; Palmer, J.D. Investigating deep phylogenetic relationships among cyanobacteria and plastids by small subunit rRNA sequence analysis. J. Eukuryotic Microbiol. 1999, 46, 327–338. [Google Scholar] [CrossRef]
  25. Shinoda, Y.; Kato, N.; Morita, N. Phylogenetic analysis of a bacterium by sequencing its 16S ribosomal RNA gene. Shimadzu Rev. 2000, 57, 121–132. (In Japanese) [Google Scholar]
  26. Tamura, K.; Peterson, D.; Peterson, N.; Steker, G.; Nei, M.; Kumar, S. MEGA5: Molecular evolutionary genetics analysis using maximum likelihood, evolutionary distance, and maximum parsimony methods. Mol. Biol. Evol. 2011, 28, 2731–2739. [Google Scholar] [CrossRef] [PubMed] [Green Version]
  27. Iizumi, H.; Suzuki, K. Distribution of stable isotope ratios in Akkeshi-ko Estuary ecosystem. Kaiyo Mon. 2002, 34, 412–416. (In Japanese) [Google Scholar]
  28. Mukai, H.; Iizumi, H.; Kishi, M.J. Steady-state and non-steady-state material inflows of water system in Akkeshi—A case study connecting the forest and the sea. Kaiyo Mon. 2002, 34, 449–457. (In Japanese) [Google Scholar]
  29. Kasim, M.; Mukai, H. Contribution of benthic and epiphytic diatoms to clam and oyster production in the Akkeshi-ko Estuary. J. Oceanogr. 2006, 62, 267–281. [Google Scholar] [CrossRef]
  30. Ezura, Y.; Daiku, K.; Tajima, K.; Kimura, T.; Sakai, M. Seasonal differences in bacterial counts and heterotrophic bacterial flora in Akkeshi Bay. In Effect of the Ocean Environment on Microbial Activities; Colwell, R.R., Morita, R.Y., Eds.; University Park Press: Baltimore, MD, USA, 1974; pp. 112–123. [Google Scholar]
  31. Motoda, S.; Kawamura, T.; Nishizawa, S. Akkeshi Bay. In Productivity of Biocenoses in Coastal Regions of Japan; Hogetsu, K., Hatanaka, M., Hanaoka, T., Kawamura, T., Eds.; University of Tokyo Press: Tokyo, Japan, 1977; pp. 223–265. [Google Scholar]
  32. Kondo, R.; Imai, I.; Fukami, K.; Minami, A.; Hiroishi, S. Phylogenetic analysis of algicidal bacteria (Family Flavobacteriaceae) and selective detection by PCR using a specific primer set. Fish. Sci. 1999, 65, 432–435. [Google Scholar] [CrossRef] [Green Version]
  33. Imai, I. Microbial ecology in coastal systems. Bull. Coast. Oceanogr. 1989, 27, 85–101. (In Japanese) [Google Scholar]
  34. Kogure, K.; Simidu, U.; Taga, N.; Colwell, R. Correlation of direct viable counts with heterotrophic activity of marine bacteria. Appl. Environ. Microbiol. 1987, 53, 2332–2337. [Google Scholar] [CrossRef] [Green Version]
  35. Crump, B.C.; Armbrust, E.V.; Baross, J.A. Phylogenetic analysis of particle-attached and free-living bacterial communities in the Columbia river, its estuary, and the adjacent coastal ocean. Appl. Environ. Microbiol. 1999, 65, 3192–3204. [Google Scholar] [CrossRef] [Green Version]
  36. Amann, R.I.; Ludwig, W.; Schleifer, K.H. Phylogenetic identification and in situ detection of individual microbial cells without cultivation. Microbiol. Rev. 1995, 59, 143–169. [Google Scholar] [CrossRef]
  37. Riquelme, C.E.; Fukami, K.; Ishida, Y. Annual fluctuations of phytoplankton and bacterial communities in Maizuru Bay and their interrelationship. Bull. Jpn. Soc. Microb. Ecol. 1987, 2, 29–37. [Google Scholar] [CrossRef] [Green Version]
  38. Zaccone, R.; Caruso, G.; Calì, C. Heterotrophic bacteria in the northern Adriatic Sea: Seasonal changes and ectoenzyme profile. Mar. Environ. Res. 2002, 54, 1–19. [Google Scholar] [CrossRef]
  39. Nakamura, T.; Yoshikura, T. Total bacteria and viable bacteria in Lake Biwa and Yodo River. Bull. Jpn. Soc. Microbiol. Ecol. 1989, 5, 13–20. (In Japanese) [Google Scholar] [CrossRef] [Green Version]
  40. Kojima, S.; Miyashita, Y.; Hagiwara, T.; Yamaguchi, A.; Imai, I. Possible control strategy of cyanobacterial blooms by bacteria from reed (Phragmites australis) communities in lakes of Ohnuma Quasi-National Park, Hokkaido. Bull. Fish. Sci. Hokkaido Univ. 2016, 66, 19–28. (In Japanese) [Google Scholar]
  41. Kamagata, Y. How to overcome the limitation of conventional cultivation of organisms. Soil Microorg. 2017, 71, 2–5. (In Japanese) [Google Scholar]
  42. Park, J.H.; Yoshinaga, I.; Nishikawa, T.; Imai, I. Algicidal bacteria in particle-associated form and in free-living form during a diatom bloom in the Seto Inland Sea, Japan. Aquat. Microb. Ecol. 2010, 60, 151–161. [Google Scholar] [CrossRef] [Green Version]
  43. Inaba, N.; Trainer, V.L.; Nagai, S.; Kojima, S.; Sakami, T.; Takagi, S.; Imai, I. Dynamics of seagrass bed microbial communities in artificial Chattonella blooms: A laboratory microcosm study. Harmful Algae 2019, 84, 139–150. [Google Scholar] [CrossRef]
  44. Imai, I.; Ishida, Y.; Sakaguchi, K.; Hata, Y. Algicidal marine bacteria isolated from northern Hiroshima Bay, Japan. Fish. Sci. 1995, 61, 628–636. [Google Scholar] [CrossRef] [Green Version]
  45. Sakami, T.; Sakamoto, S.; Takagi, S.; Inaba, N.; Imai, I. Distribution of three algicidal Alteromonas sp. strains in seagrass beds and surrounding areas in the Seto Inland Sea, Japan. Fish. Sci. 2017, 83, 113–121. [Google Scholar] [CrossRef]
  46. Imai, I. Algicidal ranges in killer bacteria of direct attack type for marine phytoplankton. Bull. Plankton Soc. Jpn. 1997, 44, 3–9. [Google Scholar]
  47. Meyer, N.; Bigalke, A.; Kaulfuß, A.; Pohnert, G. Strategies and ecological roles of algicidal bacteria. FEMS Microbiol. Rev. 2017, 41, 880–899. [Google Scholar] [CrossRef] [Green Version]
  48. Lee, S.O.; Kato, J.; Takiguchi, N.; Kuroda, A.; Ikeda, T.; Mitsutani, A.; Ohtake, H. Involvement of an extracellular protease in algicidal activity of the marine bacterium Pseudoalteromonas sp. strain A28. Appl. Environ. Microbiol. 2000, 66, 4334–4339. [Google Scholar] [CrossRef] [PubMed] [Green Version]
  49. Nakashima, T.; Miyazaki, Y.; Matsuyama, Y.; Muraoka, W.; Yamaguchi, K.; Oda, T. Producing mechanism of an algicidal compound against red tide phytoplankton in a marine bacterium γ-proteobacterium. Appl. Microb. Biotechnol. 2006, 73, 684–690. [Google Scholar] [CrossRef] [PubMed]
  50. Sakata, T.; Yoshikawa, T.; Nishitarumizu, S. Algicidal activity and identification of an algicidal substance produced by marine Pseudomonas sp. C55a-2. Fish. Sci. 2011, 77, 397–402. [Google Scholar] [CrossRef]
  51. Umetsu, S.; Kanda, M.; Imai, I.; Sakai, R.; Fujita, M.J. Questiomycins, algicidal compounds produced by the marine bacterium Alteromonas sp. D and their production cue. Molecules 2019, 24, 4522. [Google Scholar] [CrossRef] [PubMed] [Green Version]
  52. Shimada, H.; Miyazono, A. Horizontal distribution of toxic Alexandrium spp. (Dinophyceae) resting cysts around Hokkaido, Japan. Plankton Biol. Ecol. 2005, 52, 76–84. [Google Scholar]
  53. Lee, S.Y.; Lee, I.W.; Choi, C.I. Seasonal changes of community structure of phytoplankton in three Korean seagrass beds. Ocean Polar Res. 2006, 28, 95–105. [Google Scholar] [CrossRef] [Green Version]
  54. Wit, R.; Troussellier, M.; Courties, C.; Buffan-Dubau, E.; Lemaire, E. Short-term interactions between phytoplankton and intertidal seagrass vegetation in a coastal lagoon (Bassin d’Arcachon, SW France). Hydrobiologia 2012, 699, 55–68. [Google Scholar] [CrossRef]
  55. Cummins, S.P.; Roberts, D.E.; Ajani, P.; Underwood, A.J. Comparisons of assemblages of phytoplankton between open water and seagrass habitats in a shallow coastal lagoon. Mar. Freshwater Res. 2004, 55, 447–456. [Google Scholar] [CrossRef]
  56. Jacobs-Palmer, E.; Gallego, R.; Ramón-Laca, A.; Kunselman, E.; Cribari, K.; Horwith, M.; Kelly, R.P. A halo of reduced dinoflagellate abundances in and around eelgrass beds. PeerJ 2020, 8, e8869. [Google Scholar] [CrossRef] [Green Version]
  57. Iizumi, H.; Taguchi, S.; Minami, T.; Mukai, H.; Maekawa, S. Distribution and variability of nutrients, chlorophyll a, particulate organic matters, and their carbon and nitrogen contents, in Akkeshi-Ko, an estuariy in northern Japan. Bull. Hokkaido Natl. Fish. Res. Inst. 1995, 59, 43–67. [Google Scholar]
  58. Anderson, D.M.; Glibert, P.M.; Burkholder, J. Harmful algal blooms and eutrophication: Nutrient sources, composition, and consequences. Estuaries 2002, 25, 704–726. [Google Scholar] [CrossRef]
  59. Imai, I.; Yamaguchi, M.; Hori, Y. Eutrophication and occurrences of harmful algal blooms in the Seto Inland Sea, Japan. Plankton Benthos Res. 2006, 1, 71–84. [Google Scholar] [CrossRef] [Green Version]
  60. Hallegraeff, G.M.; Bolch, C.J. Transport of toxic dinoflagellate cysts via ships’ ballast water. Mar. Pollut. Bull. 1991, 22, 27–30. [Google Scholar] [CrossRef]
  61. Matsuyama, Y. Impacts of the harmful dinoflagellate Heterocapsa curcularisquama bloom on shellfish aquaculture in Japan and some experimental studies on invertebrates. Harmful Algae 2012, 14, 144–155. [Google Scholar] [CrossRef]
  62. Hallegraeff, G.M. Ocean climate change, phytoplankton community responses, and harmful algal blooms: A formidable predictive challenge. J. Phycol. 2010, 46, 220–235. [Google Scholar] [CrossRef]
  63. Abdennadher, M.; Hamza, A.; Fekih, W.; Hannachi, I.; Zouari-Belaaj, A.; Bradai, N.; Aleya, L. Factors determining the dynamics of toxic blooms of Alexandrium minutum during a 10-year study along the shallow southwestern Mediterranean coasts. Estuar. Coast. Shelf Sci. 2012, 106, 102–111. [Google Scholar] [CrossRef]
  64. Mukai, H. Seagrass bed ecosystem in a total system of land– and coastal marine ecosystems. Kaiyo Mon. 2005, 34, 449–457. (In Japanese) [Google Scholar]
  65. Duffy, J.E. Biodiversity and the functioning of seagrass ecosystems. Mar. Ecol. Prog. Ser. 2006, 311, 233–250. [Google Scholar] [CrossRef] [Green Version]
  66. Orth, R.J.; Carruthers, T.J.B.; Dennison, W.C.; Duarte, C.M.; Fourqurean, J.W.; Heck, K.L.; Hughes, A.R.; Kendrick, G.A.; Kenworthy, W.J.; Olyarnik, S.; et al. A global crisis for seagrass ecosystems. Bioscience 2006, 56, 987–996. [Google Scholar] [CrossRef] [Green Version]
  67. Yanagi, T. “Sato-Umi”—A new concept for sustainable fisheries. In Fisheries for Global Welfare and Environment; Tsukamoto, K., Kawamura, T., Takeuchi, T., Beard, T.D., Jr., Kaiser, M.J., Eds.; TERRAPUB: Tokyo, Japan, 2008; pp. 351–358. [Google Scholar]
Figure 1. The locations of the three sampling stations in Akkeshi-ko Estuary and Akkeshi Bay, Hokkaido, Japan.
Applsci 11 00172 g001
Figure 2. Temporal changes of water temperature (a,c,e) and salinity (b,d,f) monitored at the three stations in Akkeshi-ko Estuary (Stn. 1) and Akkeshi Bay (Stn. 2 and Stn. 3).
Applsci 11 00172 g002
Figure 3. Temporal changes of cell densities (○) and phytoplankton communities in composition (histograms) in the surface water collected at Stn. 1 (a), Stn. 2 (b), and Stn. 3 (c).
Applsci 11 00172 g003
Figure 4. Temporal changes in the abundance of cells of the toxic dinoflagellate Alexandrium catenella (Group I) in the surface seawater at Stn. 3. No cells of A. catenella were detected at Stns. 1 and 2.
Applsci 11 00172 g004
Figure 5. Bacterial numbers in the eelgrass Zostera marina samples from Stn. 1: the direct counts (a), the viable counts (CFU) (b), and the percentages of viable counts to direct counts (c).
Applsci 11 00172 g005
Figure 6. Bacterial numbers in the seawater samples from Stn. 1 (0 m): the direct counts (a), the viable counts (CFU) (b), and the percentages of viable counts to direct counts (c).
Applsci 11 00172 g006
Figure 7. Bacterial numbers in the surface seawater samples from Stn. 2: the direct counts (a), the viable counts (CFU) (b), and the percentages of viable counts to direct counts (c).
Applsci 11 00172 g007
Figure 8. Bacterial numbers in the surface seawater samples from Stn. 3: the direct counts (a), the viable counts (CFU) (b), and the percentages of viable counts to direct counts (c).
Applsci 11 00172 g008
Figure 9. Photomicrographs showing the growth-inhibiting activities of bacteria against the toxic dinoflagellate Alexandrium catenella (Group I). (a) The control cells on day 0, (b) the control cells on day 14, (c) the cells on day 14 affected by growth-inhibiting bacteria, and (d) the cells killed by bacteria. Scale bars: 100 µm, except for panel (d).
Applsci 11 00172 g009
Figure 10. Temporal changes in the numbers of growth-inhibiting bacteria against Alexandrium catenella (Group I) detected from Zostera marina (a) and surface seawaters collected at Stn. 1 (b), Stn. 2 (c), and Stn. 3 (d). PAB: particle-associated bacteria (the >3 µm fraction: ■). FLB: free-living bacteria (the <3 µm fraction: □).
Applsci 11 00172 g010
Figure 11. Phylogenetic tree for α- and β-proteobacteria isolates based on the 16S rRNA gene sequences (~1300 bp). The tree was constructed using the maximum likelihood method (ML). Numbers at nodes indicate bootstrap values (neighbor joining method (NJ)/ML). Numbers after the strain name are the accession numbers. PAB: particle-associated bacteria, FLB: free-living bacteria, Leaf: isolated from a leaf of the seagrass Zostera marina. The bacterial name AK is the strain isolated in this study. The outgroup algicidal bacteria are reported by previous study [32].
Applsci 11 00172 g011
Figure 12. Phylogenetic tree for γ-proteobacteria on the basis of 16S rRNA gene sequences (~1300 bp). See the legend of Figure 11 for the explanation of the tree.
Applsci 11 00172 g012
Figure 13. Phylogenetic tree for the CFB group of 16S rRNA gene sequences (~1300 bp). See the Figure 11 legend for the explanation of the tree. The outgroup is Escherichia coli.
Applsci 11 00172 g013
Figure 14. Phylogenetic tree for Actinobacteria and Bacilli (Firmicutes) of 16S rRNA gene sequences (~1300 bp). See the Figure 11 legend for the explanation of the tree.
Applsci 11 00172 g014
Table 1. Closest bacterial relatives of 16S rRNA gene sequences with growth inhibiting bacteria against Alexandrium catenella (Group I). Bacterial strains with homology more than 98.7% were described. FLB: Free-living bacteria (<3 μm fractions), PAB: Particle-associated bacteria (>3 μm fractions).
StrainOriginClosely Related StrainClassificationHomology
NameDDBJ Accession NumberDateAreaStationFLB/PAB/LeafNameDDBJ Accession Number
AK1LC465489April212011Akkeshi BayStn. 3PABZobellia laminariaeAB121975Flabobacteria100
AK2LC465490April212011Akkeshi BayStn. 3PABZobellia laminariaeAB121975Flabobacteria100
AK8LC465496April272011Akkeshi-ko EstuaryStn. 1Leaf Bacteroidetes bacterium KMM 3949AY271625Flabobacteria98.92
AK9LC465497April272011Akkeshi-ko EstuaryStn. 1PABLabrenzia sp. AB434fFR821171α-Proteobacteria100
AK10LC465498April272011Akkeshi-ko EstuaryStn. 1PABLeifsonia sp. SS12.6KC160899Actinobacteria99.42
AK11LC465499April272011Akkeshi BayStn. 2PABNeptuniibacter sp. CAR-SFAB086227γ-Proteobacteria99.86
AK12LC465500April272011Akkeshi BayStn. 2FLBKordia antarctica strain IMCC3317JX456458Flabobacteria99.64
AK13LC465501April272011Akkeshi BayStn. 2FLBKordia sp. LNM-4AB758592Flabobacteria99.47
AK16LC465504May62011Akkeshi-ko EstuaryStn. 1LeafKordia antarctica strain IMCC3317JX456458Flabobacteria99.25
AK18LC465506May62011Akkeshi BayStn. 2PABBacillus baekryungensis strain YD13JN210568Bacilli99.79
AK19LC465507May122011Akkeshi BayStn. 3PABCellulophaga sp. AB405d FR821154Flabobacteria99.93
AK20LC465508May122011Akkeshi BayStn. 2PABRoseobacter sp. r22JQ661116α-Proteobacteria99.93
AK21LC465509May122011Akkeshi-ko EstuaryStn. 1LeafZobellia laminariaeAB121975Flabobacteria99.92
AK24LC465512May182011Akkeshi BayStn. 3PABVibrio sp. D4058DQ480136γ-Proteobacteria99.66
AK25LC465513May182011Akkeshi BayStn. 3PABVibrio sp. D4058DQ480136γ-Proteobacteria99.51
AK27LC465515May252011Akkeshi-ko EstuaryStn. 1LeafKrokinobacter sp. NBRC 100818AB681258Flabobacteria99.71
AK28LC465516May252011Akkeshi-ko EstuaryStn. 1LeafSulfitobacter sp. MBEF04AB733554α-Proteobacteria100
AK31LC465519May252011Akkeshi-ko EstuaryStn. 1PABMarinobacter sp. 132Z-4JX310148γ-Proteobacteria99.58
AK32LC465520May252011Akkeshi BayStn. 2PABSphingomonas sp. NF4-4FJ196036α-Proteobacteria99.49
AK34LC465522June22011Akkeshi-ko EstuaryStn. 1LeafAlteromonas sp. KT1101AF235128γ-Proteobacteria99.79
AK36LC465524June22011Akkeshi-ko EstuaryStn. 1PABVibrio sp. HNS024JN128258γ-Proteobacteria99.86
AK37LC465525June22011Akkeshi BayStn. 3PABAquimarina sp. XH-W2 KF017576Flabobacteria99.57
AK41LC465529June82011Akkeshi-ko EstuaryStn. 1LeafSulfitobacter sp. MBEF05AB733554α-Proteobacteria99.56
AK42LC465530June82011Akkeshi-ko EstuaryStn. 1LeafAlteromonas sp. TO01AB049730γ-Proteobacteria99.86
AK45LC465533June82011Akkeshi-ko EstuaryStn. 1FLBSulfitobacter sp. MBEF04AB733554α-Proteobacteria100
AK47LC465535June82011Akkeshi BayStn. 3PABTenacibaculum sp. 35JX454522Flabobacteria99.85
AK48LC465536June82011Akkeshi BayStn. 3FLBTenacibaculum sp. 35JX454522Flabobacteria99.85
AK50LC465538June152011Akkeshi-ko EstuaryStn. 1PABAlteromonas sp. USC168HQ441215γ-Proteobacteria99.78
AK51LC465539June152011Akkeshi-ko EstuaryStn. 1PABSphingomonas sp. NF4-4FJ196036α-Proteobacteria98.75
AK52LC465540June152011Akkeshi-ko EstuaryStn. 1PABAlteromonas sp. KT1101AF235128γ-Proteobacteria99.79
AK53LC465541June152011Akkeshi-ko EstuaryStn. 1FLBAlteromonas sp. W-6DQ923440γ-Proteobacteria99.59
AK54LC465542June152011Akkeshi-ko EstuaryStn. 1FLBVibrio sp. HNS024JN128258γ-Proteobacteria99.93
Publisher’s Note: MDPI stays neutral with regard to jurisdictional claims in published maps and institutional affiliations.

