Abstract
Background: Brain connectivity has shown to be a key characteristic in the study of both Parkinson’s Disease (PD) and the response of the patients to the dopaminergic medication. Time series analysis has been used here for the first time to study brain connectivity changes during motor activation in PD. Methods: A 64-channel EEG signal was registered during unilateral motor activation and resting-state in 6 non-demented PD patients before and after the administration of levodopa and in 6 matched healthy controls. Spectral entropy correlation, coherence, and interhemispheric divergence differences among PD patients and controls were analyzed under the assumption of stationarity of the time series. Results: During the motor activation test, PD patients showed an increased correlation coefficient (both hands p < 0.001) and a remarkable increase in coherence in all frequency range compared to the generalized reduction observed in controls (both hands p < 0.001). The Kullback–Leibler Divergence (KLD) of the Spectral Entropy between brain hemispheres was observed to increase in controls (right hand p = 0.01; left hand p = 0.015) and to decrease in PD patients (right hand p = 0.02; left hand p = 0.002) with motor activation. Conclusions: Our results suggest that the oscillatory activity of the different cortex areas within healthy brains is relatively independent of the rest. PD brains exhibit a stronger connectivity which grows during motor activation. The levodopa mitigates this anomalous performance.
1. Introduction
Parkinson’s Disease (PD) is the second most common neurodegenerative disorder with a prevalence of 0.3% of the total population and is one of the most frequent causes of physical disability [1].
The pathophysiology of this disease is the degeneration in selectively vulnerable neuronal populations of the substantia nigra with dopaminergic denervation of the striatum and formation of Lewy bodies composed of aggregated α-synuclein [2]. The denervation has been described to be typically asymmetric lateralization in functional studies [3] and the cardinal clinical manifestations such as bradykinesia, rest tremor, or rigidity also show asymmetry [4]. This lateralized vulnerability and the hemispheric dominance interaction remains yet to be fully explained [5,6].
The described functional impairments in PD are largely restored by levodopa administration [7] and also by deep brain stimulation. The nature of this effect has been related to changes in connectivity with both treatments [8,9]. Thus, changes in brain connectivity have been considered as key characteristics of the disease and thoroughly studied using Electroencephalography (EEG), Magnetic Resonance Imaging (MRI), and Magnetoencephalography (MEG). Surface recordings have demonstrated that PD subjects have an increased resting-state cortico-cortical functional connectivity in several frequency bands [10,11]. This increased connectivity has also been correlated with clinical manifestations as tremor severity and dementia [12].
In clinical applications of EEG, the single-channel EEG time series has been interpreted up to date using the concept of signal. This includes the denomination of waves or rhythms characteristic of different physiological states and topographies by visual inspection [13].
Connectivity changes cannot be studied by visually identifiable diagnostic EEG features and several signal analysis methods have been used to solve this question. Coherence has been widely used to analyze the connectivity of EEG [14]. It provides a measure of linear association and is a relatively straightforward approach to functional network interdependencies at first glance [15].
One of the characteristics of the EEG signals is their irregularity, and thus, analyses that provide a measure that summarizes frequency changes over a wide range are very helpful for this purpose. Considering that most physiological signals are nonlinear, entropy is ideal to study neural signals [16] and has been previously used to study EEG signals, especially in epilepsy [17]. Spectral entropy (SE) is a measure of signal irregularity [18]. The advantage of using spectral entropy for EEG analysis is that the contributions to entropy from any particular frequency range can be explicitly separated [19]. Connectivity can be addressed by means of the correlation coefficient among the electrodes’ entropy in the frequency space, whose values indicate the degree of similarity between the information captured by the electrodes, quantifying the amount of dependence between them.
Both measurements, coherence and spectral entropy, provide complimentary as well as global information on the EEG signals.
Given this, this study aims to explore the usefulness of time series analysis techniques, such as spectral entropy and signal coherence, to determine differences in EEG connectivity in PD patients compared to controls both at rest and during motor activation. Scalp EEG connectivity is usually characterized as a graph, being the electrodes, the graph nodes, and the pairwise connectivity measures the edge weights [20]. From this graph, some graph-theoretical features describing the global and local graph topography are usually extracted [21], such as efficiency, clustering coefficient, or centrality, to mention a few among the most popular. In the present study we focus in the assortativity coefficient [22], which is an indirect measure of the resilience of the network, i.e., the vulnerability to insult. This property is especially suitable for PD study, since their functional cortico-thalamic-basal ganglia disruption point to a less resilient functional network.
With this purpose, a high definition (64-channel) EEG was registered during unilateral motor activation and resting-state tests for a group of PD patients and healthy controls. EEG recordings were acquired before and after the first daily dose of dopaminergic medication was administrated to the PD patients. Three hypotheses were formulated. First, it was hypothesized that connectivity differences (network assortativity) will be present between healthy controls and patients with PD, especially during motor activation. Secondly, since there is a typically asymmetric functional and structural lateralization characteristic of PD, interhemispheric assortativity will also show differences among PD and controls. The last and third hypothesis was that given that dopamine action determines changes in connectivity, as mentioned in previous publications, we expect to find assortativity changes between pre and post levodopa EEG.
There are no studies, to our knowledge, using spectral entropy to assess the network assortativity from EEG signals of PD patients and no connectivity studies have been performed using the proposed analysis of EEG during motor activation and resting-state tests in the same cohort.
2. Materials and Methods
2.1. Participants
Six PD patients and 6 healthy age, hand dominance, and gender matched controls were consecutively recruited in a movement disorders clinic in May 2017. The demographic and clinical characteristics of all the participants are shown in Table 1.

Table 1.
Mean (standard deviation) of demographic and clinical data from participants.
Exclusion criteria were set for patients who were using advanced therapies for PD, epilepsy, or structural alterations in previous imaging studies. Montreal Cognitive Assessment (MoCA) total score < 25, poor response to levodopa or suspicion of atypical Parkinsonism’s, any other neurological disease or severe comorbidity. Inclusion criteria for patients with PD were to be over 18 years of age, idiopathic PD (diagnosed according to London brain bank criteria [23]), Hoehn and Yahr I-III, not having evident motor fluctuations and clinical stability (not having changed the antidopaminergic medication in the last 30 days). All the participants included in the study gave their written informed consent after full explanation of the procedure. The study, which was conducted in accordance with the principles of the Helsinki Declaration, as revised in 2013, was approved by the ethical standards committee on human experimentation at the Hospital de Fuenlabrada Code 16/37 approved on December 2016 (Madrid).
2.2. Experimental Tasks and Procedures
Participants were asked to come to the hospital early in the morning without their corresponding daily levodopa or agonist intake (at least 12 h after the last levodopa or dopamine agonist dose). Pre-levodopa (Pre-LD) EEG activity was first recorded at rest over one minute by 64 electrodes situated over the scalp following the 10–20 system. The subjects were comfortably seated with their hands on their laps, relaxed jaw and eyes open, looking at a white wall for one minute. After that, they were instructed to tap their index finger against the thumb for 30 s with the maximum amplitude and speed possible. The dominant hand was the first and then the other. Then, the EEG headset was removed, and the participants took their usual morning dose of Levodopa or agonist dose with a glass of water 30 min before they had a light breakfast and were given free time. The resting and finger-tapping post-levodopa (Post-LD) EEG activities were analogously recorded one hour after the levodopa intake, once the patients were in their usual “ON state”, that is, when levodopa is acting.
2.3. Materials
An actiCHamp amplifier (Brain Vision LLC, Morrisville, NC, USA) was used to amplify and digitize the EEG data at a sampling frequency of 512 Hz. The EEG data were stored in a PC running Windows 7 (Microsoft Corporation, Washington, DC, USA). EEG activity was recorded from 64 positions with active Ag/AgCl scalp electrodes (actiCAP electrodes, Brain Vision LLC, NC, USA). The ground and reference electrodes were placed on AFz and FCz, respectively (Figure 1).
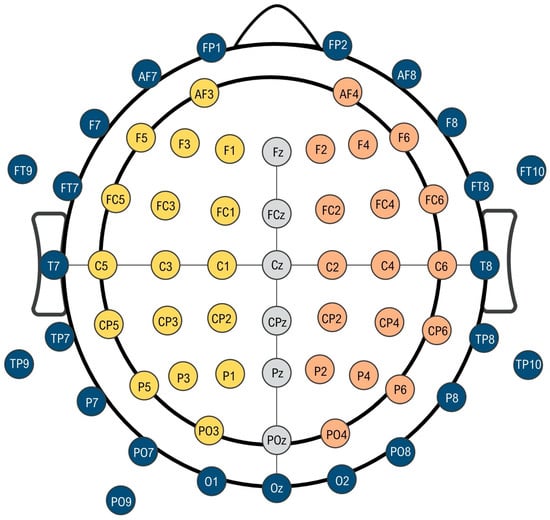
Figure 1.
Schematic representation of 64-channel electroencephalography montage. The inner circle represents the region of interest in our measurements. Yellow electrodes are those corresponding to the left hemisphere (dominant side) and orange electrodes correspond with the right non-dominant hemisphere. Gray central electrodes have been chosen as reference in asymmetry measurements. Blue electrodes have been systematically eliminated from the analysis.
EEG acquisition was carried out by NeuroRT Studio software (Mensia Technologies SA, Paris, France). The EEG signal processing procedure was performed using MATLAB functions (MathWorks Inc., Natick, MA, USA), specifically the EEGLab toolbox [24].
2.4. EEG Processing
In the following, all the presented results will be restricted to a region of interest of electrodes surrounding the motor cortex (see illustration in Figure 1). For our analysis, due to our concerns about the muscle activity contaminating the EEG signal in peripheric electrodes, we decided to discard all the electrodes that were farther from the two channels closest to this area (C3 and C4). Thus, the following electrodes were systematically discarded for the analysis (Fp1, Fp2, AF8, F8, FT8, T8, TP8, P8, PO8, O2, Oz, O1, PO7, P7, TP7, T7, FT7, F7, AF7, FT9, PT9, PO9), as seen in Figure 1.
The EEG signals associated with the 64 channels were artifact-corrected through the Independent Components Analysis and Multiple Artifact Rejection Algorithm [25]. The rejection of the anomalous channels was performed through the Automatic Channel Rejection using the Probability Measure with a default coefficient 5 of the EEGLab toolbox [24]. Next, the discarded channels are reconstructed by means of the tool Interpolate Electrodes, using the spherical method [26]. It is worth noting that signals have not been re-referenced to a common average reference (CAR) to preserve the signal integrity since some small signal features could be hidden or lost, and even to spread isolated signal artifacts giving rise to non-realistic estimations of the entropy values [27].
In order to minimize the influence of spatial filtering procedures on entropy estimations, artifact-cleaned raw signals in the range of 1–30 Hz (delta to beta band) have been analyzed. EEG time-series were cropped to a total length of 30 s, in such a way that those properties depending on the series length can be directly compared.
2.5. Time Series Analysis
The analysis of the time series has been carried out assuming that EEG signals are stationary, in such a way that the statistical properties do not vary on time. The correlation between electrodes, within a patient, is obtained a) in the time domain by means of Pearson’s correlation coefficient of EEG signals to whom previous 1 to 30 Hz bandpass FIR filter, with a Hamming Window, has been applied or b) in the frequency domain by means of Pearson’s correlation coefficient of the frequency dependent Spectral Entropy, estimated as the normalized Discrete Fourier Transform in the 1–30 Hz range. The correlation coefficient indicates the degree of similarity between the information captured by the electrodes, quantifying the amount of interdependence between them and hence their connectivity. Results for correlation will not be presented as mean values, but a distribution of individual pairwise values (assortativity coefficient). Signal coherence is calculated as the pairwise cross-spectral density normalized by the product of the auto spectral densities of both signals.
Finally, relative entropies between electrodes of both hemispheres have been obtained as the Kullback–Leibler Divergence (KLD) [28] of the SpEn between one electrode with any other in the opposite hemisphere. Since PD is a predominantly asymmetric disease and there are some reports about differential changes on connectivity depending on the motor activation side, we looked for interhemispheric connectivity differences. The KLD of the Spectral Entropy, used as an estimator for interhemispheric divergence is not a direct measurement of the asymmetry between hemispheres; however, it highlights the amount of information not shared between electrodes of both hemispheres. From now on, we will call this concept independence.
No spatial averaging has been performed in the aforementioned properties, in such a way that all the pairwise values of the connectivity matrix have been included in our statistical analysis and summarized in box plots.
2.6. Statistical Analysis
We have performed non-parametric Kruskal–Wallis (KW) tests to compare the distributions, Mann–Withney U test to evaluate the difference between the median vales for Pre-LD/Controls, Post-LD/Controls or Pre-LD/Post-LD, and non-parametric Wilcoxon rank-sum test for Pre-LD/Post-LD, with a significance level of 0.05 and the alternative hypothesis of unequal values. Thus, small p-values suggest significant differences between populations.
3. Results
3.1. Demographics
No differences were found between PD and healthy controls in sex (χ2(1) =0.00; p = 1.000), age (t(10) = −0.245; p = 0.811) and educational level (t(6) = −0.072; p = 0.945).
3.2. Correlation Coefficient
Our analysis shows that all the signals in the different categories seem to be strongly correlated (Figure 2). Moreover, there are no significant differences between the average correlation coefficient of spectral entropy among electrodes in the resting-state test for PD subjects compared to healthy controls (p = 0.09). Nevertheless, there are significant differences found in PD subjects in the motor activation test since there is an increase of the average correlation coefficient (right hand p < 0.001; left hand p < 0.001) and non-significant changes in healthy subjects (right hand p = 0.1; left hand p = 0.2).
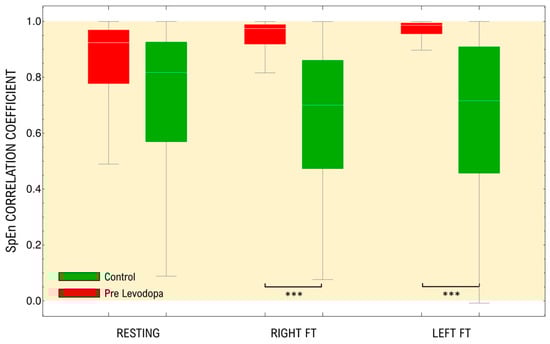
Figure 2.
Distributions of pairwise Correlation Coefficients of the frequency dependent SpEn(f) measurements of the raw EEG signals, in the range of 1–30 Hz, for both controls and patients in resting-state and under different motor activation tasks. The yellow area represents the positively correlated values. FT: Finger tapping. *** p < 0.001.
3.3. Coherence
Figure 3 shows that electrodes are strongly coupled through low-frequency bands in both groups, especially in the delta band (1–4 Hz). There are no significant differences between control and patients in resting-state (p = 0.15). Motor activation causes a statistically significant generalized reduction of coherence in control subjects that is not different when both hands are compared (right hand p = 0.01; left hand p = 0.03) and a great statistically significant generalized increase in PD, also with no differences between hands (right hand p < 0.001; left hand p < 0.001).
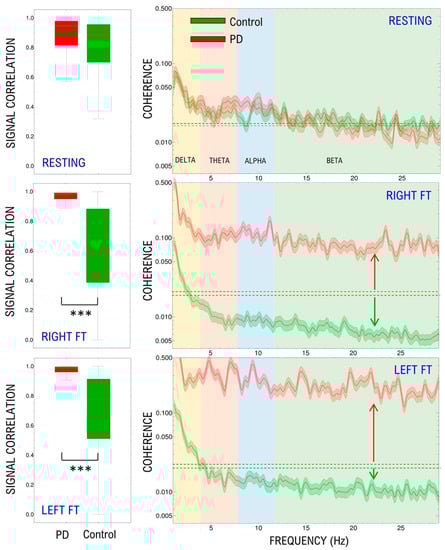
Figure 3.
Distribution of pairwise raw EEG signals’ Correlation Coefficient in the time domain (left panels). Median and standard deviation of the spectral coherence (right panels). Results are shown for the resting-state, right and left finger tapping. Dashed lines in right panels indicate the resting-state baseline, arrows reflect the change produced by motor activation. FT: Finger tapping. *** p < 0.001.
3.4. Divergence
The Kullback–Leibler Divergence (KLD) of the Spectral Entropy between brain hemispheres is essentially a non-symmetric property. Thus, we have included both direct and reverse divergence between both hemispheres. This is, for each electrode in one hemisphere, KLD is computed with respect to every electrode in the other hemisphere. As can be seen in Figure 4, the signals of both hemispheres in healthy controls and PD differ in a basal amount of information in the resting-state. This divergence seems to be higher in controls compared to PD but it is not statistically significant (p = 0.15). The divergence changes with motor activation of the brain cortex were significant in controls (right hand p = 0.01; left hand p = 0.015) and PD (right hand p = 0.02; left hand p = 0.002). Interestingly, there is a decrease in divergence values in PD; meanwhile there is an increase in controls. Contrary to resting-state, when both groups’ divergence is compared during motor activation, there are significant differences (right hand activation PD vs. control p < 0.001; left hand activation PD vs. control p < 0.001). There are no significant differences in changes between sides (left vs right controls p = 0.2; left vs. right PD p = 0.3).
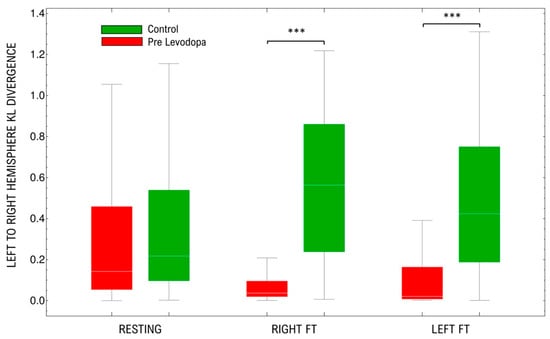
Figure 4.
Distribution of Kullback–Leibler Divergences of the SpEn among electrodes in both hemispheres (left and right). Results are shown for the resting-state, right and left finger tapping. FT: Finger tapping. *** p < 0.001.
3.5. Levodopa Effect
Levodopa effects on each of the analyzed measurements can be seen in Figure 5. The correlation coefficient of spectral entropy is similar among PD subjects in resting-state pre- and post- levodopa administration (p = 0.52). During motor activation, levodopa produces significant changes in the correlation coefficient in the left-hand activation (p = 0.016); meanwhile, it produces no changes in the correlation coefficient in the right hand (p = 0.25). Although in the left hand, levodopa tends to restrain the increase of the coefficient observed in PD subjects, its values remain significantly different from controls (p < 0.001).
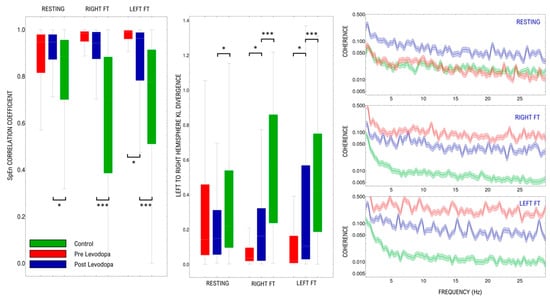
Figure 5.
Comparison of the effect of levodopa over: Spectral Entropy Correlation Coefficient (left panel), Kullback–Leibler Divergence (central panel), and Median and SD of signal coherence (right panel). Results are shown for the resting-state, right and left finger tapping in each panel. * p < 0.05, *** p < 0.001.
In contrast with what is seen in pre-levodopa, resting-state coherence values of PD are significantly higher than those of control (p = 0.02) in all bands. During motor activation, coherence in both hands in PD subjects tends to remain similar to resting-state (right hand p = 0.18; left hand p = 0.25), contrary to the changes seen in pre levodopa motor activation (right hand p= 0.008; left hand p = 0.01).
The administration of levodopa did not produce changes in the interhemispheric divergence in PD resting-state compared to pre-levodopa (p = 0.40). However, levodopa administration produced a significant increase in the interhemispheric divergence during motor activation in PD subjects (right p = 0.06 and left p= 0.015) with no significant differences when both hands are compared (p = 0.41).
4. Discussion
Various electrophysiological findings have been described in PD, from changes of EEG-background activity to complex disturbances in functional connectivity on the cortico-subcortical and cortico-cortical levels [9,29,30,31]. However, there are no reports in our knowledge using time series analysis to document an unexpected increase in network assortativity during motor tasks in PD.
In our study, the correlation coefficient of spectral entropy calculated for pairs of electrodes does not show significant differences between PD subjects compared to healthy controls, evidencing that the interdependence level is very similar in resting-state. This value, used as a connectivity estimator in our work, increases markedly when the motor cortex is activated in PD subjects, indicating a possible over correlation during motor execution.
Actions emerge from temporally coordinated local brain activities at multiple sites in involved neuronal networks, and thus changes in connectivity are expected from a motor or cognitive activation compared with resting-state as seen in our results.
Increases in connectivity in PD have been reported previously as an increased resting-state cortico-cortical functional connectivity in the alpha frequency band [9] or elevated phase amplitude coupling [11]. Both have been interpreted as a sign of PD or dopaminergic status. Increased resting-state cortico-cortical functional connectivity in the 8–10 Hz alpha range is a feature of PD from the earliest clinical stages onward. With disease progression, neighboring frequency bands become increasingly involved. These findings suggest that changes in functional coupling throughout Parkinson´s disease evolution may be linked to the topographical progression of pathology over the brain [29]. In this sense, we have also explored how assortativity depends on the frequency range using the coherence analysis of EEG signals. Similar to SpEn correlation, in our sample, coherence seems to be pretty similar in resting-state, but in response to motor activation, there are opposite changes in the values of PD compared to controls. These changes are not influenced by the motor activation side and seem to confirm an increase in connectivity in all frequencies in response to motor activation in PD. It has been previously published that high values of EEG correlation coefficient or coherence may be caused by anatomical connections or functional coupling between the brain regions generating the recorded EEG signals [32,33]. Our results suggest that increased connectivity and a more extended network activation may be necessary to accomplish the demands of a motor task in PD brains, thus probably reducing its efficiency that results in cognitive and motor performance impairments [34].
In our cohort, it is evident that both sides of the brain seem to work independently to a certain extent. This independence, measured as the Kullback–Leibler Divergence, seems to be higher in controls compared to PD but it is not statistically significant (p = 0.15). However, there is a significant difference between both groups’ interhemispheric independence changes with motor activation on either side. Parallel to what was seen in coherence and entropy correlation, there is an increase in independence in controls but a decrease in PD, indicating that the coupling between both hemispheres may be increased during motor tasks in PD by requiring global participation of networks that may explain a reduced motor performance. No differences were seen between both hands’ activation. This increased interhemispheric synchrony between sensorimotor cortices has been evidenced previously in experimental animal models of PD [35] and also associated with cognitive dysfunctions in MEG studies [29].
In our study, Levodopa intake modulates the changes seen in some of our analyses. It restrains the correlation coefficient increase produced with motor activation in the left hand. Although the values are still altered, they are closer to those seen in controls. This asymmetric effect deserves to be explored in a future study because asymmetrical changes in PD produced by levodopa administration have been previously reported [36].
When pre- and post- levodopa EEG coherence results are compared, the drug increases the coherence in all frequencies in resting-state, as reported in previous studies [37]. Levodopa intake has been associated mainly with power increases in the alpha and beta rhythms in central-parietal areas [38], but some other studies are rather contradictory showing that resting-state EEG connectivity among regions of the motor network after levodopa administration did not change significantly [39]. During motor activation, the drug seems to prevent the power increase in PD subjects, remaining very similar to resting-state. Levodopa effects over connectivity could be caused by widespread dopaminergic projections ascending from the ventral tegmental area and SNc, which may be important in determining cortico-cortical coupling during executive tasks [37,40].
Finally, when interhemispheric “independence” is analyzed through KLD, levodopa intake does not change the independence of information processing on both sides in the resting-state of PD. However, during motor activation, it diminishes the assortativity increase described previously in PD subjects.
Comparison of connectivity results across studies may be a difficult task because of the type of functional data, connectivity definitions, and computational algorithms used. Nevertheless, our results are coherent with those demonstrated using resting-state fMRI, one of the most used techniques to study connectivity. PD subjects off medication compared to controls show large-scale network reorganization in resting-state fMRI with increased connectivity in cortical sensorimotor areas [30]. Dopaminergic therapy normalized this increased connectivity [41]. SpEn allows us to define a frequency dependent entropy and thus makes this information more comprehensible and closer to clinical neurophysiological studies.
The present study was not without limitations. First, the sample size was relatively small. Notwithstanding, our sample was adequate to detect a number of network assortativity differences between the two study groups. A small sample size lessens the likelihood of detecting a statistically significant difference, but in our study, not only the magnitude of the correlation coefficients but also the significance of some analysis were very high. Second, EEG has its own known limitations in terms of spatial resolution, impossibility to detect neuronal activity far from the scalp surface and signal to noise ratio. This last issue has made us eliminate several electrodes in the periphery of the setting. This has been made systematically in all the subjects in order to reduce the influence on the results. In third place, in our study, differences in assortativity between PD patients and control subjects were significant, but not large enough to distinguish PD patients on an individual subject basis. Therefore, further refinements in signal processing techniques are needed to be able to utilize this technique diagnostically. A larger sample and a thorough register of cognitive variables would allow making significant contributions to the search of biomarkers of progression of the disease.
5. Conclusions
Our study, despite the reduced number of subjects included, has been able to differentiate PD patients off medications from healthy control subjects, which, to our knowledge, has not been shown with time series analysis methods so far.
Changes in connectivity may be a dynamic process that varies with behavior and cognition alongside the disease progression; thus, it might be also a disease progression marker. We do not know whether higher dopamine doses will mean normalization of assortativity values or whether earlier stages mean less hyper-connectivity.
Up to date, most connectivity studies have used mainly invasive recordings of cortical and subcortical activity. The EEG connectivity approach used in our study could potentially be used to measure objectively dopamine effects and adjust the dosing when clinical clues are not enough, or non-motor symptoms are predominant. It could be also used for integrating closed loop systems for DBS stimulation parameters regulation.
In closing, the differences found in network assortativity suggest that the different cortex areas within a healthy brain can perform tasks independently. On the contrary, PD brains exhibit a greater connectivity, which grows during motor activation. Although the administration of levodopa appears to mitigate this behavior, it does not seem to produce a sufficiently strong modification so that the assortativity values match those of the controls in any situation.
Our findings should be considered only as a preliminary result, more for exploratory purposes than for a solid conclusion. Further additional studies with larger samples are required. The potential for EEG analysis in PD diagnosis and treatment regulation is yet to be fully explored.
Author Contributions
Conceptualization, J.P.R., D.H.-A., and R.P.; methodology. J.P.R., D.H.-A., and R.P.; software, J.I.S., M.D.D.C., A.M.M.; validation, J.I.S., M.D.D.C., and J.P.R.; formal analysis, A.M.M., D.H.-A., and R.P.; investigation, A.M.M.; resources, J.P.R.; data curation, A.A., J.A.; writing—original draft preparation, J.P.R., D.H.-A., R.P., and A.M.M.; writing—review and editing, J.P.R., D.H.-A., and R.P.; visualization, A.M.M.; supervision, J.P.R.; project administration, J.P.R.; funding acquisition, J.P.R. All authors have read and agreed to the published version of the manuscript.
Funding
This research was supported mainly by FEDER funds. Dr. Romero is supported by the Ministry of Economy and Competitiveness (grant DPI2015-68664-C4-3-R (MINECO/FEDER), NeuroMOD Therapy development and evaluation of motor and cognitive impact for Parkinson´s disease rehabilitation). M.D. del Castillo, J.I. Serrano are supported by the Ministry of Economy and Competitiveness (grant DPI2015-68664-C4-1-R (MINECO/FEDER), NeuroMOD.
Institutional Review Board Statement
The study was conducted according to the guidelines of the Declaration of Helsinki, and approved by the Institutional Ethics Committee of Hospital de Fuenlabrada, Spain. (protocol code 16/37 on 16 December 2016).
Informed Consent Statement
Informed consent was obtained from all subjects involved in the study.
Data Availability Statement
The data presented in this study are available on request from the corresponding author.
Acknowledgments
We would like to thank Paz Fernández for her assistance with the EEG recordings.
Conflicts of Interest
The authors declare no conflict of interest.
References
- Opara, J.; Małecki, A.; Małecka, E.; Socha, T. Motor assessment in Parkinson’s disease. Ann. Agric. Environ. Med. 2017, 24, 411–415. [Google Scholar] [CrossRef] [PubMed]
- Dickson, D.W. Neuropathology of Parkinson disease. Parkinsonism Relat. Disord. 2018, 46 (Suppl. 1), S30–S33. [Google Scholar] [CrossRef] [PubMed]
- Niimi, Y.; Ito, S.; Murate, K.; Hirota, S.; Hikichi, C.; Ishikawa, T.; Maeda, T.; Nagao, R.; Shima, S.; Mizutani, Y.; et al. Usefulness of combining 123I-FP-CIT-SPECT striatal asymmetry index and cardiac 123I-metaiodobenzylguanidine scintigraphy examinations for diagnosis of parkinsonisms. J. Neurol. Sci. 2017, 377, 174–178. [Google Scholar] [CrossRef] [PubMed]
- Djaldetti, R.; Ziv, I.; Melamed, E. The mystery of motor asymmetry in Parkinson’s disease. Lancet Neurol. 2006, 5, 796–802. [Google Scholar] [CrossRef]
- Scherfler, C.; Seppi, K.; Mair, K.J.; Donnemiller, E.; Virgolini, I.; Wenning, G.K.; Poewe, W. Left hemispheric predominance of nigrostriatal dysfunction in Parkinson’s disease. Brain 2012, 135, 3348–3354. [Google Scholar] [CrossRef] [PubMed]
- Stewart, K.C.; Fernandez, H.H.; Okun, M.S.; Rodriguez, R.L.; Jacobson, C.E.; Hass, C.J. Side onset influences motor impairments in Parkinson disease. Parkinsonism Relat. Disord. 2009, 15, 781–783. [Google Scholar] [CrossRef]
- Kostrzewa, R.M.; Nowak, P.; Kostrzewa, J.P.; Kostrzewa, R.A.; Brus, R. Peculiarities of L: -DOPA treatment of Parkinson’s disease. Amino Acids 2005, 28, 157–164. [Google Scholar] [CrossRef]
- Silberstein, P.; Pogosyan, A.; Kühn, A.A.; Hotton, G.; Tisch, S.; Kupsch, A.; Dowsey-Limousin, P.; Hariz, M.I.; Brown, P. Cortico-cortical coupling in Parkinson’s disease and its modulation by therapy. Brain 2005, 128, 1277–1291. [Google Scholar] [CrossRef]
- Stoffers, D.; Bosboom, J.L.W.; Deijen, J.B.; Wolters, E.C.; Berendse, H.W.; Stam, C.J. Slowing of oscillatory brain activity is a stable characteristic of Parkinson’s disease without dementia. Brain 2007, 130, 1847–1860. [Google Scholar] [CrossRef]
- George, J.; Strunk, J.; Mak-McCully, R.; Houser, M.; Poizner, H.; Aron, A. Dopaminergic therapy in Parkinson’s disease decreases cortical beta band coherence in the resting state and increases cortical beta band power during executive control. NeuroImage Clin. 2013, 3, 261–270. [Google Scholar] [CrossRef]
- Swann, N.C.; de Hemptinne, C.; Aron, A.R.; Ostrem, J.L.; Knight, R.T.; Starr, P.A. Elevated Synchrony in Parkinson’s Disease Detected with Electroencephalography. Ann. Neurol. 2015, 78, 742–750. [Google Scholar] [CrossRef] [PubMed]
- Bočková, M.; Rektor, I. Impairment of brain functions in Parkinson’s disease reflected by alterations in neural connectivity in EEG studies: A viewpoint. Clin. Neurophysiol. 2019, 130, 239–247. [Google Scholar] [CrossRef] [PubMed]
- Ignaccolo, M.; Latka, M.; Jernajczyk, W.; Grigolini, P.; West, B.J. The dynamics of EEG entropy. J. Biol. Phys. 2010, 36, 185–196. [Google Scholar] [CrossRef] [PubMed]
- Srinivasan, R.; Winter, W.R.; Ding, J.; Nunez, P.L. EEG and MEG coherence: Measures of functional connectivity at distinct spatial scales of neocortical dynamics. J. Neurosci. Methods 2007, 166, 41–52. [Google Scholar] [CrossRef] [PubMed]
- Methods for Analysis of Brain Connectivity: An IFCN-Sponsored Review—ClinicalKey. Available online: https://www-clinicalkey-com.m-hdoct.a17.csinet.es/#!/content/playContent/1-s2.0-S1388245719309149?returnurl=null&referrer=null (accessed on 22 January 2020).
- Faust, O.; Bairy, M.G. Nonlinear analysis of physiological signals: A review. J. Mech. Med. Biol. 2012, 12, 1240015. [Google Scholar] [CrossRef]
- Helakari, H.; Kananen, J.; Huotari, N.; Raitamaa, L.; Tuovinen, T.; Borchardt, V.; Rasila, A.; Raatikainen, V.; Starck, T.; Hautaniemi, T.; et al. Spectral entropy indicates electrophysiological and hemodynamic changes in drug-resistant epilepsy—A multimodal MREG study. NeuroImage Clin. 2019, 22, 101763. [Google Scholar] [CrossRef]
- Shannon, C.E. A Mathematical Theory of Communication. Bell Syst. Tech. J. 1948, 27, 379–423. [Google Scholar] [CrossRef]
- Viertiö-Oja, H.; Maja, V.; Särkelä, M.; Talja, P.; Tenkanen, N.; Tolvanen-Laakso, H.; Paloheimo, M.; Vakkuri, A.; Yli-Hankala, A.; Meriläinen, P. Description of the Entropy algorithm as applied in the Datex-Ohmeda S/5 Entropy Module. Acta Anaesthesiol. Scand. 2004, 48, 154–161. [Google Scholar] [CrossRef] [PubMed]
- Vecchio, F.; Miraglia, F.; Judica, E.; Cotelli, M.; Alù, F.; Rossini, P.M. Human brain networks: A graph theoretical analysis of cortical connectivity normative database from EEG data in healthy elderly subjects. GeroScience 2020, 42, 575–584. [Google Scholar] [CrossRef]
- Farahani, F.V.; Karwowski, W.; Lighthall, N.R. Application of Graph Theory for Identifying Connectivity Patterns in Human Brain Networks: A Systematic Review. Front. Neurosci. 2019, 13. [Google Scholar] [CrossRef]
- Noldus, R.; Mieghem, P.V. Assortativity in complex networks. J. Complex Netw. 2015, 3, 507–542. [Google Scholar] [CrossRef]
- Hughes, A.J.; Daniel, S.E.; Kilford, L.; Lees, A.J. Accuracy of clinical diagnosis of idiopathic Parkinson’s disease: A clinico-pathological study of 100 cases. J. Neurol. Neurosurg. Psychiatry 1992, 55, 181–184. [Google Scholar] [CrossRef] [PubMed]
- Delorme, A.; Makeig, S. EEGLAB: An open source toolbox for analysis of single-trial EEG dynamics including independent component analysis. J. Neurosci. Methods 2004, 134, 9–21. [Google Scholar] [CrossRef] [PubMed]
- Winkler, I.; Haufe, S.; Tangermann, M. Automatic classification of artifactual ICA-components for artifact removal in EEG signals. Behav. Brain Funct. 2011, 7, 30. [Google Scholar] [CrossRef]
- Perrin, F.; Pernier, J.; Bertrand, O.; Echallier, J.F. Spherical splines for scalp potential and current density mapping. Electroencephalogr. Clin. Neurophysiol. 1989, 72, 184–187. [Google Scholar] [CrossRef]
- Liu, Y.; Coon, W.G.; de Pesters, A.; Brunner, P.; Schalk, G. The Effects of Spatial Filtering and Artifacts on Electrocorticographic Signals. J. Neural Eng. 2015, 12, 056008. [Google Scholar] [CrossRef] [PubMed]
- Kullback, S.; Leibler, R.A. On Information and Sufficiency. Ann. Math. Stat. 1951, 22, 79–86. [Google Scholar] [CrossRef]
- Stoffers, D.; Bosboom, J.L.W.; Deijen, J.B.; Wolters, E.C.; Stam, C.J.; Berendse, H.W. Increased cortico-cortical functional connectivity in early-stage Parkinson’s disease: An MEG study. Neuroimage 2008, 41, 212–222. [Google Scholar] [CrossRef]
- Ballarini, T.; Růžička, F.; Bezdicek, O.; Růžička, E.; Roth, J.; Villringer, A.; Vymazal, J.; Mueller, K.; Schroeter, M.L.; Jech, R. Unraveling connectivity changes due to dopaminergic therapy in chronically treated Parkinson’s disease patients. Sci. Rep. 2018, 8, 1–10. [Google Scholar] [CrossRef]
- Bosboom, J.L.W.; Stoffers, D.; Stam, C.J.; van Dijk, B.W.; Verbunt, J.; Berendse, H.W.; Wolters, E.C. Resting state oscillatory brain dynamics in Parkinson’s disease: An MEG study. Clin. Neurophysiol. 2006, 117, 2521–2531. [Google Scholar] [CrossRef]
- Thatcher, R.W.; Krause, P.J.; Hrybyk, M. Cortico-cortical associations and EEG coherence: A two-compartmental model. Electroencephalogr. Clin. Neurophysiol. 1986, 64, 123–143. [Google Scholar] [CrossRef]
- Manganotti, P.; Gerloff, C.; Toro, C.; Katsuta, H.; Sadato, N.; Zhuang, P.; Leocani, L.; Hallett, M. Task-related coherence and task-related spectral power changes during sequential finger movements. Electroencephalogr. Clin. Neurophysiol. 1998, 109, 50–62. [Google Scholar] [CrossRef]
- Klobušiaková, P.; Mareček, R.; Fousek, J.; Výtvarová, E.; Rektorová, I. Connectivity Between Brain Networks Dynamically Reflects Cognitive Status of Parkinson’s Disease: A Longitudinal Study. J. Alzheimers Dis. 2019, 67, 971–984. [Google Scholar] [CrossRef] [PubMed]
- Monnot, C.; Zhang, X.; Nikkhou-Aski, S.; Damberg, P.; Svenningsson, P. Asymmetric dopaminergic degeneration and levodopa alter functional corticostriatal connectivity bilaterally in experimental parkinsonism. Exp. Neurol. 2017, 292, 11–20. [Google Scholar] [CrossRef] [PubMed]
- Gao, L.; Zhang, J.; Chan, P.; Wu, T. Levodopa Effect on Basal Ganglia Motor Circuit in Parkinson’s Disease. CNS Neurosci. Ther. 2016, 23, 76–86. [Google Scholar] [CrossRef]
- Cassidy, M.; Brown, P. Task-related EEG-EEG coherence depends on dopaminergic activity in Parkinson’s disease. Neuroreport 2001, 12, 703–707. [Google Scholar] [CrossRef]
- Melgari, J.-M.; Curcio, G.; Mastrolilli, F.; Salomone, G.; Trotta, L.; Tombini, M.; di Biase, L.; Scrascia, F.; Fini, R.; Fabrizio, E.; et al. Alpha and beta EEG power reflects L-dopa acute administration in parkinsonian patients. Front. Aging Neurosci. 2014, 6, 302. [Google Scholar] [CrossRef]
- Evangelisti, S.; Pittau, F.; Testa, C.; Rizzo, G.; Gramegna, L.; Ferri, L.; Coito, A.; Cortelli, P.; Calandra Buonaura, G.; Bisquoli, F.; et al. L-Dopa Modulation of Brain Connectivity in Parkinson’s Disease Patients: A Pilot EEG-fMRI StudyData_Sheet_1.docx. Front. Neurosci. 2019, 13, 611. [Google Scholar] [CrossRef]
- HABER, S.N. The place of dopamine in the cortico-basal ganglia circuit. Neuroscience 2014, 282, 248–257. [Google Scholar] [CrossRef]
- Berman, B.D.; Smucny, J.; Wylie, K.P.; Shelton, E.; Kronberg, E.; Leehey, M.; Tregellas, J.R. Levodopa modulates small-world architecture of functional brain networks in Parkinson’s disease. Mov. Disord. 2016, 31, 1676–1684. [Google Scholar] [CrossRef]
Publisher’s Note: MDPI stays neutral with regard to jurisdictional claims in published maps and institutional affiliations. |
© 2020 by the authors. Licensee MDPI, Basel, Switzerland. This article is an open access article distributed under the terms and conditions of the Creative Commons Attribution (CC BY) license (http://creativecommons.org/licenses/by/4.0/).