Article

Goal Estimation of Mandatory Lane Changes Based on Interaction between Drivers

1
Institute of Engineering Innovation, Graduate School of Engineering, The University of Tokyo, Tokyo 113-8656, Japan
2
Department of Precision Engineering, Graduate School of Engineering, The University of Tokyo, Tokyo 113-8656, Japan
3
Department of Intelligent Mechatronics, Faculty of Systems Science and Technology, Akita Prefectural University, Akita 015-0055, Japan
4
Department of Robotics, School of Engineering, Tohoku University, Sendai 980-8579, Japan
*
Author to whom correspondence should be addressed.
Appl. Sci. 2020, 10(9), 3289; https://doi.org/10.3390/app10093289
Submission received: 3 April 2020 / Revised: 19 April 2020 / Accepted: 5 May 2020 / Published: 8 May 2020
(This article belongs to the Special Issue Intelligent Transportation Systems)

Abstract

:
In this paper, we propose a novel method to estimate a goal of surround vehicles to perform a lane change at a merging section. Recently, autonomous driving and advance driver-assistance systems are attracting great attention as a solution to substitute human drivers and to decrease accident rates. For example, a warning system to alert a lane change performed by surrounding vehicles to the front space of the host vehicle can be considered. If it is possible to forecast the intention of the interrupting vehicle in advance, the host driver can easily respond to the lane change with sufficient reaction time. This paper assumes a mandatory situation where two lanes are merged. The proposed method assesses the interaction between the lane-changing vehicle and the host vehicle on the mainstream lane. Then, the lane-change goal is estimated based on the interaction under the assumption that the lane-changing driver decides to minimize the collision risk. The proposed method applies the dynamic potential field method, which changes the distribution according to the relative speed and distance between two subject vehicles, to assess the interaction. The performance of goal estimation is evaluated using real traffic data, and it is demonstrated that the estimation can be successfully performed by the proposed method.

1. Introduction

Although the traffic accident rates are declining, they remain a main factor of mortality. According to the conducted survey [1], nearly 90% of traffic accidents have been caused by human errors. To solve this problem, many researchers have developed autonomous driving and advanced driver-assistance systems (ADAS), and achievements to substitute or aid human drivers were obtained. For instance, a predictive system for future actions of surrounding vehicles is strongly required to improve driving safety. This system would support the cognition of the host driver and guarantees a sufficient reaction time with respect to the behaviors of surrounding traffic participants. Notably, the system could contribute to decreasing accidents that require an instant response, such as lane changes. If it is possible to forecast lane changes performed by surrounding vehicles, the accident rate can be significantly reduced.
When a driver performs a lane change, there are two situations: mandatory and discretionary lane changing. In mandatory lane changing (MLC), a driver must perform a lane change, such as on-ramp or off-ramp. Conversely, discretionary lane changing (DLC) is usually performed when a driver desires to gain speed and improve the driving condition. According to the previous survey, the number of accidents caused by the MLC is twice compared to the DLC. For instance, in the merging situation, drivers may show a tendency to drive aggressively, performing risky lane changes as the end of the acceleration lane becomes closer. In contrast, the DLC does not force drivers to conduct lane changes if it may lead to a collision with vehicles on the target lane. Therefore, an estimation method for MLC is strongly required to improve driving safety. If it is possible to estimate a goal where the lane-changing driver attempts to overtake in front of the host driver, the target lane driver can be ready to react. Hence, the goal estimation of lane changing performed by other drivers may lead to better driving safety.
The interaction between drivers is essential to forecast future actions [2,3]. Drivers control the speed and direction of their own vehicles depending on surrounding vehicles. Surrounding drivers also adjust their speed and direction according to the movement of the host vehicle. Figure 1 shows an example of the interaction between drivers at the on-ramp. When the vehicle on the mainstream lane is slowing down, it can be considered to give passage and allow a lane change to the front space of that as shown in Figure 1a. Conversely, if the vehicle on the mainstream lane maintains the speed or accelerates as shown in Figure 1b, the behavior can be interpreted as rejecting a lane change. Thus, the lane-changing vehicle should aim to cut-in to the behind space of that vehicle. However, some drivers may not abort the lane change in real circumstances. That driver accelerates further and forcibly enters the mainstream lane. In this case, the vehicle on the mainstream lane is forced to decelerate and give passage. Consequently, the interaction between drivers, who are on the acceleration lane and mainstream lane, should be considered for appropriately anticipating the goal of lane-changing.
Among all the estimation model for MLC, a gap acceptance model (GAM) is the most widely used technique [4,5,6]. This model evaluates the probability of lane-changing performed by a vehicle located on the acceleration lane. The probability is derived by comparing the current gap with a critical gap distance, which is the minimum distance required to conduct lane changes. If the current gap is larger than the critical gap distance, the probability of lane-changing increases. However, this model does not consider the interaction between drivers. There are some drivers who perform a lane change even if the required gap distance is not ensured. Moreover, there is a possibility that the driver on the mainstream lane rejects the lane-changing and suddenly shortens the distance. This indicates the possibility of an accident when not considering the interaction between drivers. In [7], the game theory was applied for considering an interaction model at intersections. This model assesses an interaction between the lane-changing vehicle and vehicles on the target lane based on a time-to-collision (TTC). The interaction is defined as a reward, and the model decides according to the reward. A large value of TTC represents a safe condition compared to a small value. However, there is a problem that the TTC has a large value despite the insufficient distance between the two vehicles when the relative speed is small. It has been reported that the TTC cannot appropriately assess driving safety under some conditions [8,9]. Consequently, a new index is required to assess the interaction with the surrounding vehicles.
Considering the above situations, we propose a novel method to estimate the goal of MLC based on the interaction between drivers. The proposed method applies the dynamic characteristic potential method to evaluate the interaction [10]. Surrounding vehicles are defined as moving obstacles, and the distribution of potential field is determined according to the acceleration of the subject vehicle, relative speed, and distance with respect to surrounding vehicles. Then, the space which has the minimum repulsive energy is selected as the goal for lane-changing. This selection assumes that the high repulsive potential energy represents a high collision risk. After that, the collision risk while performing lane-changing is assessed based on the trajectory prediction. If the collision risk with vehicles on the mainstream lane exists during the lane-changing, it is decided that the subject vehicle would maintain the current lane until the collision risk is eliminated. Through the above process, the proposed method realizes the goal estimation and overcomes the limitation of previous methods.
The following three points can be discussed as the contributions of this paper:
  • This paper proposes a novel approach to estimate the goal of lane-changing. To the best of our knowledge, there is no paper to handle the goal estimation since most previous studies have discussed only the possibility of lane-changing.
  • For considering the interaction between drivers, the dynamic potential field method is applied. The advantage of using the method is a description ability about discontinuous conditions. Since the potential field is continuously distributed on the lanes, it can prevent the unstable estimation, caused by using the relative distance or speed, even the corresponding vehicle changes a lane or overtakes other vehicles.
  • The proposed method guarantees the best performance even the previous method is applied to the goal estimation. By extracting the novel features and checking the collision risk based on the trajectory prediction, the great accuracy of goal estimation can be ensured.
This paper is organized as follows. Section 2 describes the problem definition in this paper. Section 3 explains the details of the proposed method. Section 4 presents the experiments, results, and discussion. Finally, Section 5 describes the conclusions of this paper.

2. Problem Definition

Although both estimations of MLC and DLC are crucial tasks, this paper focuses on the MLC performed at on-ramp as shown in Figure 1. As the driver on the acceleration lane must perform lane-changing before reaching the end of the lane, it is expected that dangerous lane changes can sometimes occur even when the driving safety is not ensured. Moreover, drivers on the mainstream lane recognize that vehicles on the acceleration lane must perform a lane change. Therefore, the interaction between drivers should be thoroughly discussed focusing on MLCs at the on-ramp.
Figure 2 depicts our target situation. The lane-changing vehicle is defined as the target, and it is represented in red. The proposed method monitors the closest vehicle in the front and behind the target on the mainstream lane. The preceding vehicle on the mainstream lane is defined as the lead, and the following vehicle on the mainstream is defined as the rear. The two vehicles are indicated in blue. The target vehicle should conduct lane-changing to the mainstream lane before reaching the end of the acceleration lane. Drivers may perform a lane change after they decide the goal where the vehicle cuts-in. In this paper, the front space of the lead vehicle is defined as A, the space between the lead and rear vehicles is B, and the behind space the rear vehicle is indicated as C as shown in Figure 2. Lastly, D indicates that the target vehicle maintains the current lane. When the D is estimated as a goal, it means that the target driver keeps the current lane until the driving safety is ensured. The target driver should consider the interaction with the lead and rear vehicles and assess the collision risk with them. The proposed method starts the goal estimation when the target vehicle appears on the acceleration lane. The estimation is performed at each time step until the target vehicle crosses the center line between the acceleration and mainstream lanes.
This paper excludes the case that there is no vehicle on the mainstream lane since there is no interaction in this situation. The reference distance from the target is set to 50 m. If there is no vehicle within the distance from the target, the case is excluded. However, if either vehicle exists, the case is included in the consideration.

3. Proposed Method

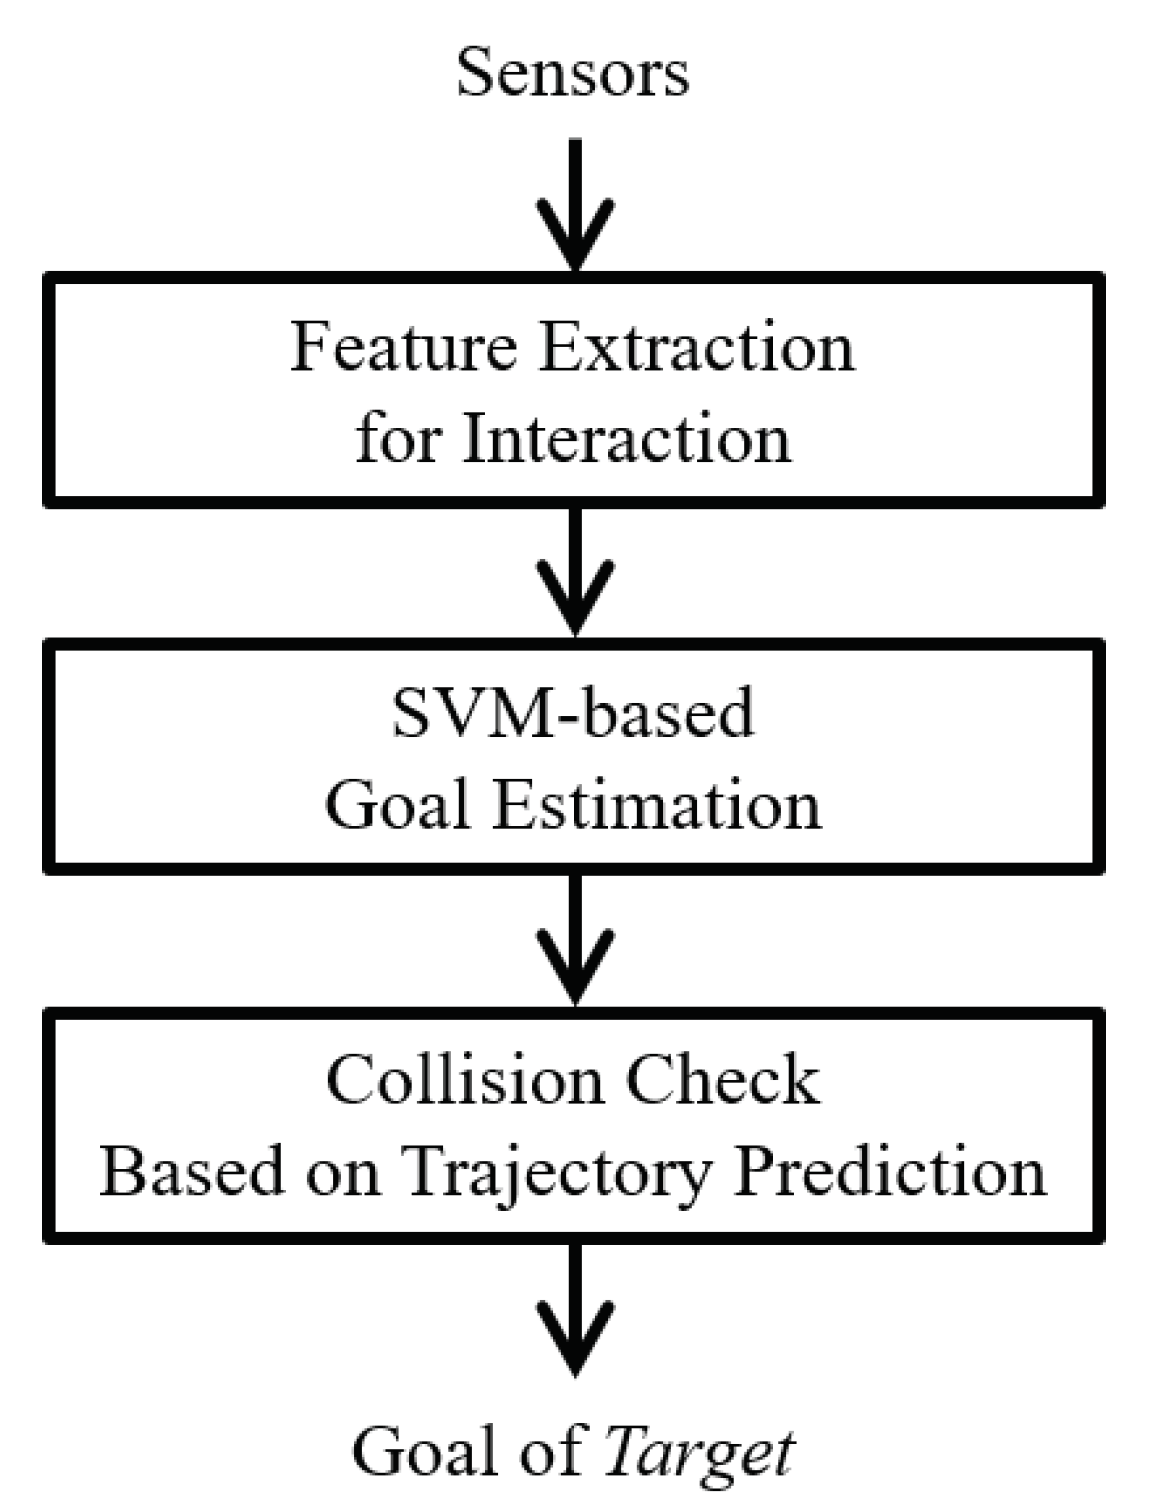
The proposed method consists of three parts: feature extraction for the interaction between drivers, SVM-based goal estimation, and collision check based on the trajectory prediction. Figure 3 shows the schematic of the proposed method. It is assumed that all vehicles have sensing systems, thus, the position, speed, and acceleration of surrounding vehicles can be obtained. Using this information, the features are extracted. The proposed method considers the interaction between drivers by using the dynamic potential field method. In addition, the distance between the target vehicle and the end of the acceleration lane is extracted as a feature. Using these features, the goal estimation is performed based on SVM (support vector machine) [11]. The goal of lane-changing conducted by the target is output among the four candidates: A, B, C, and D as shown in Figure 2. After the estimation, the collision check is conducted. If there is a possibility that the target vehicle would collide with the lead or rear vehicle, the D is determined as the goal even other spaces are estimated in the previous step. Details of each part are described in the following subsections.
The feature extraction for the interaction, SVM-based goal estimation, and collision check based on the trajectory prediction are novel proposals compared to our previous paper [10]. In addition, the objective and the target situation are different with [10].

3.1. Feature Extraction for the Interaction

The proposed method applies a potential field method, which is a general method in the robotics field, for assessing the interaction between drivers [12,13,14]. A potential field method considers two types of potential energies: attractive and repulsive. The attractive potential energy is generated from the goal, whereas the repulsive potential energy is generated from an obstacle. The total energy that a robot has can be derived as follows.
U t o t a l = U a + U r ,
where U t o t a l denotes the sum of potential energies, U a is the attractive potential energy from the goal, and U r is the repulsive potential energy. The proposed method does not consider attractive potential energy since the goal is independent of the interaction between drivers. In this paper, the lead and rear vehicles are defined as obstacles. Consequently, the repulsive energy is emitted from each vehicle, and the potential field is generated by combining the two energies. As a navigation method for robots, the repulsive energy is represented as
U r = 1 2 π σ 2 exp r 2 σ ,
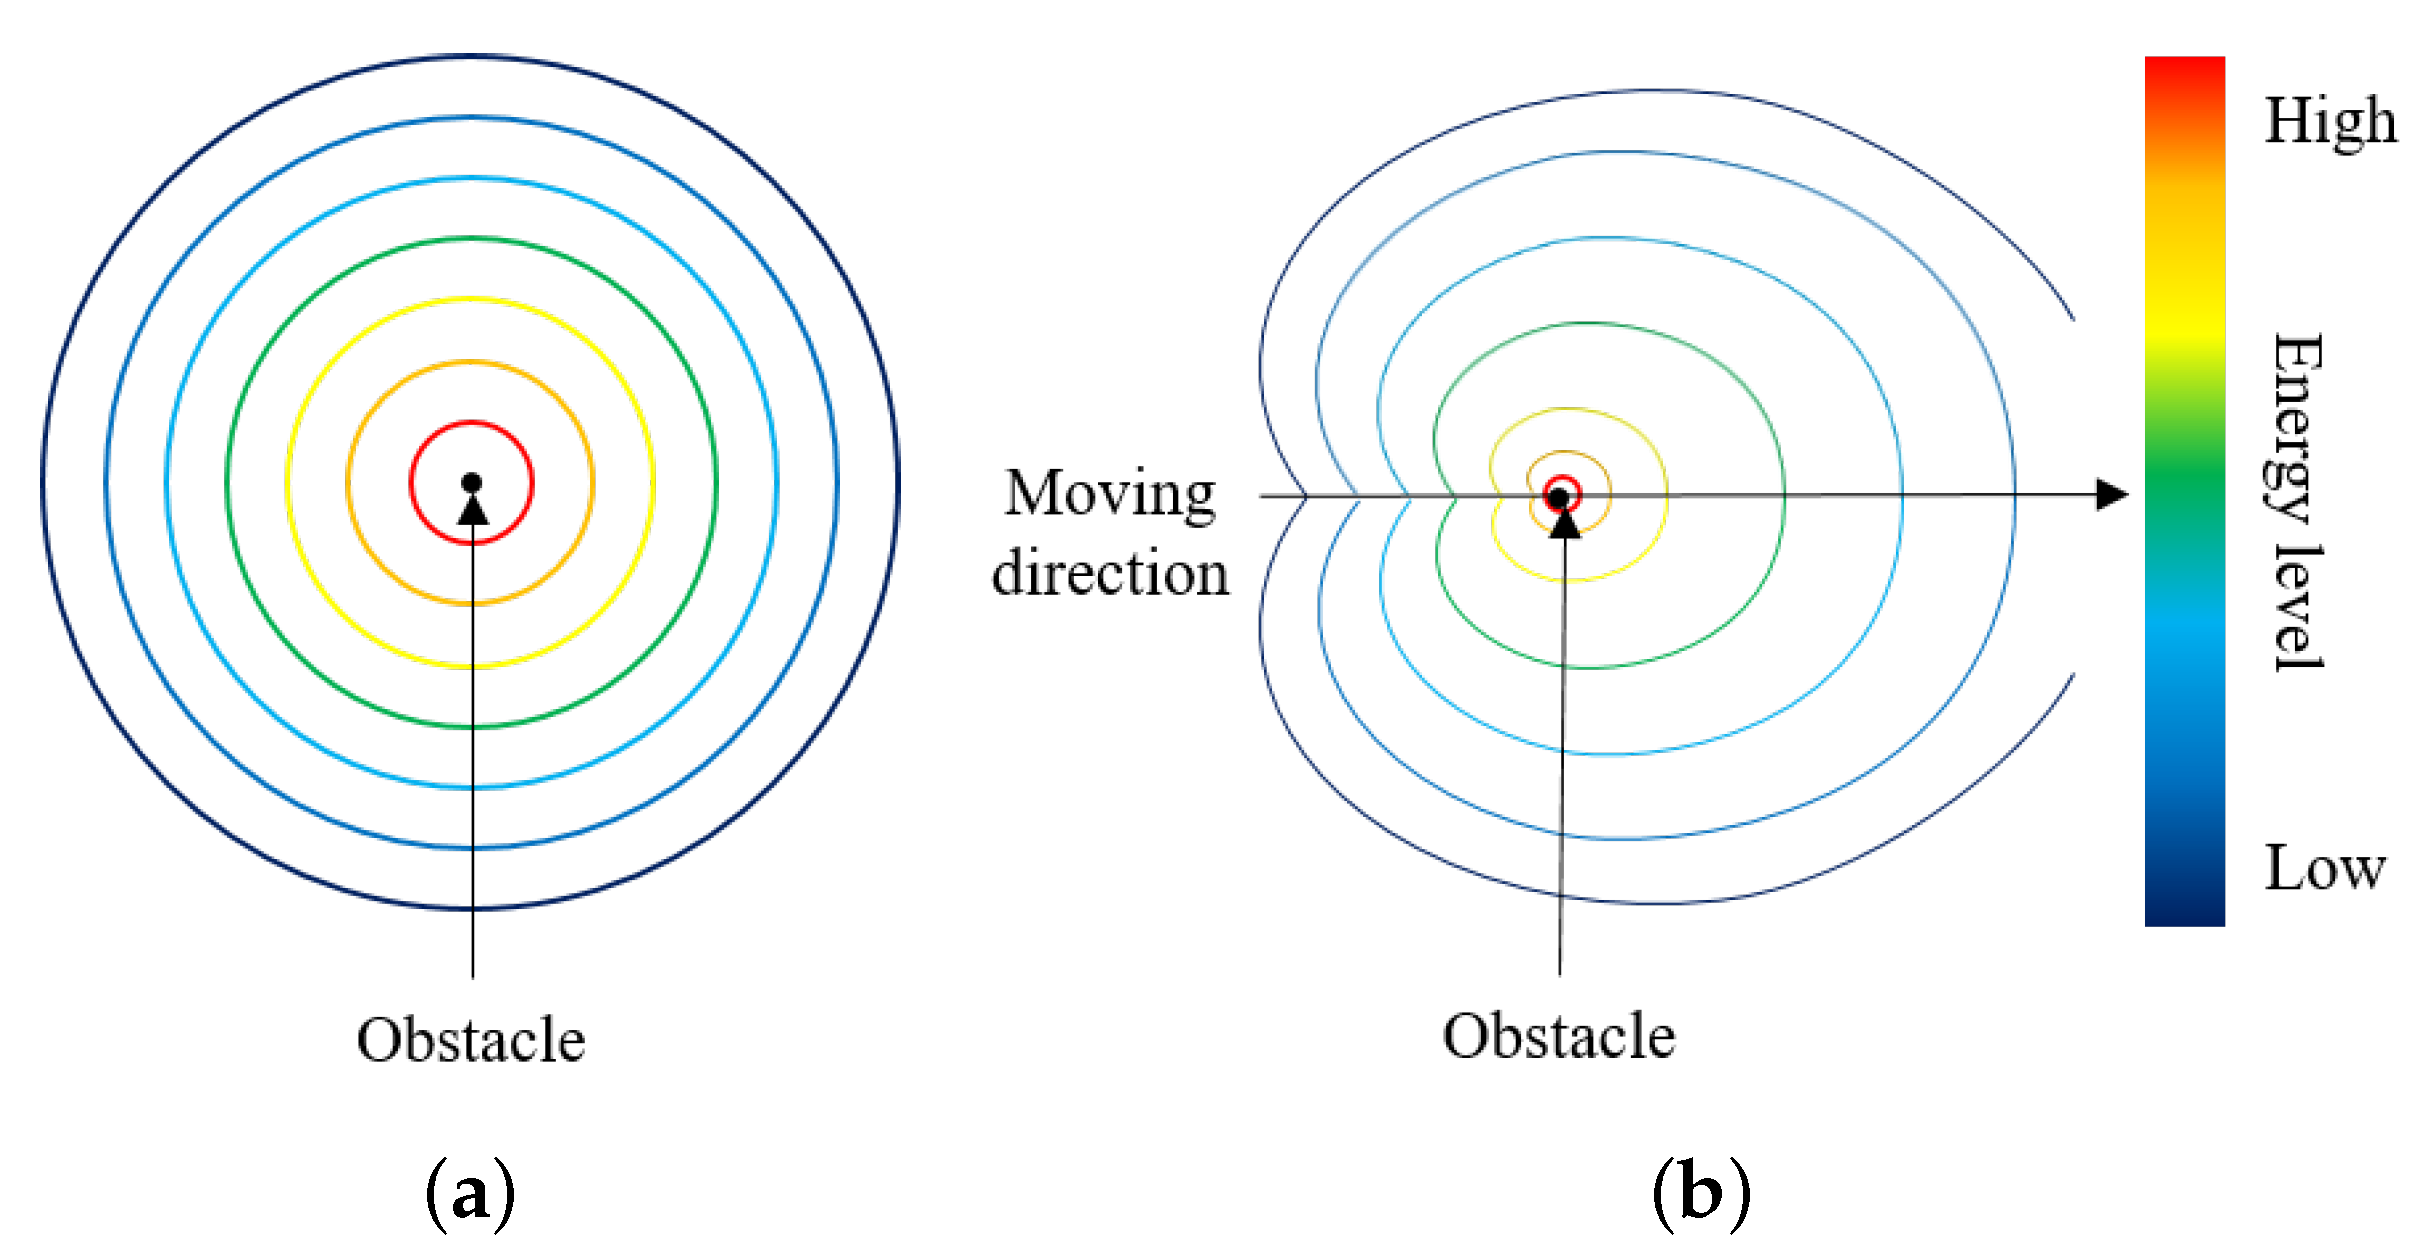
where r denotes the distance from a robot to an obstacle, and σ is its standard deviation. However, as this model assumes a static obstacle, it cannot handle the environment where dynamic obstacles exist such as traffic conditions. Considering this limitation, Hoshino and Maki proposed a dynamic characteristic potential field method [15]. This method uses the von Mises distribution and generates a potential field which changes the distribution according to the moving direction of the obstacle. Figure 4 shows the generated potential fields based on the dynamic model.
Vehicles are dynamic obstacles, and their acceleration is significant information for assessing the interaction between drivers. At on-ramp of the highway, the lead or rear vehicle may decelerate when the driver intends to give passage for the target vehicle. Conversely, the target vehicle may accelerate to guarantee a safe distance from the lead and rear vehicles. In addition, the target vehicle may decelerate when the driver plans to change a lane after the lead or rear vehicle will pass. Based on this driver tendency, the proposed method generates the potential field drifted to the accelerating direction. The dynamic characteristic potential field method is applied, and the distribution is determined according to the level of acceleration (deceleration). If the level of acceleration is high, the potential field is largely drifted to the accelerating direction. In contrast, if the acceleration is low, the potential field has low bias. If the vehicle maintains constant speed without acceleration (deceleration), the potential field has uniform distribution.
Drivers generally show a tendency to maintain sufficient distance from the preceding vehicle when their vehicle is at high speed because of safety. Consequently, the proposed method is designed to generate potential energy according to the speed of the subject vehicle. If the vehicle drives with high speed, the large repulsive potential energy is generated. Summarizing the philosophies of our design, the drift direction of the potential field is determined according to the acceleration (deceleration) of the subject vehicle. In addition, the level of potential energy is determined according to the speed of the subject vehicle and its distance from the vehicle. The repulsive potential energy of vehicle i at point j can be derived from
U i j = α f a i , θ ( Δ x i j , Δ y i j ) h r ( Δ x i j , Δ y i j ) v i ,
f a i , θ ( Δ x i j , Δ y i j ) = 1 2 π I 0 ( β a i ) exp β a i cos θ ( Δ x i j , Δ y i j ) ,
h r ( Δ x i j , Δ y i j ) = 1 2 π σ 2 exp r ( Δ x i j , Δ y i j ) 2 σ ,
r ( Δ x i j , Δ y i j ) = Δ x i j 2 + Δ y i j 2 ,
θ ( Δ x i j , Δ y i j ) = arctan Δ x i j Δ y i j ,
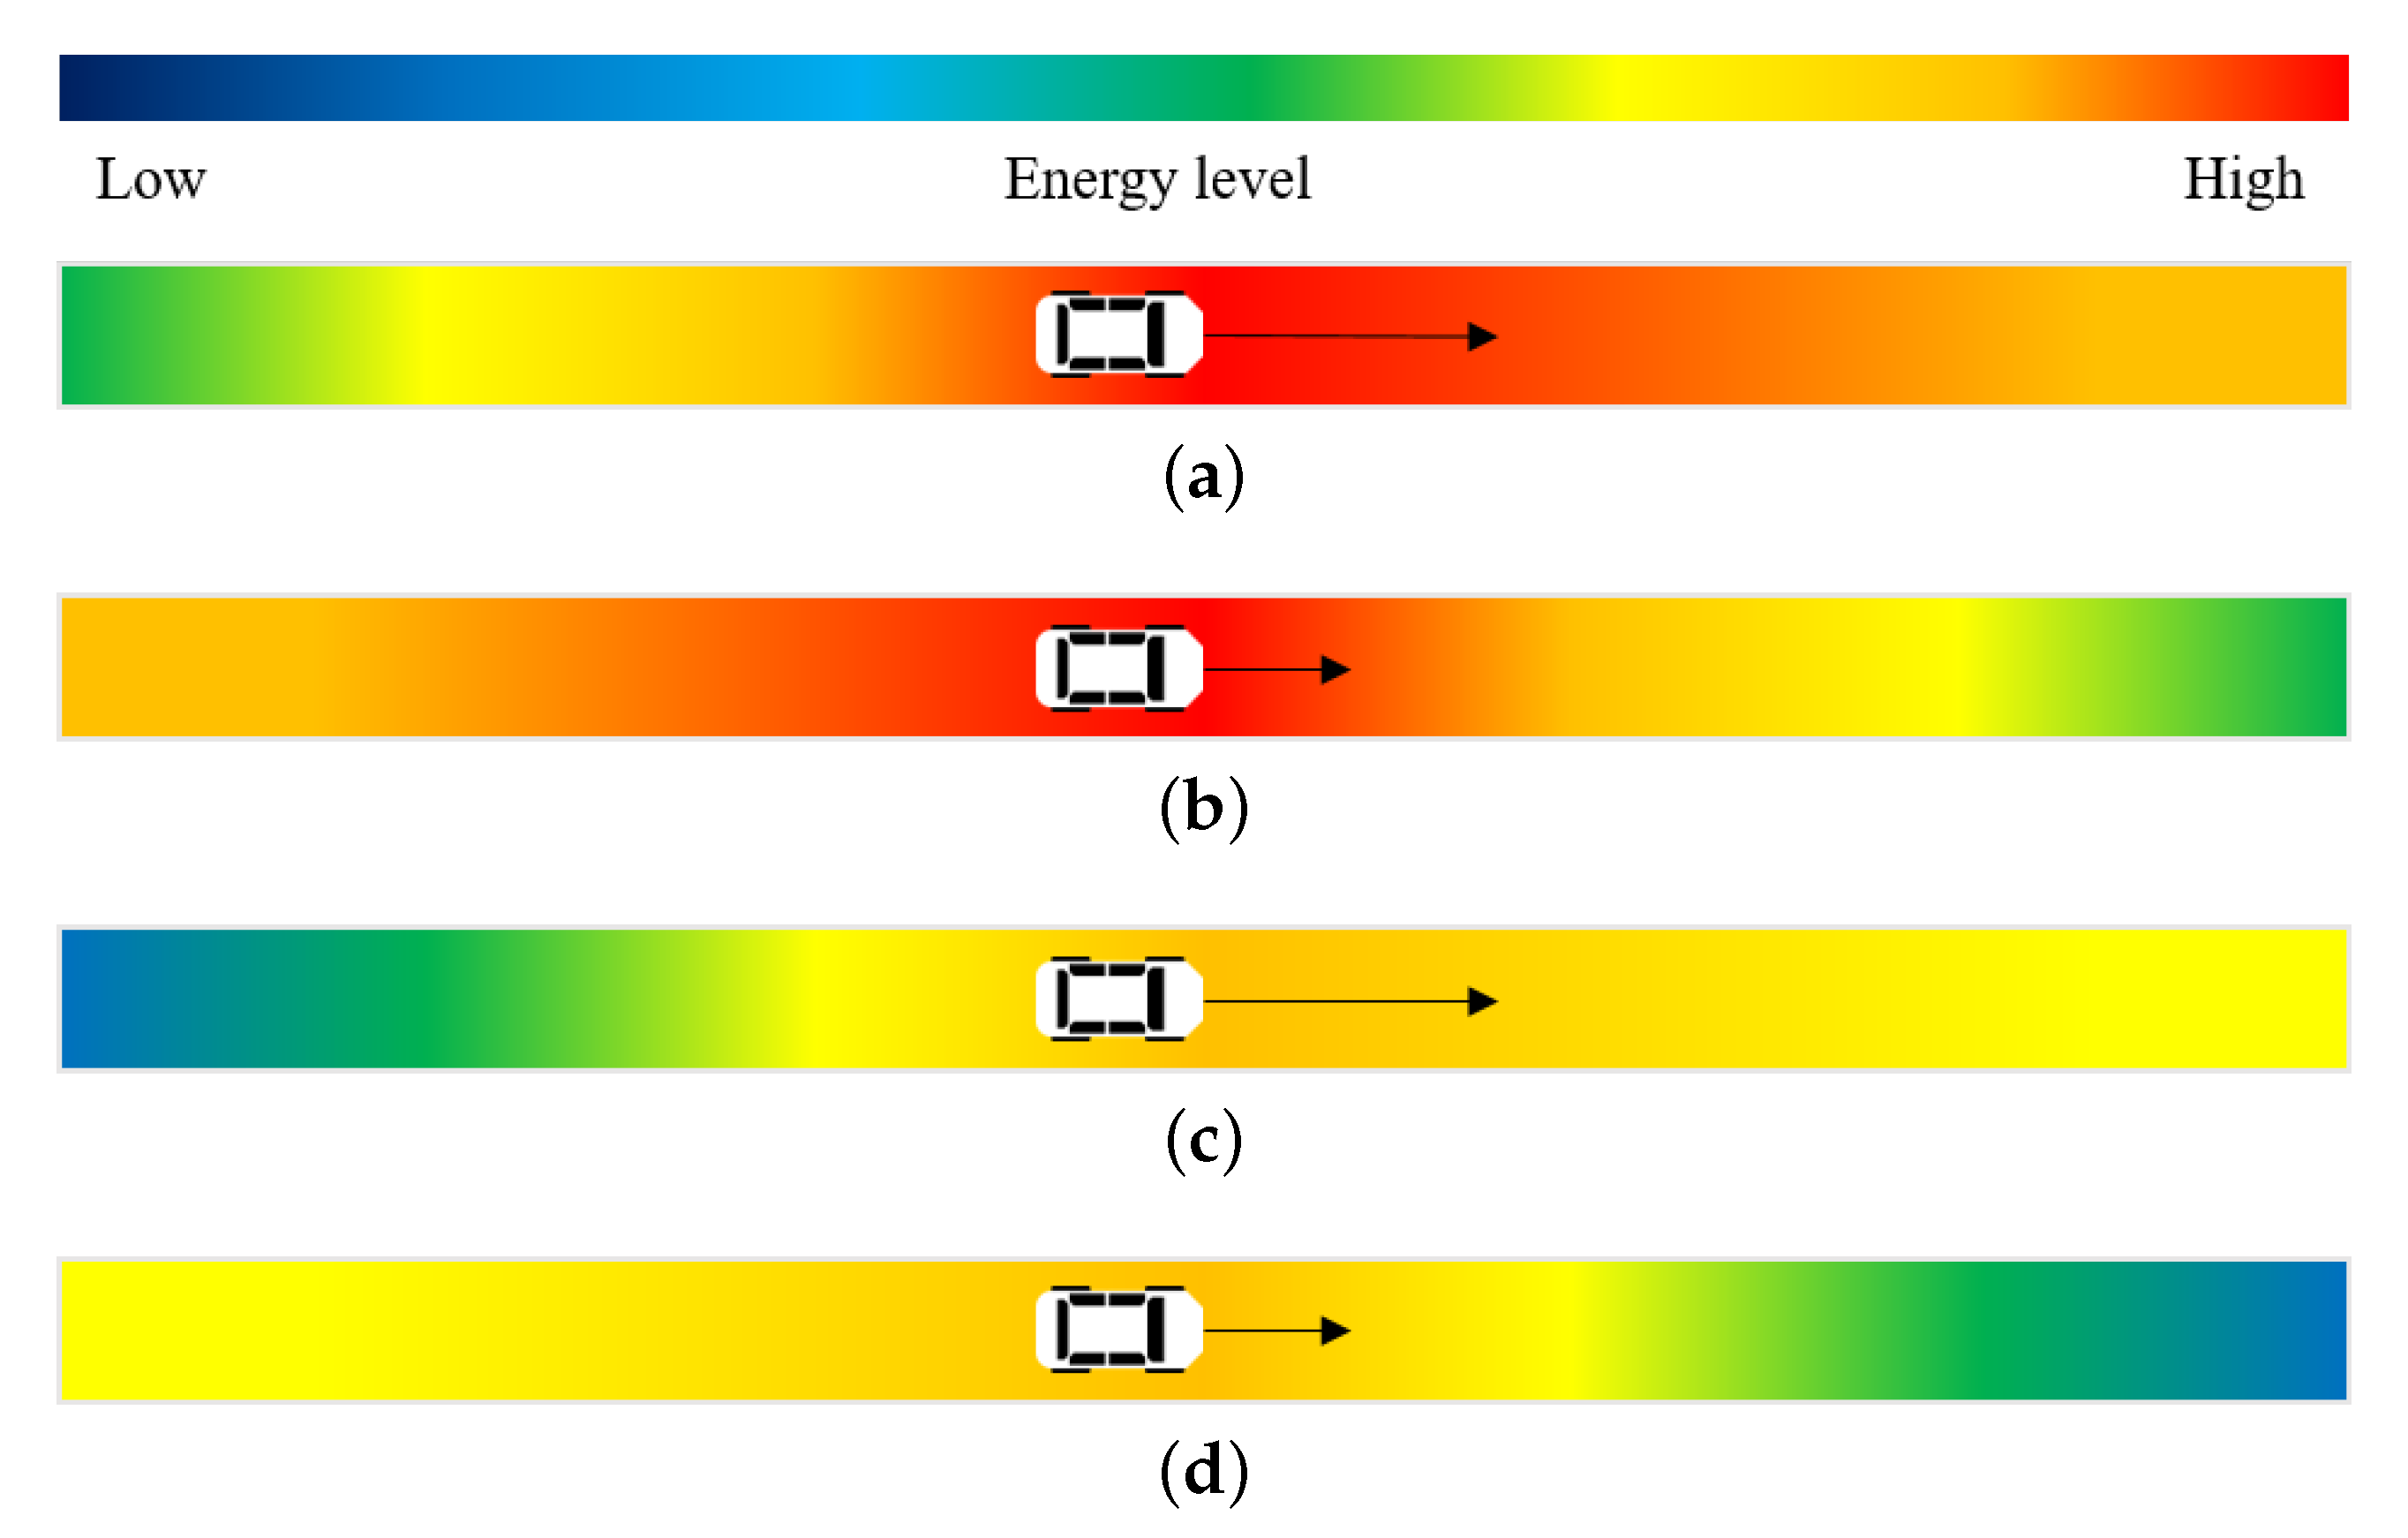
where f a i , θ ( Δ x i j , Δ y i j ) denotes the von Mises distribution, h r ( Δ x i j , Δ y i j ) is the repulsive potential model, α is a coefficient, a i represents the acceleration of vehicle i, v i is the speed of vehicle i, Δ x i j and Δ y i j denotes the distance j from the vehicle i, I 0 represents the Vessel function, and σ is the standard deviation of the distance between the point j and the vehicle i. The von Mises distribution adjusts the level of drift according to the value of a i . When a i is zero, the potential field has uniform distribution. Figure 5 depicts the aspect of generated potential fields by the proposed method. Figure 5a shows the potential field when the vehicle i is rapidly accelerated, in contrast, Figure 5b represents the distribution when the vehicle i is rapidly decelerated. The red color indicates a high energy level whereas the blue color indicates a low level. Figure 5c shows the potential field when the vehicle i is slightly accelerated. Furthermore, Figure 5d represents the distribution when the vehicle i is slightly decelerated. It can be confirmed that the potential field is drifted according to the accelerating direction. In addition, the energy level is determined by the value of acceleration (deceleration).
The advantage of using the dynamic potential field method is a description ability about discontinuous conditions. Most previous methods use the relative distance and speed as the features, however, it can cause the unstable estimation since the information is discontinuously changed if the corresponding vehicle changes a lane or overtakes other vehicles. On the other hand, the potential field is continuously changed since that is distributed on the whole lanes. Therefore, discontinuous changes do not occur by using the dynamic potential field.
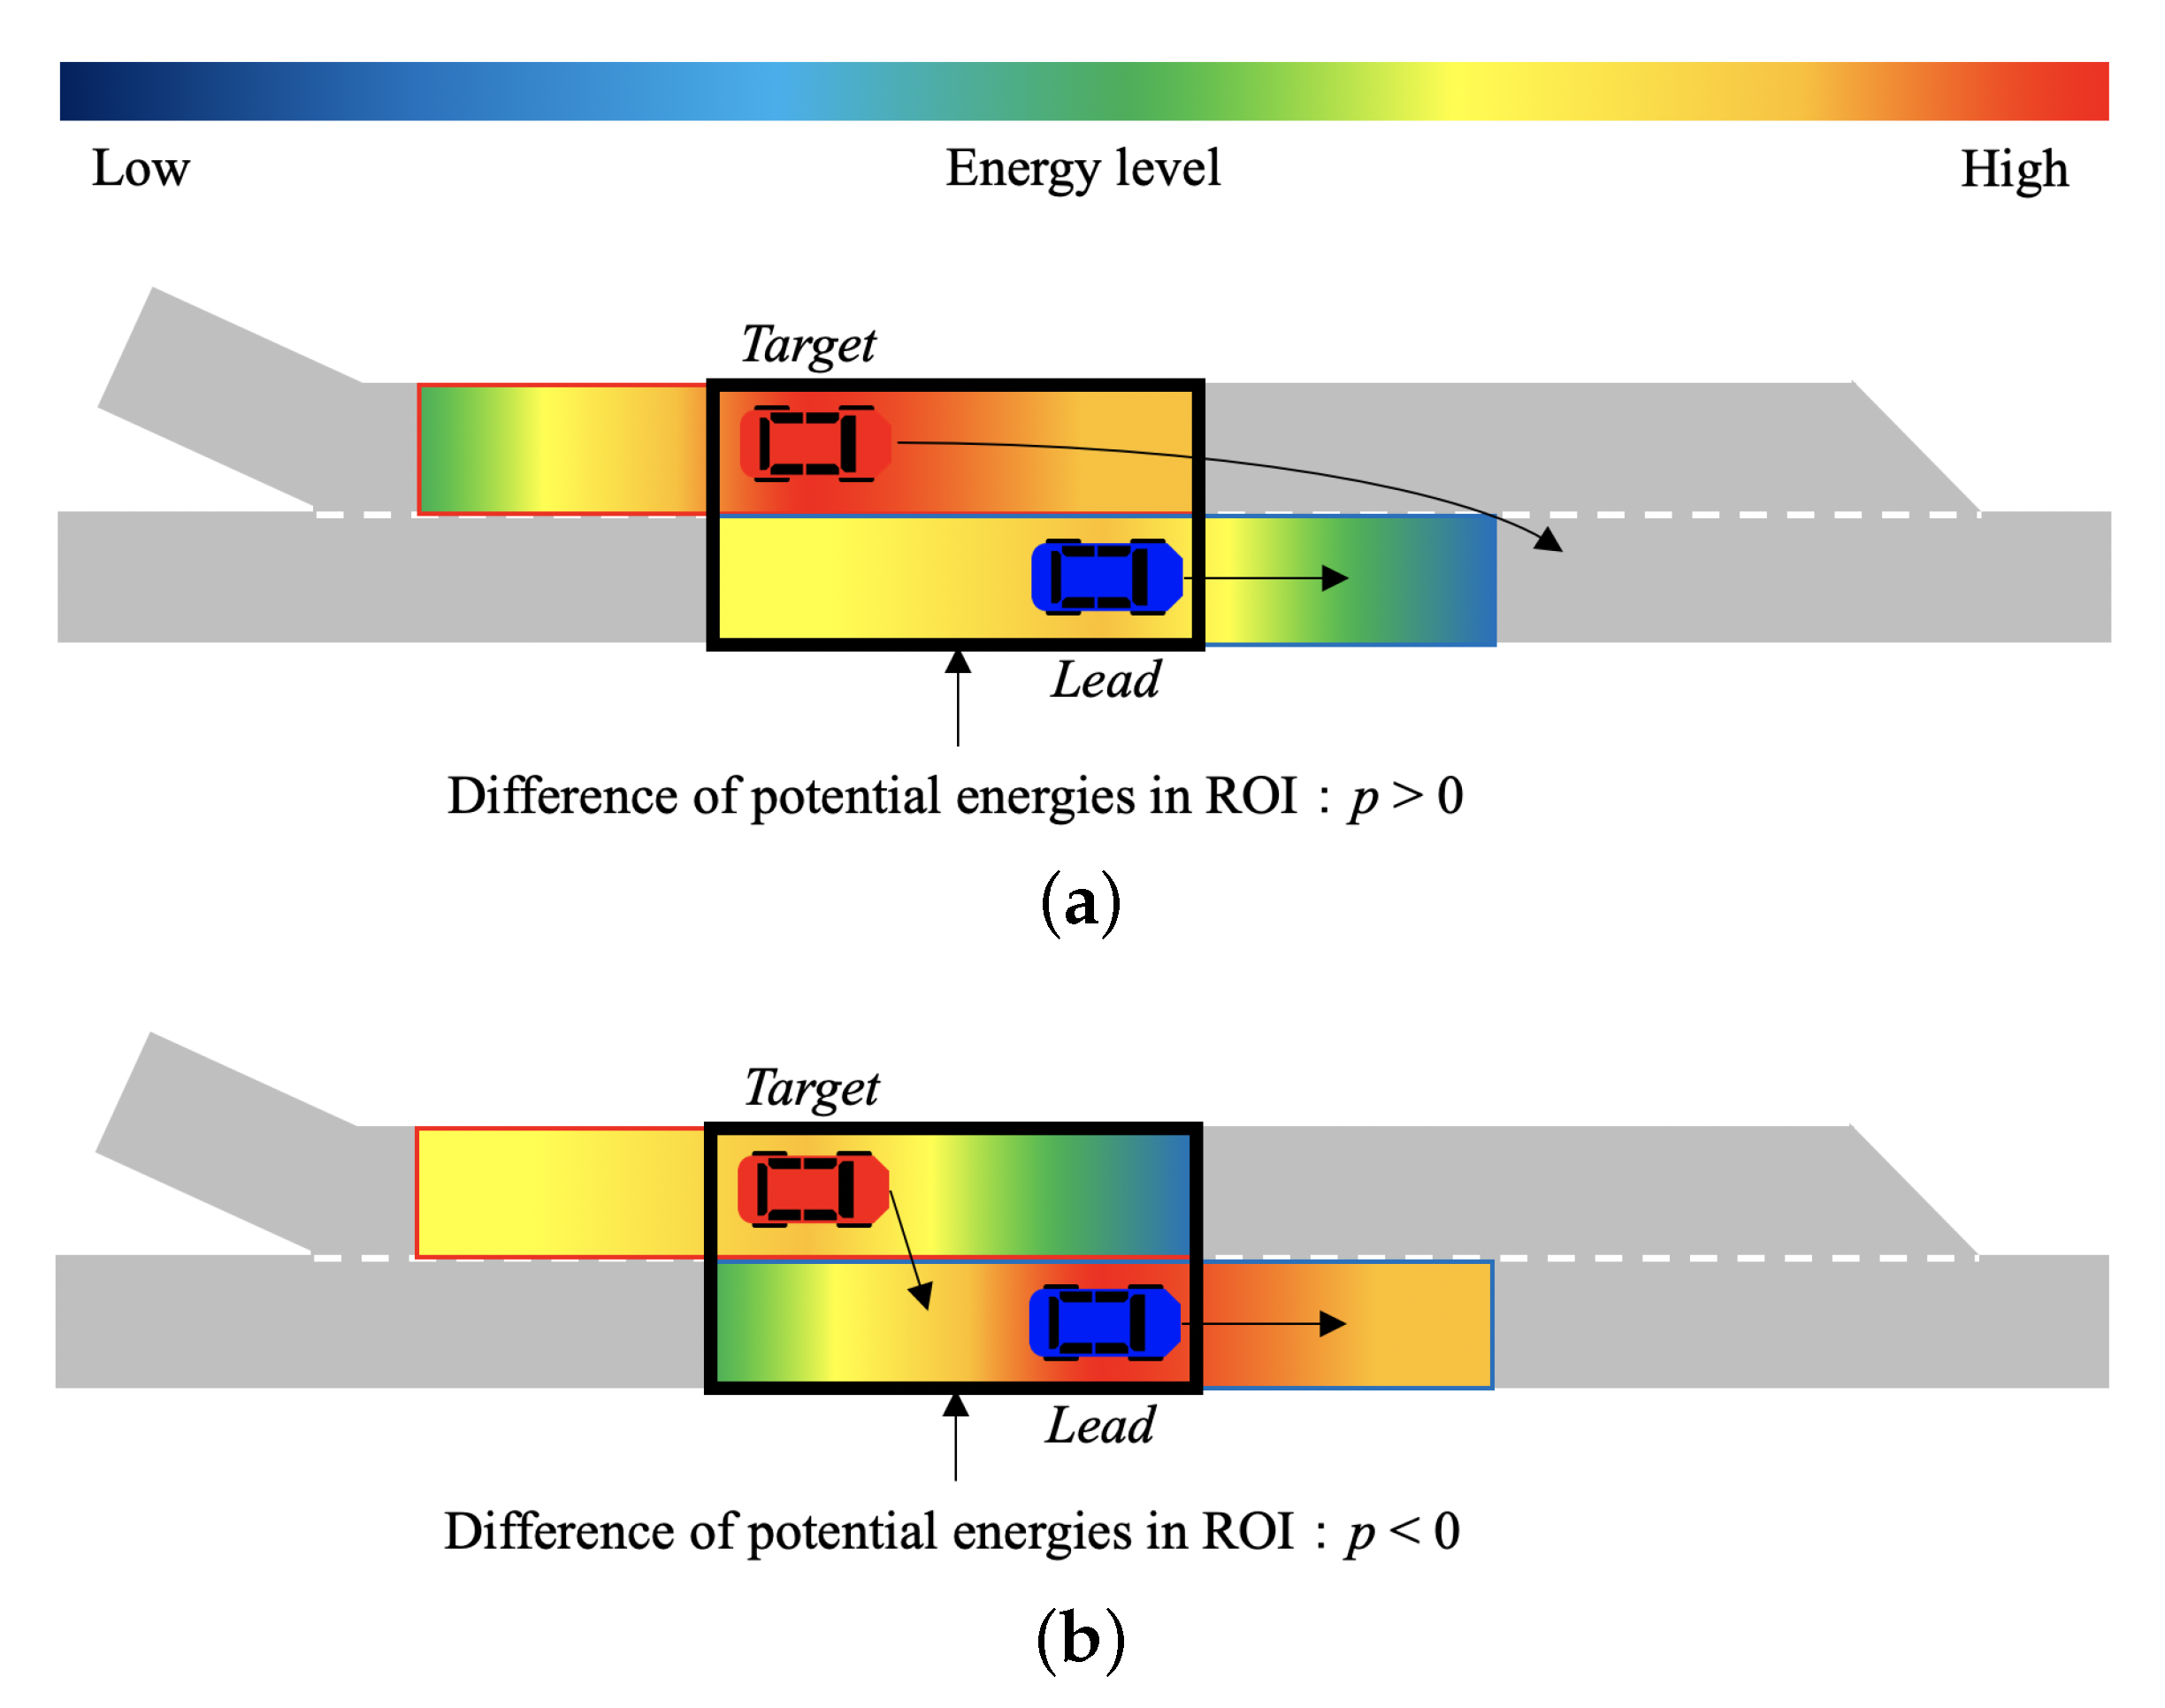
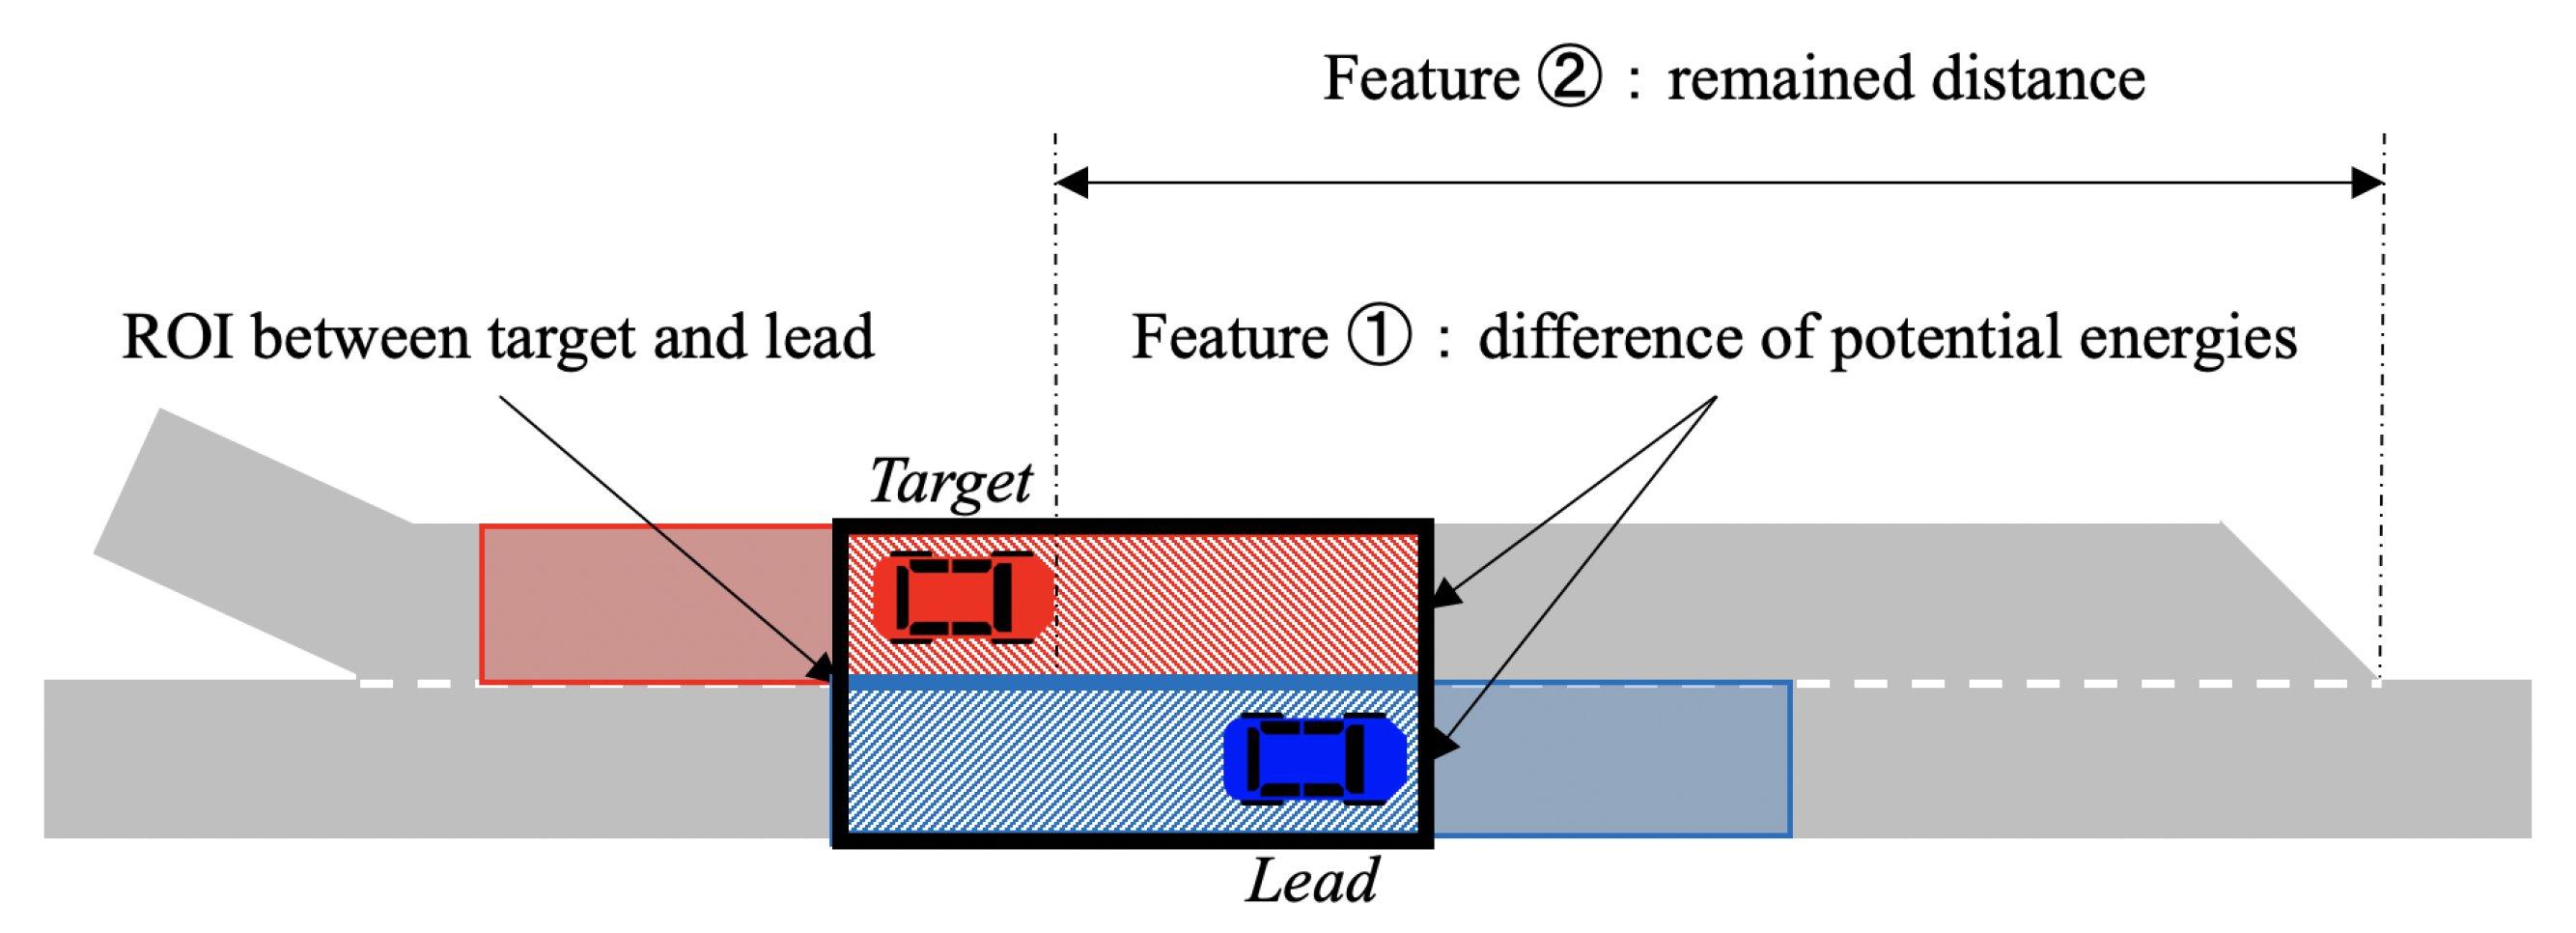
The proposed method calculates the difference of potential energies between the target and adjacent vehicles as the feature to describe the interaction between drivers. It is assumed that vehicles run along the lane. Consequently, the potential energy field generated from each vehicle has a square distribution with the same lane width, as shown in Figure 5. Especially, the proposed method focuses on the region where two potential fields are overlapped as shown in Figure 6. Since the region can be considered as the interaction between two drivers, the proposed method calculates the difference of potential energies within the region and uses the value as the feature. The feature, p, can be derived as
p = U t g t U a d j ,
where U t g t represents the sum of potential energy within the field from the target, and U a d j depicts that of adjacent vehicle. The adjacent vehicle can be the lead or rear.
When the value of p is higher than zero, it indicates that the target vehicle shows the aggressive behavior to accelerate the speed compared to that of the adjacent vehicle. Hence, the value can be considered as the target vehicle forces the adjacent vehicle to give passage. Conversely, the value of p indicates that the adjacent vehicle shows the intention to reject lane-changing when the value is lower than zero. In this case, since the target vehicle is not allowed to enter the front space of the adjacent vehicle, the driver would decrease speed and enter the behind space of the adjacent vehicle.
The proposed method uses the distance from the target to the end of the acceleration lane as shown in Figure 7. It is assumed that the target driver accelerates if there is a small distance to the end of the acceleration lane. In this case, the driver would show an aggressive tendency to cut into the mainstream lane even if there is an adjacent vehicle nearby. Therefore, the remaining distance is considered significant information, and it is defined as the second feature to describe the interaction between drivers.

3.2. SVM-Based Goal Estimation

For the goal estimation where the target vehicle cuts-in, the proposed method defines the estimation as the multiclass classification problem using SVM. The two features are input to SVM, and the goal of lane-changing is output as a class. Figure 2 represents how to define a goal as a class. There are four classes as a goal of the target vehicle. The A class represents the front space of the lead vehicle, B class is the space between the rear and lead vehicles. Moreover, the C class depicts the behind space of the rear vehicle. Lastly, D represents that the target vehicle maintains the current lane. The goal estimation is performed at each time step.
The proposed method uses the radial basis function as known that normally shows the best performance. The radial basis function is defined by
K ( x , x ) = exp ( γ | | x x | | 2 ) ,
where γ is the kernel parameter. The proposed method uses a simple approach for the multiclass extension of the binary SVM using a one-versus-one strategy. In addition, LIBSVM, which is a library for SVM, was applied to implement the classification [16].

3.3. Collision Check Based on Trajectory Prediction

To assess the collision risk during the lane-changing, the proposed method predicts the trajectories of all vehicles for a time horizon of 4.6 s. According to a previous survey, the duration of lane changes was 4.6 s, on average [17]. Then, the sinusoidal model is applied to predict the lateral movement [18]. This model generates a trajectory such as a sine curve. The acceleration in the lateral movement can be derived as follows.
a l a t ( t ) = 2 π H t l a t 2 sin 2 π t l a t t ,
where a l a t represents the lateral acceleration, t is the time from the beginning of lane-changing, H is the lane width, and t l a t is the lane-changing duration. The proposed method determines the lane-changing duration, t l a t , as 4.6 s. Through the above equation, the lateral movement of the target vehicle can be predicted. The sinusoidal model has no parameter which requires the optimization. Conversely, the lateral movement of the lead and rear is ignored, and it is assumed that the two vehicles move while maintaining the center position of the mainstream lane. The details are explained in our previous work [19]. For the longitudinal position, it is assumed that all drivers maintain the current acceleration until the trajectory prediction is over.
The collision risk is assessed based on the predicted trajectories. If the future trajectory of the target is overlapped with that of the lead or rear, the proposed method decides that a collision would occur. Then, the estimated goal is reversed as D despite the previous result was A, B, or C in the goal estimation part. This decision lies on the assumption that drivers generally maintain the current lane until the driving safety is ensured.

4. Experiments

4.1. Dataset

The proposed method was trained and evaluated using a real traffic dataset published by the Federal Highway Administration of the United States [20]. The dataset was collected on US-101 in Los Angeles. There are five mainstream lanes and one acceleration lane as shown in Figure 8. The measurement area was 2100 feet long, and it was recorded every 0.1 s for 15 min, for three times. In the dataset, the lane-changing vehicles which changed a lane from the acceleration lane to the mainstream lane were selected as the target. It is possible to download the data as a text file format. Among the information, vehicle ID, frame ID, local X, local Y, vehicle length, vehicle width, velocity, and lane identification were used. However, information about lane markings is not recorded in this dataset even though the proposed method requires that information for determining the moment in which the target vehicle crosses the lane marking. Thus, the lane identification was used to acquire the position of lane markings. The positions were collected when the lane identification was changed, and approximate curves were estimated. As a result, the moment when the target vehicle crosses the lane marking was extracted, and it was used for the goal estimation performance evaluation.
The ground truth of goal estimation was manually labeled for each time step. Among the dataset, 117 vehicles were labeled. Then, 51 vehicles were used as the training data, and 66 vehicles were used for the testing.

4.2. Results

For the goal estimation evaluation, two performance criteria are considered: accuracy and estimation speed. Accuracy represents how accurate the estimation can be performed, whereas estimation speed depicts how early the goal is anticipated. It is impractical to correctly conduct the estimation even if the goal is determined just before performing lane-changing. If the goal estimation is correctly conducted in sufficient time, drivers of the mainstream lane have sufficient reaction time with respect to the lane-changing of the target vehicle. The accuracy can be calculated by comparing the estimation result and the ground truth manually labeled. The evaluation was performed until the target vehicle crossed the center line in each case of testing data.
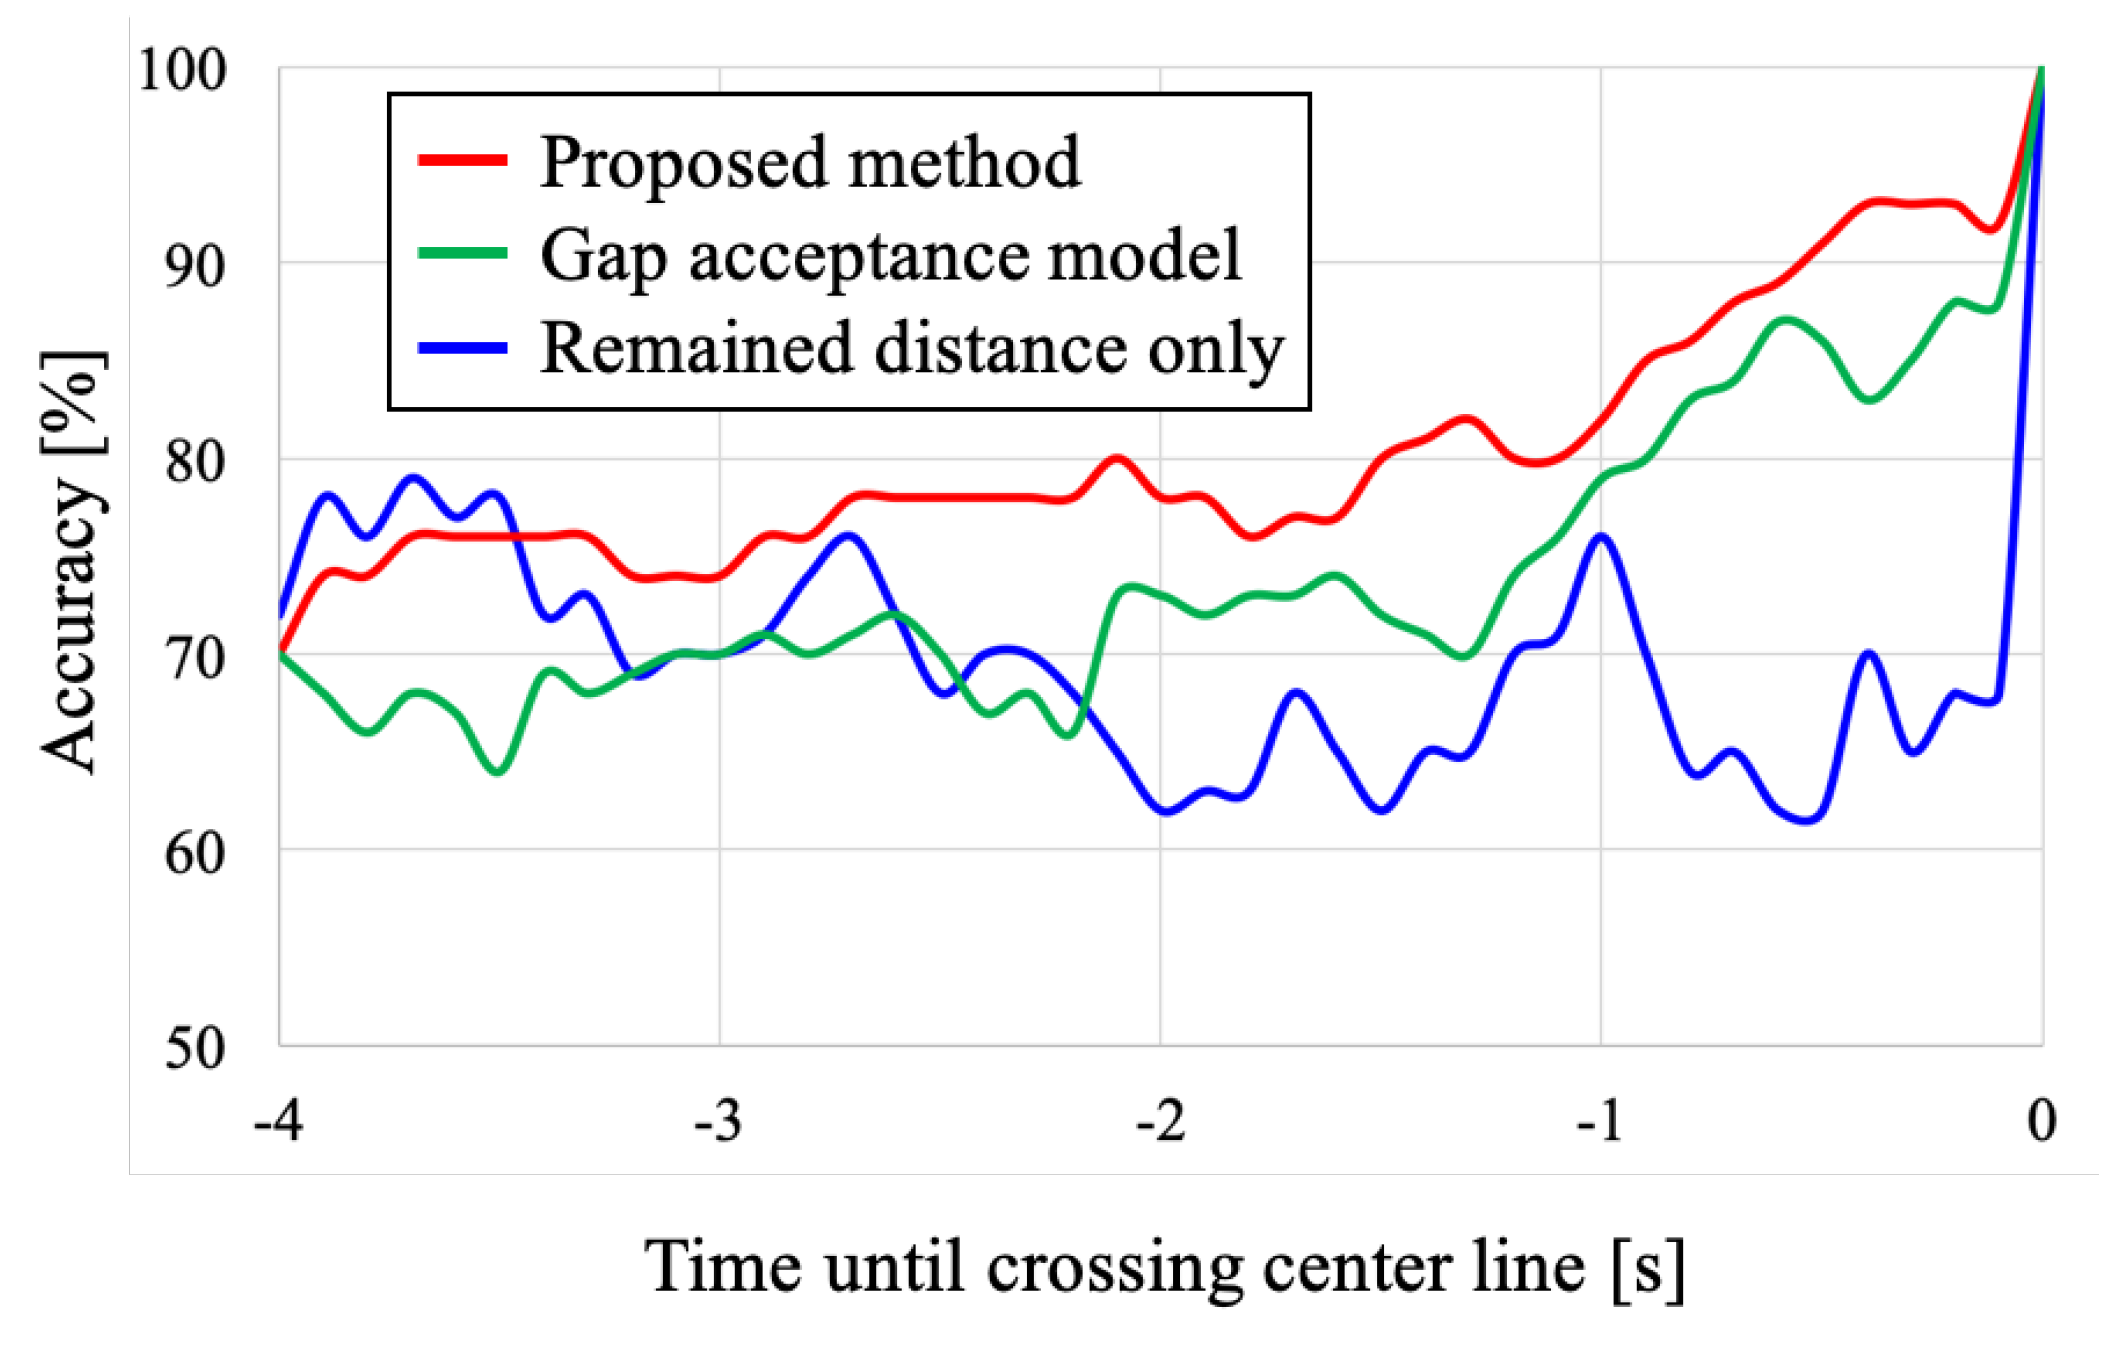
To evaluate the effectiveness of the interaction between drivers, the performance was compared to the method excluding the interaction between drivers and only using the remaining distance to the end of the acceleration lane. Figure 9 shows the comparison result. This graph shows the average accuracy 4 s before the target vehicle crosses the center line using the entire testing data. The red line indicates the accuracy with the proposed method, the blue line represents the method excluding the interaction, and the green line shows the result with the GAM. First, the proposed method achieved the outperformed performance compared to that of the GAM. As the GAM is designed to judge whether the lane-changing to enter the space between the lead and rear vehicles is possible or not, this model cannot handle the case that the target vehicle overtakes the lead vehicle or waits the rear vehicle passing through. In addition, the GAM has the limitation caused by the variety of individual driving styles [21]. Second, it can be confirmed that the proposed method outperforms the method that does not consider the interaction. The accuracy of the method excluding the interaction did not reach 80% even 1 s before. Most of the time, the accuracy was under 70% between 0 and 2 s before the crossing. Conversely, the proposed method achieved accuracy with almost 80% between 0 and 2 s before the crossing. The previous study reported that the reaction time of the driver is in the range of 0.92 and 1.94 s [22]. Hence, this range is significant when the goal estimation performance is evaluated. The proposed method outperformed the method excluding the interaction in this range, and it indicates that the approach to consider the interaction between drivers is significant for the goal estimation of the lane-changing vehicle.

5. Conclusions

In this paper, we proposed a novel method to estimate a goal of surrounding vehicles to perform a lane change at a merging section. The proposed method applied the dynamic potential field method to assess the interaction between drivers and estimated a goal of lane-changing by using the SVM. In addition, the collision risk during the lane-changing is assessed based on the trajectory prediction. It was demonstrated that our approach considering the interaction is effective to improve the performance of goal estimation. Through the evaluation using a real traffic data, the estimation accuracy was over 80% between 0 and 2 s before the target vehicle crosses the center line.
As future work, we plan to include the lateral movement of the lane-changing vehicle as a feature. Vehicles move along the shape of the road while maintaining the center position of the current lane. However, it is expected to show preliminary lateral movements with respect to the lane marking. By including this additional information, it is expected to improve the accuracy of goal estimation.

Author Contributions

Conceptualization, H.W., M.S., H.M., K.S., Y.T., A.Y., and H.A; methodology, H.W., M.S.; software, H.W., M.S.; validation, H.W., M.S.; formal analysis, H.W.; investigation, H.W.; resources, Y.T., H.M., and A.Y.; data curation, H.W.; writing—original draft preparation, H.W.; writing—review and editing, Y.T., H.M., and A.Y.; visualization, H.W.; supervision, Y.T., H.M., and A.Y.; project administration, K.S. and H.A.; funding acquisition, A.Y. and H.A. All authors have read and agreed to the published version of the manuscript.

Funding

This research received no external funding.

Conflicts of Interest

The authors declare no conflict of interest.

References

  1. U. S. Department of Transportation. Critical Reasons for Crashes Investigated in the National Motor Vehicle Crash Causation Survey; Report No. DOT HS 812 115; USDOT: Washington, DC, USA, 2015.
  2. Björklund, G.M.; Åberg, L. Driver behavior in interaction: Formal and informal traffic rules. Transp. Res. Part F Traffic Psychol. Behav. 2005, 8, 239–253. [Google Scholar] [CrossRef]
  3. Zaidel, D.M. A modeling perspective on the culture of driving. Accid. Anal. Prev. 1992, 24, 585–597. [Google Scholar] [CrossRef]
  4. Toledo, T.; Koutsopoulos, H.; Ben-Akiva, M. Modeling integrated lane-changing behavior. Transp. Res. Rec. J. Transp. Res. Board 2003, 1857, 30–38. [Google Scholar] [CrossRef] [Green Version]
  5. Nobukawa, K.; Bao, S.; LeBlanc, D.J.; Zhao, D.; Peng, H.; Pan, C.S. Gap acceptance during lane changes by large-truck drivers: An image-based analysis. IEEE Trans. Intell. Transp. Syst. 2016, 17, 772–781. [Google Scholar] [CrossRef] [PubMed]
  6. Wei, H.; Lee, J.; Li, Q.; Li, C.J. Observation-based lane-vehicle assignment hierarchy: Microscopic simulation on urban street network. Transp. Res. Rec. J. Transp. Res. Board 2000, 1710, 96–103. [Google Scholar] [CrossRef] [Green Version]
  7. Kita, H. A merging-giveway interaction model of cars in a merging section: A game theoretic analysis. Transp. Res. Part A Policy Pract. 1999, 33, 305–312. [Google Scholar] [CrossRef]
  8. Minderhoud, M.M.; Bovy, P.H.L. Extended time-to-collision measures for road traffic safety assessment. Accid. Anal. Prev. 2001, 33, 89–97. [Google Scholar] [CrossRef]
  9. Tresilian, J.R. Visually timed action: Time-out for ‘tau’? Trends Cogn. Sci. 1999, 3, 301–310. [Google Scholar] [CrossRef]
  10. Woo, H.; Ji, Y.; Kono, H.; Tamura, Y.; Kuroda, Y.; Sugano, T.; Yamamoto, Y.; Yamashita, A.; Asama, H. Dynamic potential-model-based feature for lane change prediction. In Proceedings of the 2016 IEEE International Conference on Systems, Man, and Cybernetics, Budapest, Hungary, 9–12 October 2016; pp. 838–843. [Google Scholar]
  11. Crammer, K.; Singer, Y. On the algorithmic implementation of multi-class kernel-based vector machines. Mach. Learn. Res. 2001, 2, 265–292. [Google Scholar]
  12. Jorge, V.A.M.; Maffei, R.; Franco, G.S.; Daltrozo, J.; Giambastiani, M.; Kolberg, M.; Prestes, E. Ouroboros: Using potential field in unexplored regions to close loops. In Proceedings of the 2015 IEEE International Conference on Robotics and Automation, Seattle, WA, USA, 26–30 May 2015; pp. 2125–2131. [Google Scholar]
  13. Ma, Y.; Zheng, G.; Perruquetti, W.; Qiu, Z. Motion planning for non-holonomic mobile robots using the i-pid controller and potential field. In Proceedings of the 2014 IEEE/RSJ International Conference on Intelligent Robots and Systems, Chicago, IL, USA, 14–18 September 2014; pp. 3618–3623. [Google Scholar]
  14. Chiang, H.T.; Malone, N.; Lesser, K.; Oishi, M.; Tapia, L. Path-guided artificial potential fields with stochastic reachable sets for motion planning in highly dynamic environments. In Proceedings of the 2015 IEEE International Conference on Robotics and Automation, Seattle, WA, USA, 26–30 May 2015; pp. 2347–2354. [Google Scholar]
  15. Hoshino, S.; Maki, K. Safe and efficient motion planning of multiple mobile robots based on artificial potential for human behavior and robot congestion. Adv. Robot. 2014, 29, 1095–1109. [Google Scholar] [CrossRef]
  16. Chang, C.; Lin, C. LIBSVM: A library for support vector machines. ACM Trans. Intell. Syst. Technol. 2011, 2, 27:1–27:27. Available online: http://www.csie.ntu.edu.tw/~cjlin/libsvm (accessed on 19 April 2020). [CrossRef]
  17. Toledo, T.; Zohar, D. Modeling duration of lane changes. Transp. Res. Rec. J. Transp. Res. Board 2007, 1999, 71–78. [Google Scholar] [CrossRef]
  18. Butakov, V.A.; Ioannou, P. Personalized driver/vehicle lane change models for ADAS. IEEE Trans. Veh. Technol. 2014, 64, 4422–4431. [Google Scholar] [CrossRef]
  19. Woo, H.; Madokoro, H.; Sato, K.; Tamura, Y.; Yamashita, A.; Asama, H. Advanced adaptive cruise control based on operation characteristic estimation and trajectory prediction. Appl. Sci. 2019, 9, 4875. [Google Scholar] [CrossRef] [Green Version]
  20. Federal Highway Administration, Next Generation Simulation. Available online: https://ops.fhwa.dot.gov/trafficanalysistools/ngsim.html (accessed on 17 March 2020).
  21. Woo, H.; Ji, Y.; Tamura, Y.; Kuroda, Y.; Sugano, T.; Yamamoto, Y.; Yamashita, A.; Asama, H. Lane-change detection based on individual driving style. Adv. Robot. 2019, 33, 1087–1098. [Google Scholar] [CrossRef]
  22. Green, M. How long does it take to stop?: Methodological analysis of driver perception-brake times. Transp. Hum. Factors 2000, 2, 195–216. [Google Scholar] [CrossRef]
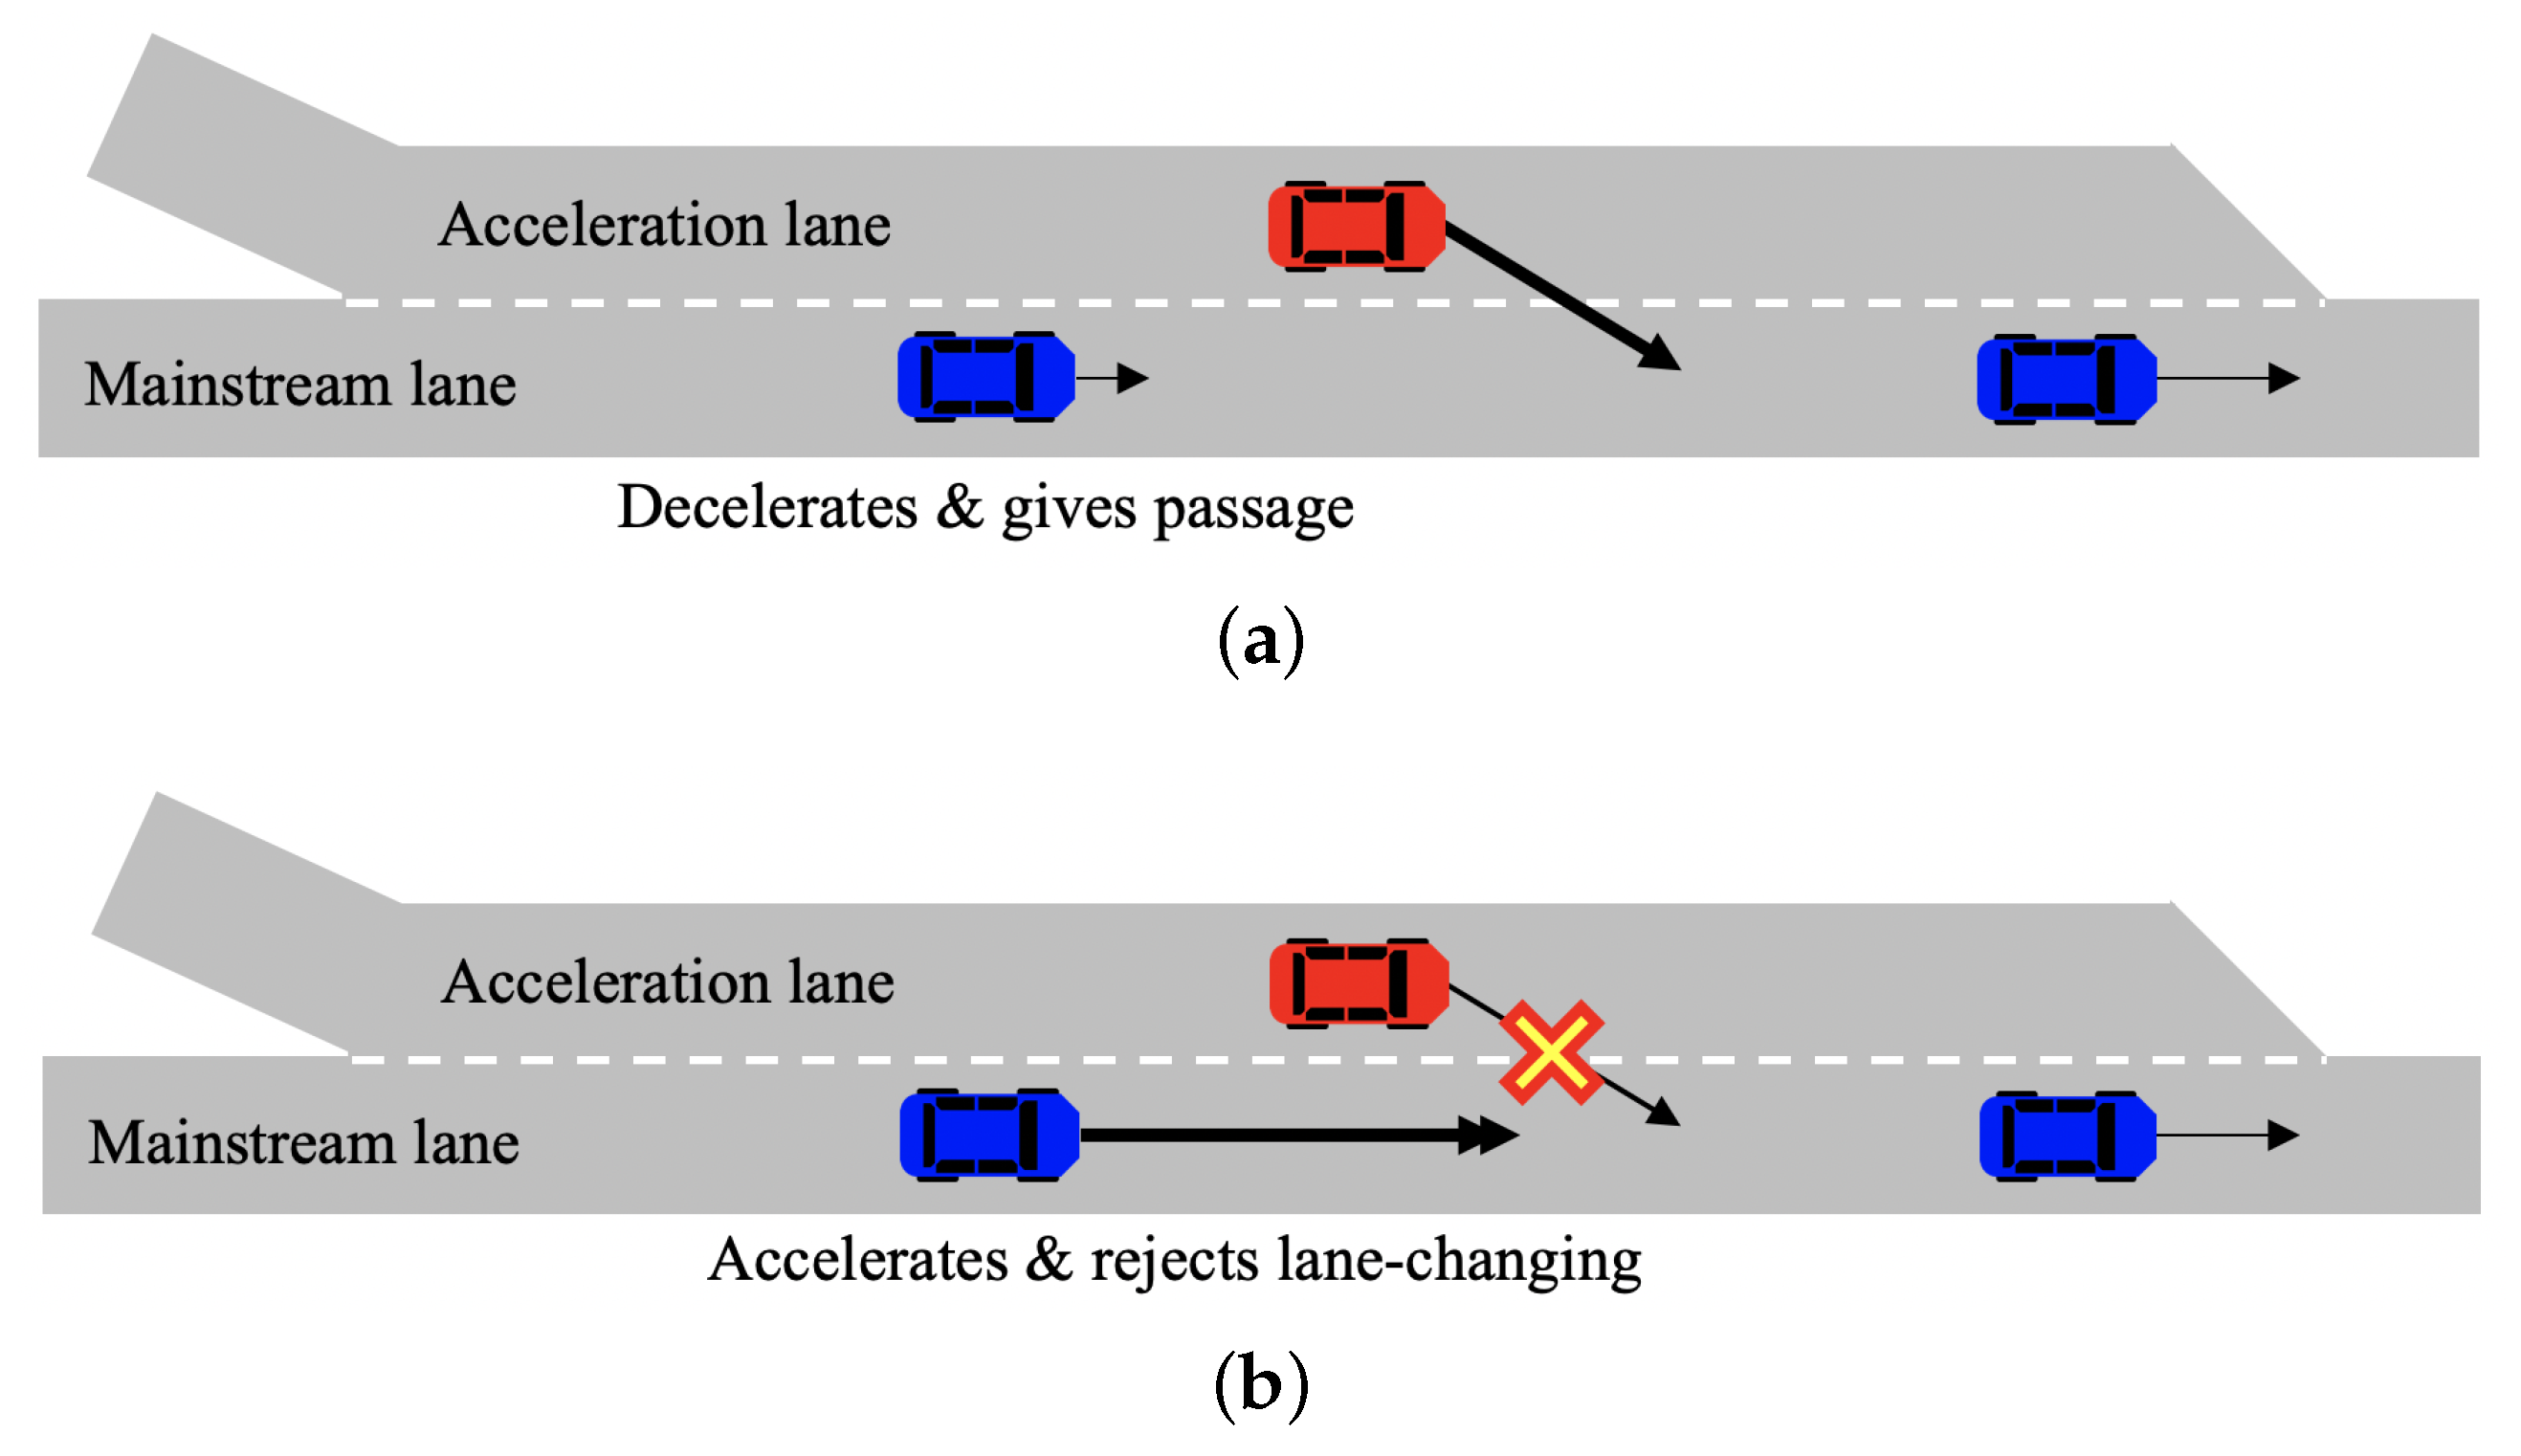
Figure 1. Examples of lane changes: (a) the vehicle on the mainstream lane is slowing down and gives passage. Conversely, (b) the vehicle accelerates and rejects the lane-changing from the acceleration lane.
Applsci 10 03289 g001
Figure 2. Problem definition: the lane-changing vehicle is defined as the target, and it is represented in red. The preceding vehicle on the mainstream lane is defined as the lead, and the following vehicle on the mainstream is defined as the rear. The two vehicles are indicated in blue. There are four classes as goals for the target vehicle. The A class indicates the front space of the lead vehicle, the B class is the space between the lead and rear vehicles. Furthermore, the C class represents the behind space of the rear vehicle. Lastly, the D class indicates that the target maintains the current lane.
Applsci 10 03289 g002
Figure 3. Schematic of the proposed method. The proposed method is comprised of three parts. As the output, the goal of lane-changing performed by the target is estimated among the four candidates: A, B, C, and D.
Applsci 10 03289 g003
Figure 4. Aspects of dynamic characteristic potential field method: the potential field changes the distribution according to the moving direction of obstacle. (a) if the obstacle is not moving, the potential field is generated as the uniform distribution. Conversely, (b) if the obstacle is moving, the potential field is drifted to the moving direction.
Applsci 10 03289 g004
Figure 5. Aspects of potential fields through the proposed method: (a) shows the potential field when the vehicle is rapidly accelerated. In contrast, (b) represents the distribution when the vehicle is rapidly decelerated. (c) shows the potential field when the vehicle is slightly accelerated. (d) represents the distribution when the vehicle is slightly decelerated.
Applsci 10 03289 g005
Figure 6. The ROI (region of interest) for the interaction between drivers: the proposed method focuses on the region where two potential fields are overlapped. (a) shows the case that the target vehicle accelerates whereas the lead vehicle decelerates for giving passage. Conversely, (b) represents the case when the target vehicle is slowing down and cuts-in to the behind space of the lead vehicle. It is confirmed that the potential fields have the different distribution within the ROI.
Applsci 10 03289 g006
Figure 7. Definition of the proposed features: the proposed method uses two features for the goal estimation. The first feature is the difference of potential energies of the two lanes within the ROI. The second feature is the remained distance of the acceleration lane.
Applsci 10 03289 g007
Figure 8. Description of measurement area: the proposed method was trained and evaluated using a real traffic dataset acquired at US-101. The measurement area was 2100 feet long, and there are five mainstream lanes. The acceleration lane is 698 feet long. On and off-ramps exist within the measurement area. If drivers on the acceleration lane fail to perform the lane-changing until the end of lane, they should go out through off-ramp.
Applsci 10 03289 g008
Figure 9. Comparison of accuracy: the red line indicates the accuracy with the proposed method, the blue line represents the method excluding the interaction, and the green line shows the result with GAM. It can be confirmed that the proposed method outperforms the method that does not consider the interaction.
Applsci 10 03289 g009