Featured Application
monitoring the effect of molten salt corrosion on materials used in solar thermal plants by means of electrochemical tests.
Abstract
Concentrated solar power (CSP) plants, in the context of thermal energy storage (TES) upgrades, need to provide a timely and effective response to the corrosion process that occurs due to the effect of high temperatures, where one of the main challenges is to control its effect, and thus the costs related to the materials used. Electrochemical impedance spectroscopy (EIS) and linear polarization resistance (LPR) were applied in this study as a corrosion monitoring technique. The electrochemical tests were carried out on the materials AISI304, AISI430, and HR-224 immersed in a mixture of ternary salt composed of 57 wt.% KNO3 + 13 wt.% NaNO3 + 30 wt.% LiNO3 at 550 °C during 100 h of exposure and subsequently compared with solar salt. The test was also carried out on the VM12 alloy in the ternary salt with lithium content at 100 and 1000 h of exposure at 550 °C. The corrosion tests show that the materials conform to a model of protective layer in which the same results were contrasted with the chemical corrosion mechanism of nitrate mixture. According to the results obtained in this research, electrochemical techniques could be an interesting option to control corrosion in CSP plants and reduce operational risks during operation.
1. Introduction
Thermal energy storage (TES) is a key tool in the different systems for generation of thermal solar energy [1], thereby providing greater flexibility, dispatchability, and reliability to the electrical system. The easy integration of TES makes concentrating solar power (CSP) dispatchable and unique among all other renewable energy-generating alternatives [2]. A typical TES system is based on sensible heat, which consists of heating a chemical compound and storing it at a high temperature, in order to pass to a common cycle of electricity generation. The viability of solar energy storage technologies will depend on the improvement of different variables, such as temperature, corrosion, materials, operating conditions, among others [1,2,3,4]. One of the great challenges for TES in the framework of the new forms of solar thermal energy generation will be linked to the increase in the temperature of the working fluid in the ranges of 550–750 °C [5]. Therefore, one of the most important lines of research in this sense is related to TES materials, and the behaviour of heat transfer fluids (HTF) for different applications of TES systems [6] at high temperature.
HTF can be found in different conditions of use and application in concentrated solar power (CSP) plants [7]. One of them is molten salts, which have excellent operating and working conditions allowing them to store energy. Solar thermal plants have been operating under a thermal storage system based on a binary mixture composed of 60 wt.% NaNO3-40 wt.% KNO3 (solar salt), which has allowed the construction of several commercial plants that can store up to 15 h of energy [8].
M. Henriquez et al. [9] have proposed an eutectic ternary nitrate salt with a composition of 30 wt.% LiNO3-13 wt.% NaNO3-57 wt.% KNO3, commonly referred to as (LiNaK)NO3, as a candidate nitrate salt. The use of (LiNaK)NO3 enables an increase in the operating temperature of commercial CSP to 550 °C [10]. On the other hand, it also shows us that the addition of lithium nitrate LiNO3 in the ternary eutectic mixture (LiNaK)NO3, could be one of the most promising solar thermal storage materials due to its excellent thermal properties where, for example, the heating capacity of this mixture is between 14% and 21% more than the commercial solar salt.
One of the main issues involved with the use of molten salts is that the corrosion produced in the materials used at high temperatures for solar applications and corrosion mitigation strategies must be applied in order to reduce the degradation of containment materials, providing a lifetime for CSP plants of 30 years or more. Goods and Bradshaw [11] showed the effect of corrosion in solar salt (KNa)NO3 according to the loss of mass for three different stainless steels, 316, 316 L, and 304, at 5000 h of exposure and 565 °C, obtaining excellent corrosion resistance results for the materials mentioned; it also means that the corrosion products identified by an optical microscope correspond to oxide layers, which are found from the outer surface to the substrate mainly composed of Fe2O3 and (FeCr)3O4. Cheng et.al [10] examined the corrosion behaviour of various steels with different amounts of chromium when exposed to LiNO3-NaNO3-KNO3 eutectic salt melt at 550 °C. In addition, this article shows the effects of increased mass on steels with different chromium contents, such as SB450 (0.2% Cr), T22 (2.25Cr-1Mo), T5 (5Cr-0.5Mo), T9 (9Cr-1Mo) and X20 (12Cr-1Mo), when exposed to a mixture of (LiNaK)NO3 ternary salt at 550 °C. These tests showed that a higher chromium content lead to the formation of (FeCr)3O4 in steels, blocking the external diffusion of iron from the steel substrate. The corrosion rates of the materials proposed in the abovementioned publication can be seen in Table 1.

Table 1.
Corrosion from descaled weight losses of steel specimens following exposure to molten salt at 550 °C for 1000 h. (Adapted from [10]).
The use of different electrochemical tests is a powerful monitoring technique that is widely used in many diverse fields, including energy. The data obtained can be used to find certain physical properties, such as diffusion coefficients, chemical reaction rates and microstructural characteristics of the electrochemical system under study. Linear polarization resistance (LPR) and electrochemical impedance spectroscopy (EIS) tests provide information on the corrosion rate, as well as information on the kinetics of the corrosion process that helps to identify the different anodic and cathodic reactions [12,13,14]. They also help to identify the different materials that are susceptible to corrosion under specific conditions.
The electrochemical technique linear polarization resistance (LPR) is a method in which the electrochemical response of a corroding metal is investigated near its open circuit or corrosive potential. Typically, this involves polarization of the material of interest below the corrosion potential and a slow increase (or scan) of the potential to the comparable potential above the corrosion potential. Within this potential region, it is assumed that the relationship between potential and log current is linear, thereby allowing the calculation of the corrosion rate [15]. Electrochemical impedance spectroscopy (EIS) is a method that uses a small voltage signal between different amplitudes over an equilibrium or other known potential, which causes the induced current to be measured while the voltage is modulated in different frequency ranges. In contrast, the electrochemical impedance spectroscopy (EIS) test is represented by the Nyquist and Bode graphs, where the former represents the system impedance in real and imaginary coordinates and the latter describes the modulus and phase angle of the impedance. The spectrum analysis in the Nyquist graph requires fitting using equivalent electrical circuit models where this model shows different aspects of the corrosion process [16,17,18].
The corrosion of molten salts can take different forms, such as, for example, uniform corrosion, localized corrosion, and internal corrosion. Considering the chemical stability of different metals in molten salts, the metals can be divided into two groups, active metals and non-active metals. The active metals can undergo corrosion by the molten salts, forming a layer that can be porous or protective [19,20,21,22].
Based on the considerations above, the following models can be used to describe the general situation of metals in molten salt systems, which are shown in Figure 1.
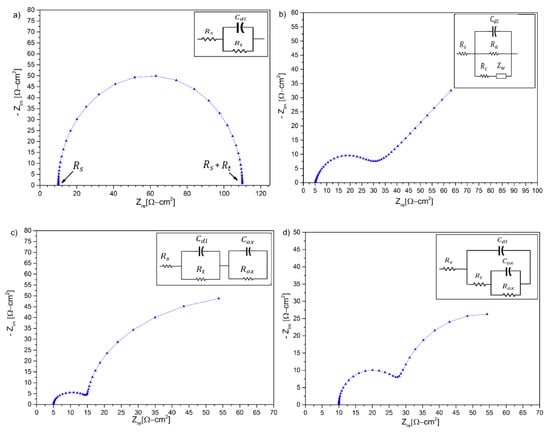
Figure 1.
Nyquist plots and the equivalent circuits representing the corrosion of metals in molten salts. (a) Representation of a non-active metal; (b) active metals forming a porous scale; (c) active metals forming a protective scale; (d) active metals suffering from localized corrosion. (Adapted from [21]).
To complement the corrosion mechanisms through electrochemical testing, it is necessary to understand the fundamental chemical mechanisms that lead to corrosion, and thus contrast them with important variables that have a significant effect on corrosion. According to Bell et al. [23], they conclude that the corrosion mechanisms in molten salts are complex and depend on many variables, such as the species of anion and salt cation, temperature gradient, concentration of impurities, inert gas, pressure of the atmosphere, alloying elements, composition and microstructure, in a certain way each of them greatly influence the mechanism and rates of corrosion. These authors also mention that the prior formation of consistent oxide layers can help improve corrosion rates. They propose an acid/base model, similar to that used for an aqueous corrosion system, where the main difference between a molten salt system and an aqueous system is the ion species. In order to understand the main aspects of the model proposed by [23] the acid/base model for oxygenated salts is presented in a general way. Corrosion products dissolved in the thermal storage system need to be known and identified since they may affect the thermophysical properties of the molten salt. Moreover, these corrosion products can cause degradation of the storage system material, and therefore it is necessary to perform characterization of novel materials through electrochemical testing and thus understand the mechanisms of corrosion.
In this study, corrosion behaviour was monitored by electrochemical impedance spectroscopy (EIS) and linear polarization resistance (LPR) tests on different materials, such as AISI 304 and AISI 430 stainless steels, nickel-based alloy HR-224, and a new VM12 steel with 12% chromium content. The corrosion resistance in solar salt (60 wt.% NaNO3-40 wt.% KNO3) as in the ternary mixture (30 wt.% LiNO3-13 wt.% NaNO3-57 wt.% KNO3) at 550 °C were compared at different times. Also, the same tests were performed on the new VM12 material with the ternary mixture with two different exposure times. EIS tests require appropriate models that allow adjusting the impedance spectrum in such a way that they can be compared with the different corrosion models existing in the literature on molten salts.
2. Corrosion Mechanism for Nitrates Based on Chemical Models
The corrosion mechanism has strong dependence on the mixture of salt that used in the system. In this case the solar salts are composed of a mixture of oxyanionic salts, such as LiNO3, NaNO3 and KNO3. The mixture of oxyanionic salts dissociates into the electrolyte as ionic species by heating and melting, according to the follow expression:
The oxyanionic salts in aqueous phase will be composed of cations ions as Li+, Na+, K+, and a common anion . On the other hand, the can be dissociated according to follow expression:
The dissociated species from ion are and , known as Nitronium ion and Oxide ion respectively. The diffusion of ions from bulk electrolyte to metal oxide ( forming species of type according Figure 2.
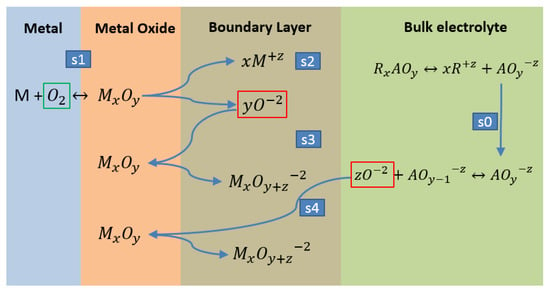
Figure 2.
General scheme of corrosion mechanisms on surface metal.
Model for Oxyanionic Salts
According to Figure 2, we can indicate that nitrate salts can dissociate and form ion species (ions of the form ) by the effect of temperature increase. Then, the oxyanionic salt () is formed, as well as , representing the alkaline metal in cation species. This step of the process will be represented by step 0 (s0). Stage 1 (s1) is considered to be the initial reaction between atmospheric oxygen and the transition metals of the steel, generating the first layer of oxide of the type. This reaction is supposed to be slow and depends on the atmospheric conditions of the site. Subsequently, it is necessary to concatenate the different ion species obtained from other reactions to give a clear idea of the effect of the oxide ion that is the cause of corrosion. Stage 2 (s2) is the most important, since the metal oxides formed in stage 1 (s1) are dissociated and generate the first evidence of oxide ion , which in contact with the metal oxides compose the passivation layer. This reaction is likely to be fast.
The abundant oxide ion , found in the ion cloud formed by the dissolution of the passive layer, reacts again with the oxides of the passive layer, forming a species of the form . This stage (s3) is also supposed to be fast, like (s2). Finally, stage 4 (s4) is the slowest and is controlled by the diffusion of the oxide ion , formed by the dissociation of the oxyanionic salts () in the electrolyte. The mass transfer is affected by the ion cloud in contact with the metal oxide.
Figure 3, Figure 4 and Figure 5 show the proposed corrosion mechanisms for Fe, Cr, and Ni metallic elements during the corrosion process, and are related to Figure 2. Iron metal reacts with O2 generating oxidized products on the metal surface, shown in Equations (3), (5), and (6), generating the oxide metal layer. The dissolution of the metal oxide can occur via the acid and basic pathways. When the ion activity is low in the melt, the metal oxide will dissociate, resulting in oxides ions and potentially soluble metal ions (Equation (4)). Meanwhile, increase of ions in the boundary layer create metal oxide anions soluble in the salt generating oxide ion in contact with the metal surface, thus, these processes could be identified by a change in electrochemical impedance as a function of time.
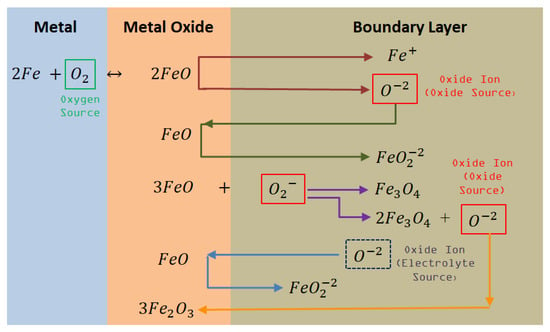
Figure 3.
Corrosion mechanisms of Fe in contact with Oxyanionic Salts.
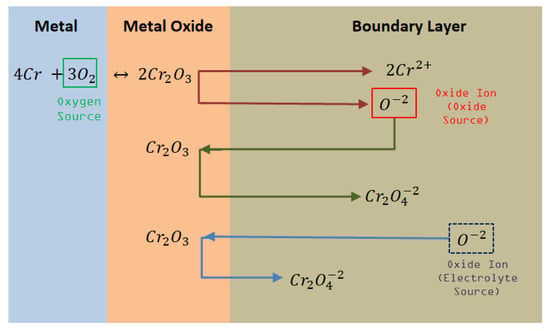
Figure 4.
Corrosion mechanisms of Cr in contact with Oxyanionic Salts.
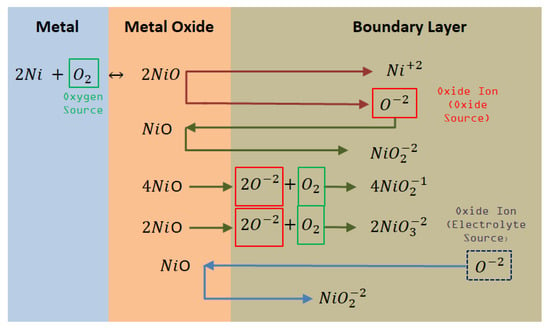
Figure 5.
Corrosion mechanisms of Ni in contact with Oxyanionic Salts.
The species generated by the reaction with ions due to the dissociation ions in the bulk electrolyte are showed in the Equations (4), (9), and (11) respectively.
Some additional reactions related with nickel ions were identified:
According to the reaction mechanism of nickel in Figure 5, NiO can be dissociated in acid/basic medium through the activity of the oxide ion , resulting in potentially soluble nickel oxide ions. Therefore, the formation of different nickel anions is clearly seen as , y .
These reactions can help us to understand the chemistry involved in the molten salt corrosion process, as well as to identify the proper equivalent circuit to fit the impedance signals obtained in this research.
3. Experimental Procedure
3.1. Preparation of Salt Mixture
For this research, KNO3 (99.5% purity) and NaNO3 (99.5% purity), both acquired from the Merck company (Merck KGaA, Darmstadt, Germany), and LiNO3 (99% purity), acquired from the Todini Company (Todini & Co SpA, Milano, Italy), formed our molten salt base for both the lithium-containing ternary mixture and the solar salt. The ratio of both mixtures had a composition in weight of 57 wt.% KNO3, 30 wt.% LiNO3 and 13 wt.% NaNO3 for the ternary mixture with lithium content and 60 wt.% NaNO3 and 40 wt.% KNO3 for the case of the solar salt. Both salt mixtures were first introduced into alumina crucibles in a furnace at different stepwise heating temperatures from 100, 200, 350, and 550 °C, reducing the impurity content of the salt mixtures [24,25]. Once the mixture of salts reached the temperature of 550 °C, this temperature was maintained for a whole day, so that they could be continuously homogenised and stabilised for the corresponding tests.
3.2. Preparation of Samples for Gravimetric and Electrochemical Impedance Spectroscopy Tests
The alloys used in this research were stainless steel AISI 304 and AISI 430, nickel-based alloy HR-224 and VM12 steel, with dimensions of 2 × 20 × 10 mm, 2 × 20 × 10 mm, 2 × 12 × 10 mm and 3 × 12 × 5 mm, respectively. The element composition of these materials can be found in Table 2. The samples were first placed in ethyl alcohol and then dried by a flow of hot air; with the samples completely clean they were weighed on a balance ME204T (0.1 mg precision) and the reference value of the initial weight was obtained.

Table 2.
Chemical composition of 304, 430 Stainless Steel, HR-224 alloy nickel, and ferritic steel VM12.
EIS samples were welded by means of the Tungsten inert gas (TIG) technique, with a pulse current of 40 A, a base current of 15 A and a frequency of 3 Hz. The shielding gas in the welding was Argon (Ar) with a flow rate of 12 L/min. The samples were welded with a Fe-Cr-Al alloy wire of 0.95 mm of diameter. The sample of the working electrode (WE) and the counter electrode (CE) were placed in an alumina tube of 5 mm diameter and sealed with high temperature resistant cement to avoid interference signals from this part. The pseudo-reference electrode (RE) was self-circuited with the counter electrode (CE) for electrochemical tests with the potensiostat AUTOLAB-PGSTAT302N (Metrohm Autolab B.V., Utrecht, The Netherlands). Figure 6 shows the scheme of the electrochemical test.
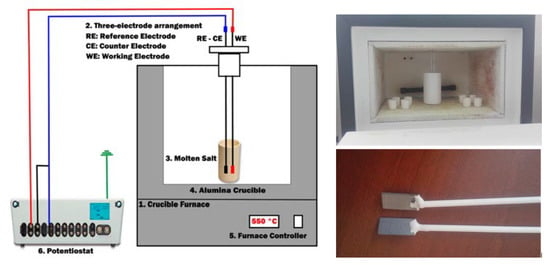
Figure 6.
Schematic of the electrochemical system. 1: Crucible furnace; 2: three-electrode arrangement (Re: reference electrode, CE: counter electrode, WE: working electrode or sample); 3: molten salt; 4: alumina crucible; 5: furnace controller; 6: potensiostat (left); predisposition of the high temperature furnace and welded and cemented electrodes in alumina tubes (right).
4. Results and Discussion
4.1. Electrochemical Impedance Spectroscopy Measurements
4.1.1. Solar Salt (KNa)NO3 Testing
In a first instance, the different Nyquist diagrams are shown for solar salt (KNa)NO3 in Figure 7, Figure 8 and Figure 9 for the stainless steels AISI 304 and AISI 430 as well as for the nickel-based alloy HR-224, respectively. The measuring times were carried out after 2, 4, 6, 8, 24, 48, 72, and 96 h of exposure. The impedance spectra of the corrosion monitoring of AISI 304 and AISI 430 stainless steel and nickel alloy HR-224 shows a similar behavior after 24 h of measurement after the initial stages of the test, due to a typical behavior of the diffusion-controlled reactions of the ions at the metal/molten interface.
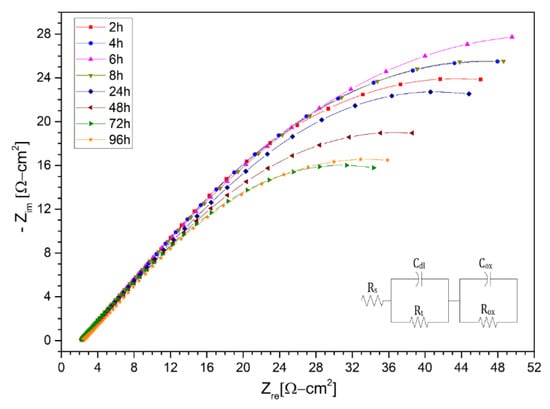
Figure 7.
Nysquist diagram of stainless steel 304 layer in (KNa)NO3 (solar salt) at 2 h, 4 h, 6 h, 8 h, 24 h, 48 h, 72 h and 96 h at 550 °C.
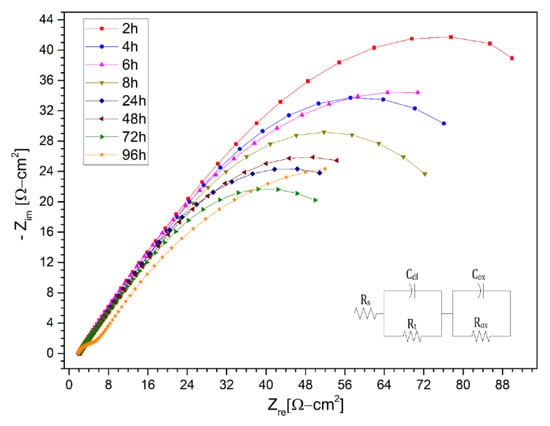
Figure 8.
Nysquist diagram of stainless steel 430 layer in (KNa)NO3 (solar salt) at 2 h, 4 h, 6 h, 8 h, 24 h, 48 h, 72 h and 96 h at 550 °C.
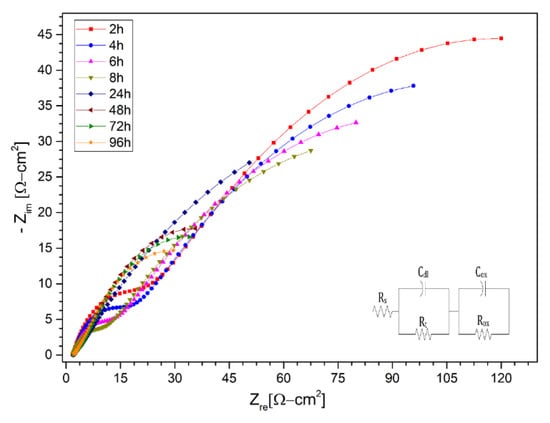
Figure 9.
Nysquist diagram of Nickel alloy HR224 layer in (KNa)NO3 (solar salt) at 2 h, 4 h, 6 h, 8 h, 24 h, 48 h, 72 h and 96 h at 550 °C.
The equivalent circuit for all the figures, was composed essentially of two capacitive-resistive circuits connected in parallel, in addition to both being connected in series to a resistor. According to the different molten salt corrosion models, the equivalent circuit corresponds to the formation of a protective layer [21].
According to the graphs of the impedance spectra for solar salt of the stainless steels AISI 304 and AISI 430 and the nickel alloy HR-224, they show that the corrosion process is controlled by the transfer of ions in the protective layer, which is consistent within the theoretical and chemical mechanism during the first hours of contact between the metal and the molten salt; the most significant hours of the corrosion process are found during the first hours of initiation of the process. The results obtained in terms of the equivalent electrical circuits obtained from the spectra shown in solar salt are represented in the Table 3, Table 4 and Table 5 in terms of the transfer resistance Rt. This transfer resistance is related by the simplified Butler-Volmer equation (Equation (12)), and we can observe that this resistance has an inverse relationship to the current density exchanged.
where, is the gas constant, is temperature, is the number of electrons involved, is the Faraday constant and is the exchange current density. In the case of AISI 304 and AISI 430 stainless steels, a sustained trend of the low frequency semi-circle was observed in most measurement periods, but for AISI 430 steel a small high frequency semi-circle was observed at 96 h of immersion, which could mean a load transfer reaction at the layer/melt interface. For the HR-224 alloy showed a formation of the semicircle of high frequency values due to its high nickel content. Thus, the electrochemical impedance spectra of the materials evaluated in the first hours show a controlled ion diffusion reaction, mainly by the trend of the low frequency curve related to the capacitance of the metal oxide. The adjustment of the data obtained was correlated with the different equivalent circuit models for molten salts, which allowed us to find a suitable and concise model for the case study. The fit corresponds perfectly to a protective layer model. This can be explained by the sufficiently high chemical stability in molten salt systems, which for our case represents solar salt.

Table 3.
Fitting results of the impedance spectra of stainless steel 304 during corrosion in the presence of (KNa)NO3 (solar salt) at 550 °C.

Table 4.
Fitting results of the impedance spectra of stainless steel 430 during corrosion in the presence of (KNa)NO3 (solar salt) at 550 °C.

Table 5.
Fitting results of the impedance spectra of Nickel alloy HR224 during corrosion in the presence of (KNa)NO3 (solar salt) at 550 °C.
4.1.2. Mixture with Lithium Content (LiNaK)NO3 Testing
Subsequently, the Nyquist diagrams for the ternary salt with lithium content (LiNaK)NO3 are shown in Figure 10, Figure 11 and Figure 12 for the AISI 304 and AISI 430 stainless steels, as well as for the nickel-based alloy HR-224, respectively. The measurements were made after 2, 4, 6, 8, 24, 48, 72, and 96 h of exposure. The impedance spectra of the corrosion monitoring of AISI 304 stainless steel differs from both AISI 430 stainless steel and nickel-based alloy HR-224. AISI 304 stainless steel shows similar behavior up to 48 h of measurement in contrast to 72 and 96 h, where a small increase of the high frequency semi-circle can be seen due to the load transfer reaction at the metal/molten interface. In the cases of stainless steel AISI 430 and the nickel-based alloy HR-224, they show a consistent formation in their high and low frequency semi-circles, indicating the charge transfer reaction and the corrosion resistance of the protective layer respectively. The difference in the behavior of the impedance spectra in both the solar salt and the ternary mixture may be due to the LiNO3 content; as it is more basic than KNO3 and NaNO3, it has a high activity in the ternary mixture (KLiNa)NO3. According to Cheng et al. [10], the formation of various compound oxides is evidenced by the effect of lithium diffusion in the metal, which generates a series of surface layers apart from the protective layer at the metal/molten interface. Thus, the impedance spectra of these materials show a similar fit to a non-active metal model of the protective layer. This can be explained by the sufficiently high chemical stability in the molten salt systems, in the case of HR-224 and AISI430 materials. The results obtained in terms of the equivalent electrical circuits obtained from the spectra shown in (LiNaK)NO3, are represented in the Table 6, Table 7 and Table 8.
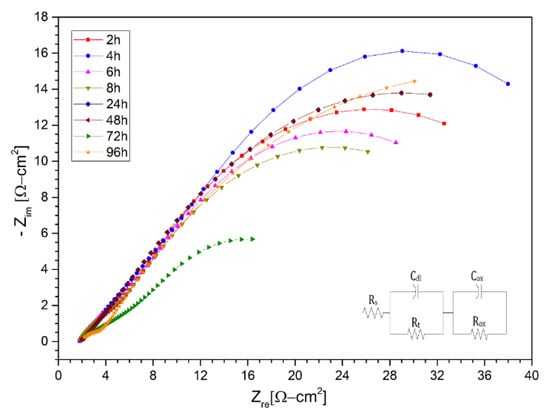
Figure 10.
Nysquist diagram of stainless steel 304 layer in (LiNaK)NO3 (ternary salt with lithium content). at 2 h, 4 h, 6 h, 8 h, 24 h, 48 h, 72 h and 96 h at 550 °C.
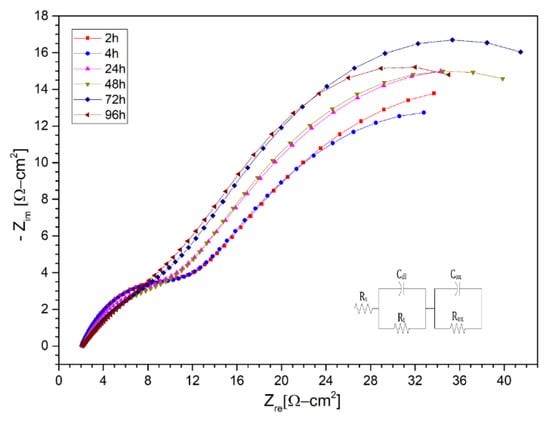
Figure 11.
Nysquist diagram of stainless steel 430 layer in (LiNaK)NO3 (ternary salt with lithium content) at 2 h, 4 h, 24 h, 48 h, 72 h, 96 h at 550 °C.
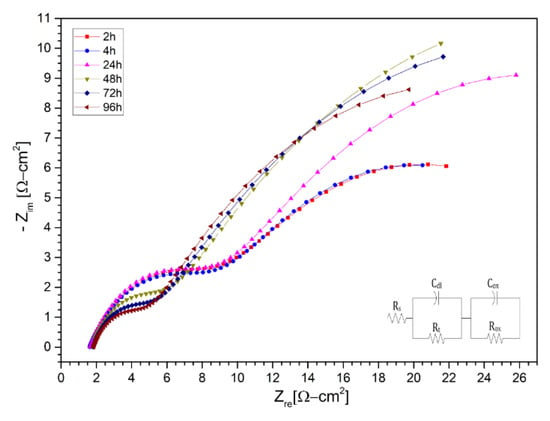
Figure 12.
Nysquist diagram of Nickel alloy HR224 layer in (LiNaK)NO3 (ternary salt with lithium content) at 2 h, 4 h, 24 h, 48 h, 72 h, and 96 h at 550 °C.

Table 6.
Fitting results of the impedance spectra of stainless steel AISI 304 during corrosion in the presence of LiNaKNO3 (ternary salt with lithium content) at 550 °C.

Table 7.
Fitting results of the impedance spectra of stainless steel 430 during corrosion in the presence of (LiNaK)NO3 (ternary salt with lithium content) at 550 °C.

Table 8.
Fitting results of the impedance spectra of Nickel alloy HR224 during corrosion in the presence of (LiNaK)NO3 (ternary salt with lithium content) at 550 °C.
The relationship between the corrosion mechanisms from both chemical and electrochemical models suggests that the general situation of how ions interact within the metal-melted system is primarily governed by oxidation, which in this case is the oxide ion . Therefore, the resistance (impedance) of the system is directly related to the different layers that are formed in the time of exposure of the samples. Therefore, the charge transfer in the system between the metals and the electrolyte makes the corrosion process slower/fast, leading to the change in impedance. For this reason, the equivalent circuit for the formation of the protective layer is shown in Figure 13, and it should be conceptualized based on the reaction mechanisms already represented in this article.
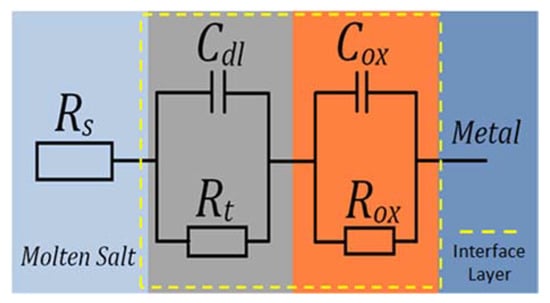
Figure 13.
Equivalent circuit representing the corrosion of metals forming a protective scale in molten salts.
For the protective layer model shown, ion transport in the protective layer can limit the speed of corrosion. The elements that compose the equivalent circuit of the protective layer are represented by the following elements: Rs is the molten salt resistance; Cdl is the double layer capacitance at the metal/molten interface; and Rt is the electrochemical charge transfer resistance. Often the behaviour of the capacitors in EIS tests are not the most ideal, so a constant phase element acts instead for experimental data settings. Rox and Cox, both represent the resistance and the capacitance of the transfer of the ions of the metal oxide layer. Therefore, this equivalent protective layer circuit is expressed in Equation (13).
where, and represent the dispersion coefficient of the first and second capacitance of the circuit, respectively. Therefore, and are the elements of the impedance caused by the dispersion effect. Since corrosion is controlled by the transport of species in the protective layer, the radius of the second capacitance circuit must be greater than that of the first cycle. In addition, in this case, the corrosion resistance of the metals in the molten salts can be represented by the parameter [21].
The charge transfer resistance values for the ternary mixture with Li content obtained for the materials AISI 304 and AISI 430 and the alloy HR-224 were higher with respect to the solar salt of the same materials, and therefore the corrosion rate in the lithium content salt is lower compared to the values obtained in the solar salt.
With the background of the results obtained in the stainless steels AISI 304 and AISI 430, and the nickel-based alloy HR-224, in addition to the improvement in the corrosion process by the ternary mixture with lithium content, we proceeded to evaluate a new ferritic steel (VM12), a promising material to be use as structural material in CSP plants, in the same way. This is due to the fact that the corrosion process of the different thermal plants, the use of nickel-based alloys such as HR-224 will increase the final cost of materials and it is necessary to test new materials. In this case, the evolution of the need for new ferritic steels that possess excellent properties, such as resistance to corrosion, has led to the development of a high-temperature material called VM12, which has a chrome content of 12% and is of industrial interest in different high-temperature applications (>550 °C) [26,27,28]. Corrosion resistance and electrochemical analysis of ferritic steel VM12 has not been reported in different investigations in molten salts, specifically in the ternary mixture with lithium content proposed in this article. According to Fähsing et al. [29], the potential of the material VM12 as belonging to the family of ferritic steels compared to austenitic steels or nickel-based alloys reflects a significant price variation, and seems to have a possible use in future solar power concentration plants. For this reason, two tests were carried out at different times, as shown in Figure 14 and Figure 15, at 100 and 1000 h respectively of immersion in the ternary mixture. The tests at 100 and 1000 h presented behavior in the protective layer equivalent model circuit; like the previous materials, they are represented in Table 9 and Table 10. Ferritic steel VM12 showed excellent properties with respect to corrosion in contact with the lithium nitrate ternary mixture.
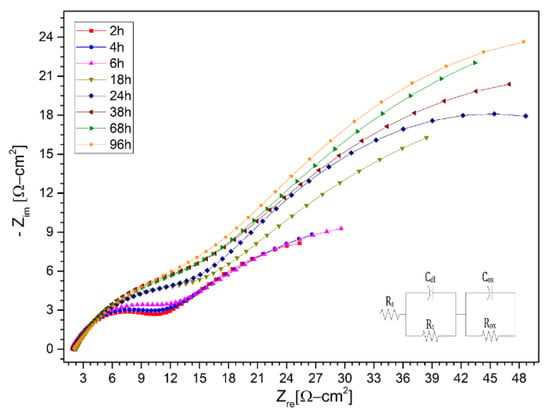
Figure 14.
Nysquist diagram of VM12 layer in (LiNaK)NO3 (ternary salt with lithium content) of 100 h at 2 h, 4 h, 6 h, 18 h, 24 h, 38 h, 68 h, and 96 h at 550 °C.
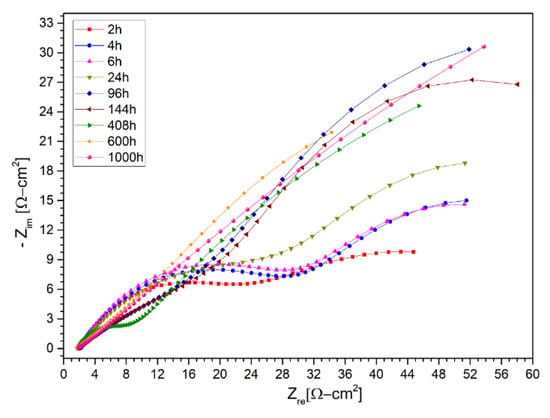
Figure 15.
Nysquist diagram of VM12 layer in LiNaKNO3 (ternary salt with lithium content) of 1000 h at 2 h, 4 h, 6 h, 24 h, 96 h, 144 h, 408 h, 600 h, and 1000 h at 550 °C.

Table 9.
Fitting results of the impedance spectra of VM12 during corrosion in the presence of (LiNaK)NO3 (ternary salt with lithium content) at 550 °C.

Table 10.
Fitting results of the impedance spectra of VM12 during corrosion in the presence of (LiNaK)NO3 (ternary salt with lithium content) at 550 °C.
Analyzing the different molten salt corrosion models using electrochemical impedance spectroscopy, specifically the protective layer model, it was easier to understand how the different metal/molten-salt system interfaces interact in the first hours of contact due to the high temperature corrosion process. At the same time, concepts of interaction between the molten salt and the layers of the metal interfaces related to ion diffusion and charge transfer processes through the different electrical components that are used by this test (EIS) were explained. In this way, the oxides that are formed in the different layers of the metal are strongly linked to the evolution of the high and low frequency impedance spectra of the tests on the proposed materials. The lack of a conceptual methodology for the corrosion process in molten salts to find different parameters, such as the thickness of the boundary layer, means that the EIS method, together with the corrosion mechanisms, allow us to understand the importance of its combination to use them more adequately in industrial applications.
Complementing this, Cheng et al. [10] shows us objectively that the deposition of the different layers formed in the study steels due to the ion diffusion processes, fundamentally in the first hours of contact with the metal, contributes to the need to monitor these stages and analyze the evolution of the corrosion process in molten salts. The oxidation caused by the effects of the high temperature in different materials of solar thermal storage generates the formation of different compounds, many of which can be inferred of certain form on the basis of the mechanisms of corrosion in nitrates; we can find more stable compounds along the process, as well as, the effect of lithium mainly (as a result of LiNO3) and the other alkaline ions in the corrosion, due to the formation of other unstable compounds like iron and lithium oxides (LiFeO2, LiFe5O8 and others). Apart from the oxides known as the (FeCr)3O4 which form the inner layer of the protective layer and Fe2O3 as the outer layer of the metal, it is possible that LiFeO2 can form an individual layer, which in a way functions as a corrosion inhibitor. It is necessary to better understand the function of the lithium ion in this process, since it could have an application in other types of corrosive systems, thus it is necessary to incorporate practical methods such as EIS, so that it can give certain guidelines of the evolution of corrosion in systems as complex as molten salts.
4.2. Linear Polarization Resistance Results
Alternatively, electrochemical polarization tests allow us to obtain the corrosion rates in a fast way, in which the results obtained for the materials AISI 304, AISI 430, nickel-based alloy HR-224, and ferritic steel VM12 in both cases of salt mixture are shown in Table 11 and the Tafel curves shown in Figure 16 and Figure 17. A comparison between the corrosion rates of the two study salts can be seen, taking into account the open circuit potential of the electrochemical system, the corrosion potential, and the current density.

Table 11.
Corrosion data of tested 304, 430 and HR-224 in KNaNO3 (solar salt) and LiNaKNO3 (ternary salt with lithium content) at 550 °C.
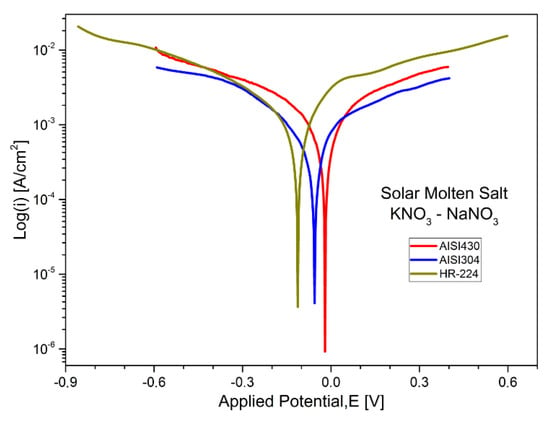
Figure 16.
Polarization curves of stainless steel AISI 304, AISI 430, and nickel-based alloy HR-224 in KNaNO3 (solar salt) at 550 °C and 100 h of exposure.
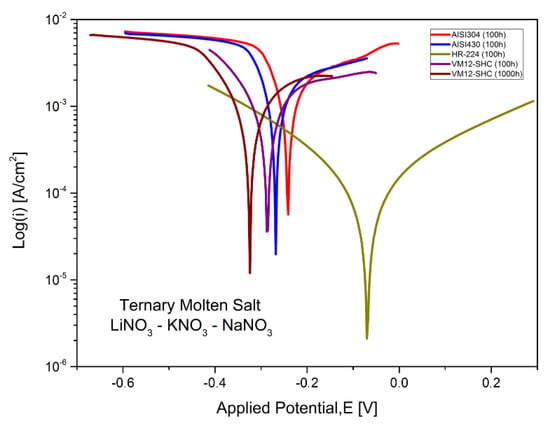
Figure 17.
Polarization curves of stainless steel AISI 304, AISI 430, nickel-based alloy HR-224 and ferritic steel VM12 in LiNaKNO3 (ternary salt with lithium content) at 550 °C and 100 and 1000 h of exposure.
The corrosion models mentioned in the article were confirmed by scanning electron microscopy SEM Inspect F50 (Scientific and Technical Instruments, Wilsonville, OR, USA). Figure 18 and Figure 19 show the surface appearance of the AISI 304 and AISI 430 material after 100 h of exposure to both solar salt and the ternary lithium mixture, as well as an energy dispersive x-ray EDX analysis of the particles found on the surfaces. The layers of oxide formed are homogeneous in the same cases. The EDX analysis of the material on the surface indicated that the composition of the oxidation layer analysed was iron oxide and chromium, and therefore the presence of a protective layer was confirmed. Figure 20 shows the surface appearance of the nickel-based HR-224 alloy after 100 h of exposure for solar salt and for the ternary lithium containing molten salt, including EDX analysis of the surface. The oxide layer found shows a totally homogeneous layer in both cases. According to the EDX analysis of HR-224, it was shown to be composed of nickel, chrome, oxygen, and iron. Finally, Figure 21 shows the surface appearance of ferritic steel VM12 immersed in lithium nitrate molten salt for 100 and 1000 h of exposure. The oxide layer for 100 h shows a more homogeneous surface with respect to the 1000 h sample, where some areas with detachment of the corrosive layer are shown, due to the longer exposure times. According to the EDX analysis it shows a composition of mainly iron, oxygen, and chromium. The SEM images have been obtained by means of backscattered electron microscopy.
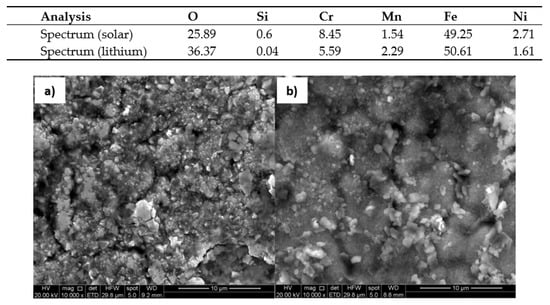
Figure 18.
Surface of AISI 304 stainless steel in (a) Solar Salt (b) LiNaKNO3, at 550 °C after 100 h.
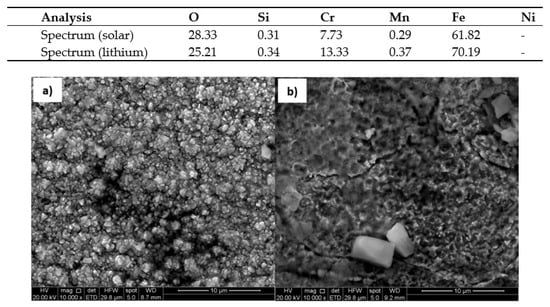
Figure 19.
Surface of 430 ferritic stainless steel in (a) Solar Salt (b) LiNaKNO3, at 550 °C after 100 h.
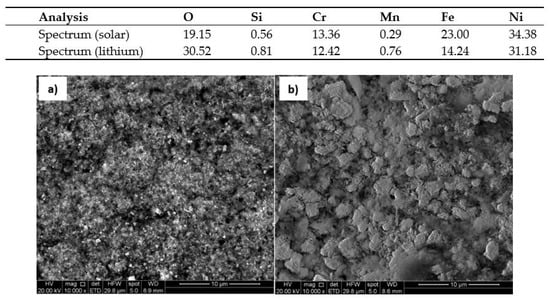
Figure 20.
Surface of HR-224 Nickel alloy in (a) Solar Salt (b) LiNaKNO3, at 550 °C after 100 h.
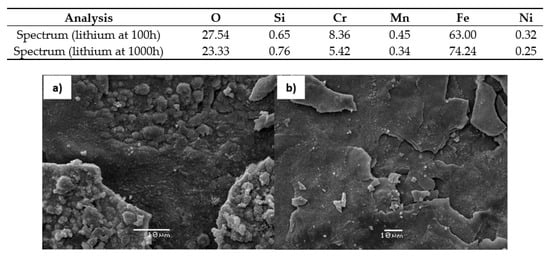
Figure 21.
Surface of VM12 stainless steel in Lithium Salt LiNaKNO3 at (a) 100 h (b) 1000 h, at 550 °C.
5. Conclusions
The corrosion process of molten nitrate salts depends on several factors, and thus the EIS technique has proven to be useful in monitoring the corrosion process in AISI 304 and AISIS 430 stainless steels, and HR-224 nickel based alloy, for both salt solar as ternary mixture. Based on these results, monitoring of the ferritic steel VM12 was also carried out in the ternary mixture, but at different immersion times. As a result, the corrosion mechanisms and their evolution in the first hours of immersion in the molten salt have been identified through adjustments to equivalent circuit models, obtaining the formation of a protective layer in all cases. Due to the composition of each analysis material, variations in their behaviours were identified in the high and low frequency spectra in the impedance curves. For the AISI 430 immersed in solar salt (KNa) NO3, it was possible to see the formation of a small semicircle at high frequency in the 96 h of immersion which is associated with the reaction of charge transfer at the layer/salt-molten interface. On the other hand, AISI 304 and AISI 430 stainless steels have a certain sustained similarity in the low frequency semicircle, due to the oxide layer already being formed.
In addition, an analysis of the corrosion mechanisms was made from the point of view of the reactions that take place at the metal/salt-molten interface, in case the the layers of the corrosion products that occur in the metal dissolve, and therefore affect the thermophysical properties of the salt mixture. Based on the models obtained from the EIS tests of the four proposed materials, they were contrasted with the reaction mechanisms and the possible compounds that would form at the metal interfaces were found. In addition, they were compared with SEM/EDX tests in a semi-quantitative way to show the corrosion surface formed.
Linear polarization resistance tests were performed for the AISI 304, AISI 430, and HR-224 materials after 100 h of exposure in the two proposed mixtures. Furthermore, for VM12 ferritic steel, only in the ternary mix containing lithium at 100 and 1000 h of exposure, all tests were performed at a temperature of 550 °C. The corrosion rates obtained showed a better performance of the materials with the ternary mixture with lithium content, compared to the solar salt, a material that is currently used as HTF in CSP plants. Furthermore, on the basis of the results obtained, the VM12 material was also analyzed. This material has good corrosion resistance properties, obtaining a corrosion rate of 0.95 mm/year after 1000 h of immersion in the ternary lithium salt.
There is still much to investigate in the corrosion process of nitrate salts for different applications of solar technology, including thermal stress and the loss of ductility in materials, for a better understanding of corrosion phenomenon and material degradation in solar thermal applications.
Author Contributions
Conceptualization, A.M. and C.P.; methodology, A.G.F. and A.M.; lab testing, A.M. and M.J.K.; software, A.M.; formal analysis, A.G.F., C.P., F.G. and A.M.; investigation, A.M. and A.G.F.; writing—original draft preparation, A.M. and A.G.F.; writing—review and editing, A.M. and A.G.F.; supervision, A.M. and A.G.F.; project administration, A.M. and A.G.F.; funding acquisition, A.M. and A.G.F. All authors have read and agreed to the published version of the manuscript.
Funding
The authors would like to acknowledge the financial support provided by CONICYT/FONDAP 15110019 “Solar Energy Research Center” SERC-Chile and FONDEQUIP EQM170111.
Acknowledgments
The authors would like to thank Vallourec company for providing samples.
Conflicts of Interest
The authors declare no conflict of interest. The funders had no role in the design of the study; in the collection, analyses, or interpretation of data; in the writing of the manuscript, or in the decision to publish the results.
References
- Abdelsalam, M.Y.; Teamah, H.M.; Lightstone, M.F.; Cotton, J.S. Hybrid thermal energy storage with phase change materials for solar domestic hot water applications: Direct versus indirect heat exchange systems. Renew. Energy 2020, 147, 77–88. [Google Scholar] [CrossRef]
- Liu, M.; Tay, N.H.S.; Bell, S.; Belusko, M.; Jacob, R.; Will, G.; Saman, W.; Bruno, F. Review on concentrating solar power plants and new developments in high temperature thermal energy storage technologies. Renew. Sustain. Energy Rev. 2016, 53, 1411–1432. [Google Scholar] [CrossRef]
- Walczak, M.; Pineda, F.; Fernández, Á.G.; Mata-Torres, C.; Escobar, R.A. Materials corrosion for thermal energy storage systems in concentrated solar power plants. Renew. Sustain. Energy Rev. 2018, 86, 22–44. [Google Scholar] [CrossRef]
- Pethurajan, V.; Suresh, S.; Mojiri, A.; Konatt, A.J. Microencapsulation of nitrate salt for solar thermal energy storage- synthesis, characterisation and heat transfer study. Sol. Energy Mater. Sol. Cells 2020, 206, 110308. [Google Scholar] [CrossRef]
- Gomez-Vidal, J.C. Corrosion resistance of MCrAlX coatings in a molten chloride for thermal storage in concentrating solar power applications. npj Mater. Degrad. 2017, 1, 7. [Google Scholar] [CrossRef]
- Fernández, A.G.; Ushak, S.; Galleguillos, H.; Pérez, F.J. Development of new molten salts with LiNO3 and Ca(NO3)2 for energy storage in CSP plants. Appl. Energy 2014, 119, 131–140. [Google Scholar] [CrossRef]
- McConohy, G.; Kruizenga, A. Molten nitrate salts at 600 and 680 °C: Thermophysical property changes and corrosion of high-temperature nickel alloys. Sol. Energy 2014, 103, 242–252. [Google Scholar] [CrossRef]
- Fernández, A.G.; Galleguillos, H.; Pérez, F.J. Corrosion Ability of a Novel Heat Transfer Fluid for Energy Storage in CSP Plants. Oxid. Met. 2014, 82, 331–345. [Google Scholar] [CrossRef]
- Henríquez, M.; Guerreiro, L.; Fernández, Á.G.; Fuentealba, E. Lithium nitrate purity influence assessment in ternary molten salts as thermal energy storage material for CSP plants. Renew. Energy 2019, 149, 940–950. [Google Scholar] [CrossRef]
- Cheng, W.-J.; Chen, D.-J.; Wang, C.-J. High-temperature corrosion of Cr–Mo steel in molten LiNO3–NaNO3–KNO3 eutectic salt for thermal energy storage. Sol. Energy Mater. Sol. Cells 2015, 132, 563–569. [Google Scholar] [CrossRef]
- Bradshaw, R.W.; Goods, S.H. Corrosion Resistance of Stainless Steels During Thermal Cycling in Alkali Nitrate. Sandia Rep. 2001, 1–39. [Google Scholar] [CrossRef]
- Ciucci, F. Modeling electrochemical impedance spectroscopy. Curr. Opin. Electrochem. 2019, 13, 132–139. [Google Scholar] [CrossRef]
- Isakhani-Zakaria, M.; Allahkaram, S.R.; Ramezani-Varzaneh, H.A. Evaluation of corrosion behaviour of Pb-Co3O4 electrodeposited coating using EIS method. Corros. Sci. 2019, 157, 472–480. [Google Scholar] [CrossRef]
- Mansfeld, F. Tafel slopes and corrosion rates obtained in the pre-Tafel region of polarization curves. Corros. Sci. 2005, 47, 3178–3186. [Google Scholar] [CrossRef]
- Kutz, M. Handbook of Environmental Degradation of Materials: Second Edition; Elsevier Inc.: Amsterdam, The Netherlands, 2012; ISBN 9781437734560. [Google Scholar]
- Encinas-Sánchez, V.; de Miguel, M.T.; Lasanta, M.I.; García-Martín, G.; Pérez, F.J. Electrochemical impedance spectroscopy (EIS): An efficient technique for monitoring corrosion processes in molten salt environments in CSP applications. Sol. Energy Mater. Sol. Cells 2019, 191, 157–163. [Google Scholar] [CrossRef]
- Gomez-Vidal, J.C.; Fernandez, A.G.; Tirawat, R.; Turchi, C.; Huddleston, W. Corrosion resistance of alumina forming alloys against molten chlorides for energy production. II: Electrochemical impedance spectroscopy under thermal cycling conditions. Sol. Energy Mater. Sol. Cells 2017, 166, 234–245. [Google Scholar] [CrossRef]
- Pérez, F.J.; Hierro, M.P.; Nieto, J. Waste incineration corrosion processes: Oxidation mechanisms by electrochemical impedance spectroscopy. Mater. Corros. 2008, 59, 566–572. [Google Scholar] [CrossRef]
- Chaoliu, Z.; Pingyi, G.; Weitao, W. Electrochemical impedance of two-phase Ni-Ti alloys during corrosion in eutectic (0.62Li, 0.38K)2CO3 at 650 °C. Electrochim. Acta 2004, 49, 2271–2277. [Google Scholar] [CrossRef]
- Zeng, C.L.; Li, J. Electrochemical impedance studies of molten (0.9Na,0.1K)2SO4-induced hot corrosion of the Ni-based superalloy M38G at 900 °C in air. Electrochim. Acta 2005, 50, 5533–5538. [Google Scholar] [CrossRef]
- Zeng, C.L.; Wang, W.; Wu, W.T. Electrochemical impedance models for molten salt corrosion. Corros. Sci. 2001, 43, 787–801. [Google Scholar] [CrossRef]
- Zeng, C.L.; Zhang, T. Electrochemical impedance study of corrosion of B-1900 alloy in the presence of a solid Na2SO4 and a liquid 25 wt.% NaCl-75 wt.% Na2SO4 film at 800 °C in air. Electrochim. Acta 2004, 49, 1429–1433. [Google Scholar]
- Bell, S.; Steinberg, T.; Will, G. Corrosion mechanisms in molten salt thermal energy storage for concentrating solar power. Renew. Sustain. Energy Rev. 2019, 114, 109–328. [Google Scholar] [CrossRef]
- Fernández, A.G.; Pérez, F.J. Improvement of the corrosion properties in ternary molten nitrate salts for direct energy storage in CSP plants. Sol. Energy 2016, 134, 468–478. [Google Scholar] [CrossRef]
- Fernández, A.G.; Cortes, M.; Fuentealba, E.; Pérez, F.J. Corrosion properties of a ternary nitrate/nitrite molten salt inconcentrated solar technology. Renew. Energy 2015, 80, 177–183. [Google Scholar] [CrossRef]
- Gabrel, J.; Bendick, W.; Vandenberghe, B.; Lefebvre, B. Status of development of VM 12 steel for tubular applications in advanced power plants. Energy Mater. 2006, 1, 218–222. [Google Scholar] [CrossRef]
- Golański, G.; Zieliński, A.; Słania, J.; Jasak, J. Mechanical properties of VM12 steel after 30,000 hrs of ageing at 600 °C temperature. Arch. Metall. Mater. 2014, 59, 1351–1354. [Google Scholar] [CrossRef]
- Abang, R.; Weiß, S.; Krautz, H.J. Impact of increased power plant cycling on the oxidation and corrosion of coal-fired superheater materials. Fuel 2018, 220, 521–534. [Google Scholar] [CrossRef]
- Fähsing, D.; Oskay, C.; Meißner, T.M.; Galetz, M.C. Corrosion testing of diffusion-coated steel in molten salt for concentrated solar power tower systems. Surf. Coatings Technol. 2018, 354, 46–55. [Google Scholar] [CrossRef]
© 2020 by the authors. Licensee MDPI, Basel, Switzerland. This article is an open access article distributed under the terms and conditions of the Creative Commons Attribution (CC BY) license (http://creativecommons.org/licenses/by/4.0/).